Article

Variation of Fe, Al, and F Substitution in Titanite (Sphene)

1
Department of Geological Sciences, Brigham Young University, Provo, UT 84604, USA
2
Mojave Water Agency, 13846 Conference Center Drive, Apple Valley, CA 92307, USA
*
Author to whom correspondence should be addressed.
Submission received: 15 April 2022 / Revised: 19 May 2022 / Accepted: 26 May 2022 / Published: 28 May 2022
(This article belongs to the Section Geochemistry)

Abstract

:
Titanite is an important mineral in petrochronology studies. Understanding chemical signatures of titanite from different environments can provide significant data in unraveling the complex histories recorded in their textures and compositions. Using a database of over 8500 titanite analyses from both the literature (3829) and our own data (4900), we found that the ratio of Fe/Al is useful for separating igneous titanite (Fe/Al is typically close to 1:1 and almost always > 1:2) from metamorphic titanite (Fe/Al ratio is < 1:2) with few exceptions. Volcanic titanite grains can also be separated from plutonic titanite grains due to their shorter crystallization histories with compositions clustered more tightly in terms of Fe, Al, and F. Compositions of titanite from plutonic rocks often have later metamorphic or hydrothermal overgrowths that are not found on volcanic titanite. Fe/Al ratios in titanite from silica-undersaturated volcanic and plutonic rocks are typically > 1:2 and include titanite with the highest Fe/Al ratios. Although they overlap the field for normal igneous titanite, other elements (particularly high levels of Nb and low levels of Y) allow them to be separated. In most metamorphic rocks, the Fe/Al ratio is < 1:2 except for a few metamorphic titanite grains that formed in mafic rocks. Titanite from ultrahigh pressure metamorphic rocks (eclogite facies) tend to have the lowest Fe/Al ratios, typically < 1:8. Titanite from hydrothermal and pegmatitic environments scatter widely in terms of Fe/Al even within single grains due to crystallization from fluids with highly variable compositions. Charge balancing in metamorphic, hydrothermal, and pegmatitic titanite due to Fe+3 and Al+3 substitution into the Ti+4 site is largely accomplished by the coupled substitution of F for O−2. However, in volcanic and plutonic titanite, the charge imbalance due to Fe+3 and Al+3 substitution appears to be mainly coupled with REE+3 or Y+3 substitution into the Ca+2 site with a lesser contribution from F.

1. Introduction

Titanite (CaTiSiO4[O,OH,F]) has been reported as an accessory mineral in rocks from plutonic, volcanic, metamorphic, and hydrothermal environments [1,2,3,4,5,6,7,8]. The mineral was first discovered and named titanite by German scientist Martin Heinrich Klaproth in 1795 around the same time that he discovered and named the element titanium [9,10,11]. Since that time, several names have been applied to this mineral and its varieties, including titanite (originally used for dark brown to black varieties), sphene (used for light shades of the mineral), ligurite (an apple-green variety), spinthere or semeline (applied to some greenish varieties), lederite (brown, opaque to semitranslucent varieties), manganesian or greenovite (used for red or rose-colored varieties), grothite (distinct composition and cleavage, high Fe, Al, F), as well as alshedite, aspedelite, eucolite-titanite, menacanite, pictite, and yttrotitanite [1,11,12,13,14,15]. A complete solid solution exists under some pressure and temperature conditions between titanite and the Sn end member, called malayaite [16,17,18,19]. The name titanite was settled upon as the official name of the mineral [20] and will be used in this paper to refer to all the different varieties.
Titanite is known to crystallize and react over a wide range of environmental conditions allowing grains to record multiple stages of growth, dissolution, regrowth, and recrystallization [2,21,22,23,24,25,26,27,28,29]. The reactivity of titanite produces variable compositions that have been shown to correlate with the environment of its formation [1,24,30,31,32,33,34,35,36,37,38,39,40,41,42,43].
Fe, Al, and F are typically the most abundant elements that substitute into the titanite structure and are reported in most published analyses. In this paper, we reported on compositional trends in titanite, with emphasis on Fe, Al, and F. The entire titanite database used in this study may be accessed as a Supplemental File associated with this publication.

2. Methods

Data (Supplementary Tables S1 and S2) were collected from the literature sources (3829 analyses) and supplemented with our own analyses (4900 analyses). Where particular data sets are highlighted in figures in the text, we have indicated the sources of these analyses in the figure caption or on the figure. No source is listed when we are using the entire database or when the data come from our own analyses. Analyses compiled from the literature do not, as might be expected, always include the same elements. Ca, Ti, Si, Al, Fe, and F were typically analyzed, but beyond those, the variability in elements analyzed is wide. Some caution should, therefore, be used when comparing total REEs between samples, for example. Plots of the data for individual elements have not included samples where no value for an element was reported or where the value was reported as below detection limits.
Our new analyses of titanite were made on a Cameca SX-50 electron microprobe at either the University of Utah or Brigham Young University. Data were collected on both mineral separates and thin sections at 15 kV and 20–30 nA using a spot size of 5–10 µm. Counting times were typically 10–20 s for major elements and 20–40 s for REE and minor elements. The data were reduced using a modified ZAF technique. Elements analyzed on each crystal were TAP—Si, Al, Y, Mg, Zr; LiF—Fe, La, Ce, Nd, Sm, Ta; PCO—Na, F; and PET—Ca, Ti, Mn, Nb. The following standards were used: LaPO4, CePO4, NdPO4, SmPO4, (REE standards from Smithsonian [44]), Woll (Ca, Si), Mag (Fe), Anorth (Al), MgO (Mg), Jad (Na), Taylor sphene (Ti), Spess (Mn), Yag (Y), Li2Nb2O6, Li2Ta2O6 (Nb, Ta), and Taylor zircon (Zr). Standardization was checked by analyzing Taylor sphene as well as an inhouse standard titanite from an Ontario, Canada alaskite (Supplementary Table S3). The calculated atoms per formula unit was based on three total cations.
Back-scattered electron (BSE) images were acquired with an ESEM FEI XL30 at Brigham Young University using an accelerating voltage of 15 kV and current of 3.2–6.4 nA with an image size of approximately 3000 × 2000 pixels.

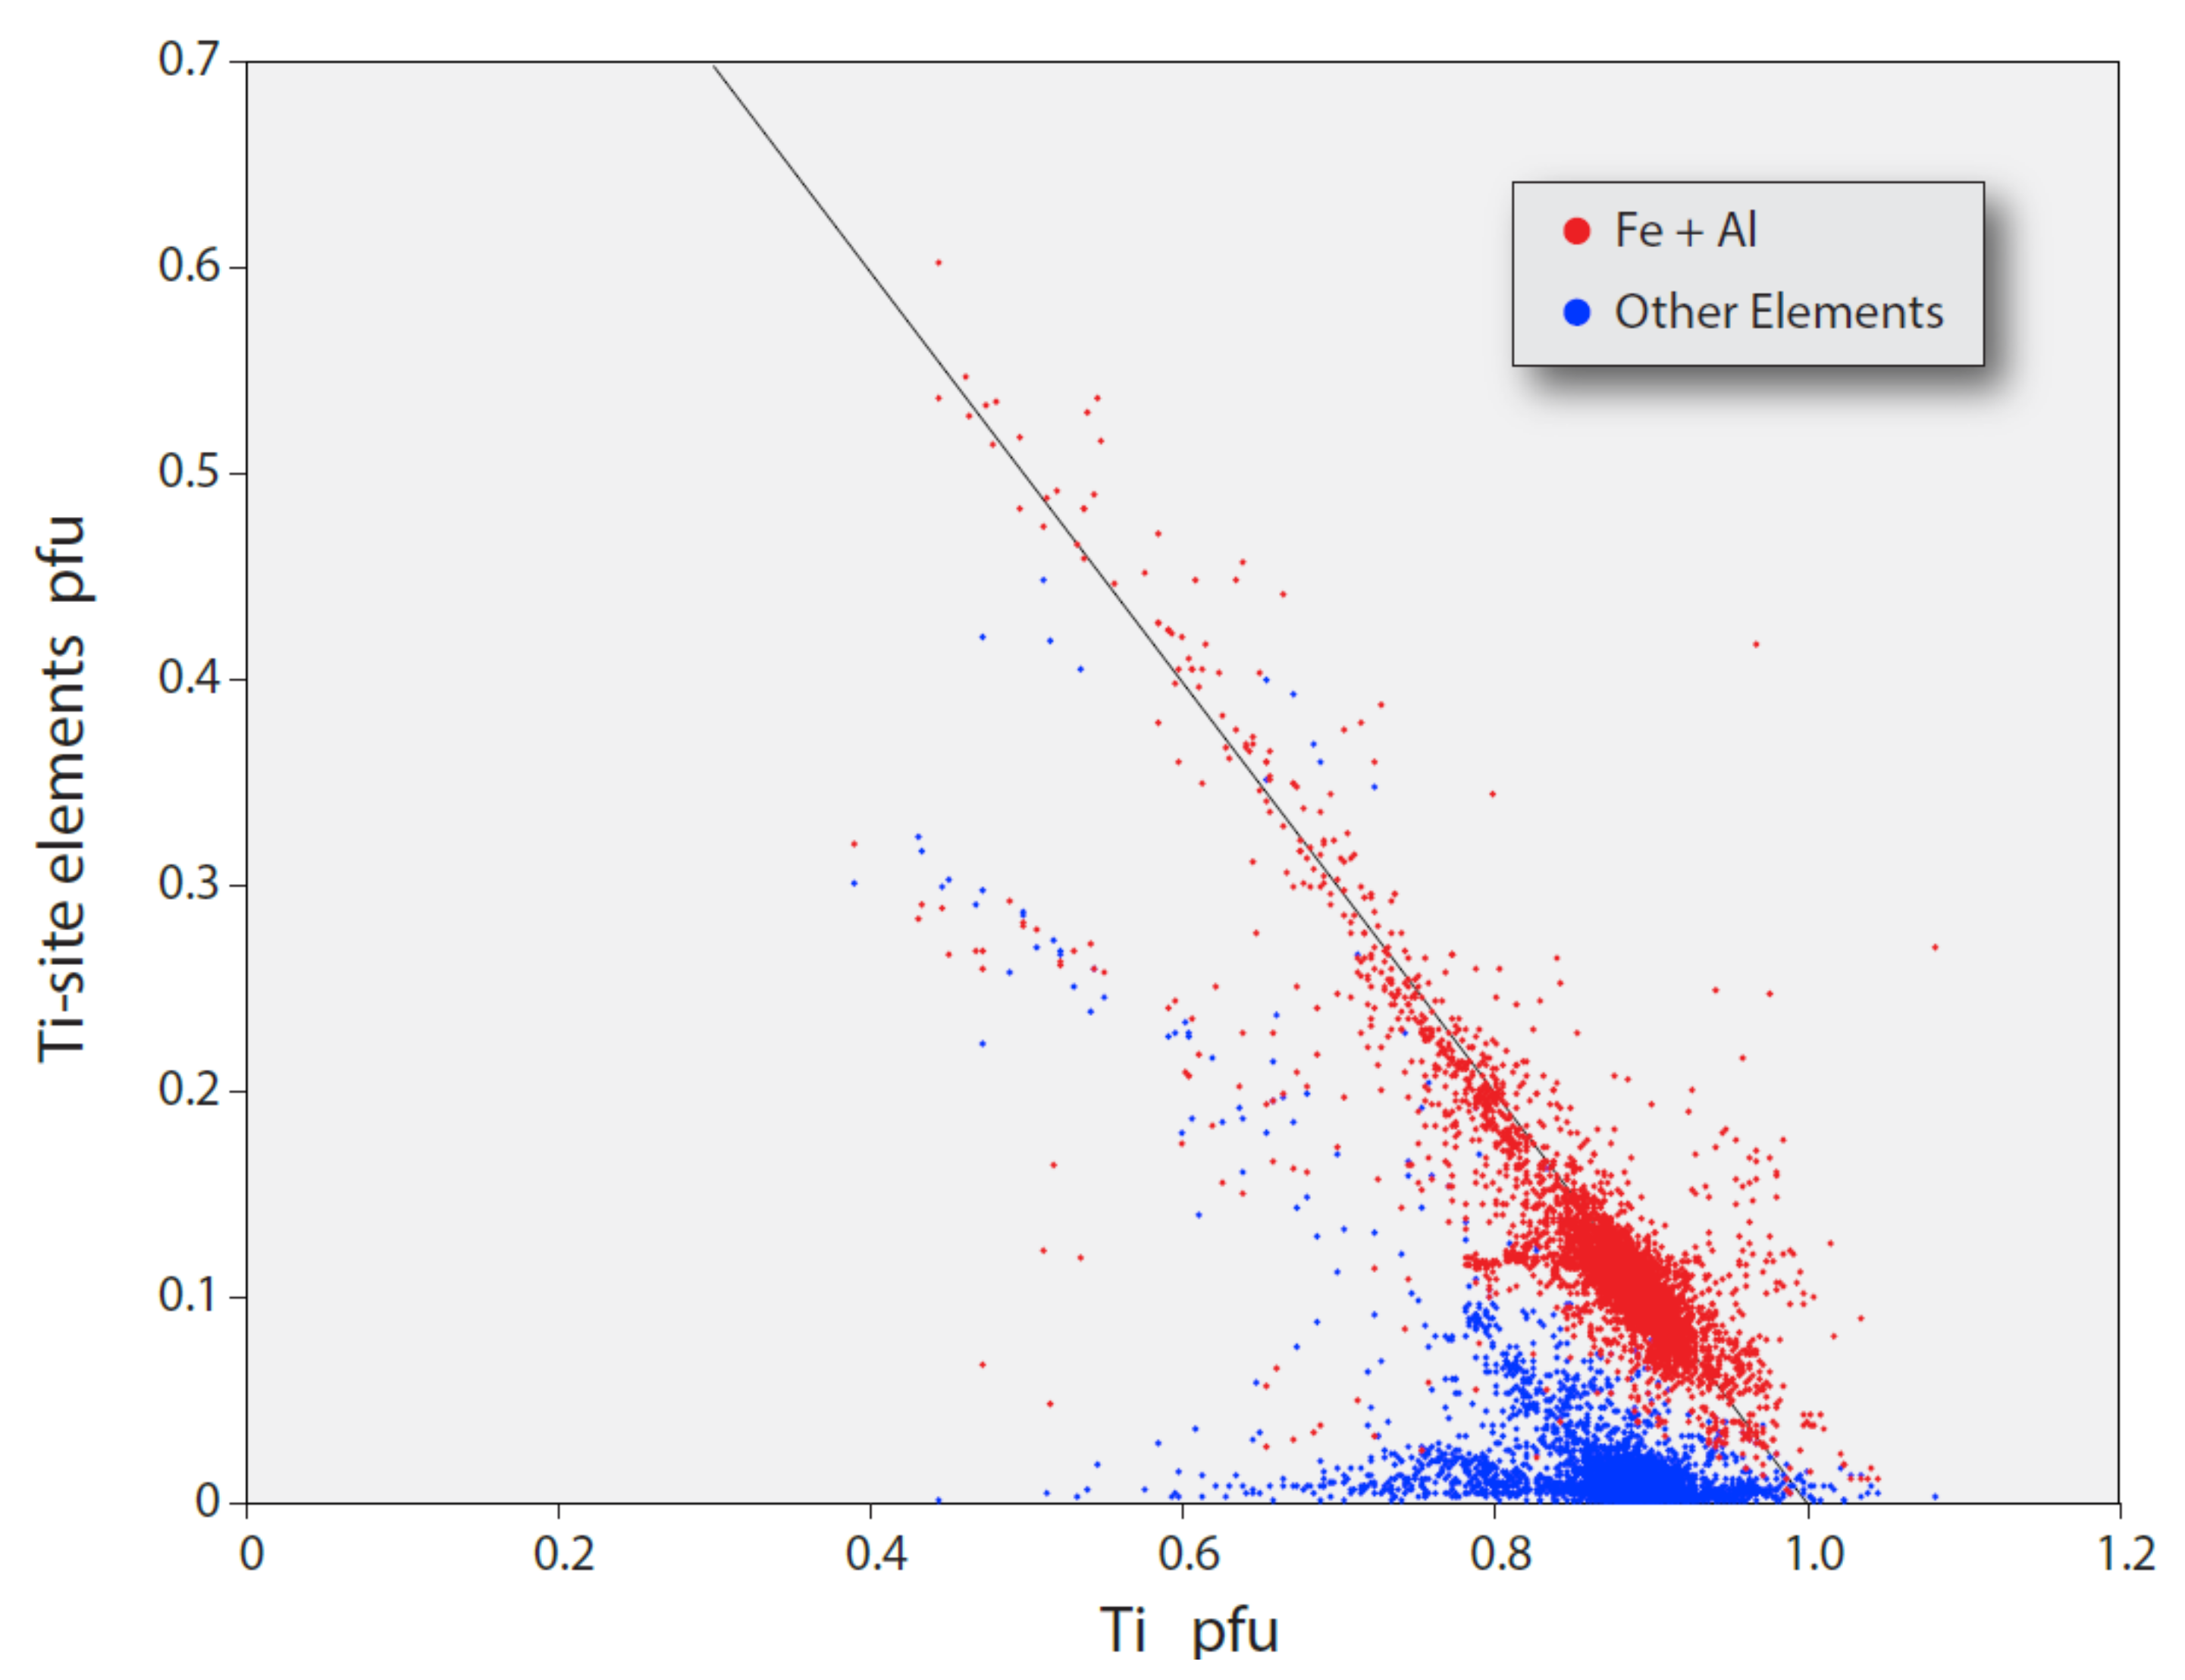
3. Substitutions into Ti-Site of Titanite

Ti occurs in titanite in octahedral coordination and is commonly substituted for by Fe, Al, Nb, Ta, Mg, Zr, Sn, and to a lesser extent by V, Cr, U, and Th [1,45,46]. In some titanite, the percentage of this site being occupied by elements other than Ti can be quite high, up to 30–65% (Figure 1; see the following reports for examples [31,47,48,49,50,51,52,53,54,55,56,57,58,59,60,61,62,63,64,65,66,67,68,69]). The most common substitution is that of trivalent Fe and Al into the site dominated by quadrivalent Ti. This leaves a charge imbalance that is mostly accommodated by a coupled substitution of F or OH for the one oxygen (called O1) that is underbonded compared to other oxygens in the structure [2,4,39,70,71,72,73,74,75]. Other significant substitutions are also known and play a role in the overall charge balancing [4].
Figure 2 shows the variability of Ti versus other Ti-site elements in titanite from different environments where titanite occurs. In volcanic rocks, about 5–18% of the site may be occupied by other elements. Volcanic rocks, however, show the tightest grouping of substitute elements into this site. In plutonic rocks, the typical levels of substitutions range between about 5 and 27%, while in some unusual granites and in metamorphic rocks, pegmatites, and hydrothermal deposits up to about 65% of the Ti site may be occupied by other elements.
Analyses that fall off the main substitution trend in Figure 2 are all from somewhat unusual titanite. In the plutonic rock data, a group of outliers with overfilled Ti sites are from peralkaline A-type granites from China and have very high Al values (up to 0.35 apfu) [69]. A second group is from a porphyry-Cu deposit in China [43] and Precambrian granitoids in South Africa [76]. In these titanite grains, the Si site is underfilled with only enough Si to account for 85–90% of the atoms needed for that site. This suggests that some element that we have assigned to the Ti site has instead substituted into the Si site—perhaps Al.
Titanite from nepheline syenites associated with lujavrites from China [77] has elevated Ti—2–4% more TiO2 than any other titanite in the silica undersaturated category (Figure 2). Several groups of hydrothermal titanite also have overfilled Ti sites. First, titanite from veins in the Sullivan Pb-Zn-Ag deposit in British Columbia, Canada [78] has high Fe + Al (0.25 to 0.54 apfu) and is overfilled in the Ti site similar to high Fe + Al titanite from other environments (Figure 2). Second, titanite from veins in nepheline syenites of the Kola Peninsula [63] does not have high Fe + Al but has high Nb (0.20 to 0.36 apfu) and Zr (0.05 to 0.15 apfu). Third, other analyses with overfilled Ti sites come from the A-type Skye granite [55] that has titanite (possibly secondary) with extreme compositions (Fe up to 0.5 atoms per formula unit (apfu) as well as over 0.7 apfu of REEs) and from skarns in the Czech Republic [51,61] where titanite again has high Nb (up to 0.24 apfu) like the titanite from the Kola peninsula.
In all these cases across all environments, titanite with an overfilled Ti site appears to have high values of some element assigned normally to the site. This suggests that in these extreme conditions some element is instead substituting into the Si site, which is usually underfilled. This hypothesis warrants further study to determine if this is indeed the case.

4. Trends with Iron, Aluminum, and Fluorine
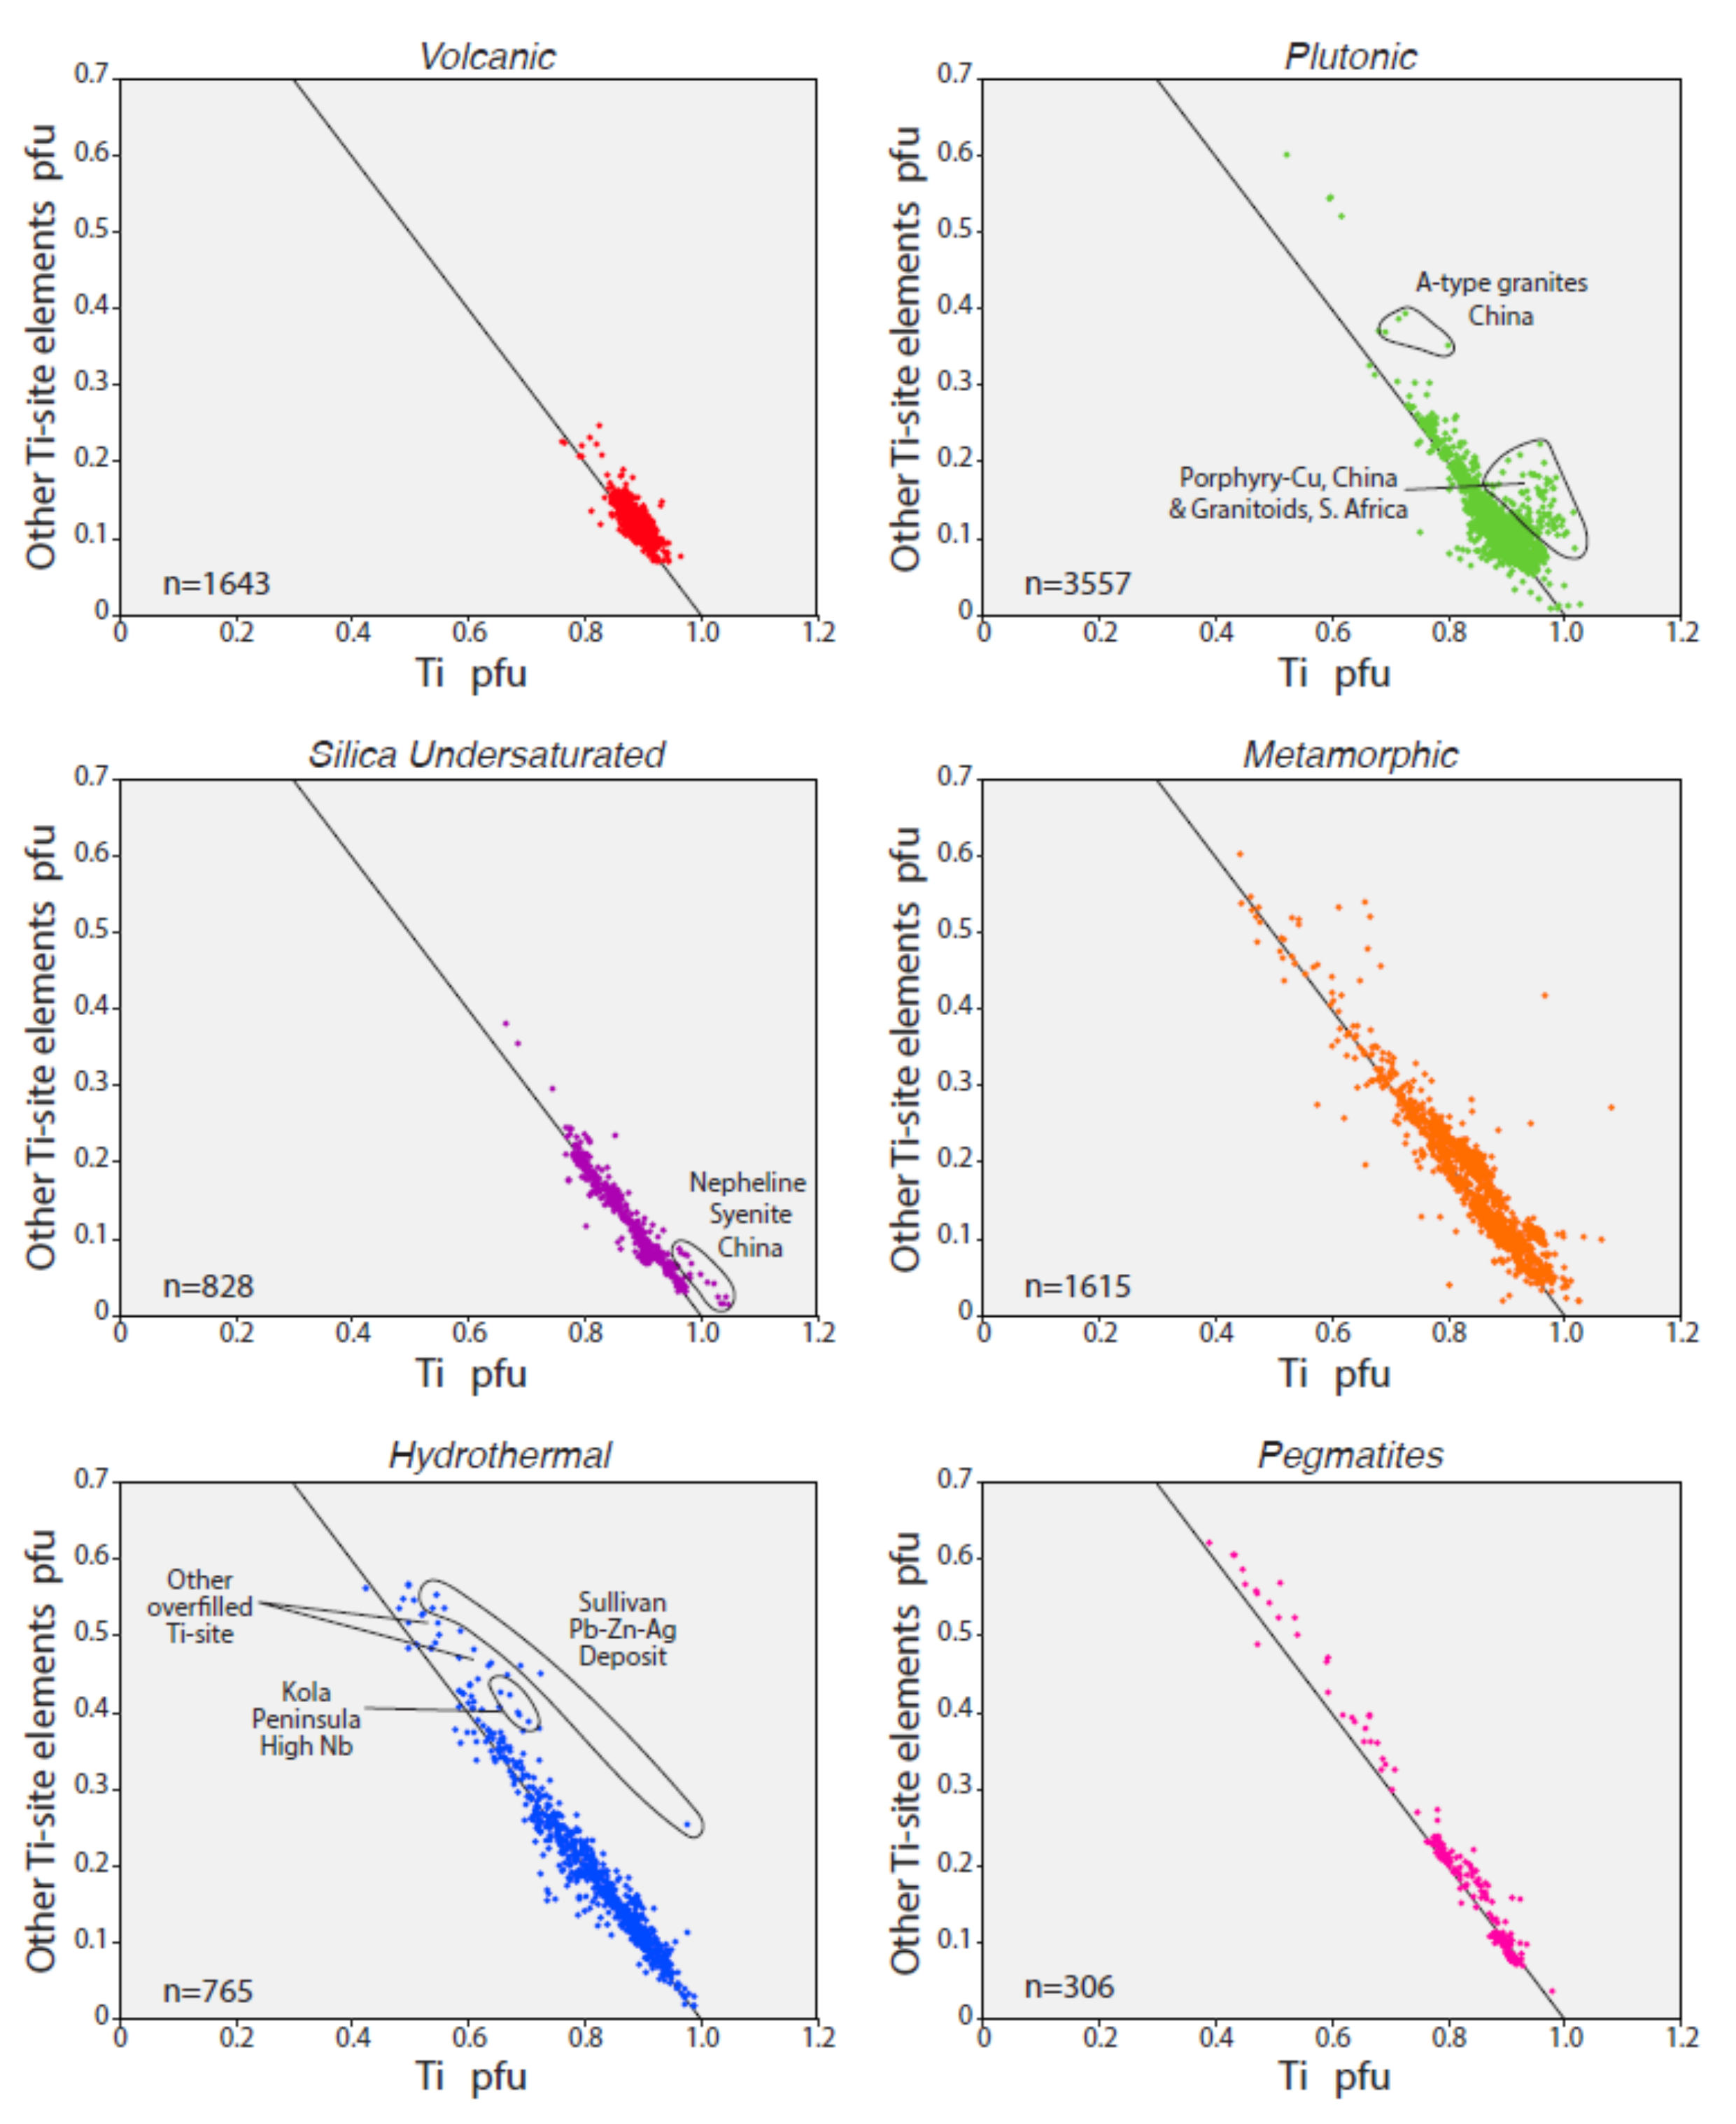
Nakada [39], using a more limited data set than the one presented here, observed that volcanic rocks typically have Fe/Al ratios of approximately 1:1, plutonic rocks a ratio of 1:2–1:1, metamorphic rocks less than 1:2, and that Fe typically increases as Al increases. These, as well as other trends, were examined using our expanded data set. We separated the titanite analyses into the following categories (Figure 3):
(1)
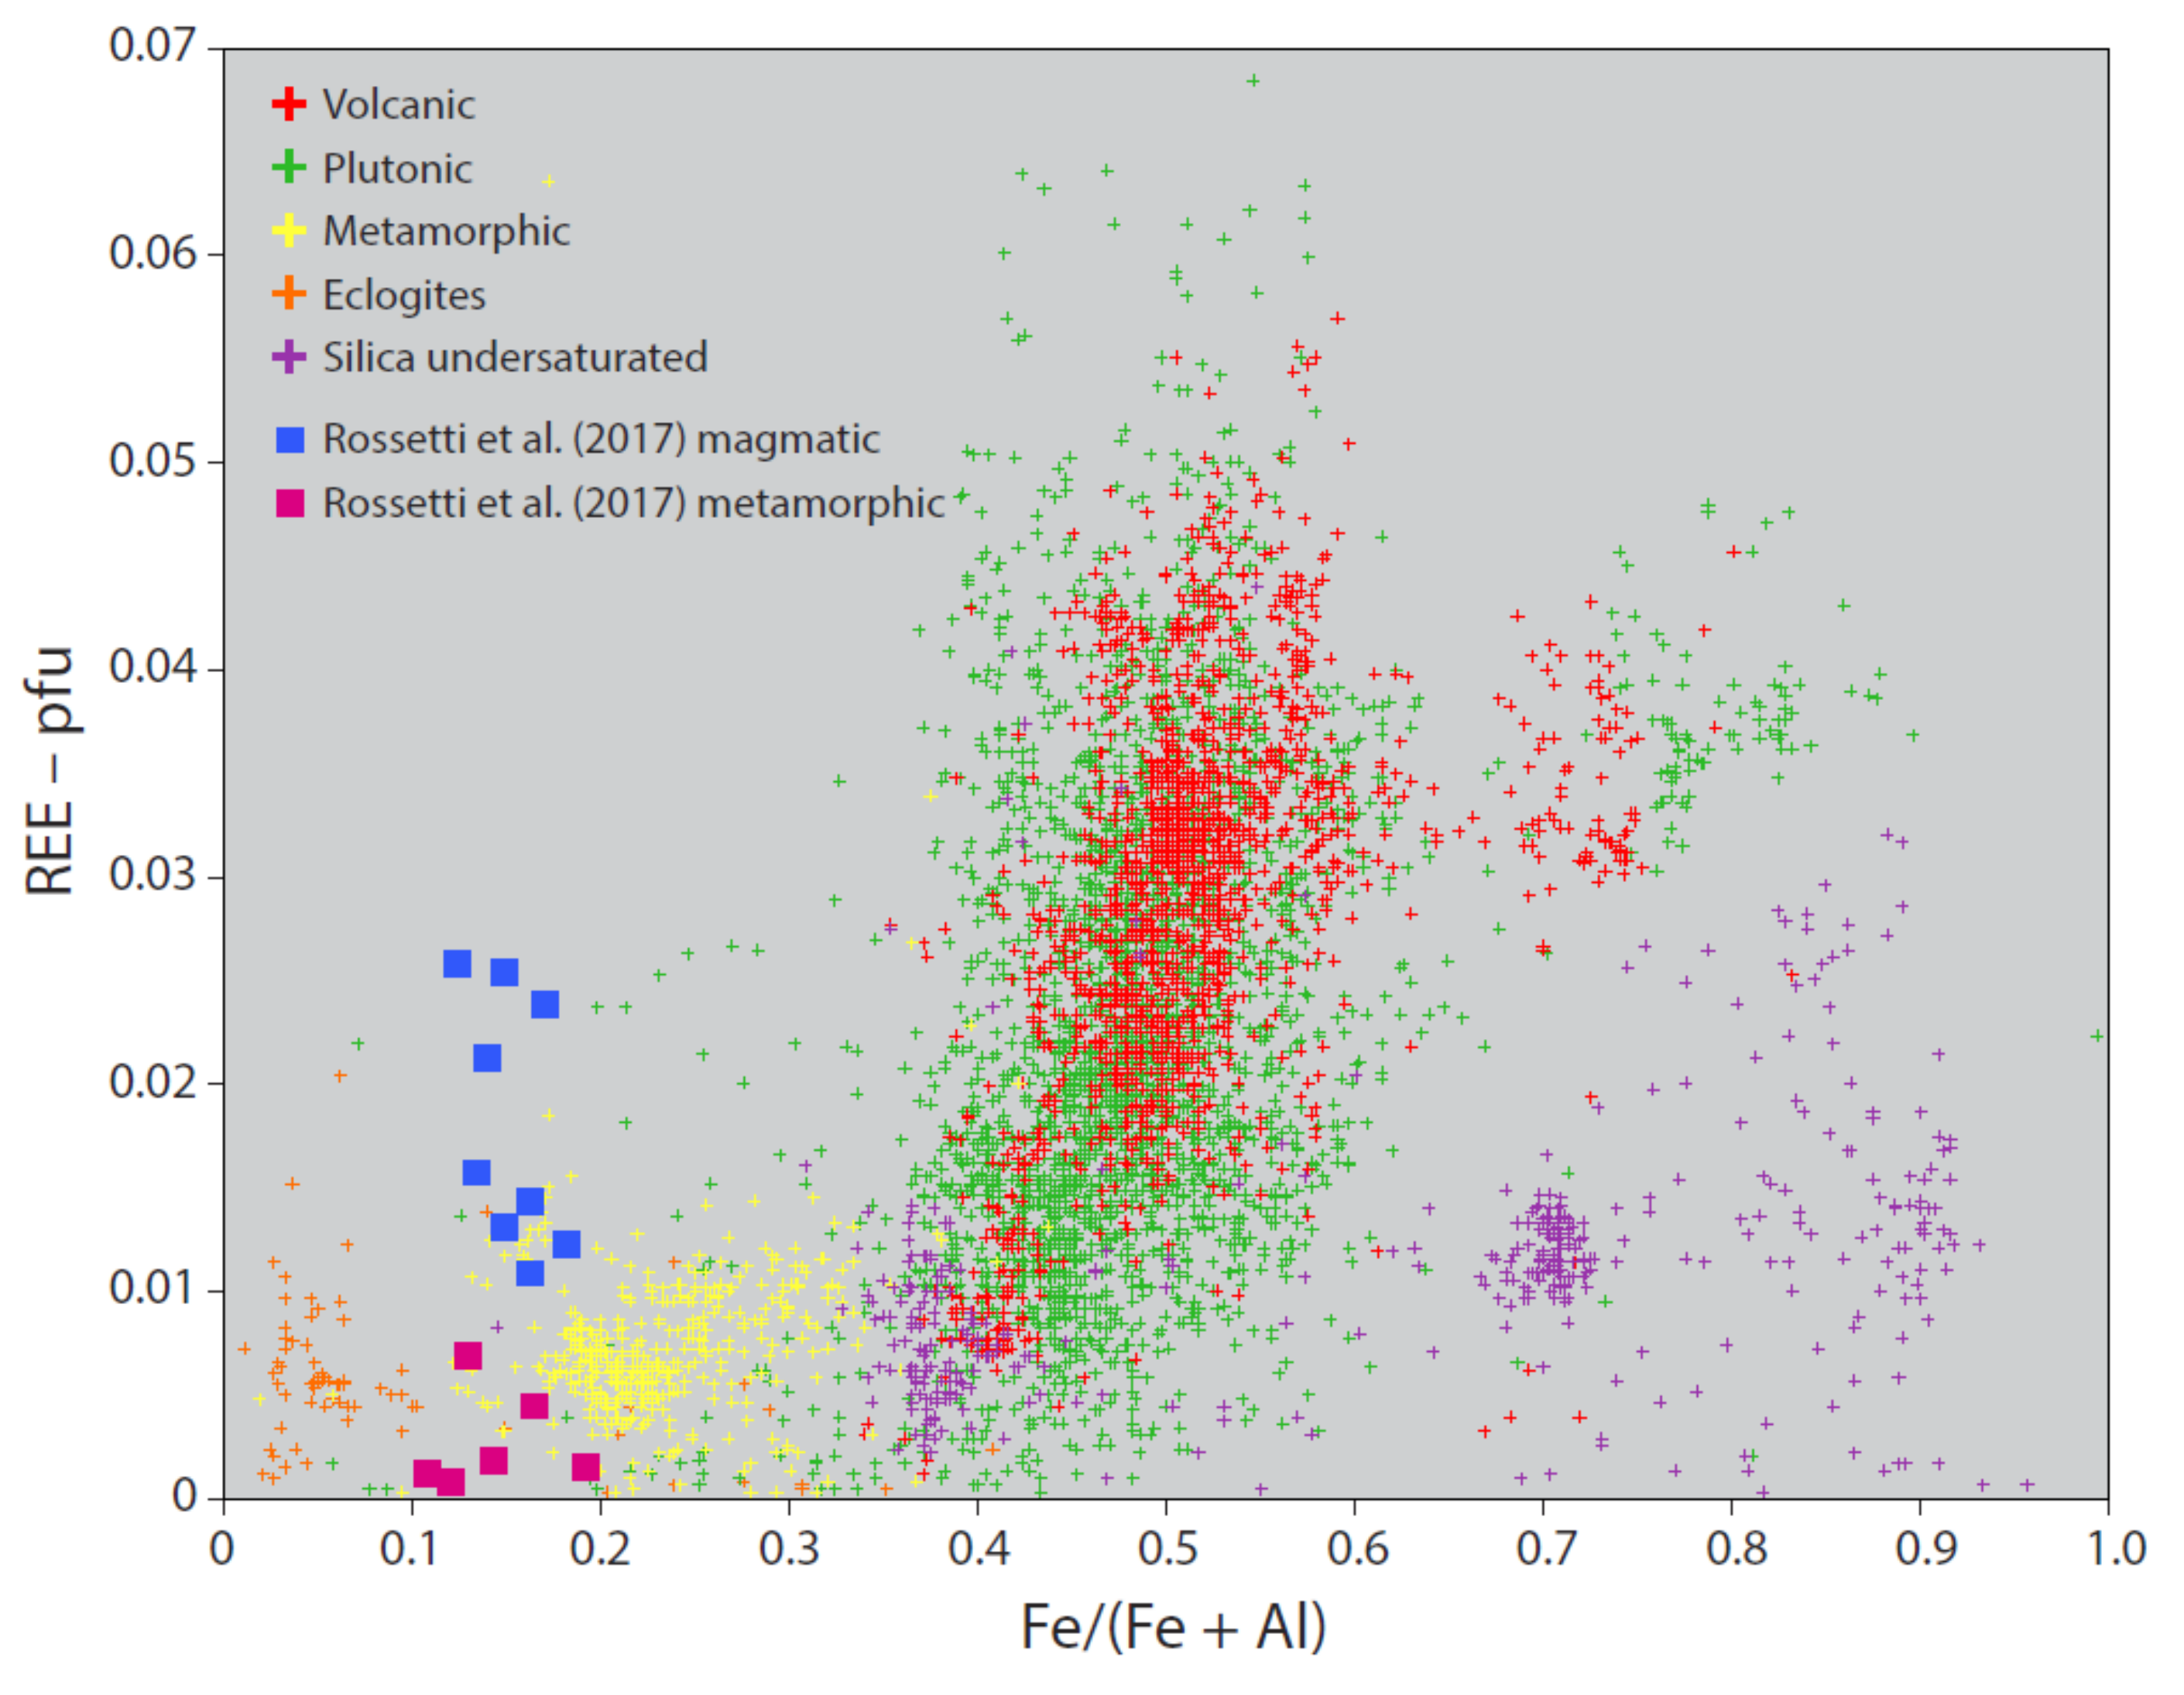
Volcanic: including titanite from all types of volcanic rocks except those from silica-undersaturated rocks.
(2)
Plutonic: including titanite from all types of plutonic rocks except pegmatites and silica-undersaturated rocks.
(3)
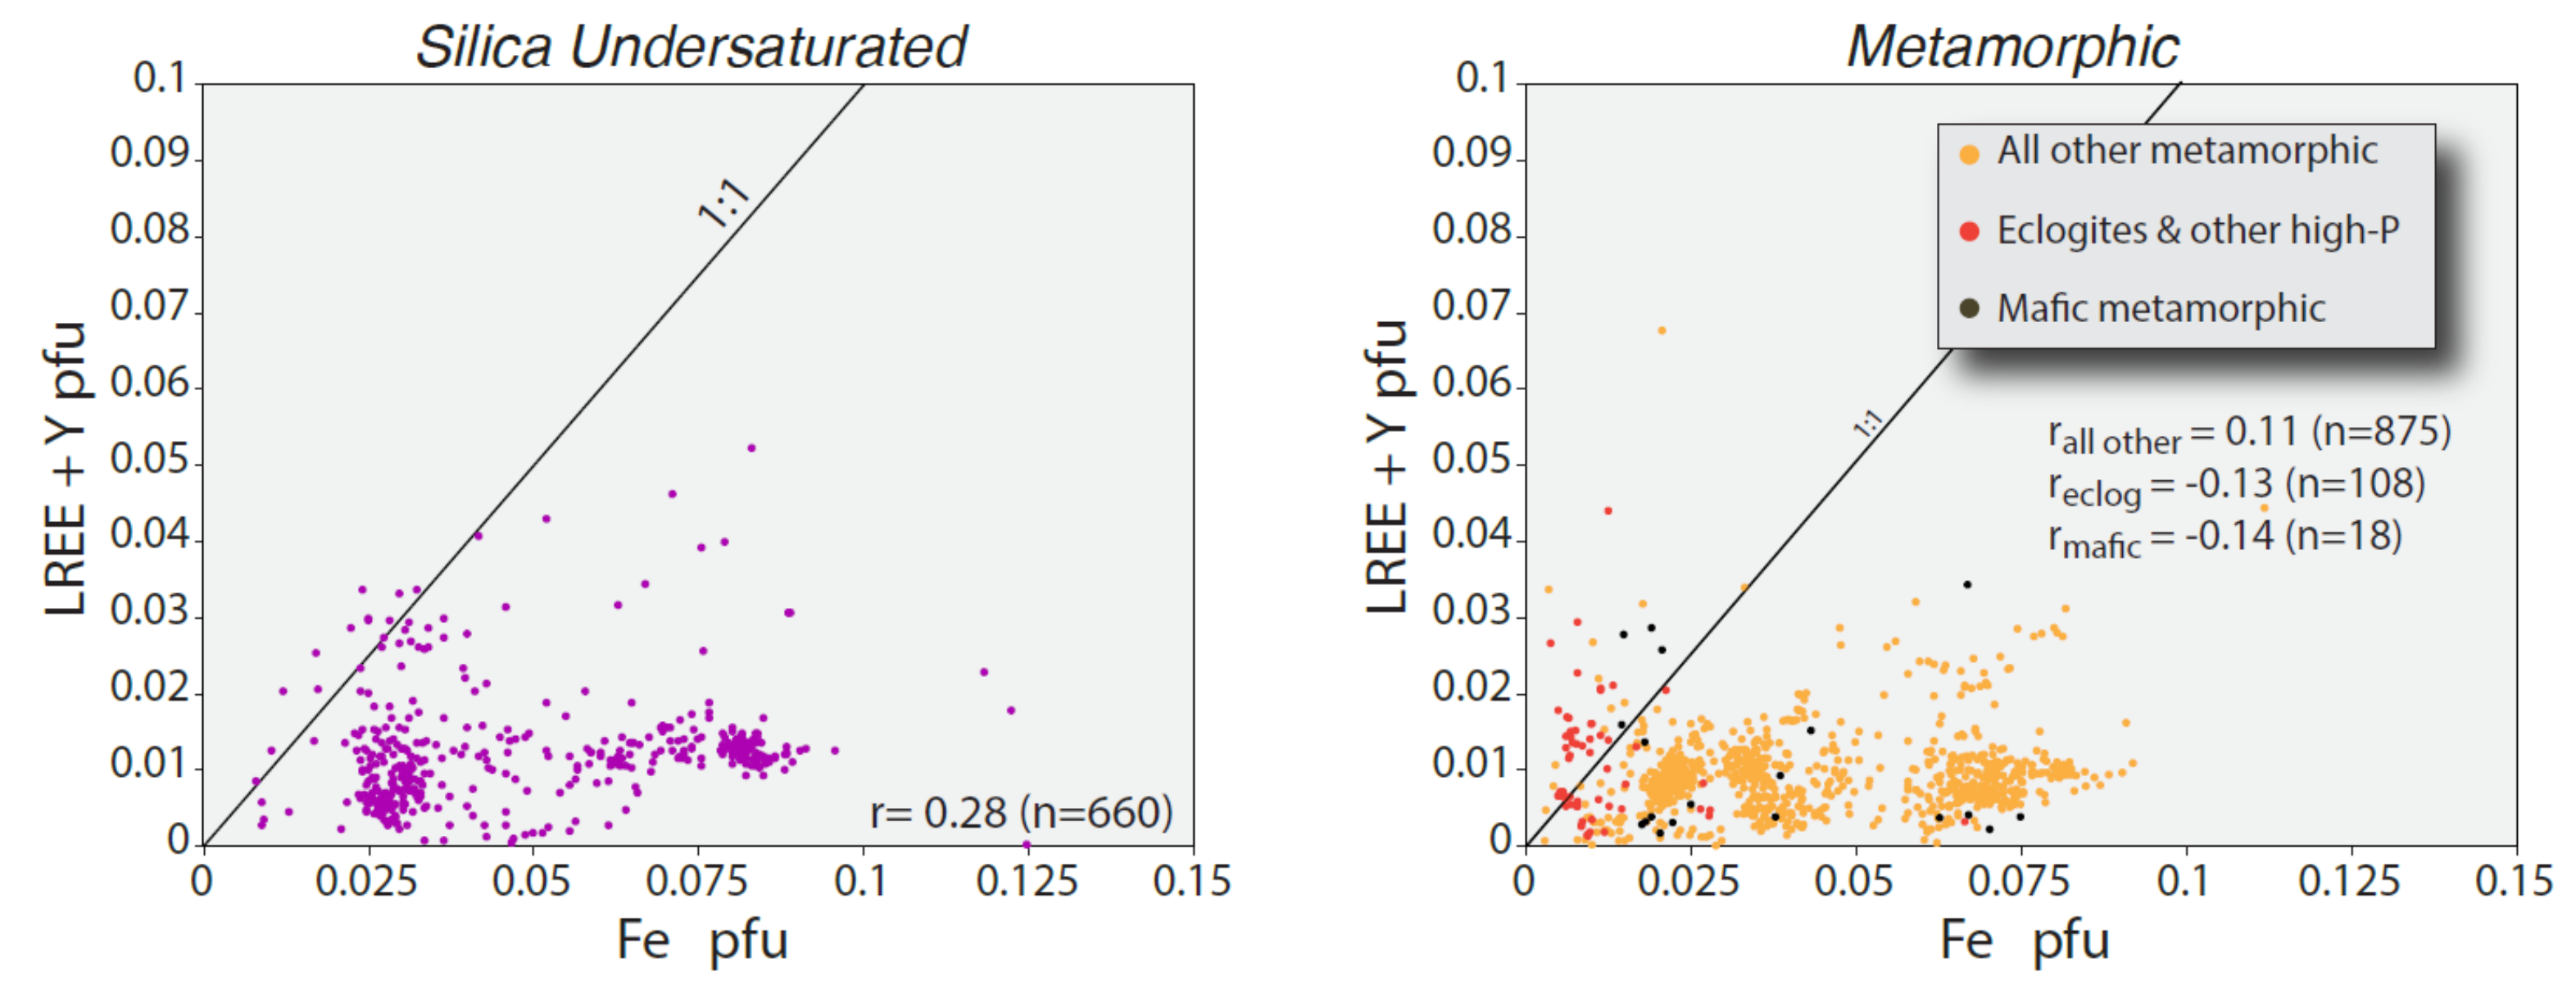
Silica-undersaturated igneous titanite: including titanite from both volcanic and plutonic rock types.
(4)
Metamorphic: including titanite from all types of metamorphic rocks except those from skarns and other metasomatic and hydrothermal environments.
(5)
Hydrothermal: including titanite formed in skarns and other water-rich environments (like many ore deposits), and sometimes occurring as overgrowths on plutonic or metamorphic titanite.
(6)
Pegmatitic.
Our compilation of data broadly confirmed the observations of Nakada [39,79] for metamorphic versus igneous titanite with some exceptions, but we did not see a significant difference in the Fe/Al ratio between volcanic and plutonic titanite (Figure 3).
Volcanic titanite: Titanite has been described as uncommon or less common in volcanic than in plutonic rocks [1,2,39,80,81]. However, titanite has been found to be quite common in some volcanic suites [82,83,84,85]. Previous studies on volcanic titanite focused on rare earth elements (REE), which partition strongly into accessory minerals such as titanite [80,82,86,87,88,89,90]. These studies did not examine Fe and Al trends in any detail. We found that in titanite from volcanic rocks the Fe/Al ratio is > 1:2 and the vast majority of samples plot near the 1:1 line. A few data points plot at values > 2:1. These high-Fe analyses are from titanite from three samples: a Cenozoic andesite lava flow from the Basin and Range (new BYU data) and two Late Jurassic tuffs from the Morrison Formation of the Colorado Plateau [83]. We found no volcanic titanite with Fe/Al ratios < 1:2 (Figure 3).
Although volcanic titanite clusters in a limited range on the Fe versus Al plot when all analyses from the database are combined (Figure 3), analyses from individual volcanic units form even tighter clusters (Figure 4) and typically show a positive correlation between Fe and Al. The clustering of data may be useful as an additional tool in helping to “fingerprint” and correlate volcanic ash beds and tuffs. For example, in titanite from two samples of silicic fallout tuff in the Jurassic Morrison Formation, one from northeastern Utah (DQW-21) and one from central Utah (LCM-12), Fe/Al ratios were unusually high (>2:1) (Figure 4). Based on this and other mineralogical similarities, as well as stratigraphic position, Christiansen et al. [83] proposed that the two are likely correlative and from the same ash bed.
Variations in Fe and Al within grains tend to be small in most volcanic titanite. Figure 5 shows data for three grains from the Cenozoic Lund Tuff of western Utah. There was a positive correlation between Fe and Al within each grain’s group of analyses. Because of this correlation, the ratio of Fe to Al remains almost constant across a grain. Fluorine and REE, however, are quite variable. Dark zones (poor in REE) in the backscattered electron (BSE) image have high F contents, while light zones (enriched in REE) have low F concentrations (Figure 6). Apparently in this case, F for O−2 exchange was driven by charge balancing REE+3 substituting for Ca+2.
Titanite grains from pyroclastic rocks are often broken with some preserved crystal edges (Figure 6 and Figure 7). Internally, they can have quite complex zoning (Figure 7A) or simple zoning (Figure 7B).
Plutonic titanite: Titanite from plutonic rocks plots in the same general area as volcanic titanite with most of the data having Fe/Al ratios > 1:2 (Figure 3). Among all the plutonic samples we examined, only a few suites of titanite analyses plotted consistently at Fe/Al ratios > 2:1. One group is from the Middle Jurassic Juniper Flats syenite (Figure 3), an A-type alkaline intrusion in the San Bernardino Mountains of southern California [92]. The low Al is the most distinctive feature. It is likely that the low Al content reflects a low aAl2O3 in this nearly peralkaline sample (it has 850 ppm Zr, as well as low CaO and MgO coupled with high alkalies). Titanite from other A-type peralkaline intrusive and volcanic rocks has similar high Fe/Al ratios [69,77,93,94,95,96,97,98,99,100,101] (Figure 8). Two titanite data sets not shown on Figure 8, which also have Fe/Al ratios > 2:1, are from a kersantite lamprophyre in the Frankenwald, Germany [102], which has about 0.28 Fe apfu compared to typical plutonic titanite which usually has > 0.1 apfu, and data from the Skye Granite, Scotland [55], which is likely secondary titanite, with Fe content of about 0.45 apfu, the highest iron content of any titanite in our database. These two data sets (seven analyses total) are not included on Figure 3 and Figure 8 because they would extend the Fe axis by another 150% and compress the relationships in the rest of the diagram.
When compared to volcanic titanite, there is more scatter in the plutonic data set, particularly to lower Fe/Al values. This scatter to lower ratios may be due in part to overgrowths on or recrystallization of plutonic titanite by metamorphic or hydrothermal processes. There is also the possibility that some titanite of hydrothermal or metamorphic origin has been misclassified as plutonic. We identified plutonic titanite in our own data and in some published reports where it was clear that later metamorphic or hydrothermal titanite had grown around earlier formed magmatic grains. This appears to be particularly common in skarns and ore deposits with their associated plutons [31,35,57,103,104,105], and is likely also quite common in other plutons not directly associated with ore deposits. A few examples are discussed in more detail here.
Plutonic Example 1: Titanite grains from a small pluton associated with copper skarn deposits in the Rocky Range west of Milford, Utah [106,107], appear to have plutonic cores that grew around partially resorbed Fe-Ti oxides (Figure 9 and Figure 10). These plutonic cores have in turn been partially resorbed and then overgrown by hydrothermal titanite. This late-stage hydrothermal titanite has grown out into and between surrounding grains, particularly chloritized biotite (Figure 10). Tulloch [108] showed that titanite is a common product of the “low-grade breakdown of biotite, being the chief depository for biotite Ti.” The hydrothermal overgrowths have low Fe/Al of approximately 1:3.5, while the cores are more typical of plutonic titanite with Fe/Al of around 1:1 (Figure 9).
The association of Fe-Ti oxides overgrown by, or associated closely with, titanite was previously observed in both plutonic and metamorphic titanite [105,110,111,112,113,114]. The authors in most of these papers found zoned grains similar to those shown in Figure 11. Angiboust and Harlov [21] studied the replacement of ilmenite by rutile and titanite in metamorphic rocks. Their experiments showed that ilmenite, “in the investigated P-T range [0.7–1.6 GPa, 450–650 °C]…reacts during metamorphism above 1.2–1.4 GPa to form rutile. Below this pressure, titanite is the dominant Ti-bearing species for most granitoid compositions” [21] (p. 1696). They also noted that the position of the reaction curve is strongly influenced by whole-rock Ca concentrations. Even though this relationship with Fe-Ti oxides is found in both igneous and metamorphic titanite, in most metamorphic rocks, the titanite (see, for example, [115]), is high in Al with Fe/Al around 1:2, while in plutonic rocks the Fe/Al is around 1:1. Harlov et al. [115] related the growth of titanite around ilmenite in amphibolite-facies metapelites and amphibolites from India and Italy to hydration reactions in the presence of high fH2O and perhaps high fO2. These are likely also factors in this same relationship found in plutonic rocks.
In addition to the published examples listed above, we also observed this association of titanite that formed around Fe-Ti oxides in the Little Cottonwood stock and the Notch Peak pluton, both in Utah (Figure 11).
Plutonic Example 2: We analyzed titanite from several Jurassic intrusions in the San Bernardino Mountains of southern California, which have been studied by Barth et al. [92], including the Rattlesnake Mountain Granite, John Bull Flat Granite, Crystal Creek Syenite, and Juniper Flats Syenite. Although the titanite compositions from each pluton cluster fairly well, there is considerably more scatter in these samples than in the volcanic rocks examined previously. Volcanic titanite typically varies less than 0.03 apfu in Fe and 0.02 apfu in Al in any given sample (Figure 4), while these plutonic titanite grains vary more than 0.03 apfu in Fe, with titanite in one sample varying by as much as 0.07 apfu (Rattlesnake Mountain) and by more than 0.03 apfu in Al up to over 0.08 apfu (Figure 12). These larger variations in Fe and Al in plutonic titanite are probably due to a longer and more complex growth history. Figure 13 plots Ce + Nd versus Y for titanite from these California granites and compares their growth paths with titanite from several Cenozoic tuffs from the Great Basin and Colorado. The titanite in granite typically has large differences from core to mantle to rim when compared to the titanite in volcanic rocks. According to Kowallis et al. [36], this may be a general difference between volcanic titanite and plutonic titanite. Volcanic titanite is typically not as strongly zoned as plutonic titanite and lacks the irregular rims observed in many plutonic titanite grains that have low REE and Y and high F and Al concentrations.
In Figure 12, the low ratios for Fe/Al (<1:2) are due to overgrowth or replacement by hydrothermal titanite. Figure 14 shows a BSE image along with electron microprobe transects across two grains from the Rattlesnake Mountain pluton. These grains are cut by cracks along which the original titanite has either been altered or replaced. Grain B also has an area of recrystallized or overgrown titanite crossed by the transect along the bottom margin. At each crack, the titanite grains are darker and have reduced Fe/Al and Fe/F ratios. Notice that in grain A only one crack is traversed by the microprobe line. In this grain, the Fe/Al ratio increases slightly from the euhedral rim of the grain at analysis point 1 into the brighter core but does not vary much from 1:1 except around the crack where the ratio drops below 0.5. This grain also shows a typical pattern of enriched F at the rim as shown by decreasing Fe/F and Al/F ratios toward the rim of the grain, except where the crack is encountered and a sharp drop in these ratios occurs. The increase in F and drop in Fe at the crack seems most likely to have been produced by hydrothermal alteration of the titanite along the crack. This same pattern is repeated several times in grain B where cracks are more common.
Plutonic Example 3: Garber et al. [109] studied titanite from the Precambrian Western Gneiss Region, Norway, and found clear differences between relict magmatic titanite and secondary Caledonian metamorphic titanite using a number of chemical and statistical techniques on a large database. Interestingly, the Precambrian magmatic titanite and Caledonian metamorphic titanite could be identified and separated quite nicely using just Fe, Al, and F. The Precambrian magmatic cores have Fe/Al of 0.65 to 0.8, on the low end of where most plutonic titanite plots, but certainly within the range, while the secondary Caledonian overgrowths and grains have Fe/Al of 0.2 to 0.4, well out of the range of other plutonic titanite (Figure 9). A similar trend can be seen in a plot of Fe versus F (Figure 15), where the secondary Caledonian titanite has lower Fe/F (>0.5) than the Precambrian magmatic titanite (Fe/F > 0.6). Similar trends in Fe/F are found in our data from the Rattlesnake Mountain and Rocky Range plutons (Figure 15).
In other published data sets, we found compositions that appeared more like metamorphic or hydrothermal titanite but where the authors had not specifically identified them as such. Here are examples of some of these.
Plutonic Example 4: Titanite from plutons associated with porphyry copper deposits in the Cenozoic Red River alkaline igneous belt in southwest China [43] fall into two distinct groups based upon whether they come from mineralized or barren intrusions (Figure 14). Titanite from mineralized intrusions in this study fall along the 1:1 line typical for magmatic titanite, while titanite from barren intrusions plots between the 1:2 and 1:4 ratio lines. We had no reason to doubt the classification as plutonic by the authors of this study. All the titanite shown in images in their paper appeared to be euhedral and have typical plutonic crystal shapes; however, the compositions of titanite from the barren intrusions are certainly unusual for plutonic titanite.
Plutonic Example 5: Another interesting occurrence comes from a study by Che et al. [31] of skarns and associated rocks, including plutonic rocks, in Canada. Plutonic (magmatic) titanite grains from the Jurassic Takomkane Batholith associated with the Boss Mountain molybdenum deposit are euhedral and plot along the 1:1 Fe/Al ratio line typical for plutonic titanite, but titanite from the Cretaceous Dublin Gulch stock associated with the Ray Gulch tungsten deposit is described as subhedral and plots between Fe/Al of 1:4 and 1:8, strongly aluminum-rich and more typical of metamorphic or hydrothermal titanite (Figure 16). It may be that these subhedral grains in the Ray Gulch deposit are not primary magmatic titanite.
Plutonic Example 6: Gogoi et al. [116], in a study of titanite ocelli from the mafic-felsic interaction zone of the Nimchak Granite Pluton of Chotanagpur Granite Gneiss Complex of Eastern India, obtained Fe/Al ratios between 1:2 and 1:6 (Figure 16). The Chotanagpur Granite Gneiss Complex is a Proterozoic high-grade metamorphic terrain. Even though these titanite grains come from a rock classified as plutonic, it is likely that they have a strong metamorphic overprint and should perhaps be classified as metamorphic rather than plutonic.
Plutonic Example 7: Rossetti et al. [117] studied titanite from the Menderes Massif, western Turkey, closely associated with the Gediz detachment zone. They identified two groups of titanite, one of which they classified as magmatic, and a second group classified as metamorphic overgrowths (Figure 16). Both groups of titanite have Fe/Al < 1:4 and would appear to be metamorphic. However, Rossetti et al. [117] pointed out that the cores, which they classified as magmatic, have significant differences in other elements such as the REE. This difference can be seen in a plot of REE vs. Fe (normalized to Fe/[Fe + Al]; Figure 17). The magmatic cores from Rossetti et al. [117] do plot with REE values more typical of magmatic titanite, but their Fe/Al values are not typical of most other plutonic and volcanic titanite. This is an interesting occurrence that perhaps warrants further investigation to determine why these magmatic titanite grains are so different.
Titanite grains in plutonic rocks are typically euhedral with sharp crystal faces (Figure 11, Figure 14 and Figure 18), although they may have late, irregular overgrowths such as those seen in Figure 14 and Figure 18. However, titanite grains in some plutonic rocks have quite irregular shapes, suggesting resorption after initial growth (Figure 10). Another important process in altering the chemistry of titanite is recrystallization. Garber et al. [109] documented this in some plutonic titanite grains. Dissolution–reprecipitation may have occurred along the cracks and margins of the grains shown in Figure 14 and was involved in the grains from the Notch Peak pluton, Utah, shown in Figure 19. The Notch Peak pluton grains have maintained their original sharp euhedral shape while recrystallization has created embayments and replaced large sections of the original grains with a titanite that is lower in REE and higher in Al and F (dark in the photos). These recrystallized zones cut across the earlier formed oscillatory zoning but do not appear to significantly modify the euhedral crystal shape.
Titanite from silica undersaturated igneous rocks: Silica undersaturated volcanic and plutonic rocks (phonolites, foidites, nephelinites, jacapurangites, ijolites, etc.) typically have titanite with Fe/Al ratios > 1:2 (Figure 3). It is in this group of titanite where we found the highest Fe/Al values. Wu et al. [77], in a study of sodic lujavrites from the Saima alkaline complex, northeastern China, measured Fe/Al values > 10:1 in several titanite grains. The data shown in Figure 3 for this group are strongly influenced by a large number of analyses from four sources: the Magnet Cove and Granite Mountain complexes in Arkansas, the Limberg t3 Tuff of the Kaiserstuhl region in Germany, and the Saima alkaline complex in northeastern China. As with the volcanic and plutonic titanite, analyses from these three localities form distinctive clusters on an Fe versus Al plot (Figure 20) with some ijolites and nepheline syenites of the Magnet Cove complex samples having the lowest Fe/Al values, the Granite Mountain complex and Limberg t3 Tuff having intermediate values, and the Saima alkaline complex having the highest values.
Although titanite compositions from these undersaturated igneous rocks overlap with the data fields for normal volcanic and plutonic rocks when plotted as Fe versus Al (Figure 3), they are chemically distinctive in other ways. For example, they have very low concentrations of Y and high concentrations of Nb when compared to titanite from other environments. In Figure 21, we plotted Fe (normalized to Fe + Al) and Nb (normalized to Nb + Y). Most of the different genetic titanite types (volcanic, plutonic, metamorphic, and eclogitic) separate on this plot due to their characteristic Fe and Al concentrations, but they are not particularly distinctive in Nb and Y. However, titanite analyses from silica-undersaturated rocks clump at the high end of the Nb/(Nb + Y) axis, quite different from the other types.
Among the titanite analyses from silica-undersaturated rocks on Figure 21, the four main data sets for this genetic type can still be seen (as they were on Figure 20) as the four main clumps, with Magnet Cove at the lowest Fe/(Fe + Al) values (about 0.35 to 0.4), Granite Mountain at about 0.5 Fe/(Fe + Al) overlaying the end of the normal plutonic trend, the Limberg t3 Tuff at about 0.7 Fe/(Fe + Al), and the Saima alkaline complex scattering more widely at the highest Fe/(Fe + Al) values (between 0.8 and 0.9). Rock compositions from the Saima complex and some from Magnet Cove, and perhaps the Limberg t3 Tuff (a phonolite from the Kaiserstuhl volcanic complex [118,119,120]) are peralkaline and their titanite has Fe/Al > 2:1. Sphene nepheline syenite and jacupirangite from Magnet Cove and the rocks of Granite Mountain are not peralkaline [77,121,122,123] and plot at Fe/Al < 2:1. The Limberg t3 Tuff has titanite that plots at Fe/Al ≈ 2:1. The low Al activity in the peralkaline rocks may explain the low concentrations of Al in their titanite grains.
Magmatic titanite grains from both volcanic and plutonic types of silica undersaturated rocks tend to be euhedral and may display several different types of zoning, similar to other volcanic and plutonic titanite (Figure 22). Interstitial, anhedral titanite has also been observed in plutonic rocks of this type [77], like what is observed in normal plutonic rocks.
Metamorphic Titanite: Titanite has become an important mineral in modern petrochemical and petrochronological studies of metamorphic rocks where titanite recrystallization or neocrystallization allows multiple events to be recorded, often with each event having a unique chemical and chronologic signature, see, for example: [91,124,125,126,127,128,129,130].
Titanite from metamorphic rocks typically has Fe/Al < 1:2, with some data points scattering up to higher values (Figure 3). The high Al content of typical metamorphic rocks is probably controlled by the protolith. The metamorphic rocks in our compilation are overwhelming peraluminous metapelitic rocks with relatively high Al2O3 and low alkali contents (e.g., metagraywacke, metaargillite, schist, gneiss, etc.). Thus, when such aluminous rocks are metamorphosed, the titanite is also Al rich.
Titanite from high-pressure metamorphic rocks (mostly eclogites) is distinct from most other metamorphic titanite and typically has very low Fe/Al < 1:8, except in titanite with low Al (<0.15 apfu) where a few data points scatter up into higher Fe/Al (Figure 23). The abundance of Al in these high and ultrahigh pressure (UHP) rocks has been proposed as a solution to the stability of titanite where it would otherwise be unstable [2] and may be the reason for their high Al content. However, Ye et al. [131] found UHP rocks with titanite that had low Al (average ~ 0.07 apfu). However, even in these lower Al titanite grains, the average Fe:Al ratio is still ~1:8.
Another distinctive group among the metamorphic titanite analyses are those with mafic protoliths such as metabasalt, metabasanite, metapyroxenite, and amphibolite (Figure 3). Titanite from these rocks typically has Fe/Al > 1:2, more akin to plutonic and volcanic titanite than the rest of the metamorphic titanite. This is likely due to the Fe-rich nature of the mafic protoliths.
Titanite grains in metamorphic rocks may be idoblastic to xenoblastic (euhedral to anhedral) (Figure 24). Unlike plutonic titanite grains, which typically have large (111) crystal faces giving them a characteristic diamond shape (see Figure 19), metamorphic titanite crystals are usually less angular in appearance.
Hydrothermal and pegmatitic titanite: Mazdab et al. [38] noted that titanite from hydrothermal environments showed a wide compositional diversity. Our compilation confirmed this observation. Analyses from grains that grew in both hydrothermal and pegmatite environments scatter widely in terms of Fe/Al with no obvious trends in the overall data set (Figure 3). The scatter of compositions among hydrothermal titanite is probably due to crystallization from fluids with variable temperatures and compositions in a wide variety of rocks. The oxidation state also plays an important role. This can be seen clearly in Figure 25 where titanite analyses from typically oxidized Fe, Cu, and Au skarns and mineral deposits plot with Fe/Al > 1:3, while titanite from generally reduced W, Sn, and Mo skarns typically plots at Fe/Al < 1:4. Apparently, Fe+3 substitutes more readily for Ti+4 than Fe+2.
We briefly discussed in the earlier section on plutonic titanite the occurrence of secondary, hydrothermal titanite and will expand on it here. Hydrothermal titanite in plutonic rocks has been documented in several studies [42,50,135,136,137,138]. Morad et al. [137] observed tiny lenticular titanite grains that grew along the cleavage planes in chloritized biotite. Xie et al. [42] found a similar association of secondary titanite and chlorite. Janeczek [136] showed that titanite is a common byproduct of the chloritization of Ti-bearing biotite and often produces high-Al titanite grains. We observed the same type of secondary titanite growing along chloritized biotite cleavage planes in samples from the Rocky Range pluton, Little Cottonwood stock, and Notch Peak pluton, all in Utah (Figure 10 and Figure 18). In these Utah intrusions, the secondary hydrothermal titanite that grew along biotite/chlorite cleavage planes had Fe/Al of 1:3 to 1:5, while the magmatic titanite in these plutons had Fe/Al of around 1:1 [24].
In granitic pegmatites, crystallization occurs across a range of conditions from volatile-rich magmas to vapor phase to hydrothermal fluids [139,140,141,142,143]. This poses a problem in classification. Should titanite analyses from a particular pegmatite be considered plutonic? Or perhaps hydrothermal? Or something else? Without additional data to determine what conditions might have existed during titanite crystallization, we cannot place them with certainty into a plutonic or hydrothermal category. Therefore, we chose to place any titanite analyses that have been called pegmatitic into their own category.
Because the compositions of the volatile-rich magmas and fluids that form pegmatites are quite varied, so also are the titanite grains that crystallize from them. Figure 26 shows data from several pegmatites plotted as Fe versus Al. The data scatter widely from those rich in Fe (Fe/Al > 1:1) to those rich in Al and poor in Fe (Fe/Al < 1:4). One of the unique features of titanite in pegmatites is that it may be rich in elements not normally found in other types of titanite. For example, Černý et al. [52] reported that titanite from the Maršíkov II pegmatite in northern Moravia, Czech Republic, may contain up to 21% Ta2O5 and 9.5% Nb2O5. Titanite compositions have also been reported from pegmatites in Manitoba [59,67], Poland [62], Norway [64], Slovakia [144], and British Columbia [145] with elevated levels of Nb and/or Ta.
Most titanite analyses from a particular sample from a hydrothermal or pegmatite environment cluster together on an Fe versus Al plot (Figure 26). However, some do not. Included here are a few examples of the variations that may occur in single samples and even single grains of pegmatitic or hydrothermal titanite.
Hydrothermal Example 1: Anhedral titanite grains filling cracks in tantalian rutile from the Maršíkov II pegmatite [52] plot in two clumps on Figure 26, one with low Al and one with high Al. Černý et al. [52] identified three types of titanite in this pegmatite: a Na-enriched variety with low Al, a F-enriched variety with the highest Al values, and a third variety with high Al and the highest Ta/Nb ratios. All these varieties are thought to have formed during retrograde metamorphism by fluid released during dehydration reactions [52].
Hydrothermal Example 2: Even within a single grain, variations in Fe and Al can be quite extreme. Chakhmouradian [146] documented secondary deuteric titanite with a wide variety of compositions within individual grains that crystallized in carbonatites of the Afrikanda area of the Kola Peninsula, Russia. Grains had wide ranges of Fe2O3 (up to 8%), Al2O3 (up to 10%), ZrO2 (up to 15%), and Nb2O5 (up to 11%).
Hydrothermal Example 3: An additional example of the variations that may occur within a single hydrothermal titanite crystal can be seen in Figure 27. This crystal grew into a miarolitic cavity in an aplite located west of Milford, Utah. The cavities in this aplite have euhedral crystals of smoky quartz, fluorite, titanite, adularia, albite, and epidote [106]. The cores of titanite crystals from these miarolitic cavities have Fe/Al of 1:1, as well as LREE concentrations typical of magmatic titanite (see Figure 3 and Figure 17 for a comparison with plutonic and volcanic titanite) even though they grew into an open cavity. First, was the growth of the core of the grain, which appears to have been euhedral with sharp crystal faces (note the sharp, straight oscillations near the margin of the interior zone on Figure 28). Subsequently, a cracking event occurred. The cracks were then annealed leaving trails of fluid inclusions and, in at least one case, a filling of slightly different titanite with a composition similar to material in the next zone that formed around the core (Figure 28). These annealed cracks do not extend out into the outer zones of the crystal but are confined to the interior core zone.
Mantling the core of the grain is a zone with wavy, irregular light and dark bands and patches. Fluid inclusions are abundant along some of the boundaries between bands in this zone. The wavy character along with the fluid inclusions suggest oscillating periods of dissolution and regrowth (Figure 28). The analyses from this wavy zone still have Fe/Al close to 1:1 (Figure 27, labeled as ‘intermediate’ analyses), and variable bright and dark areas corresponding to higher and lower LREE, but with a trend to somewhat lower values toward the rim.
Finally, a dark gray outer rim overgrew these interior zones. This rim zone has a spongy appearance in the BSE image, perhaps due to fluid- or vapor-filled cavities (Figure 28). This rim zone is characterized by high Al and F, and low Fe and LREE (Figure 27). The Fe/Al in this rim zone is < 1:15 and ranges as low as 1:35. This relative enrichment in Al is greater than any values seen in the examples given earlier for overgrowths on plutonic titanite.

5. Charge Balancing

The substitution of Fe and Al into the Ti site leaves a charge imbalance that is thought to be mostly compensated for by F or OH substitution for the one O atom that is not bound in SiO4−2 groups [1,4,18,45]. Plots of Fe + Al versus F in titanite are shown in Figure 29. In all the genetic types, there is a positive correlation between Fe + Al and F. However, the correlation is much stronger in metamorphic, pegmatitic, and hydrothermal titanite than in volcanic and plutonic titanite (including silica-undersaturated types).
When Fe and Al are broken out and plotted separately versus F, Al has a strong correlation with F while Fe does not (Figure 30 and Figure 31), an observation that has been reported previously in a study of metabasites from the Canadian Shield [127]. From our data set, we can see that Al and F are strongly correlated in most titanite––except volcanic titanite (Figure 30). The overall correlation for pegmatites is also not strong, but this is partially an artefact of the pegmatite data set, which is strongly influenced by two samples. Titanite in these two samples taken separately has fairly strong correlations between Al and F. None of the genetic types of titanite show a strong correlation between Fe and F, except the overall data for pegmatites, but again this is an artefact of the preponderance of data from two samples (Figure 31), and when they are looked at individually this correlation breaks down.
In volcanic and plutonic titanite, it appears that the charge imbalance created by the substitution of Fe is largely compensated for by +3 ions (REEs, Y) substituting into the Ca site as seen by the strong correlations between Fe and REE + Y (Figure 32). Titanite from silica-undersaturated rocks, however, shows no correlation between Fe and either F or REE + Y (Figure 31 and Figure 33). Titanite from these rocks, particularly those from the Limberg Tuff of the Kaiserstuhl complex, typically has high Nb (up to 0.10 atoms pfu), likely as Nb+5 substituting for Ti+4. The excess charge on this ion would help to balance any deficiency created by Fe+3 in the Ti+4 site (Figure 34). Metamorphic titanite, including that from eclogites, has a strong correlation between Al and F, but little to no correlation between Fe and REE + Y (Figure 30 and Figure 33), showing that charge balancing in metamorphic titanite is largely accomplished by the coupled substitution of Al+3 and F.
The other factors that we have not taken into consideration here, in relation to charge balancing of the Ti site, are the contributions from OH and the oxidation state of Fe, which occurs in titanite as both Fe+3 and Fe+2 [147,148,149,150,151].

6. Discussion

Titanite is an important mineral in petrogenetic and petrochronologic studies where an understanding of its chemistry, crystallization history, and element diffusion rates is critical in making sense of the histories it records [2,4,38,109]. We demonstrated that Fe, Al, and F, secondary elements typically analyzed in titanite, can be used to identify different environments where titanite forms. Other elements, particularly REEs, Nb, and Y, are also helpful. From our large database of chemical analyses of titanite, we demonstrated the following:
(1)
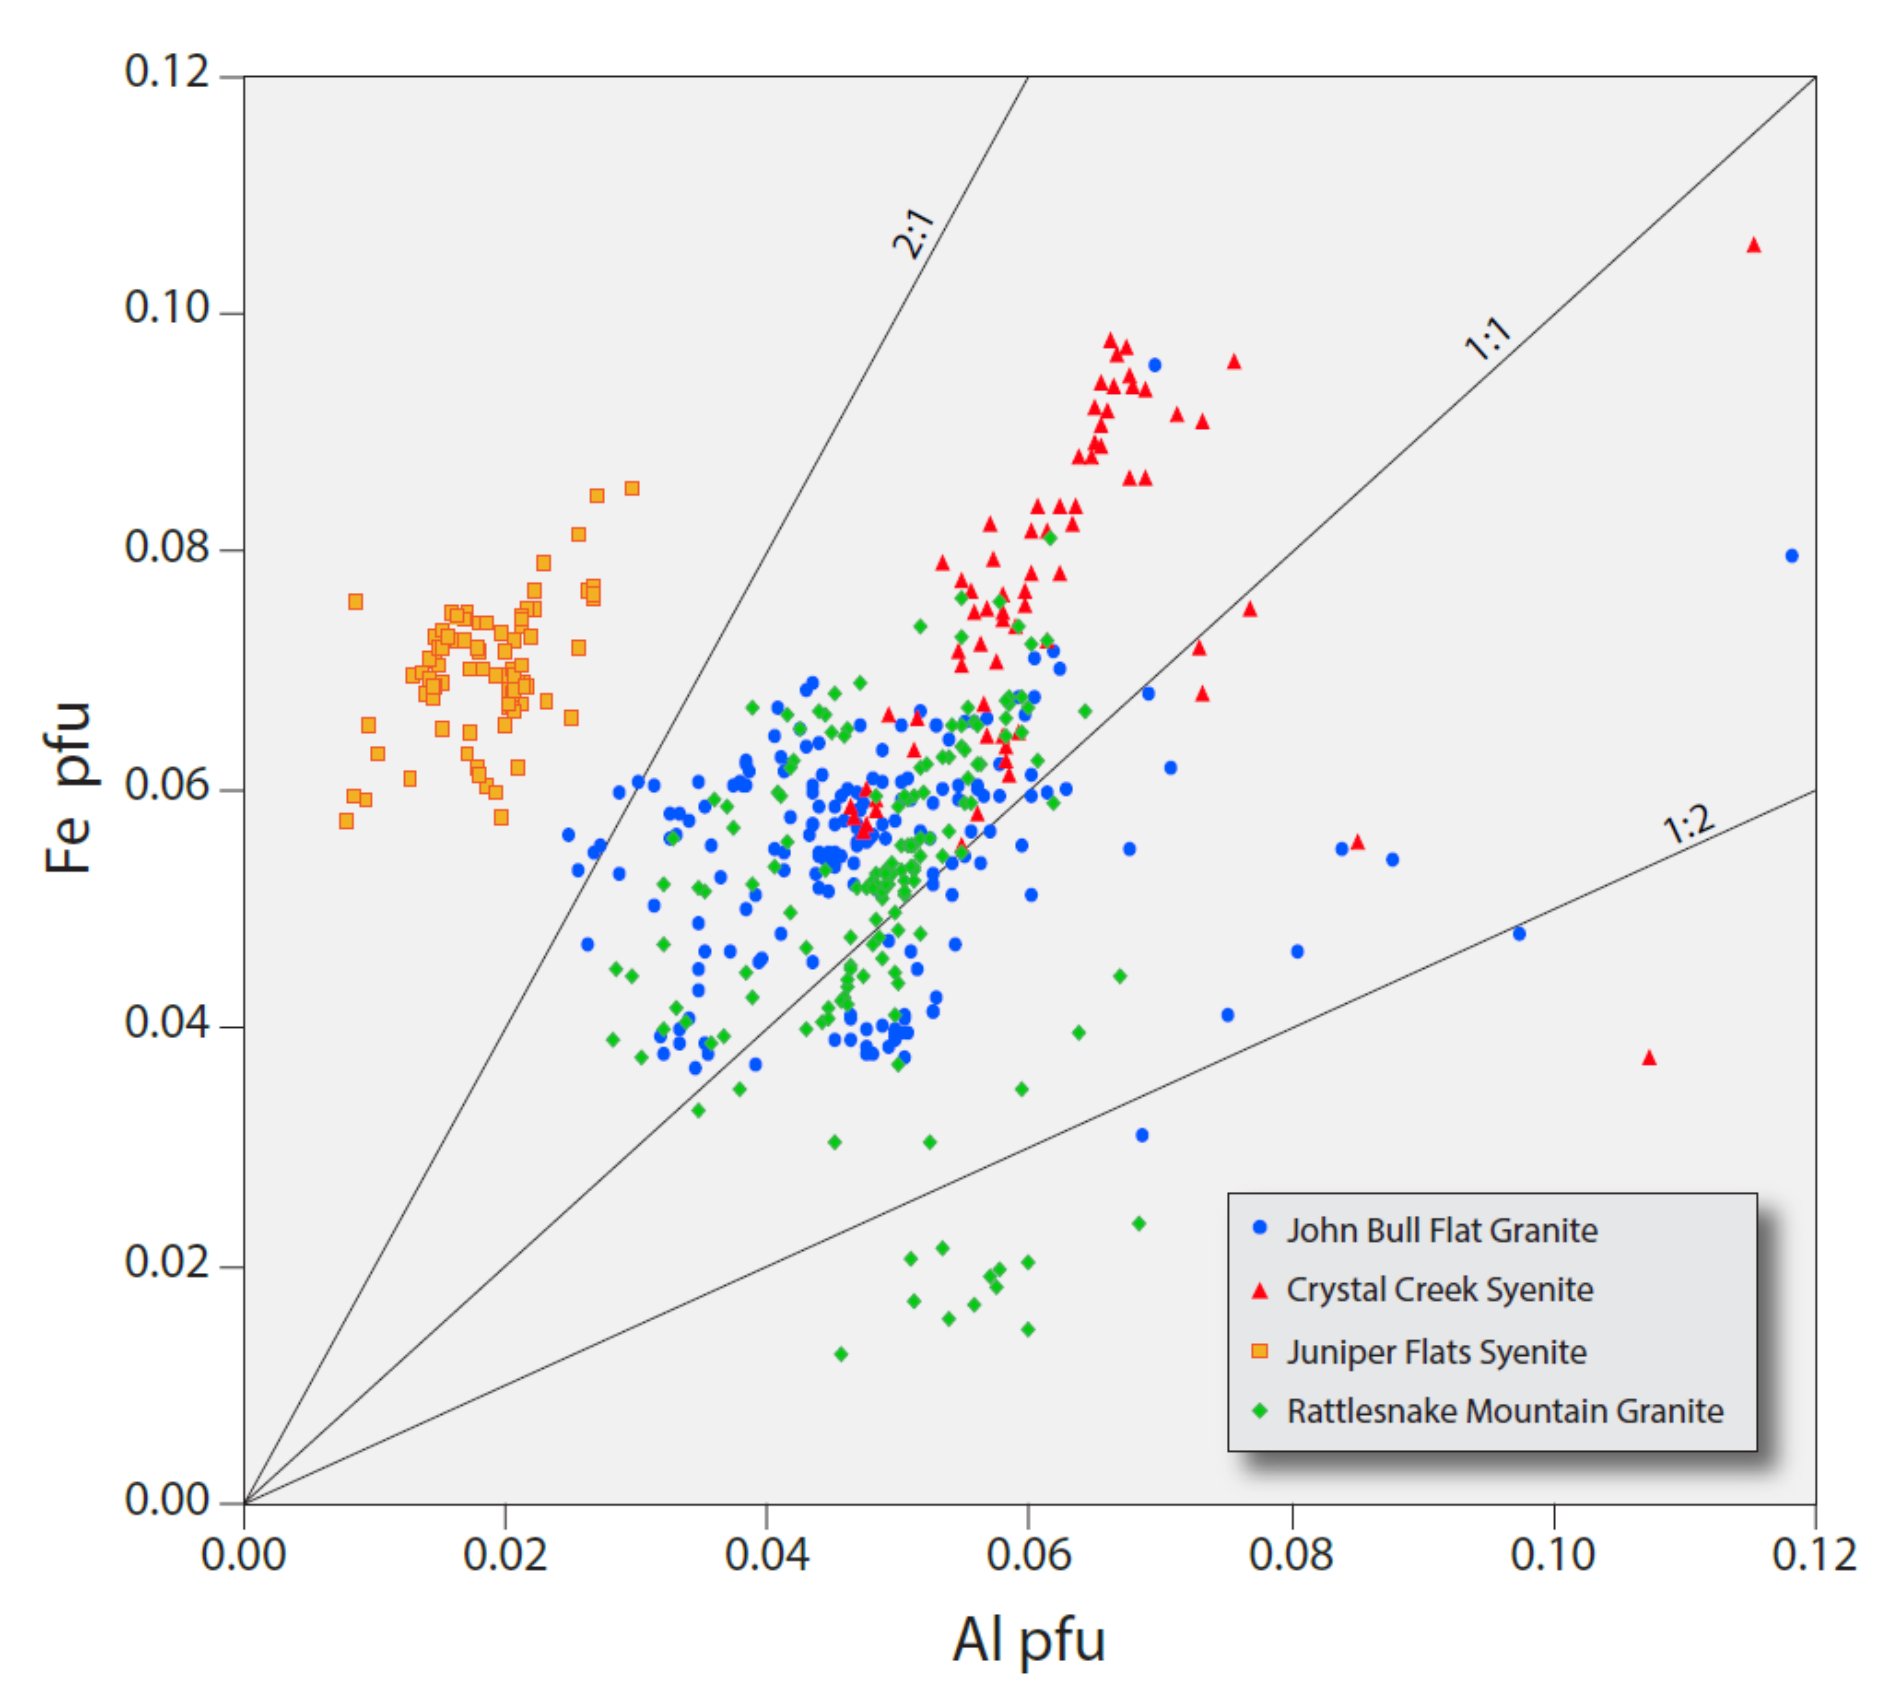
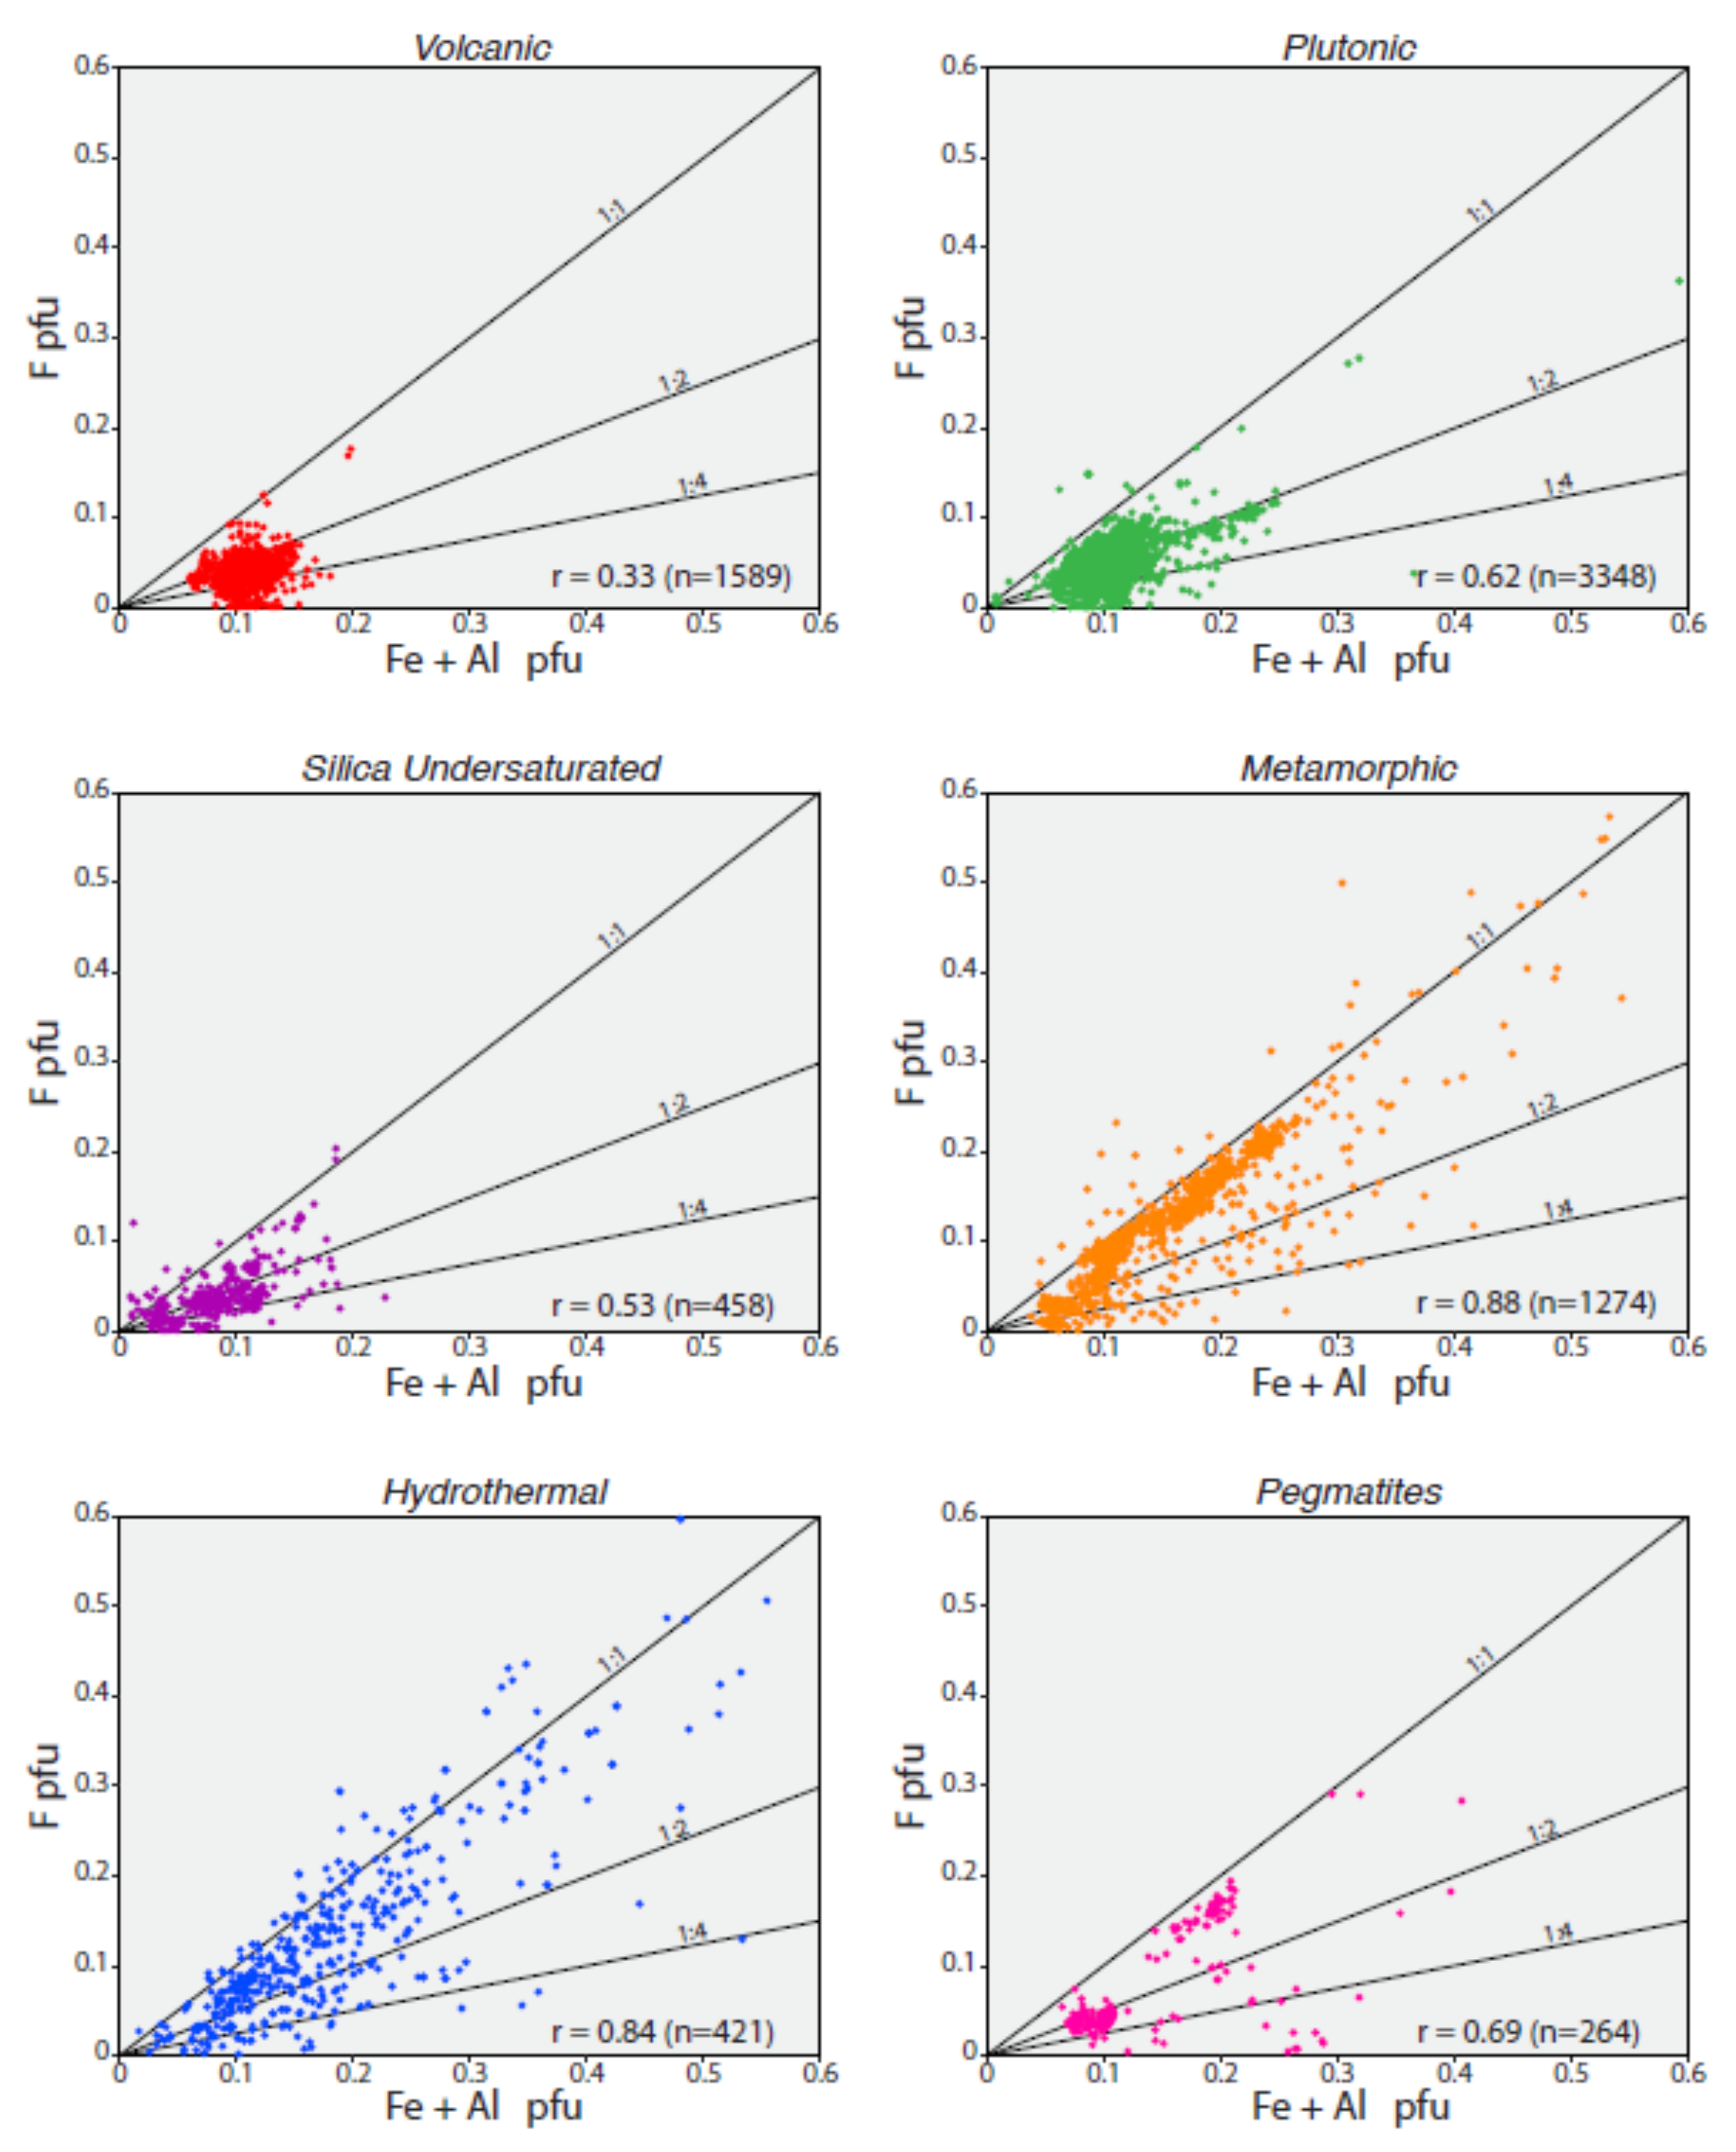
In all environments, the principal substitutions in the Ti+4 site of titanite are Fe+3 and Al+3.
(2)
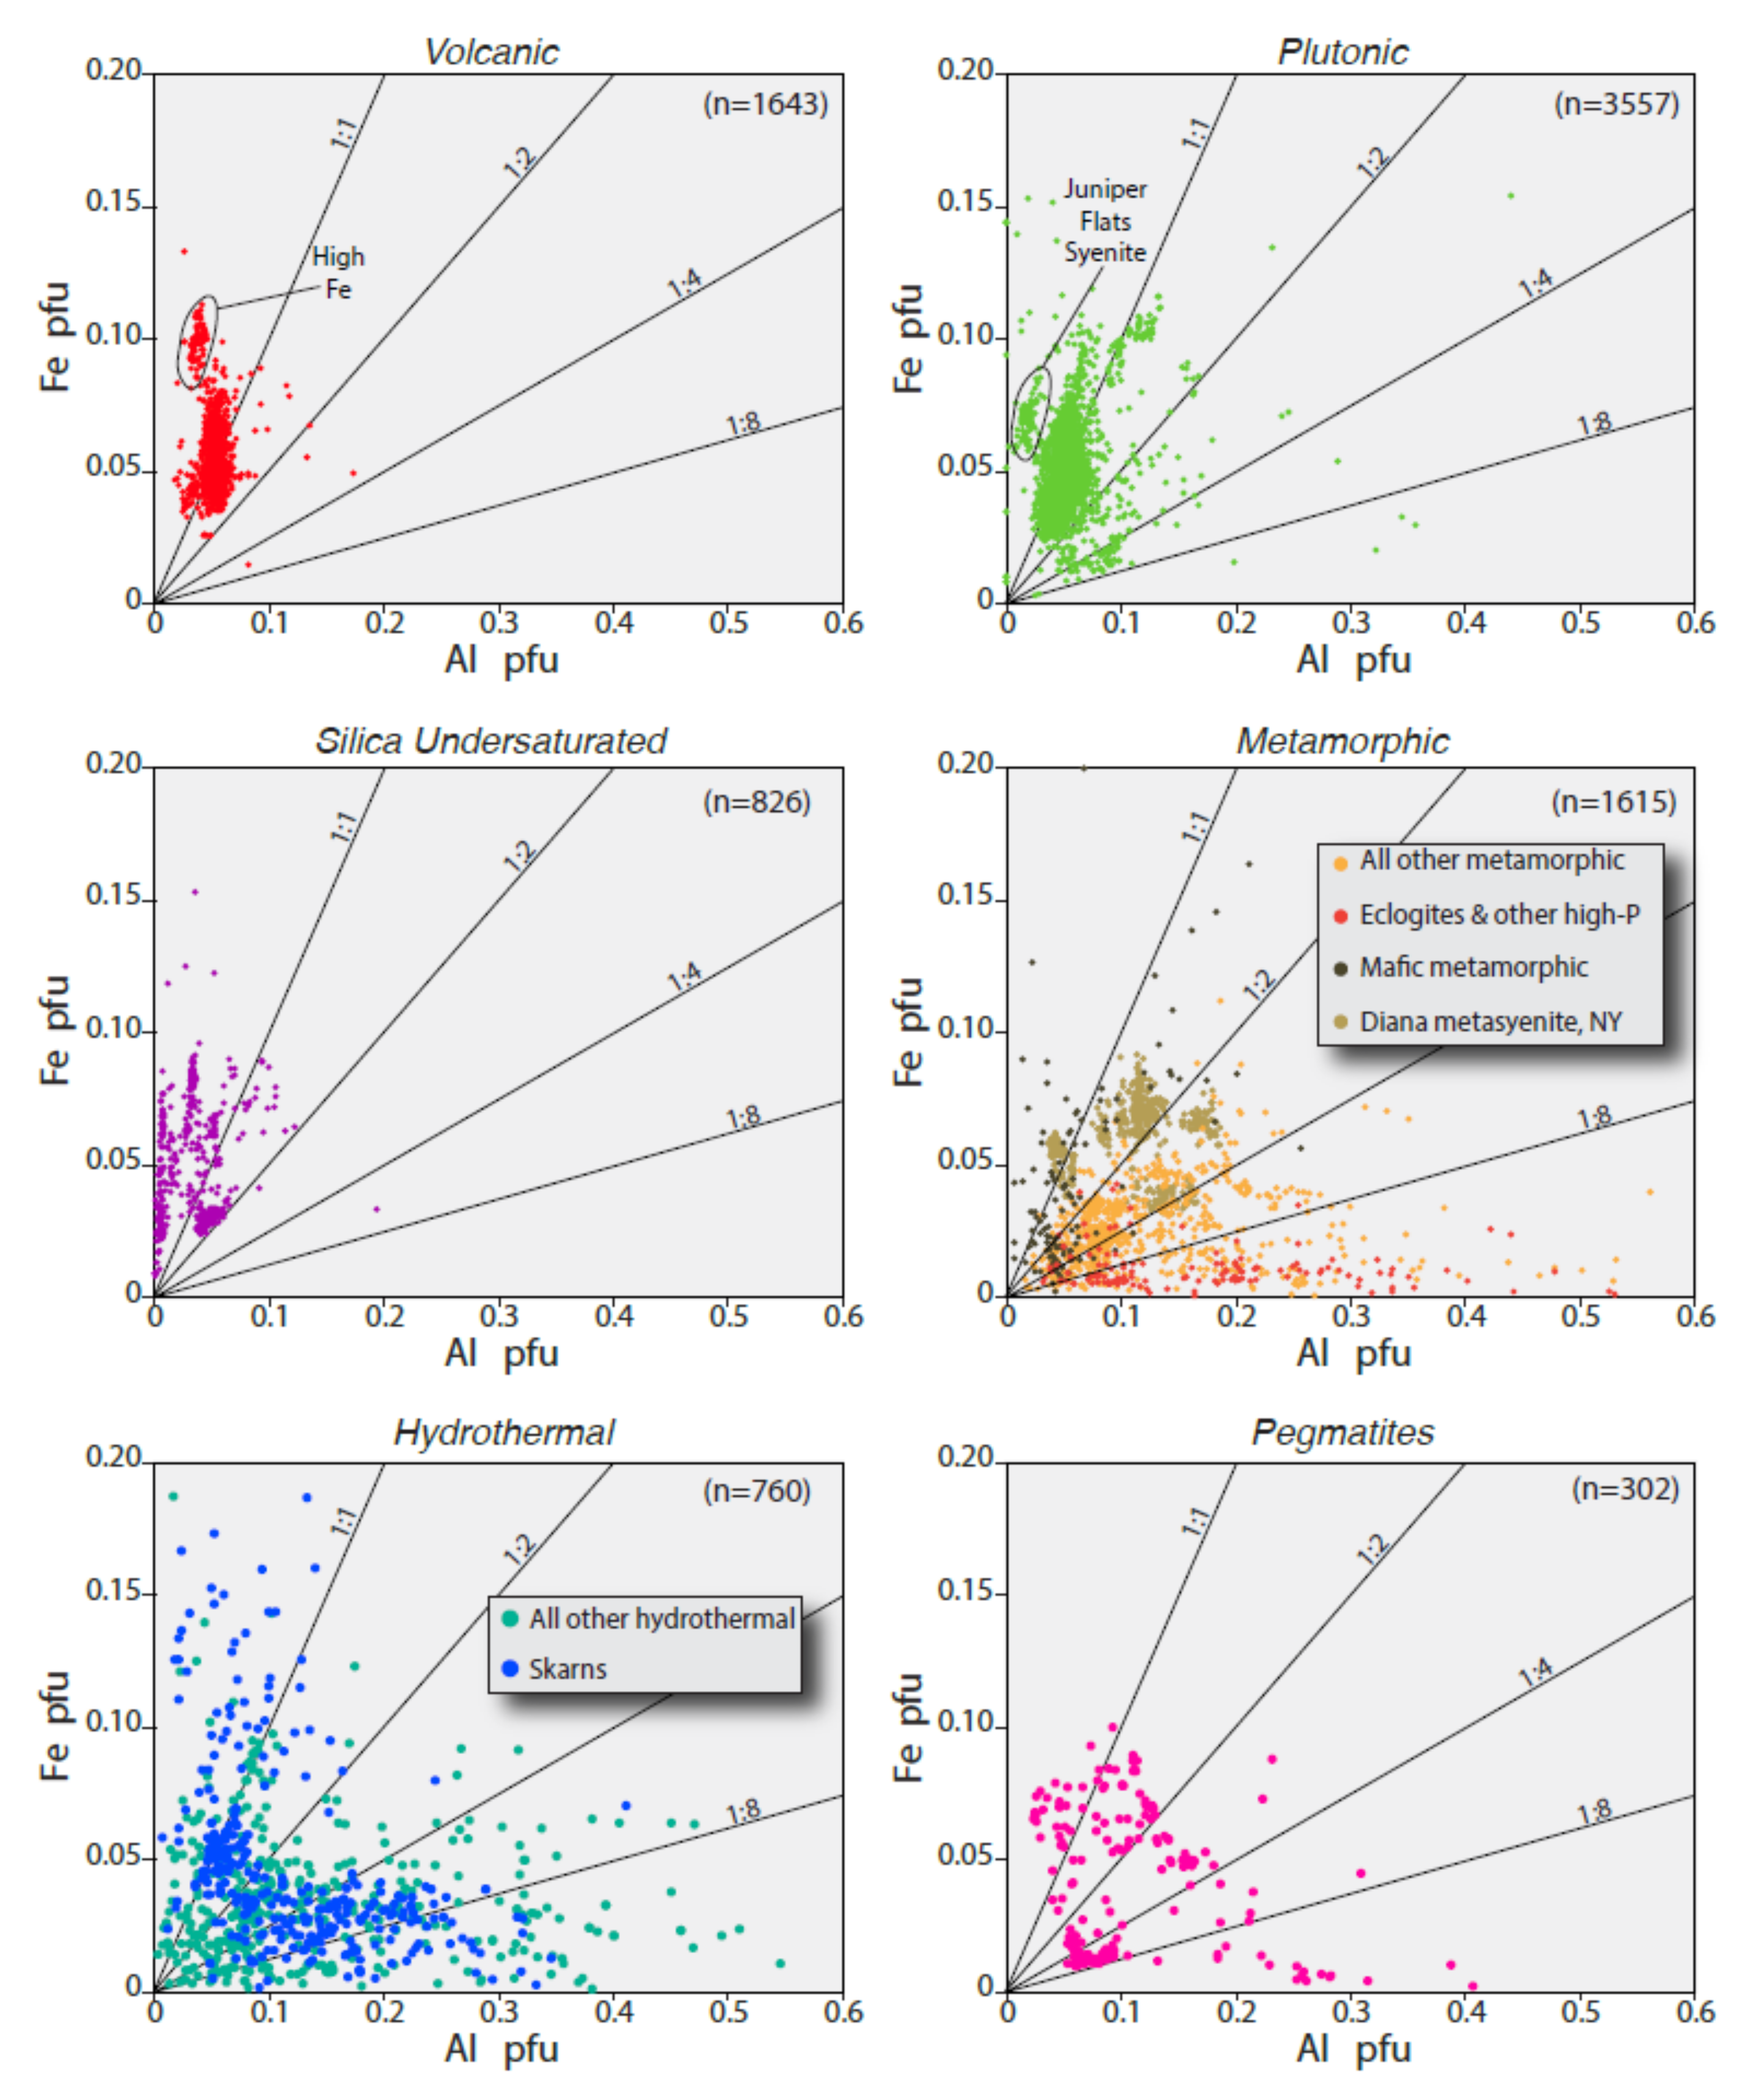
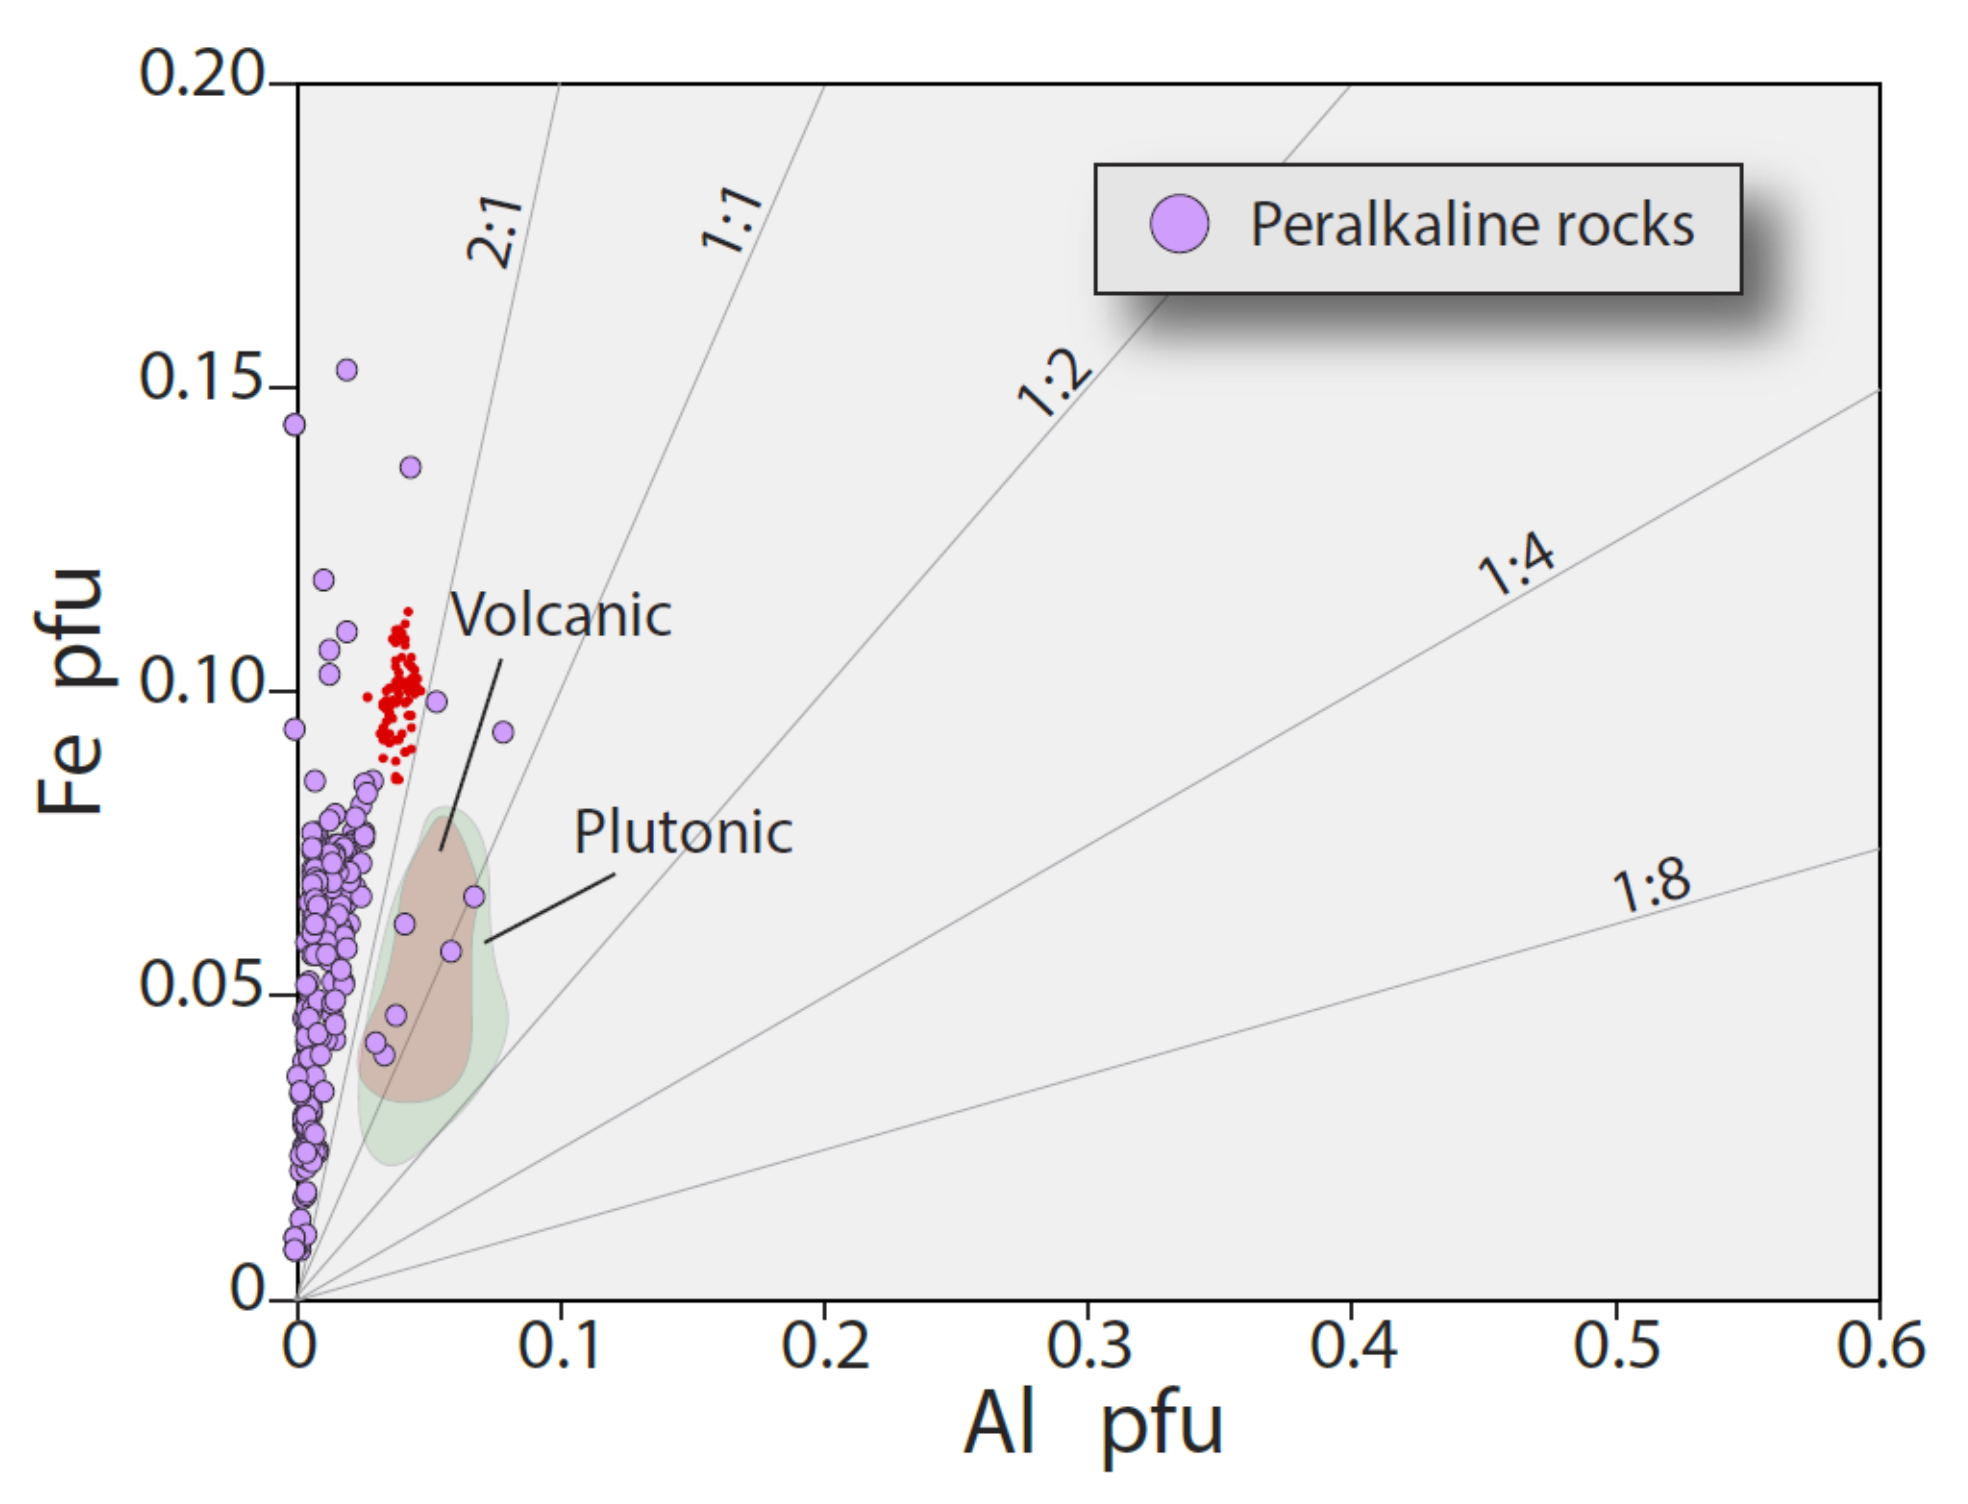
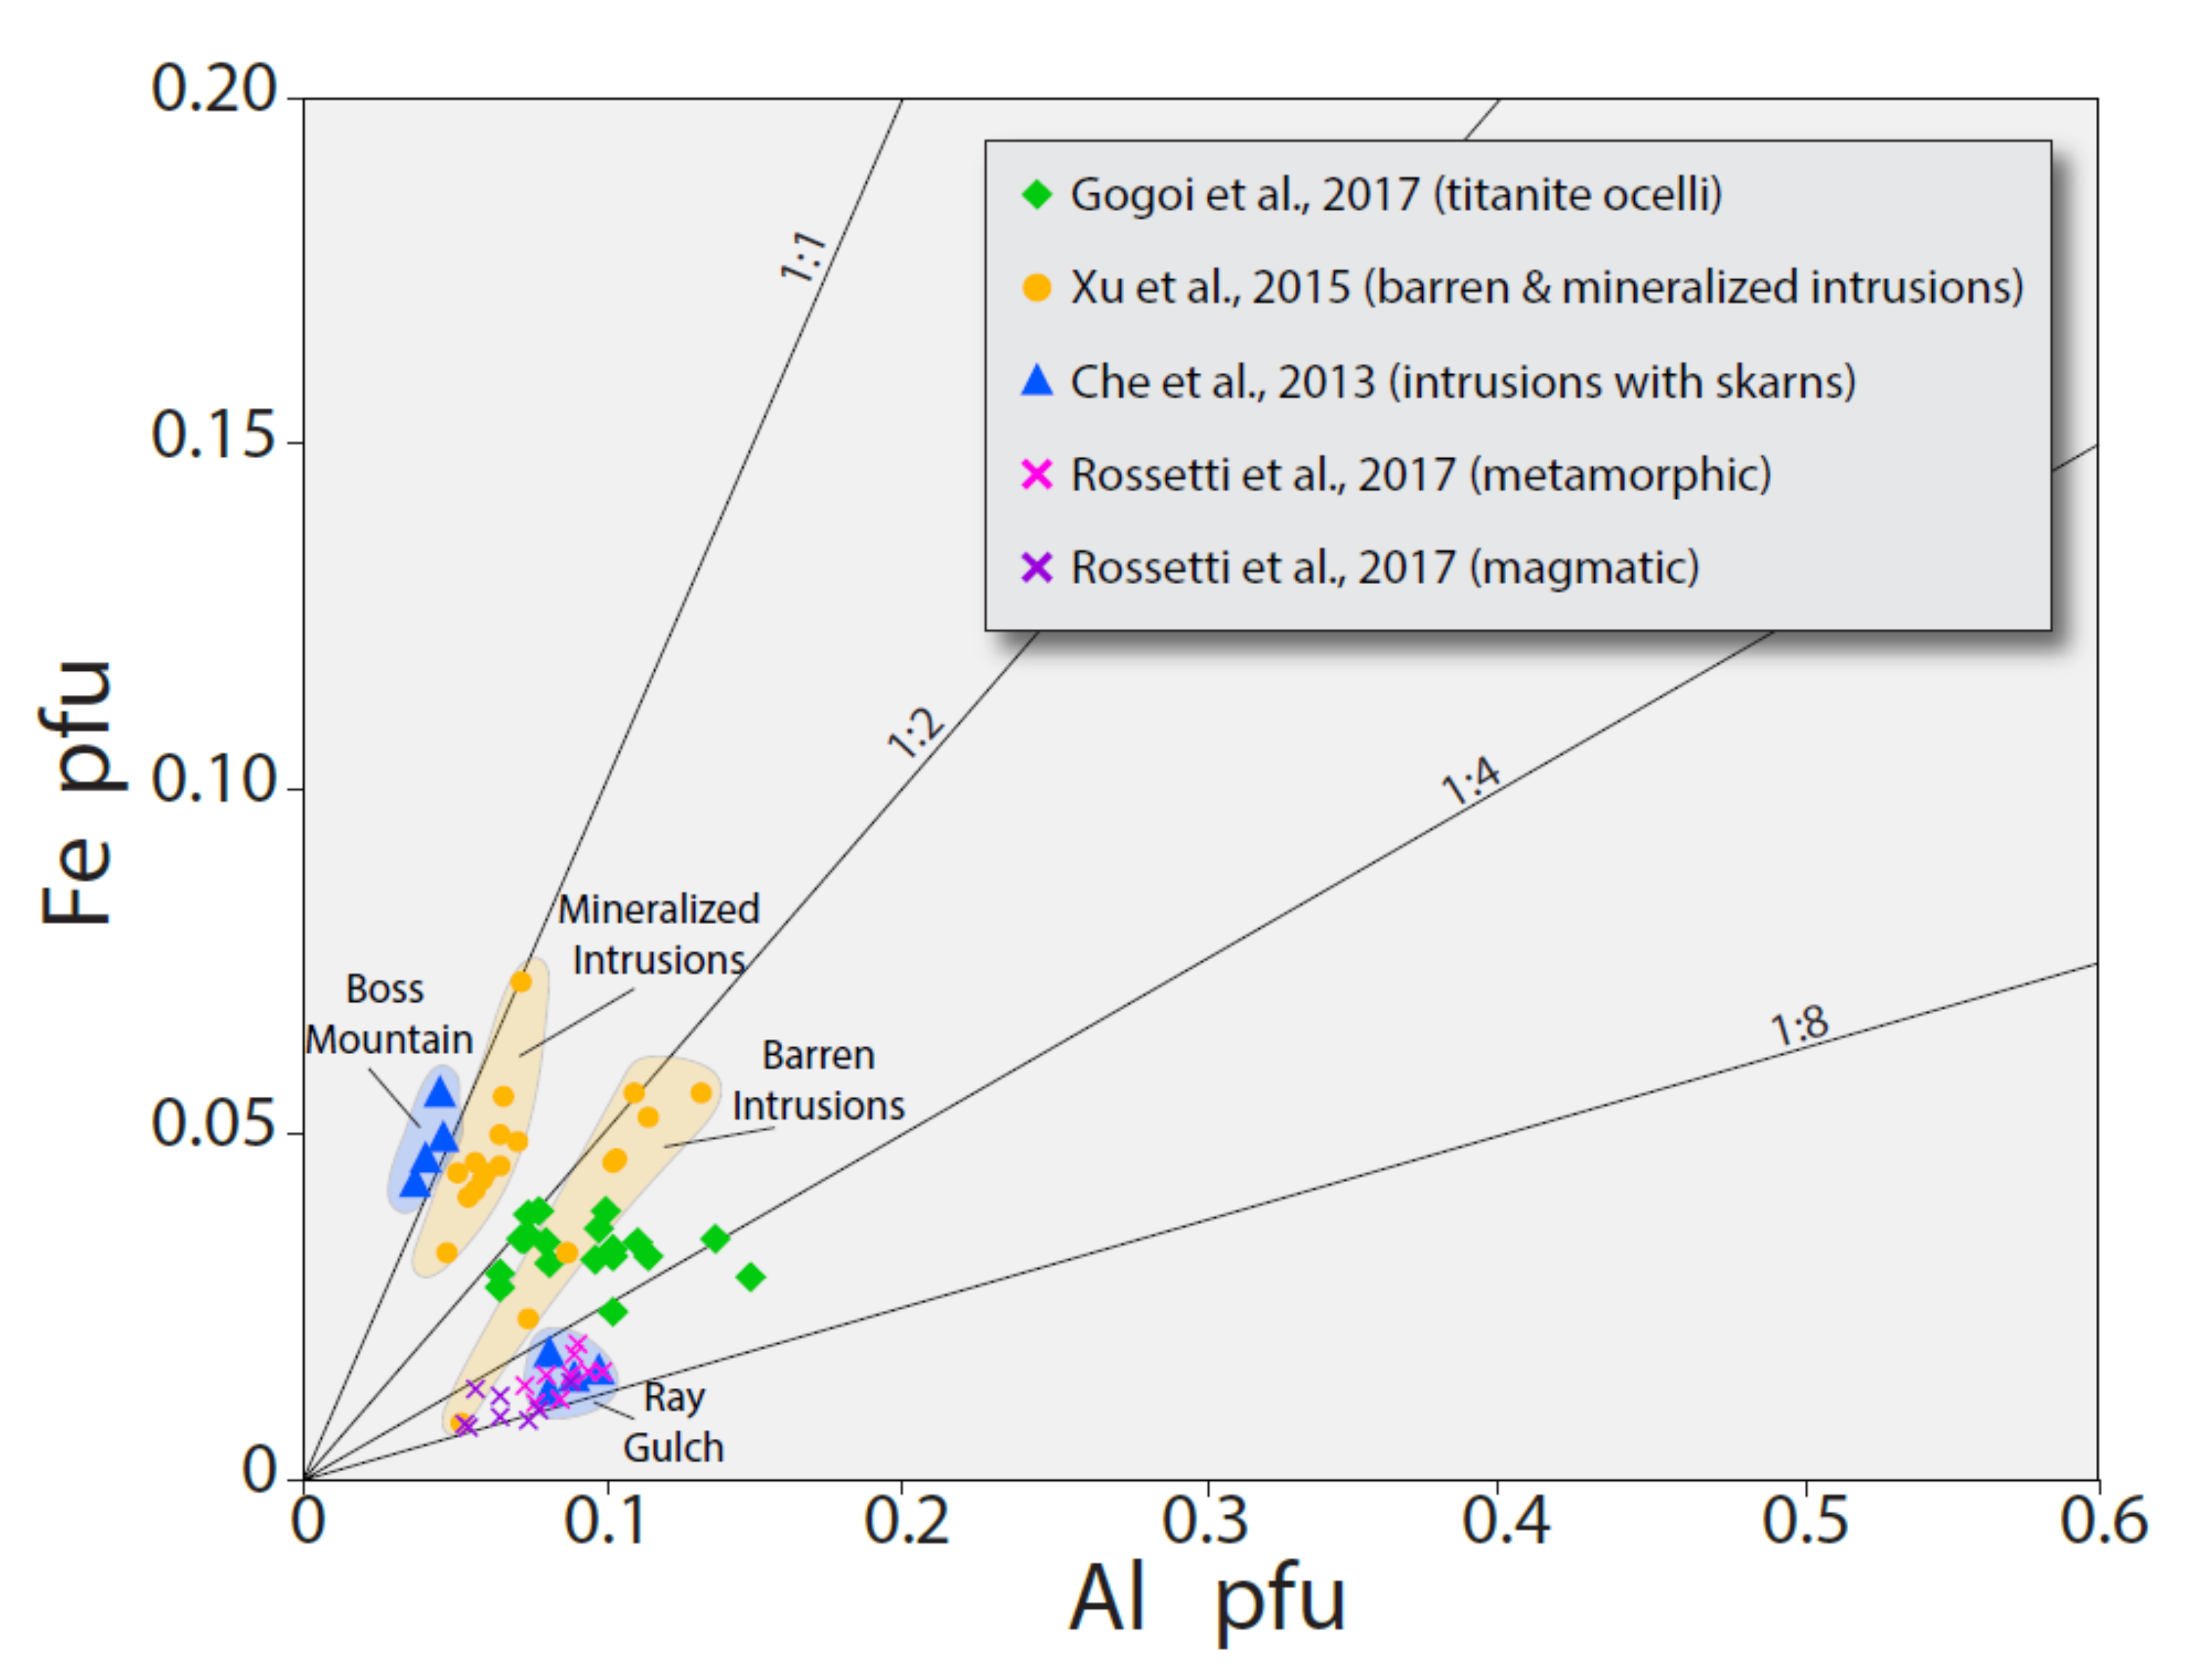
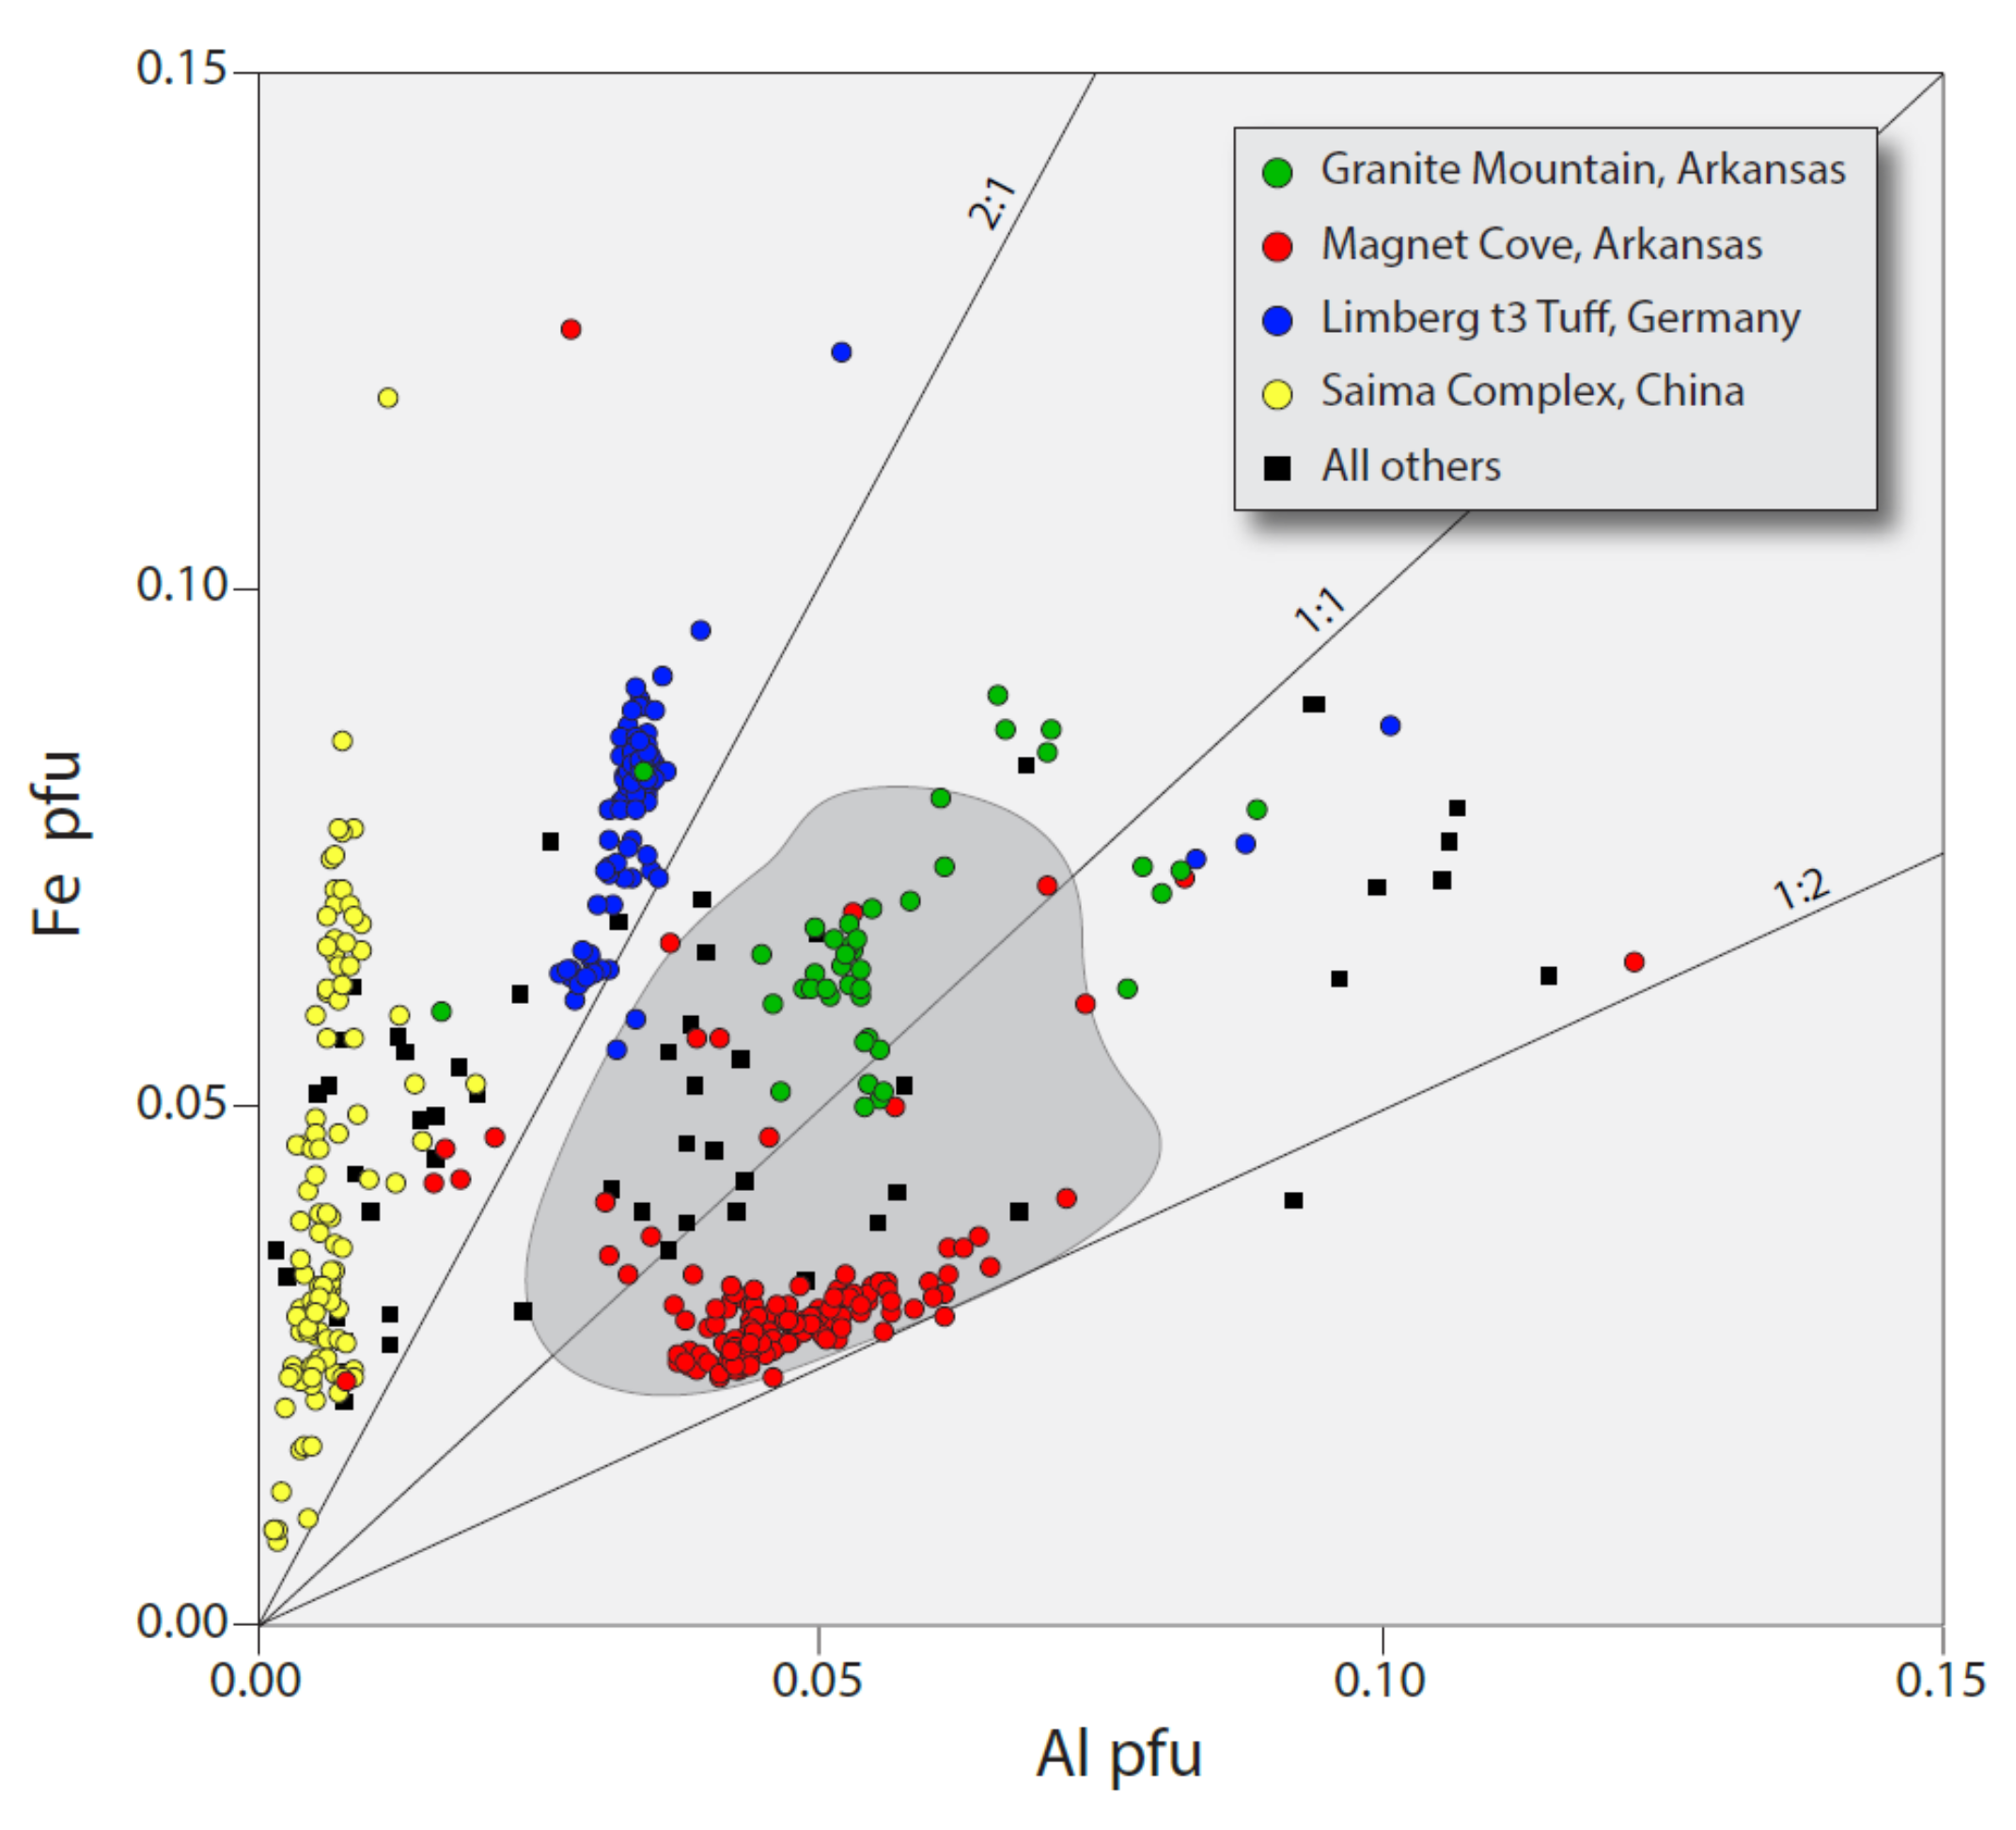
The atomic ratio of Fe/Al in titanite from both volcanic and plutonic rocks is typically close to 1:1 and almost always > 1:2.
(3)
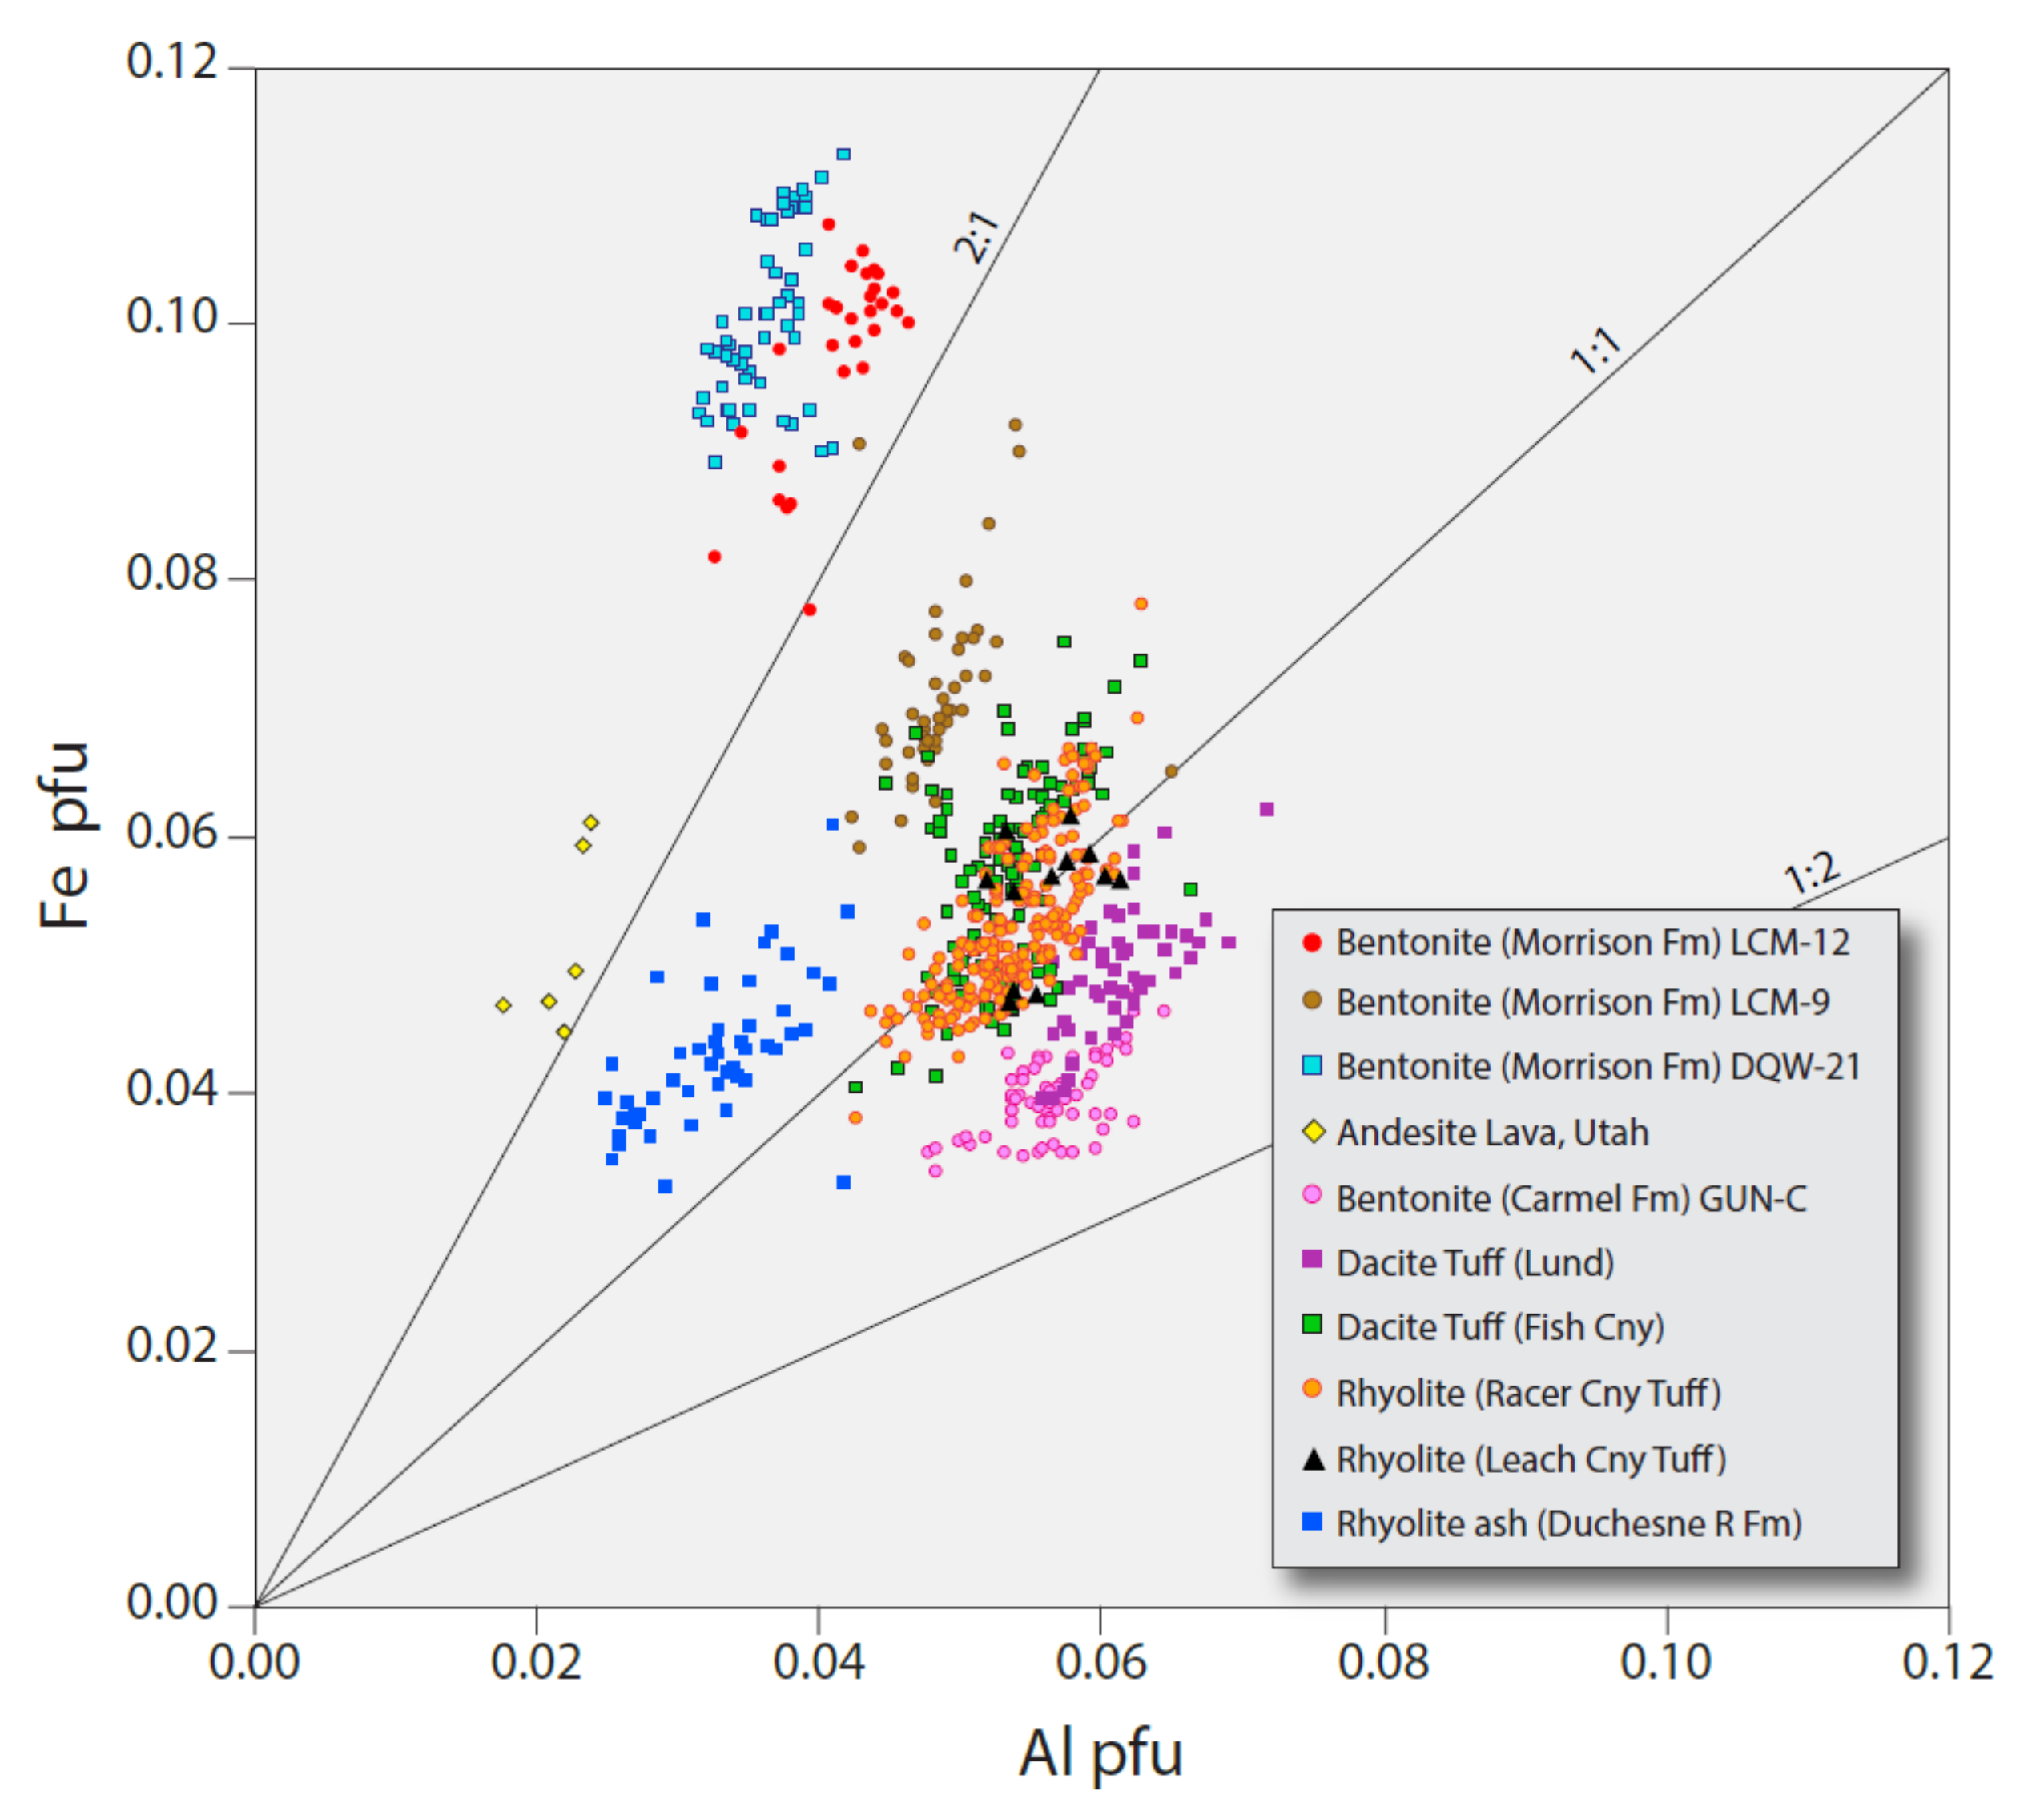
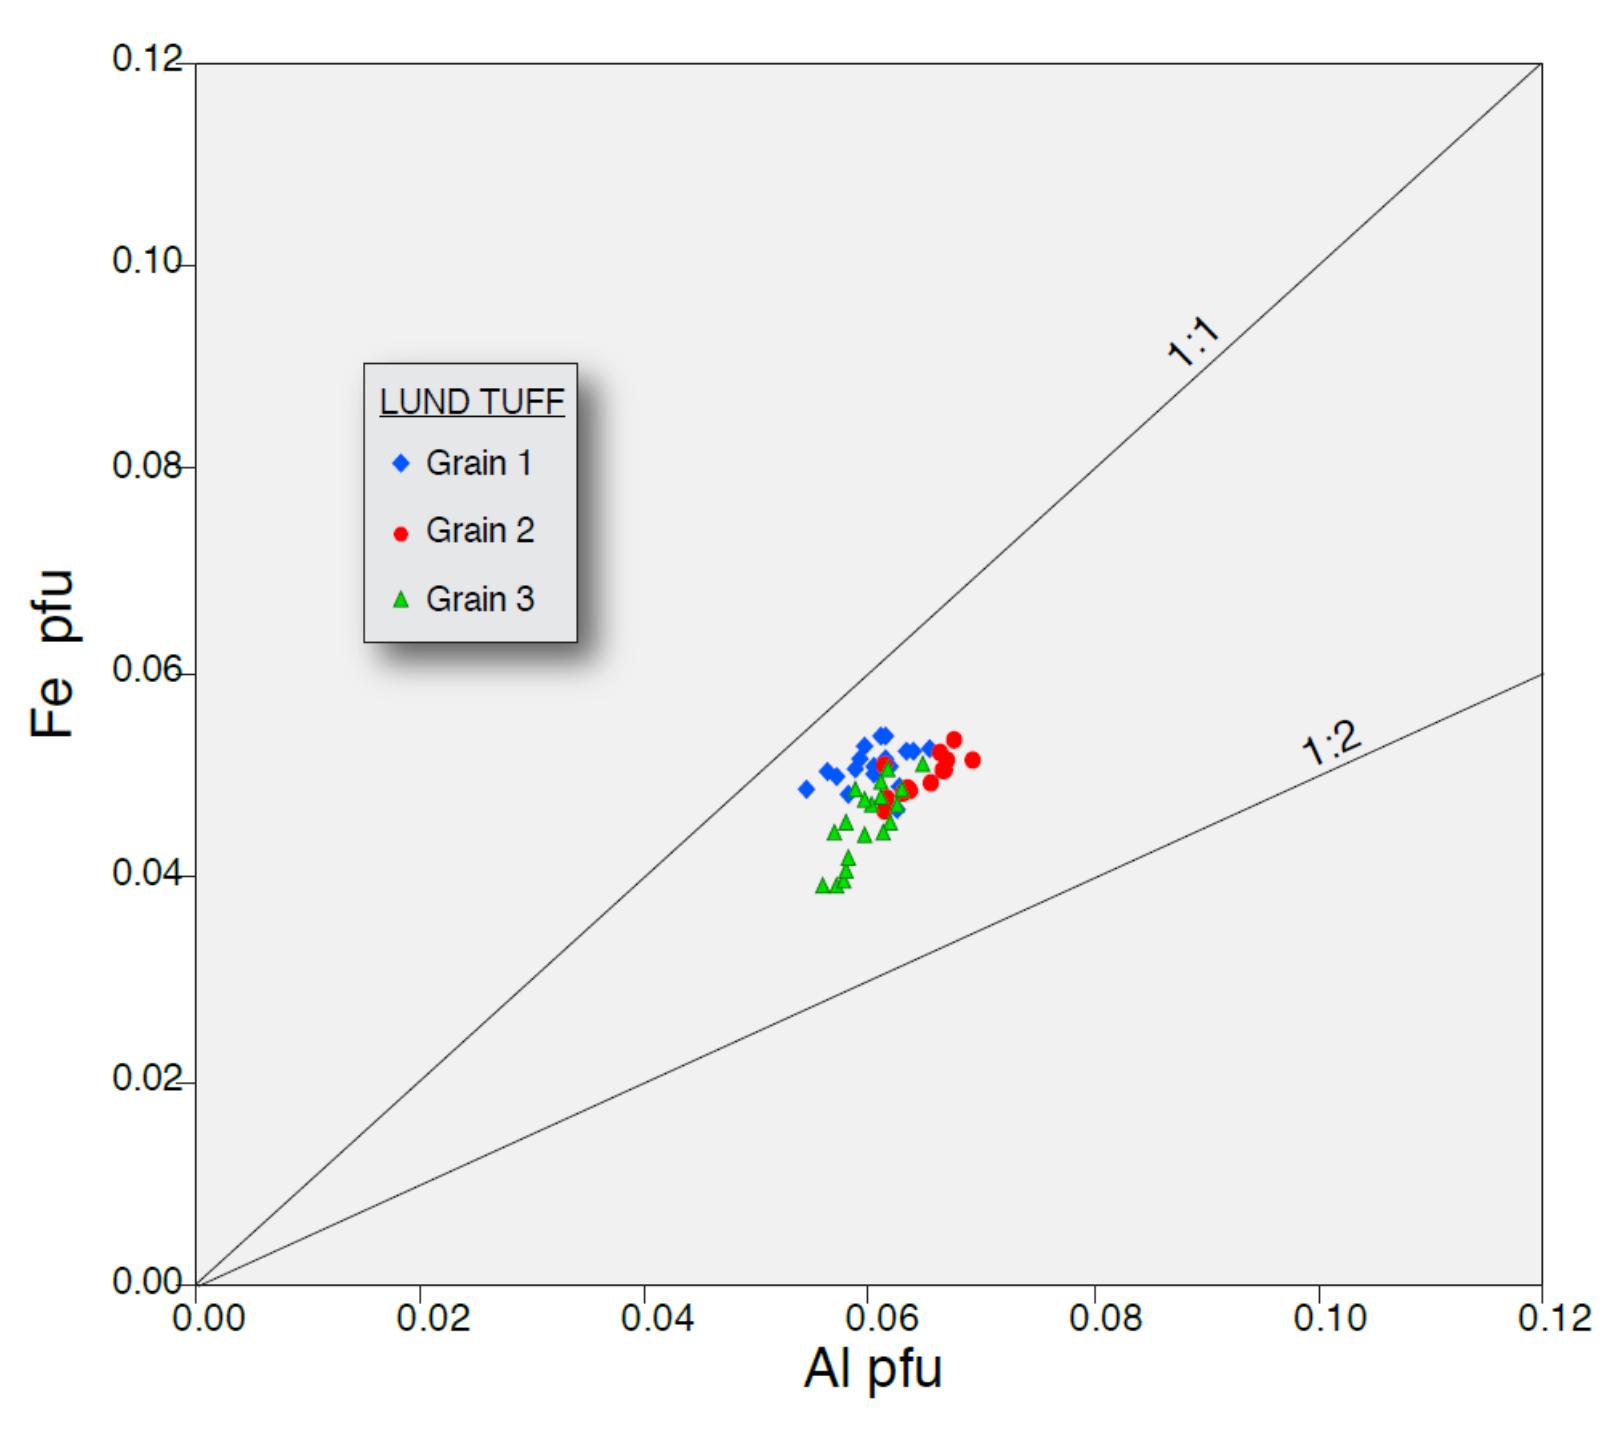
Volcanic titanite compositions typically cluster more tightly in terms of Fe, Al, and F than do titanite compositions from any other environment. Analyses of volcanic titanite from individual samples cluster even more tightly than the overall volcanic group. Given the wide range of potential compositions found in other environments, this suggests that titanite in volcanic rocks typically crystallized from magmas with limited ranges of Fe and Al.
(4)
Plutonic titanite typically clusters more loosely than does volcanic titanite in terms of Fe, Al, and F, suggesting a wider range of compositions for the magmas from which they crystallized. Some of the broader spread may be due to later metamorphic or hydrothermal overgrowths lumped in with the plutonic data that do not typically occur on volcanic titanite.
(5)
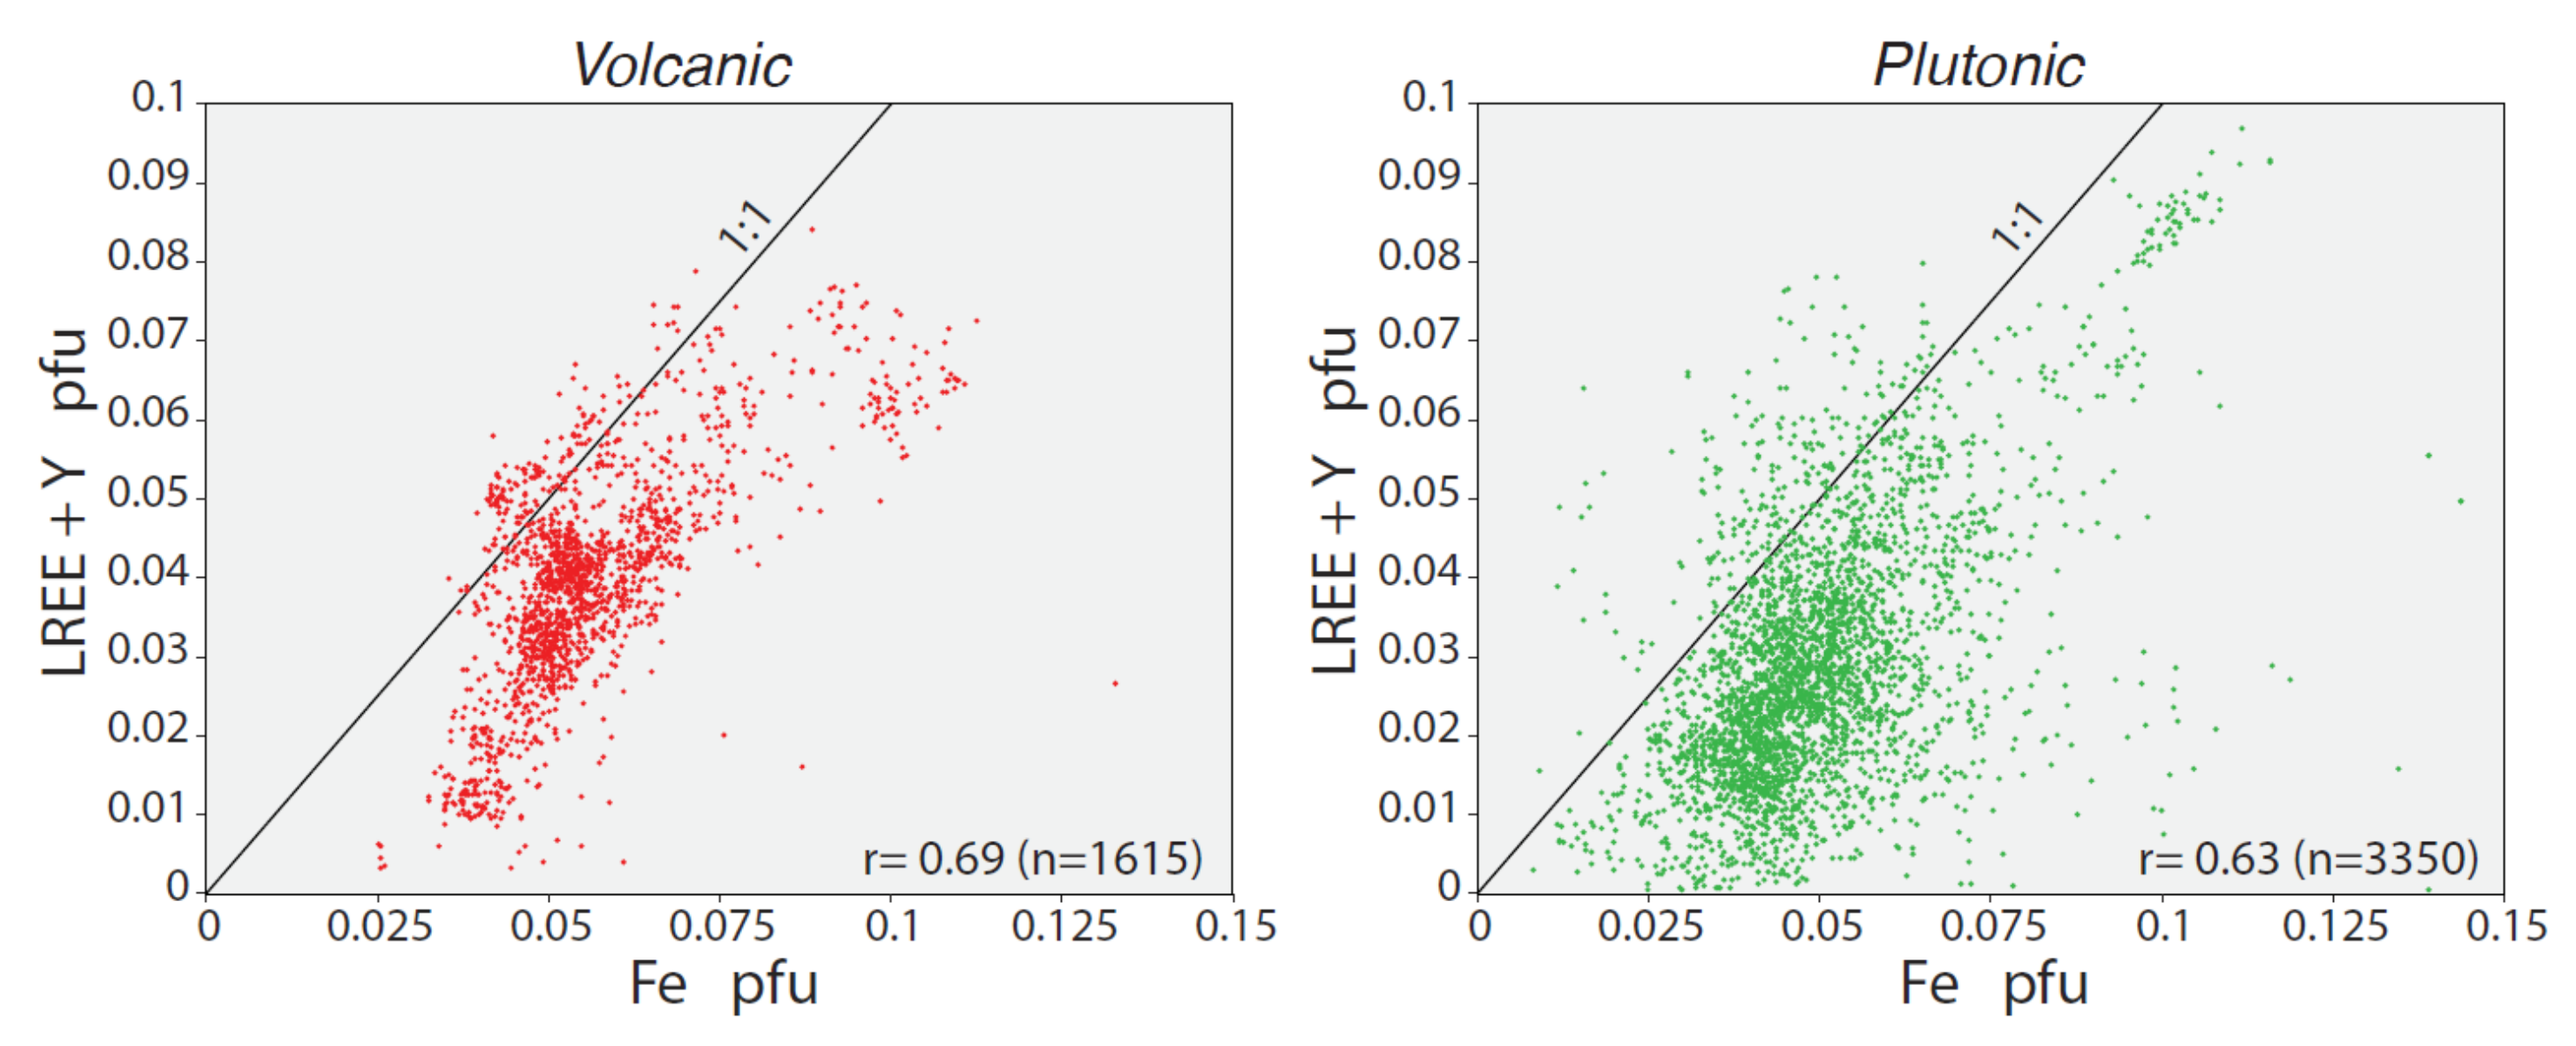
Unlike their Fe, Al, and F compositions, volcanic and plutonic titanite have the largest spread of REE and Y contents when compared to titanite from other environments.
(6)
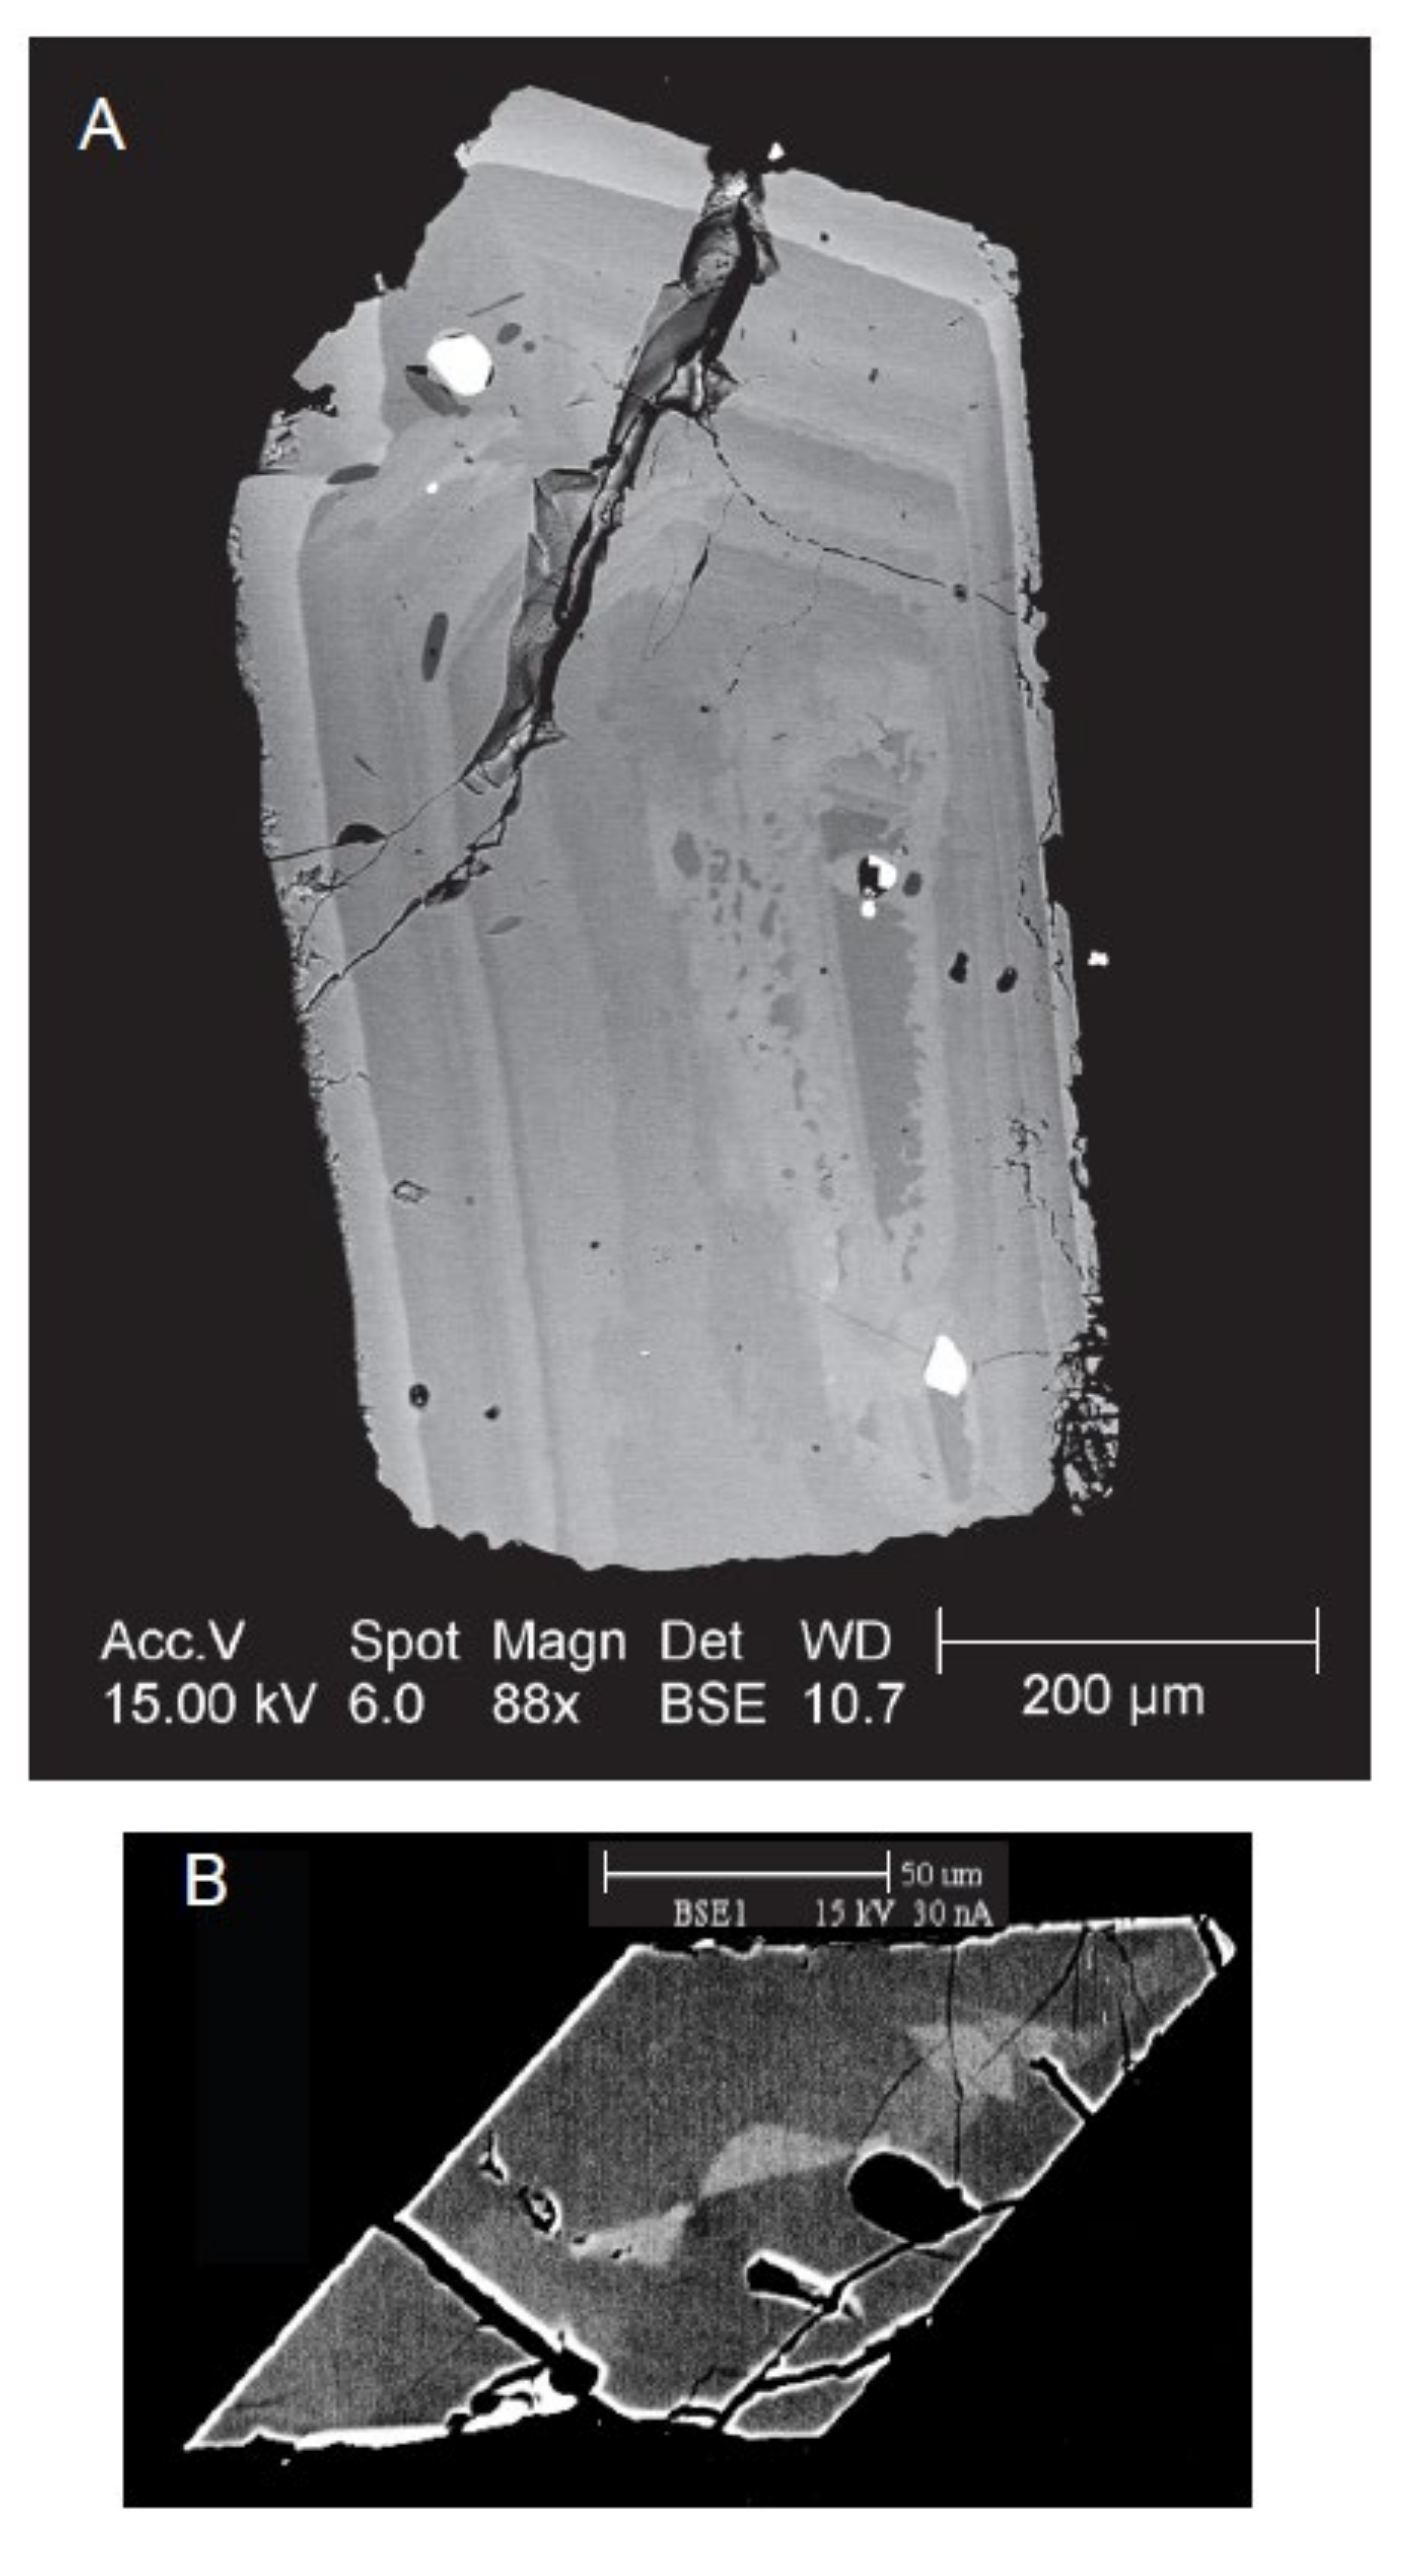
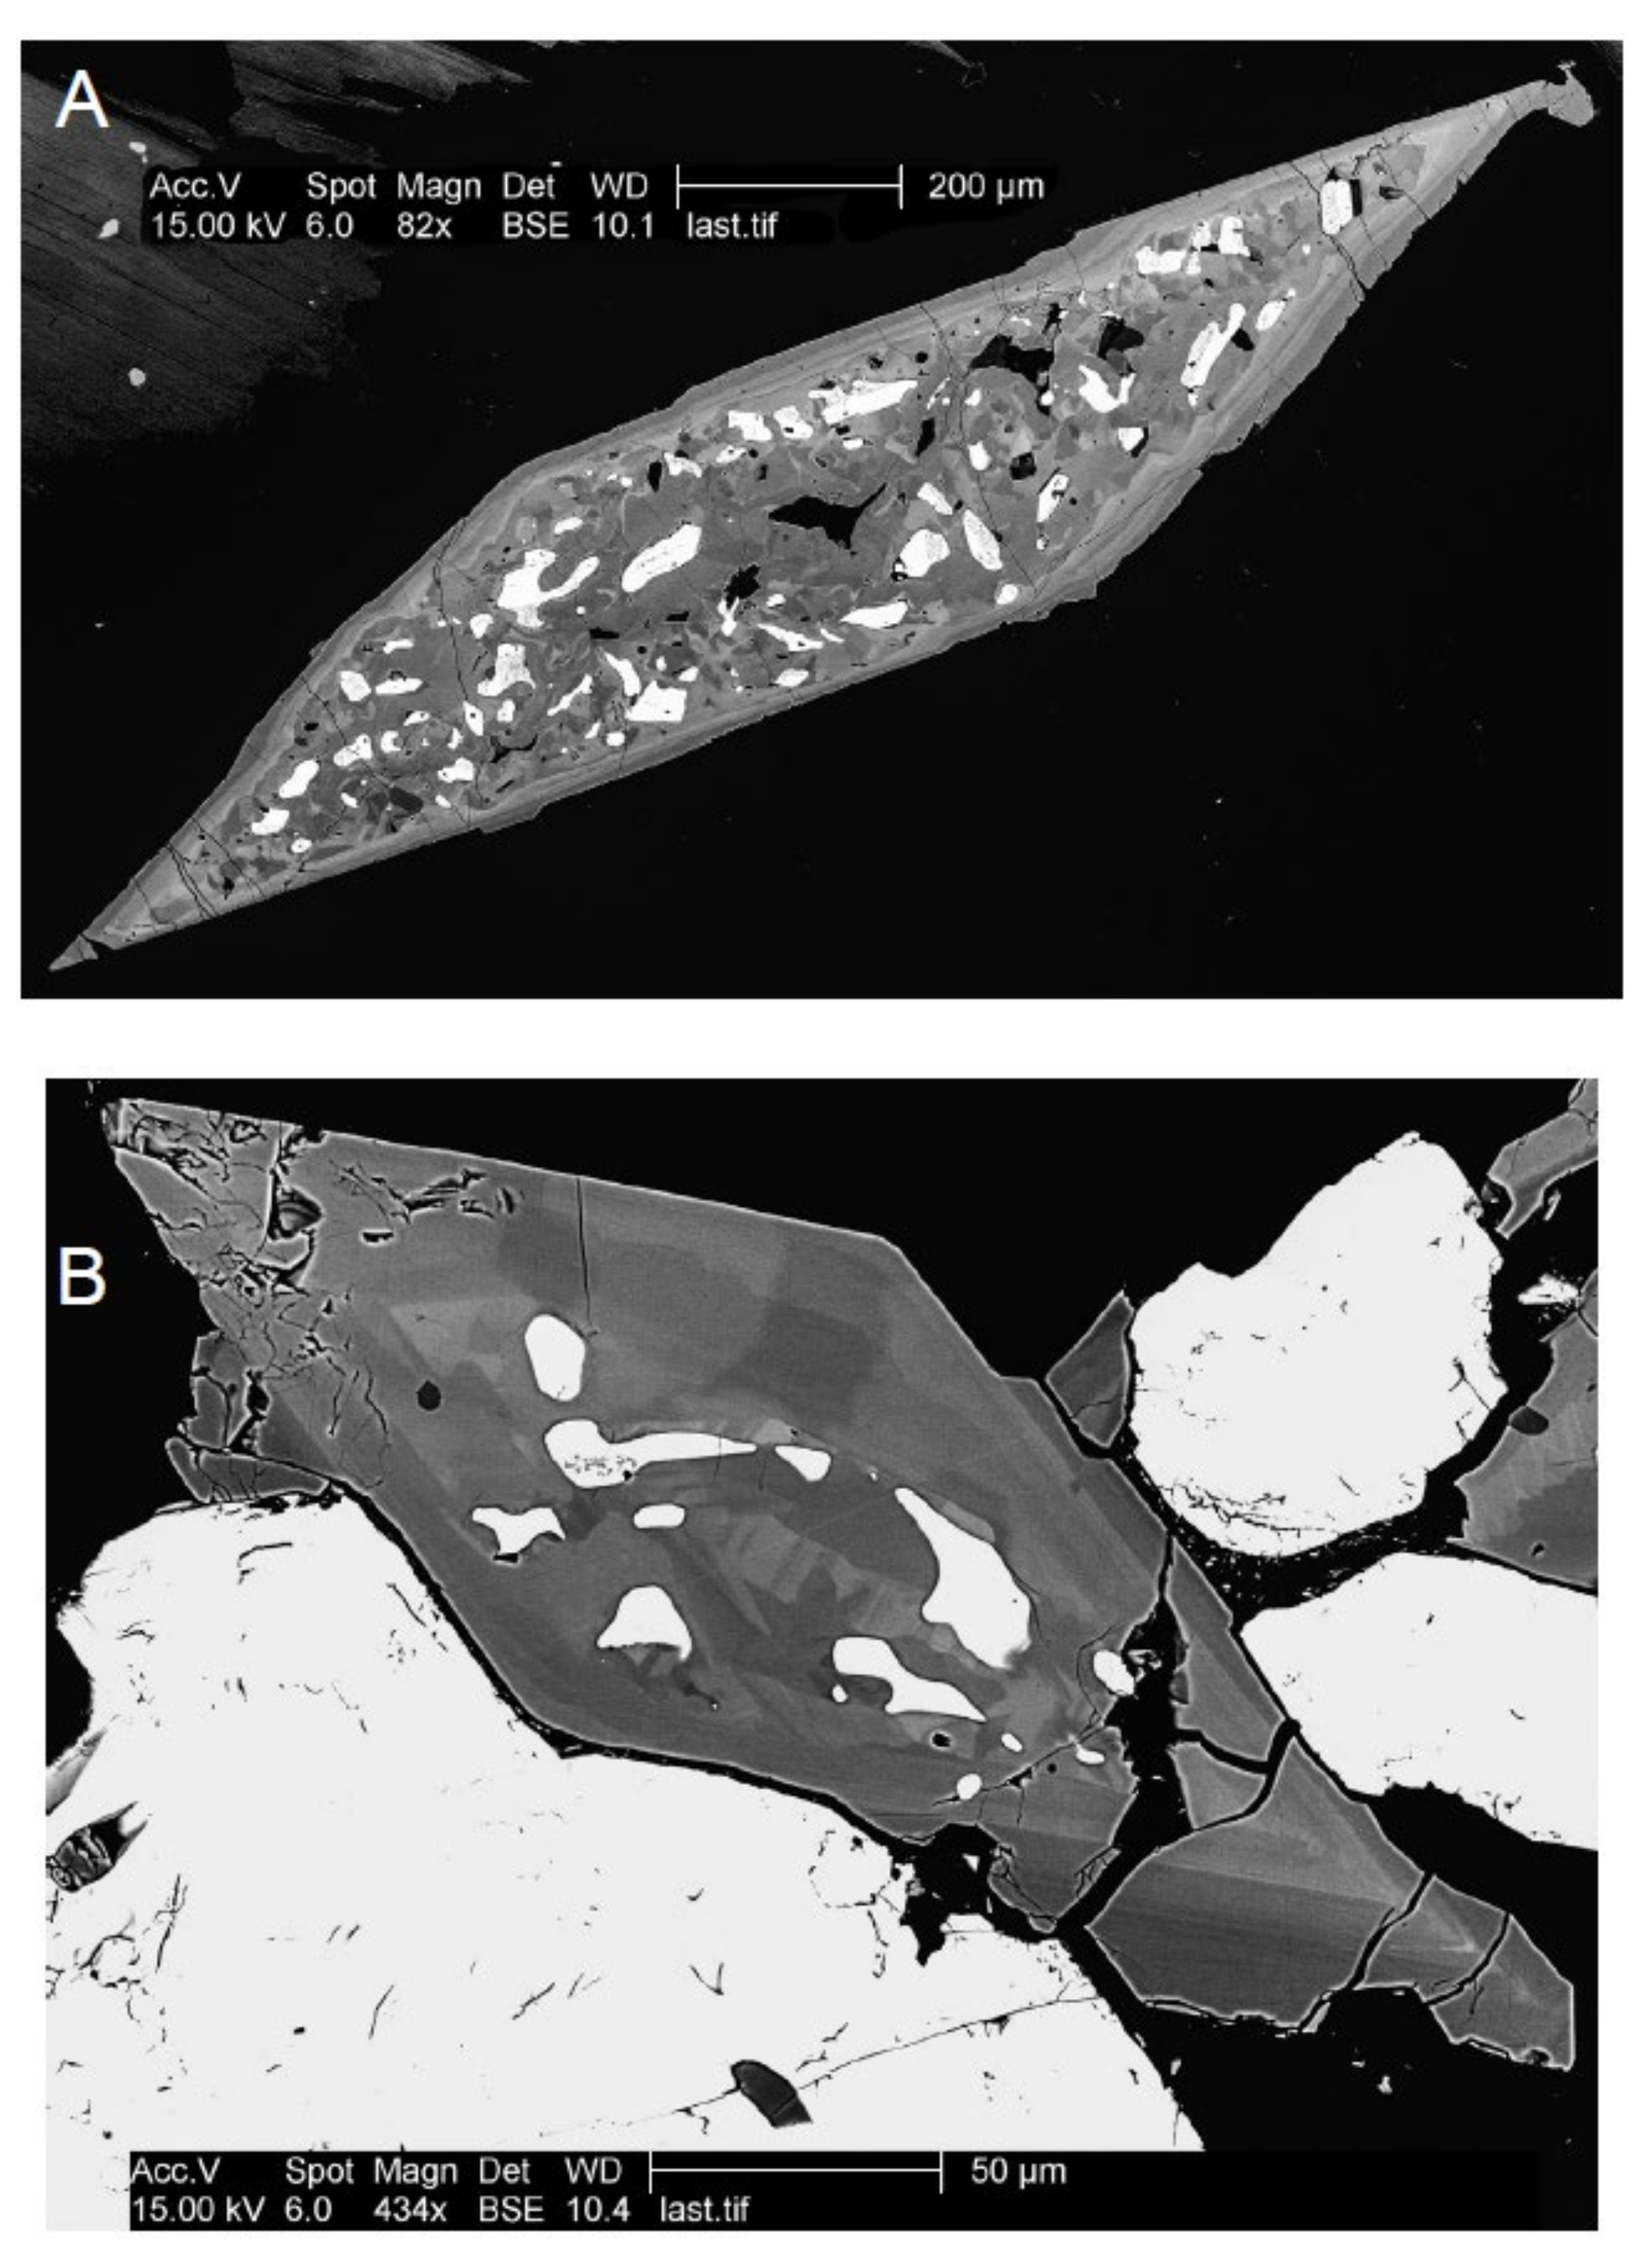
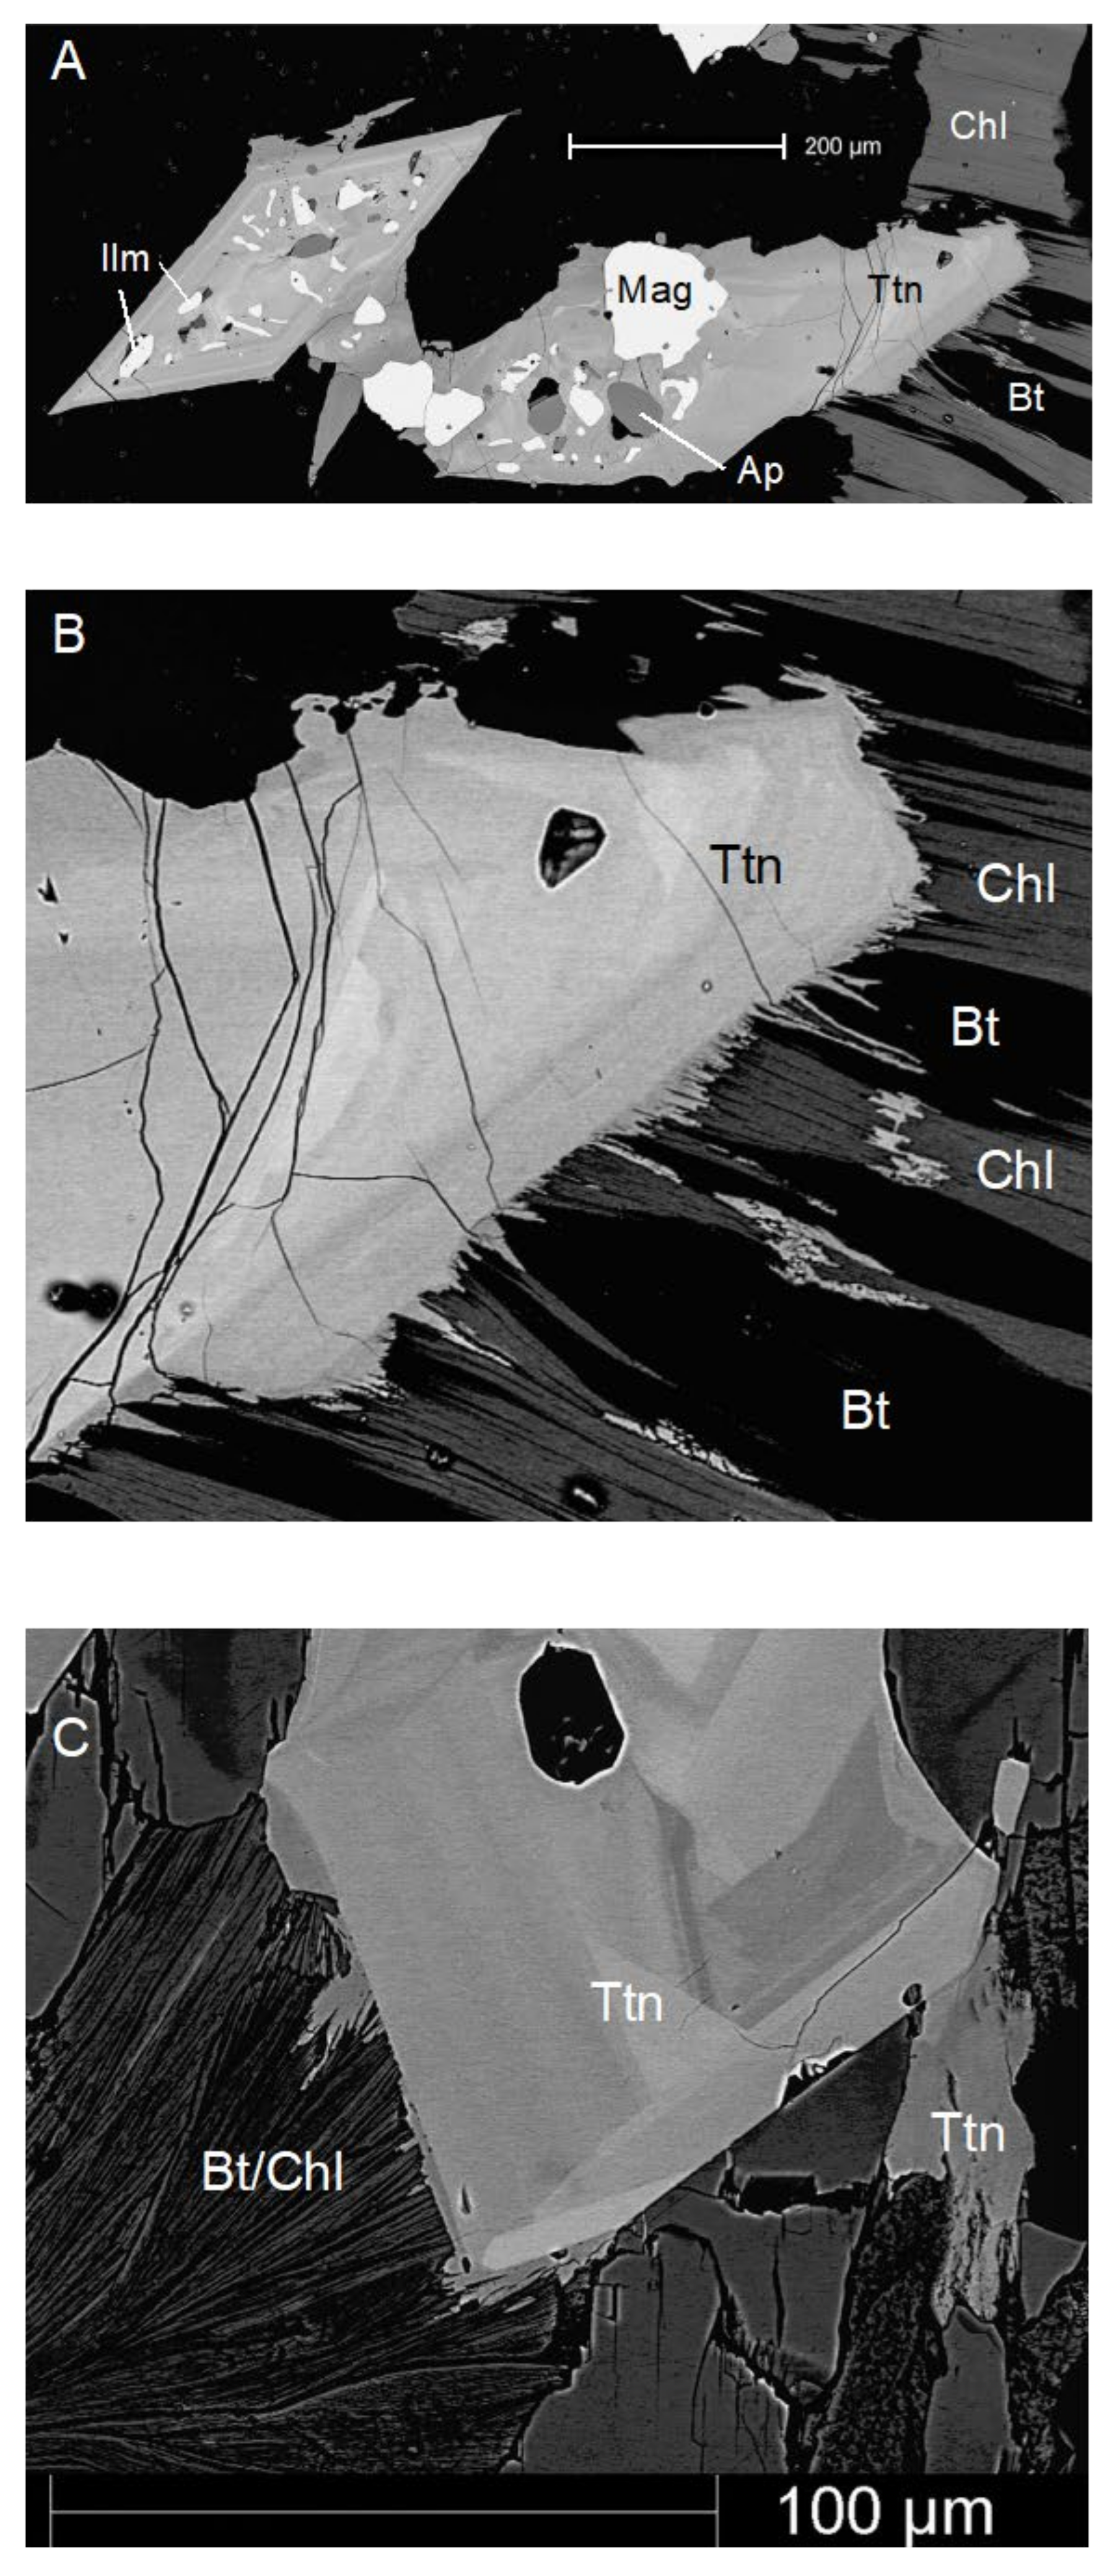
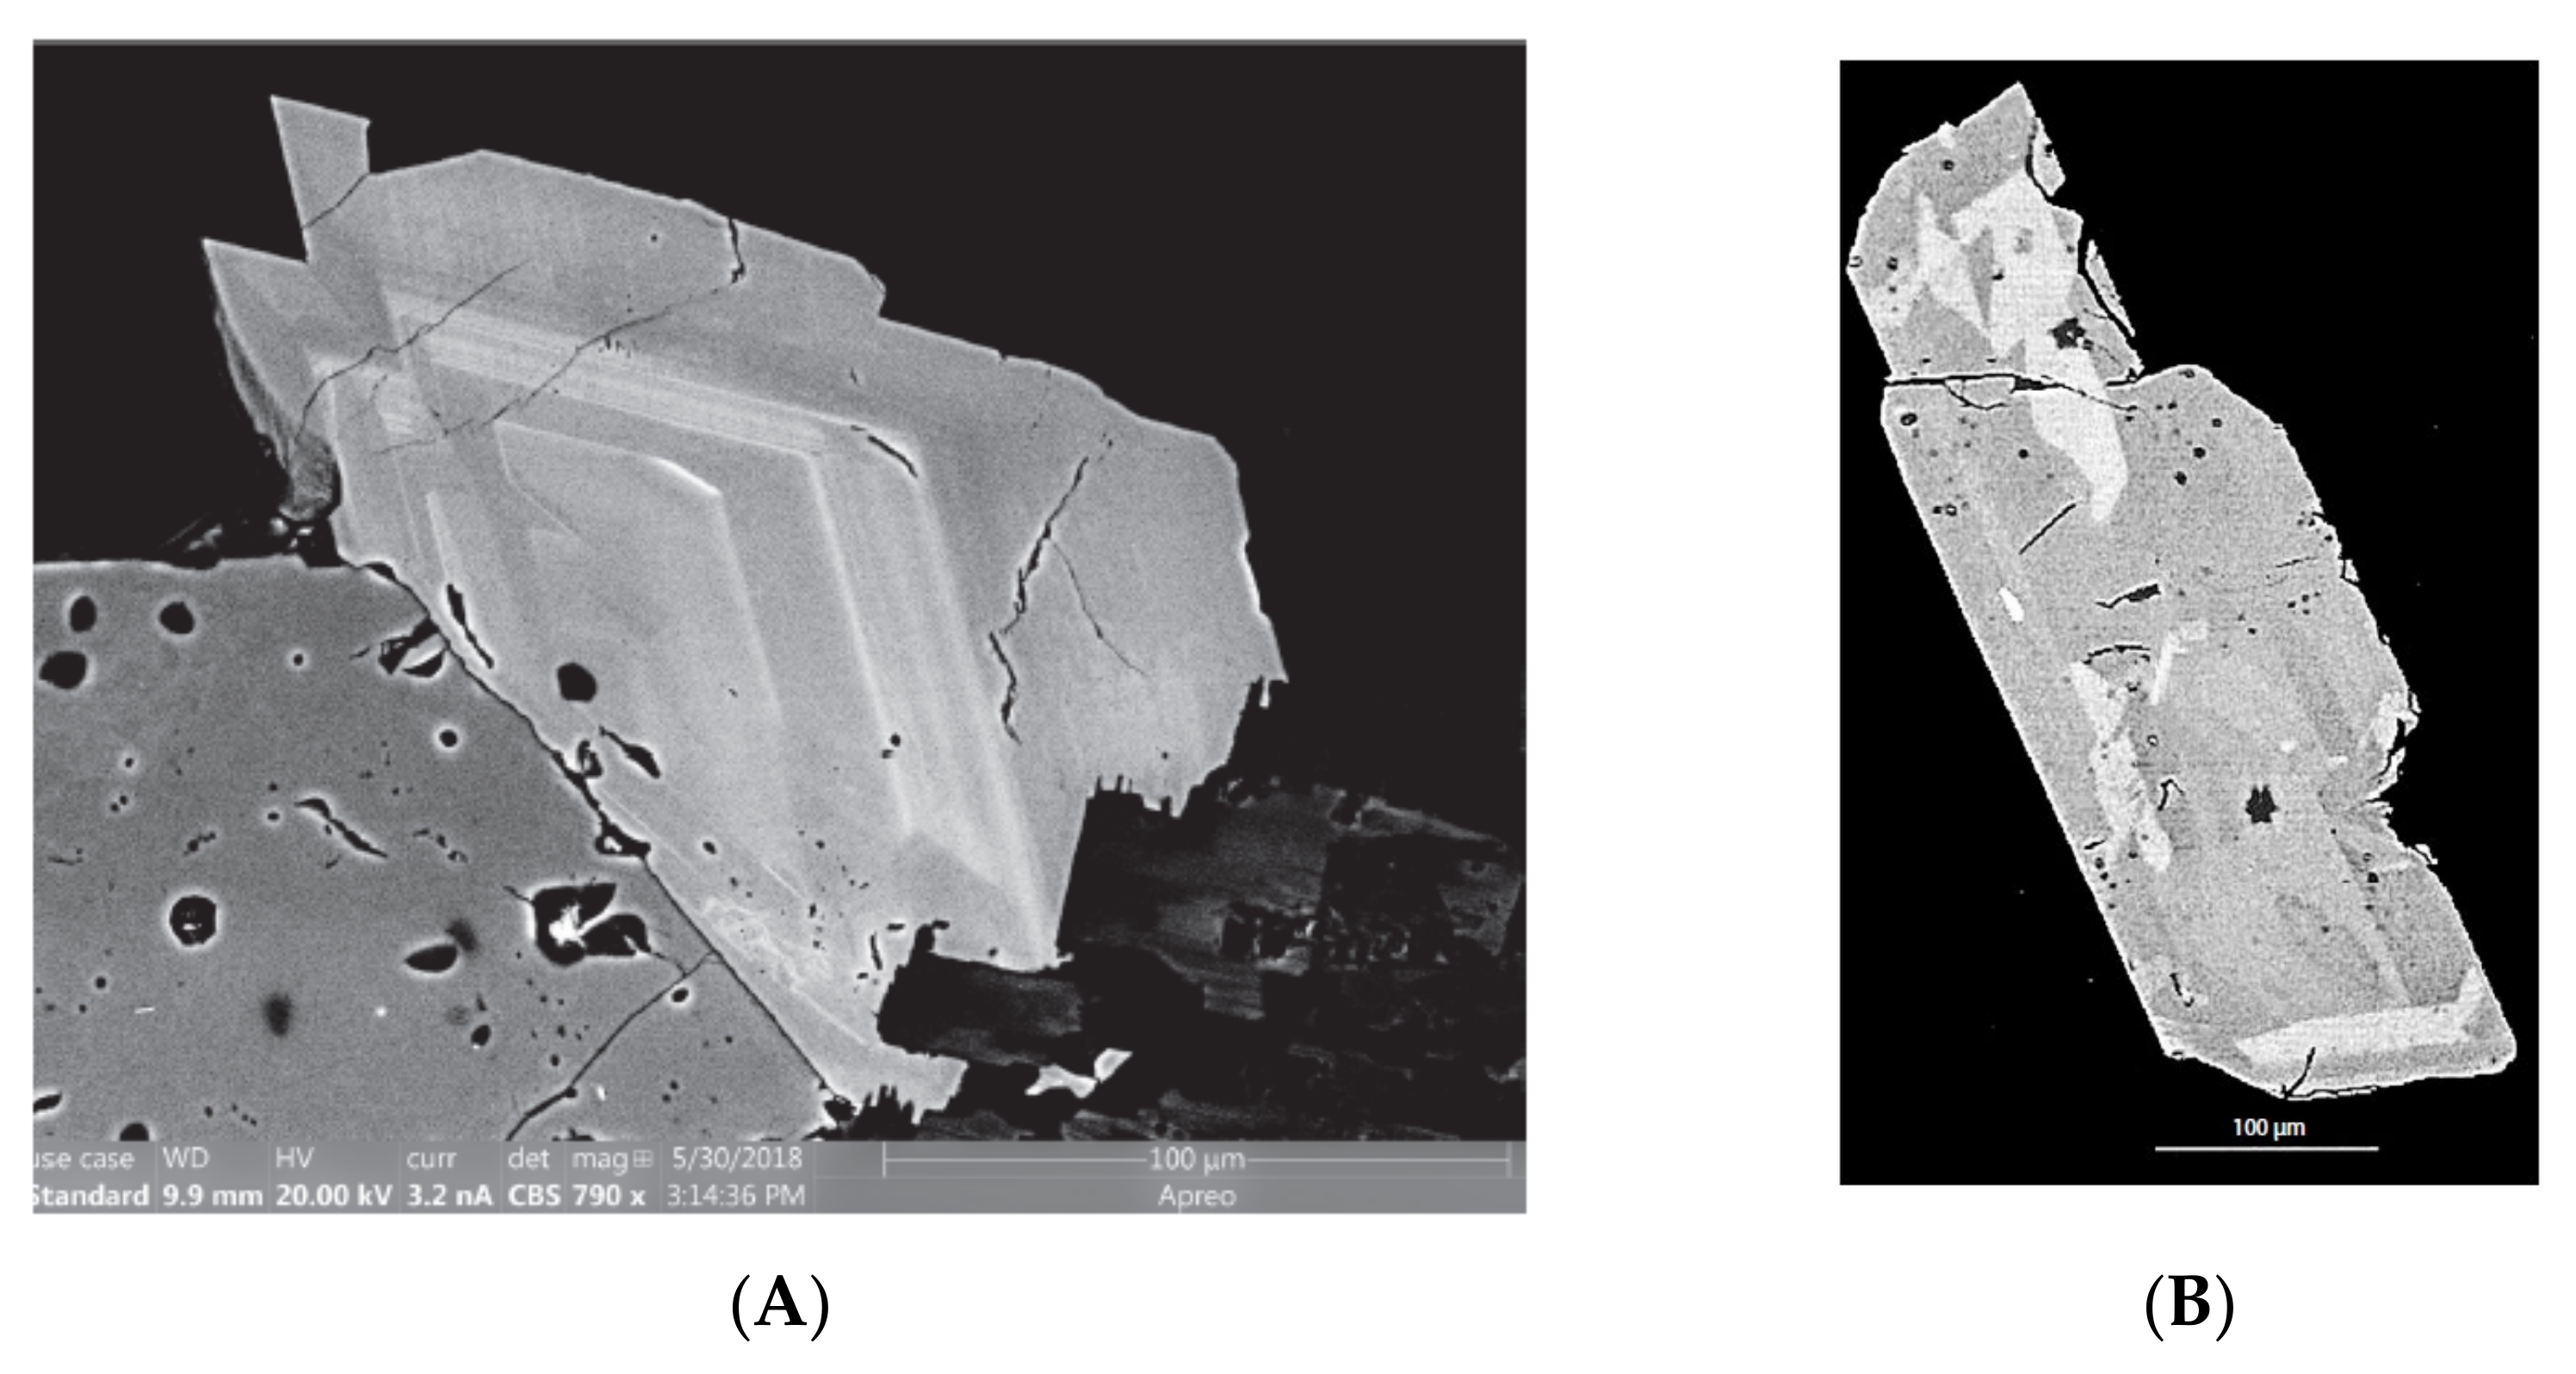
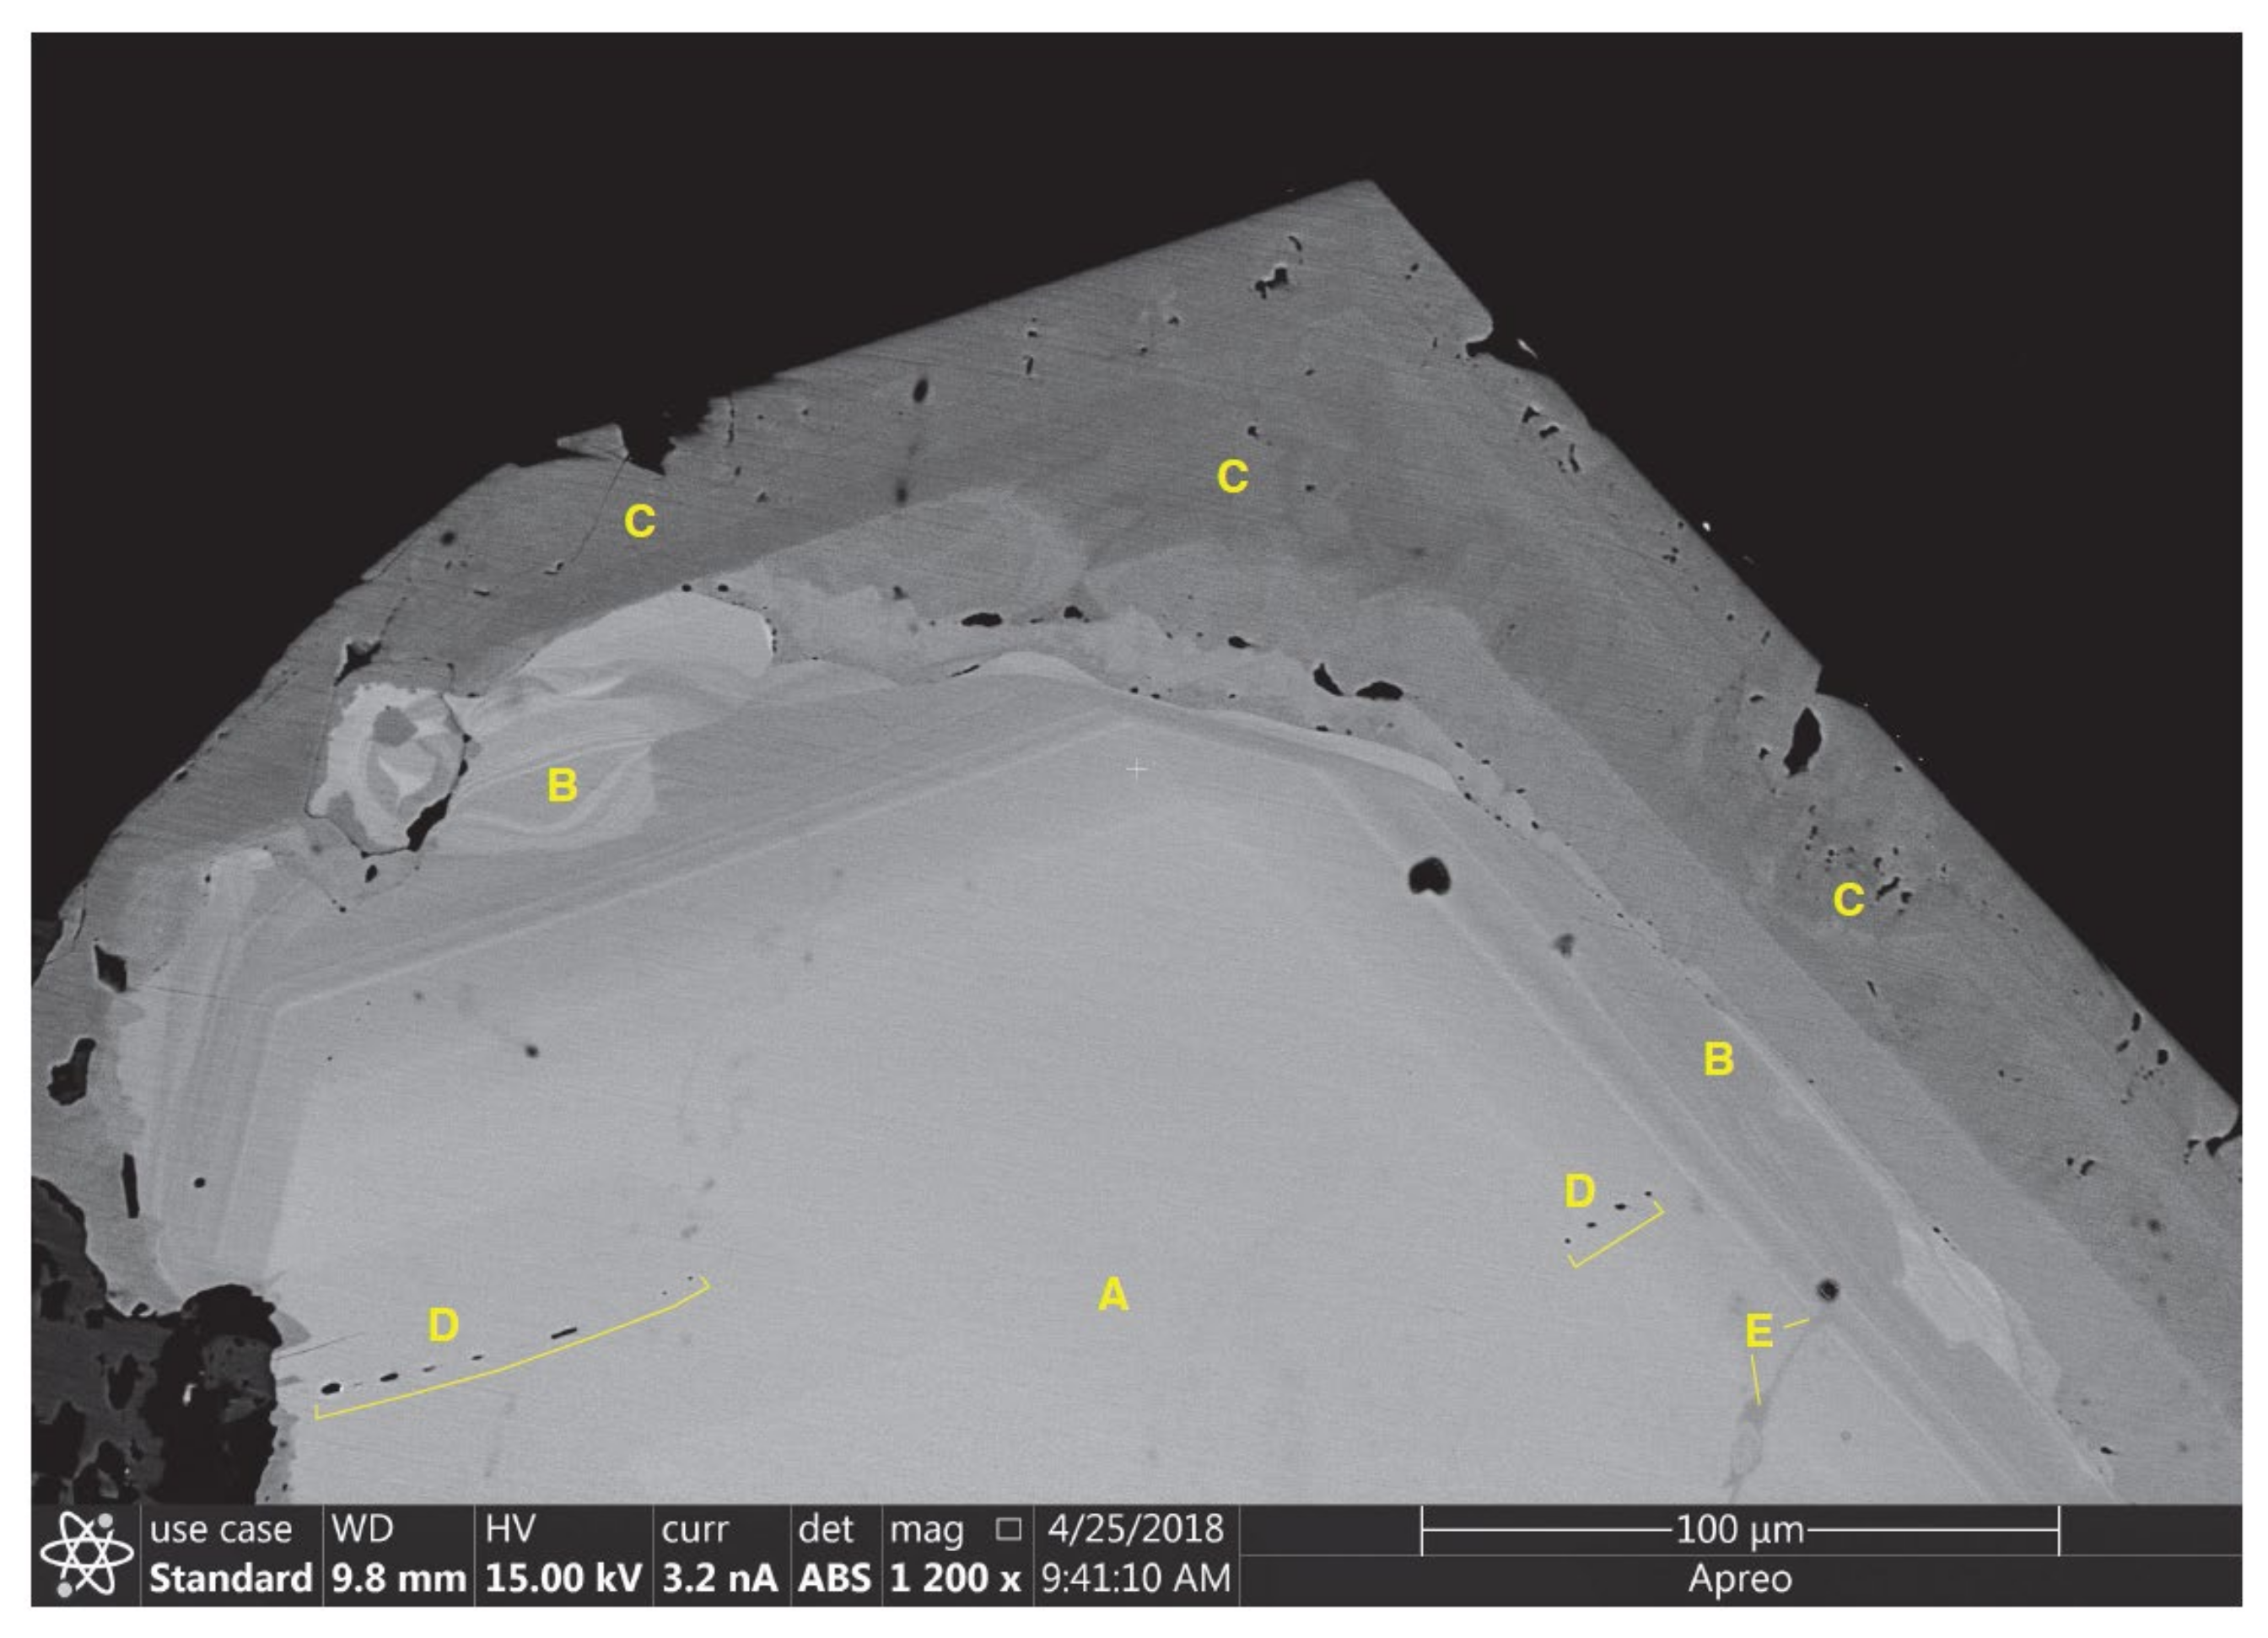
Most primary volcanic and plutonic titanite grains are euhedral and have prominent (111) crystal faces, giving them their typical wedge or diamond shape while metamorphic titanite grains are typically less angular with a podlike shape.
(7)
Fe/Al ratios in titanite from silica-undersaturated volcanic and plutonic rocks are typically > 1:2. Although they overlap the field for normal volcanic and plutonic titanite, other elements (particularly high levels of Nb and low levels of Y) separate out titanite from these rocks.
(8)
Peralkaline rocks include titanite with the highest Fe/Al (typically > 2:1 and often much higher).
(9)
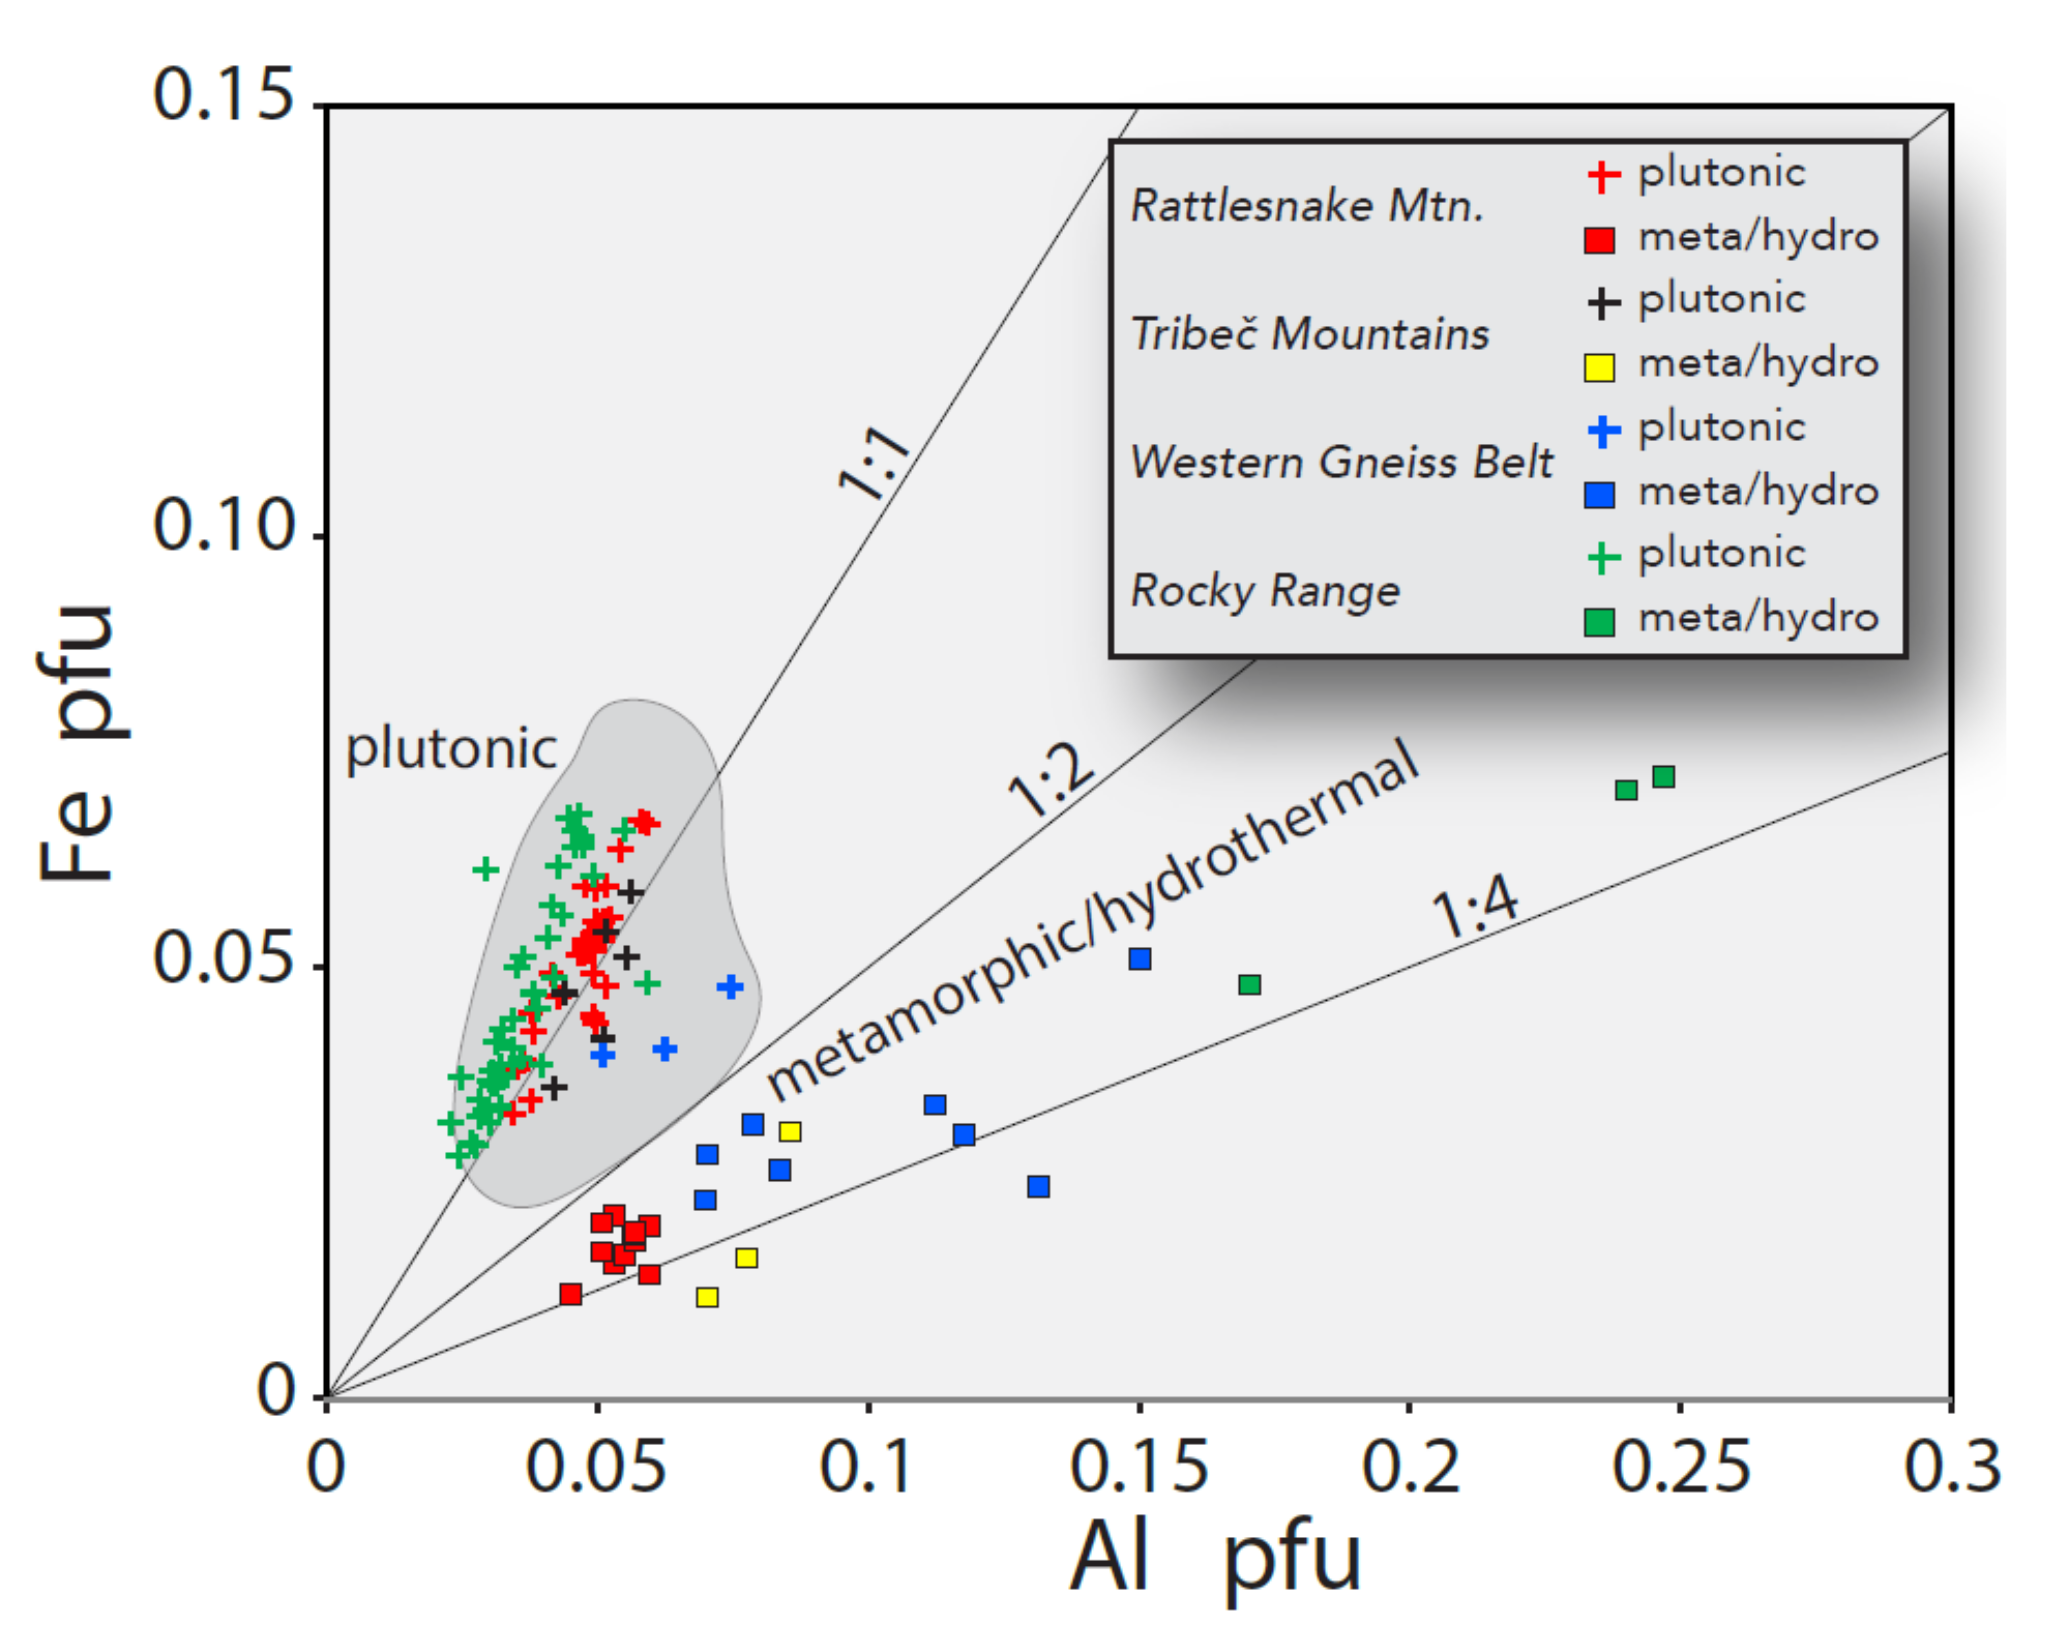
In most metamorphic rocks, the Fe/Al ratio in titanite is < 1:2 except for a few that have mafic and Fe-rich protoliths such as metabasalt or metabasite.
(10)
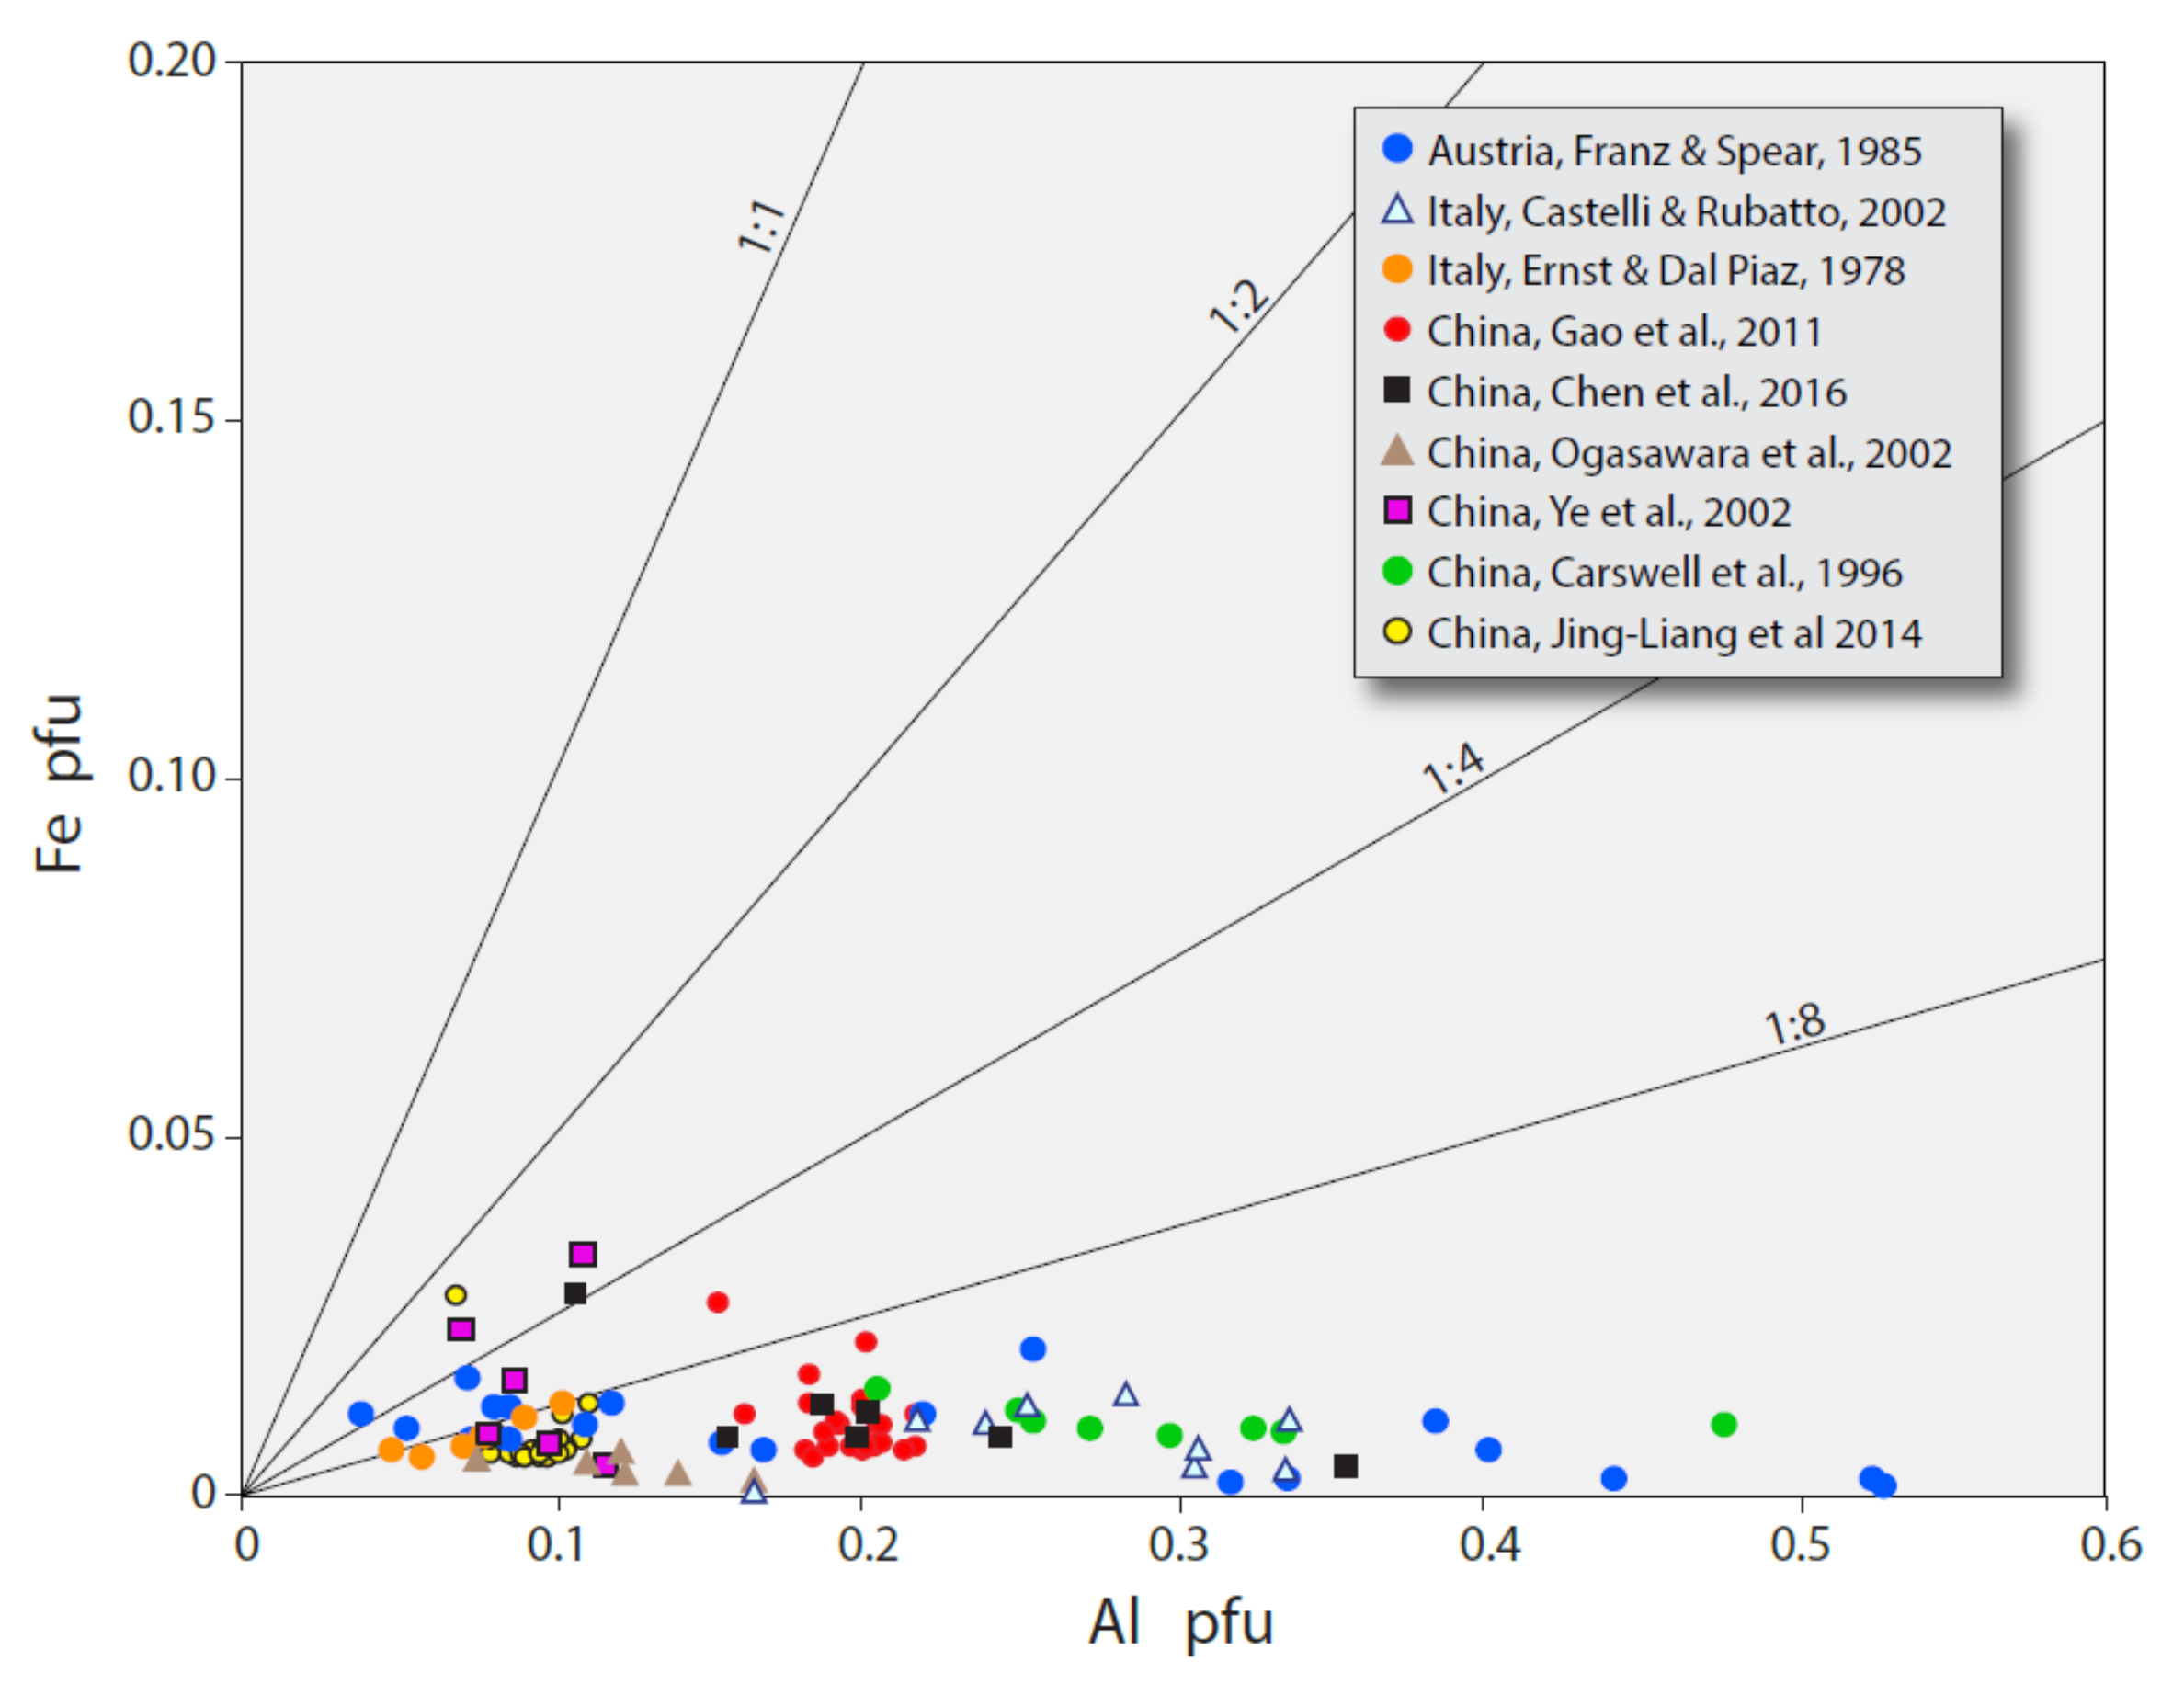
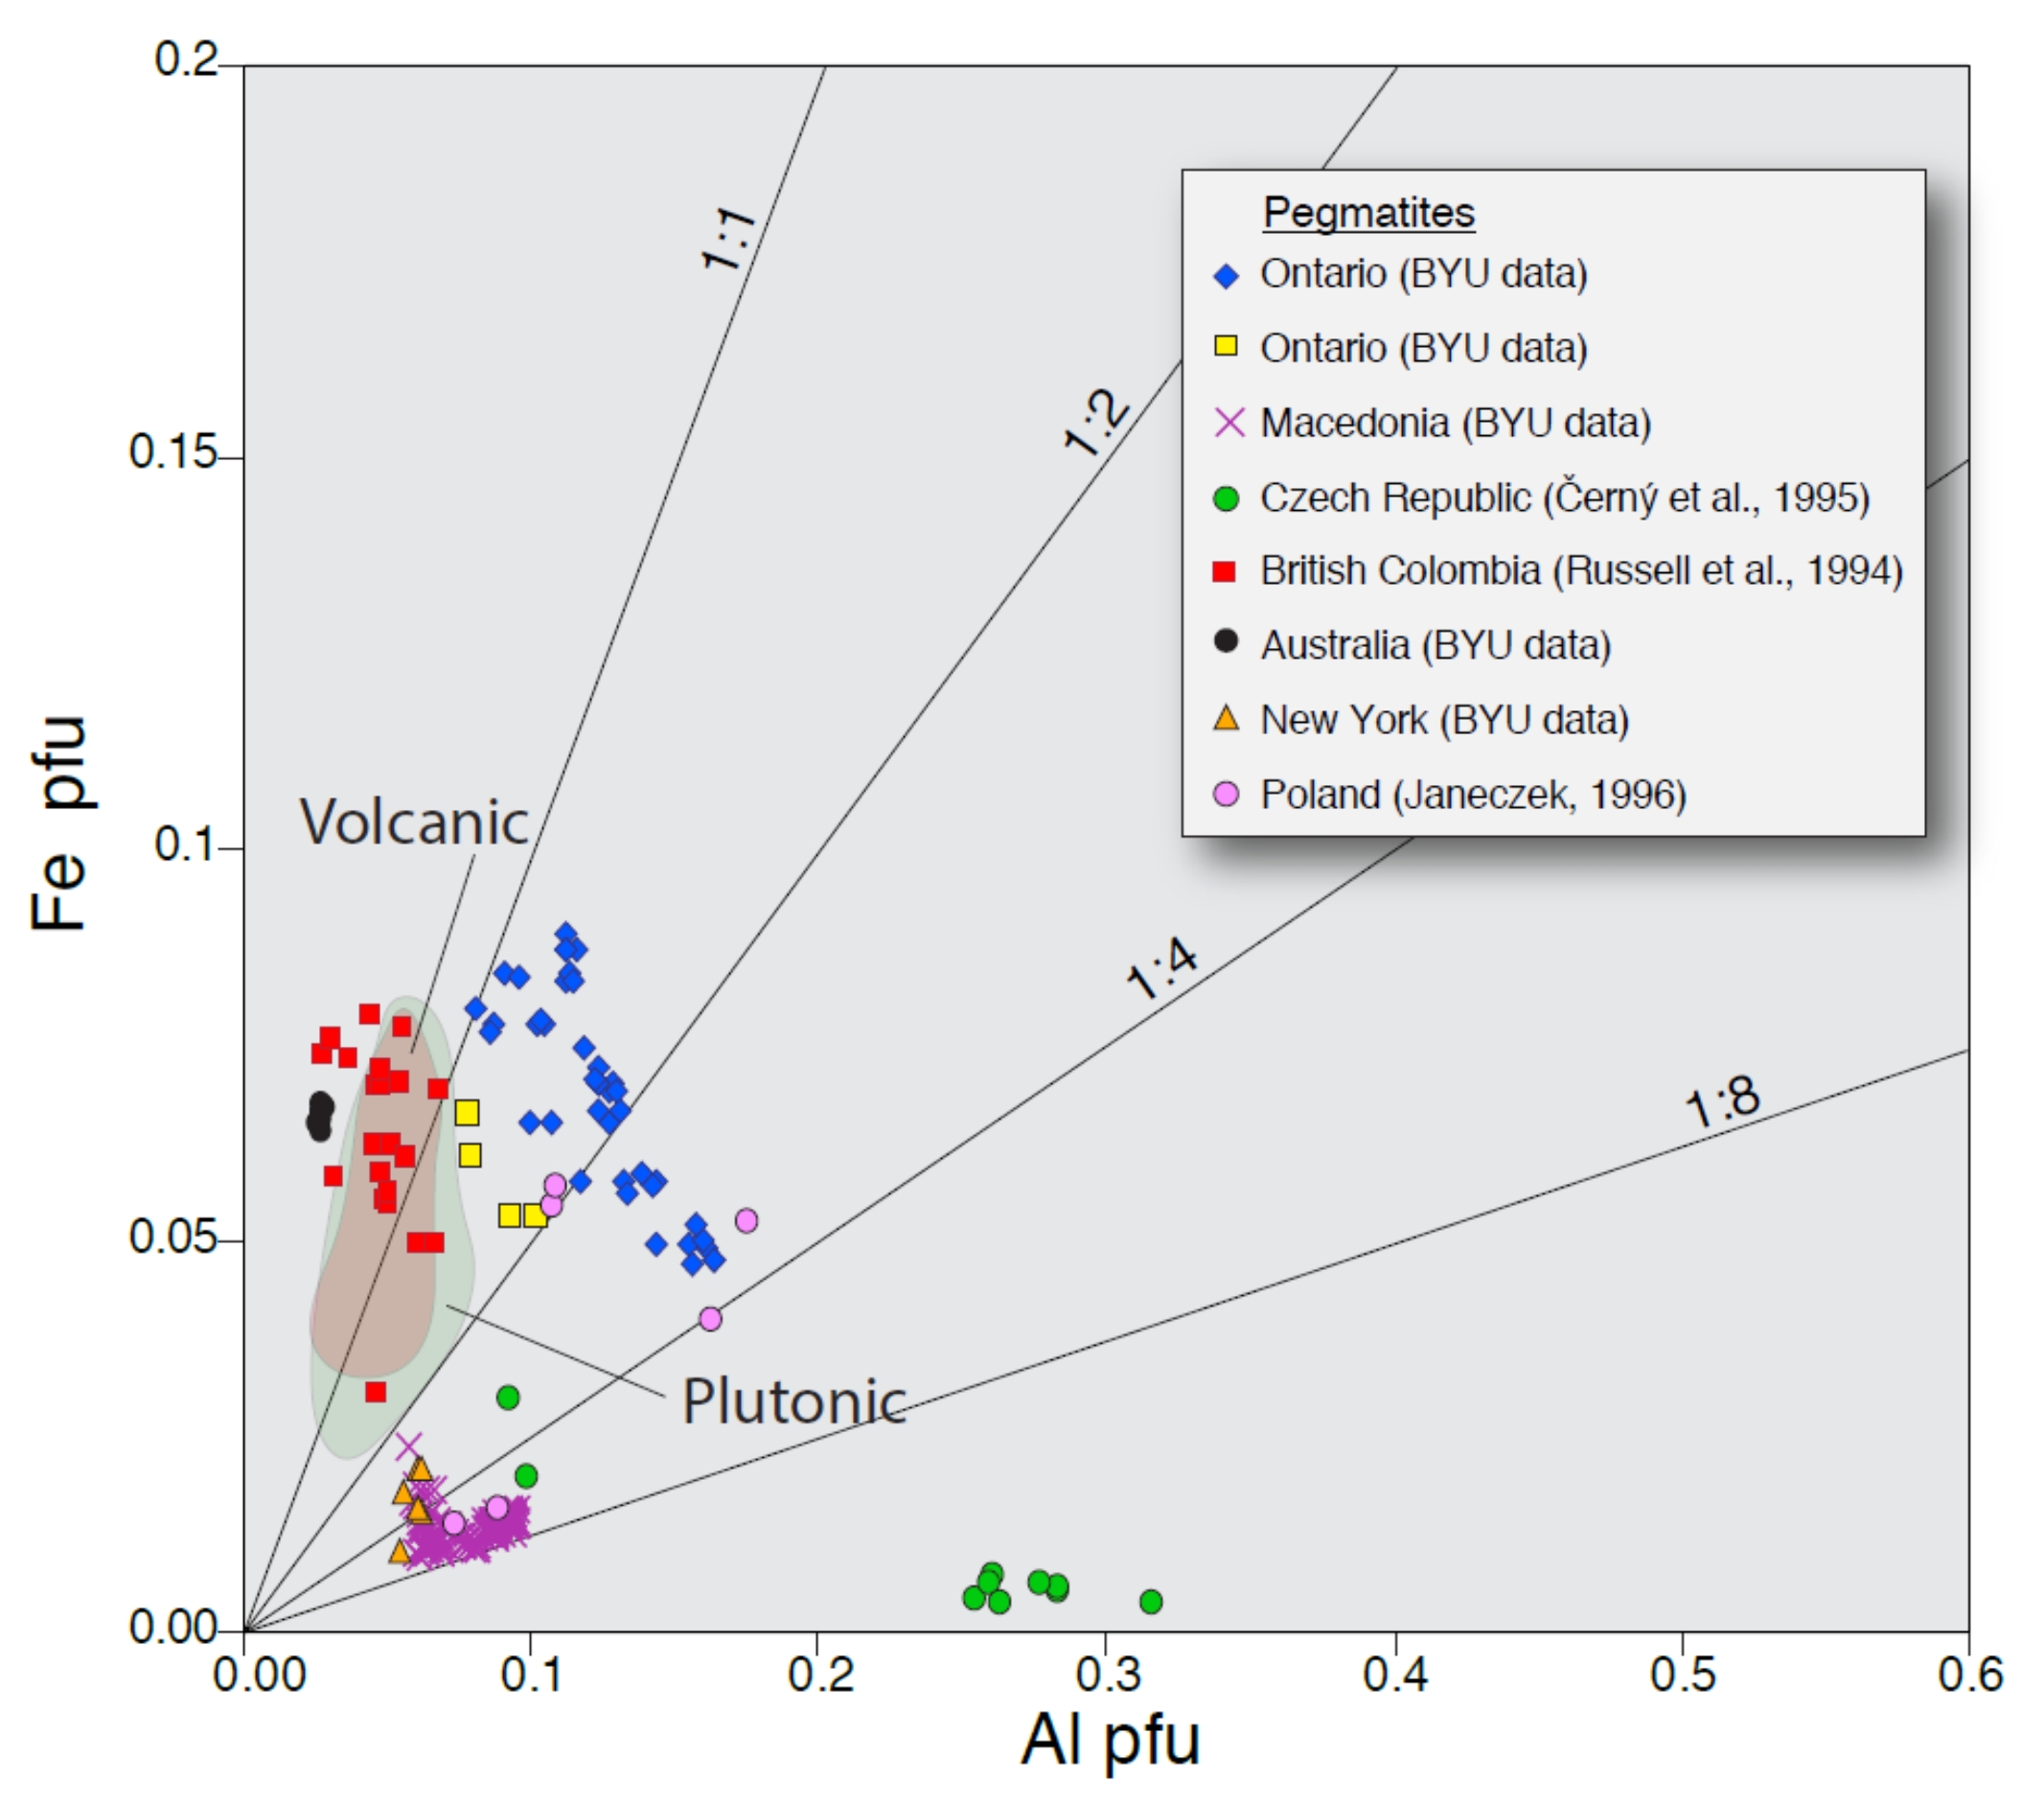
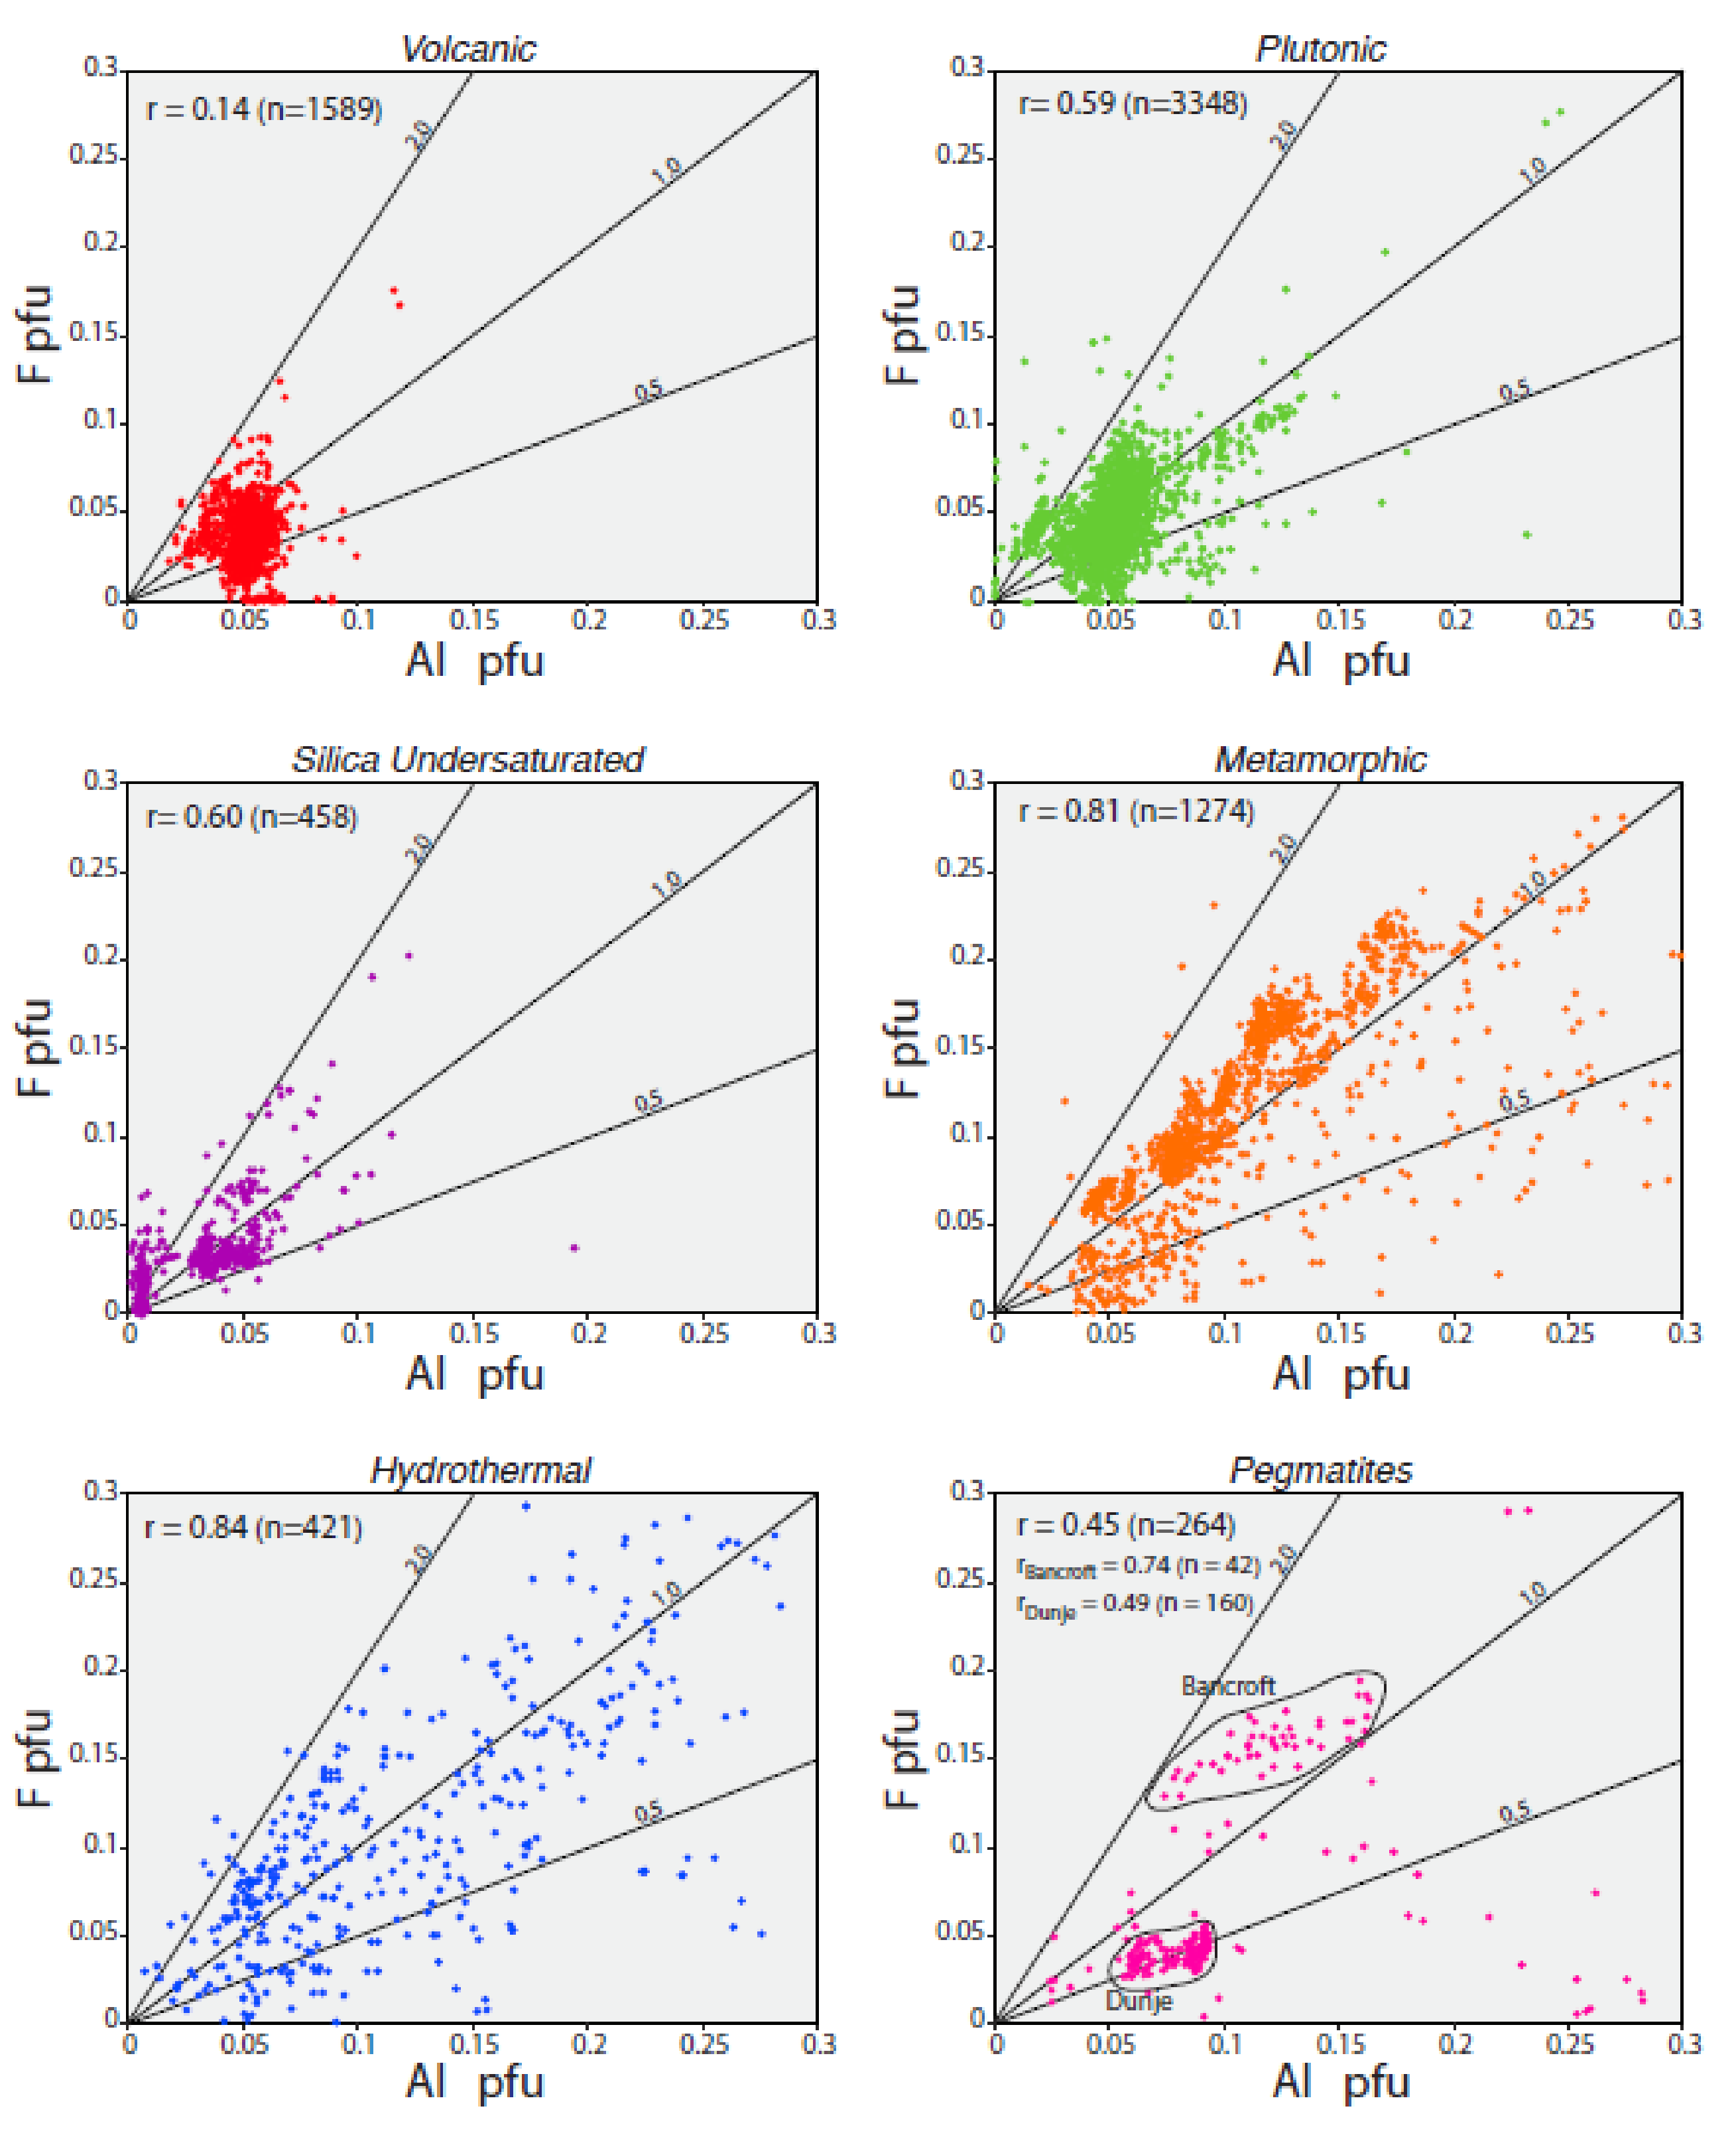
Titanite from high pressure metamorphic rocks (eclogites, blue schists, etc.) tends to have the lowest Fe/Al ratios, typically < 1:8. Apparently, Al-rich titanite is stable at higher pressures. However, some pegmatitic and hydrothermal titanite, including authigenic grains, also has Fe/Al in this low range.
(11)
Titanite from hydrothermal and pegmatitic environments scatters widely in terms of Fe/Al ratios even within single grains. This is likely due to crystallization from fluids with more variable compositions than is found in magmas and with a wider variety of oxidation conditions as seen particularly in the development of titanite in skarns. W-Mo skarns produce Al-rich titanite and magnetite skarns are dominated by Fe-rich titanite. Fluid composition and temperature in a hydrothermal environment may also change markedly due to a different water source flooding into the environment where the titanite crystals are forming, producing crystals with internally variable compositions.
(12)
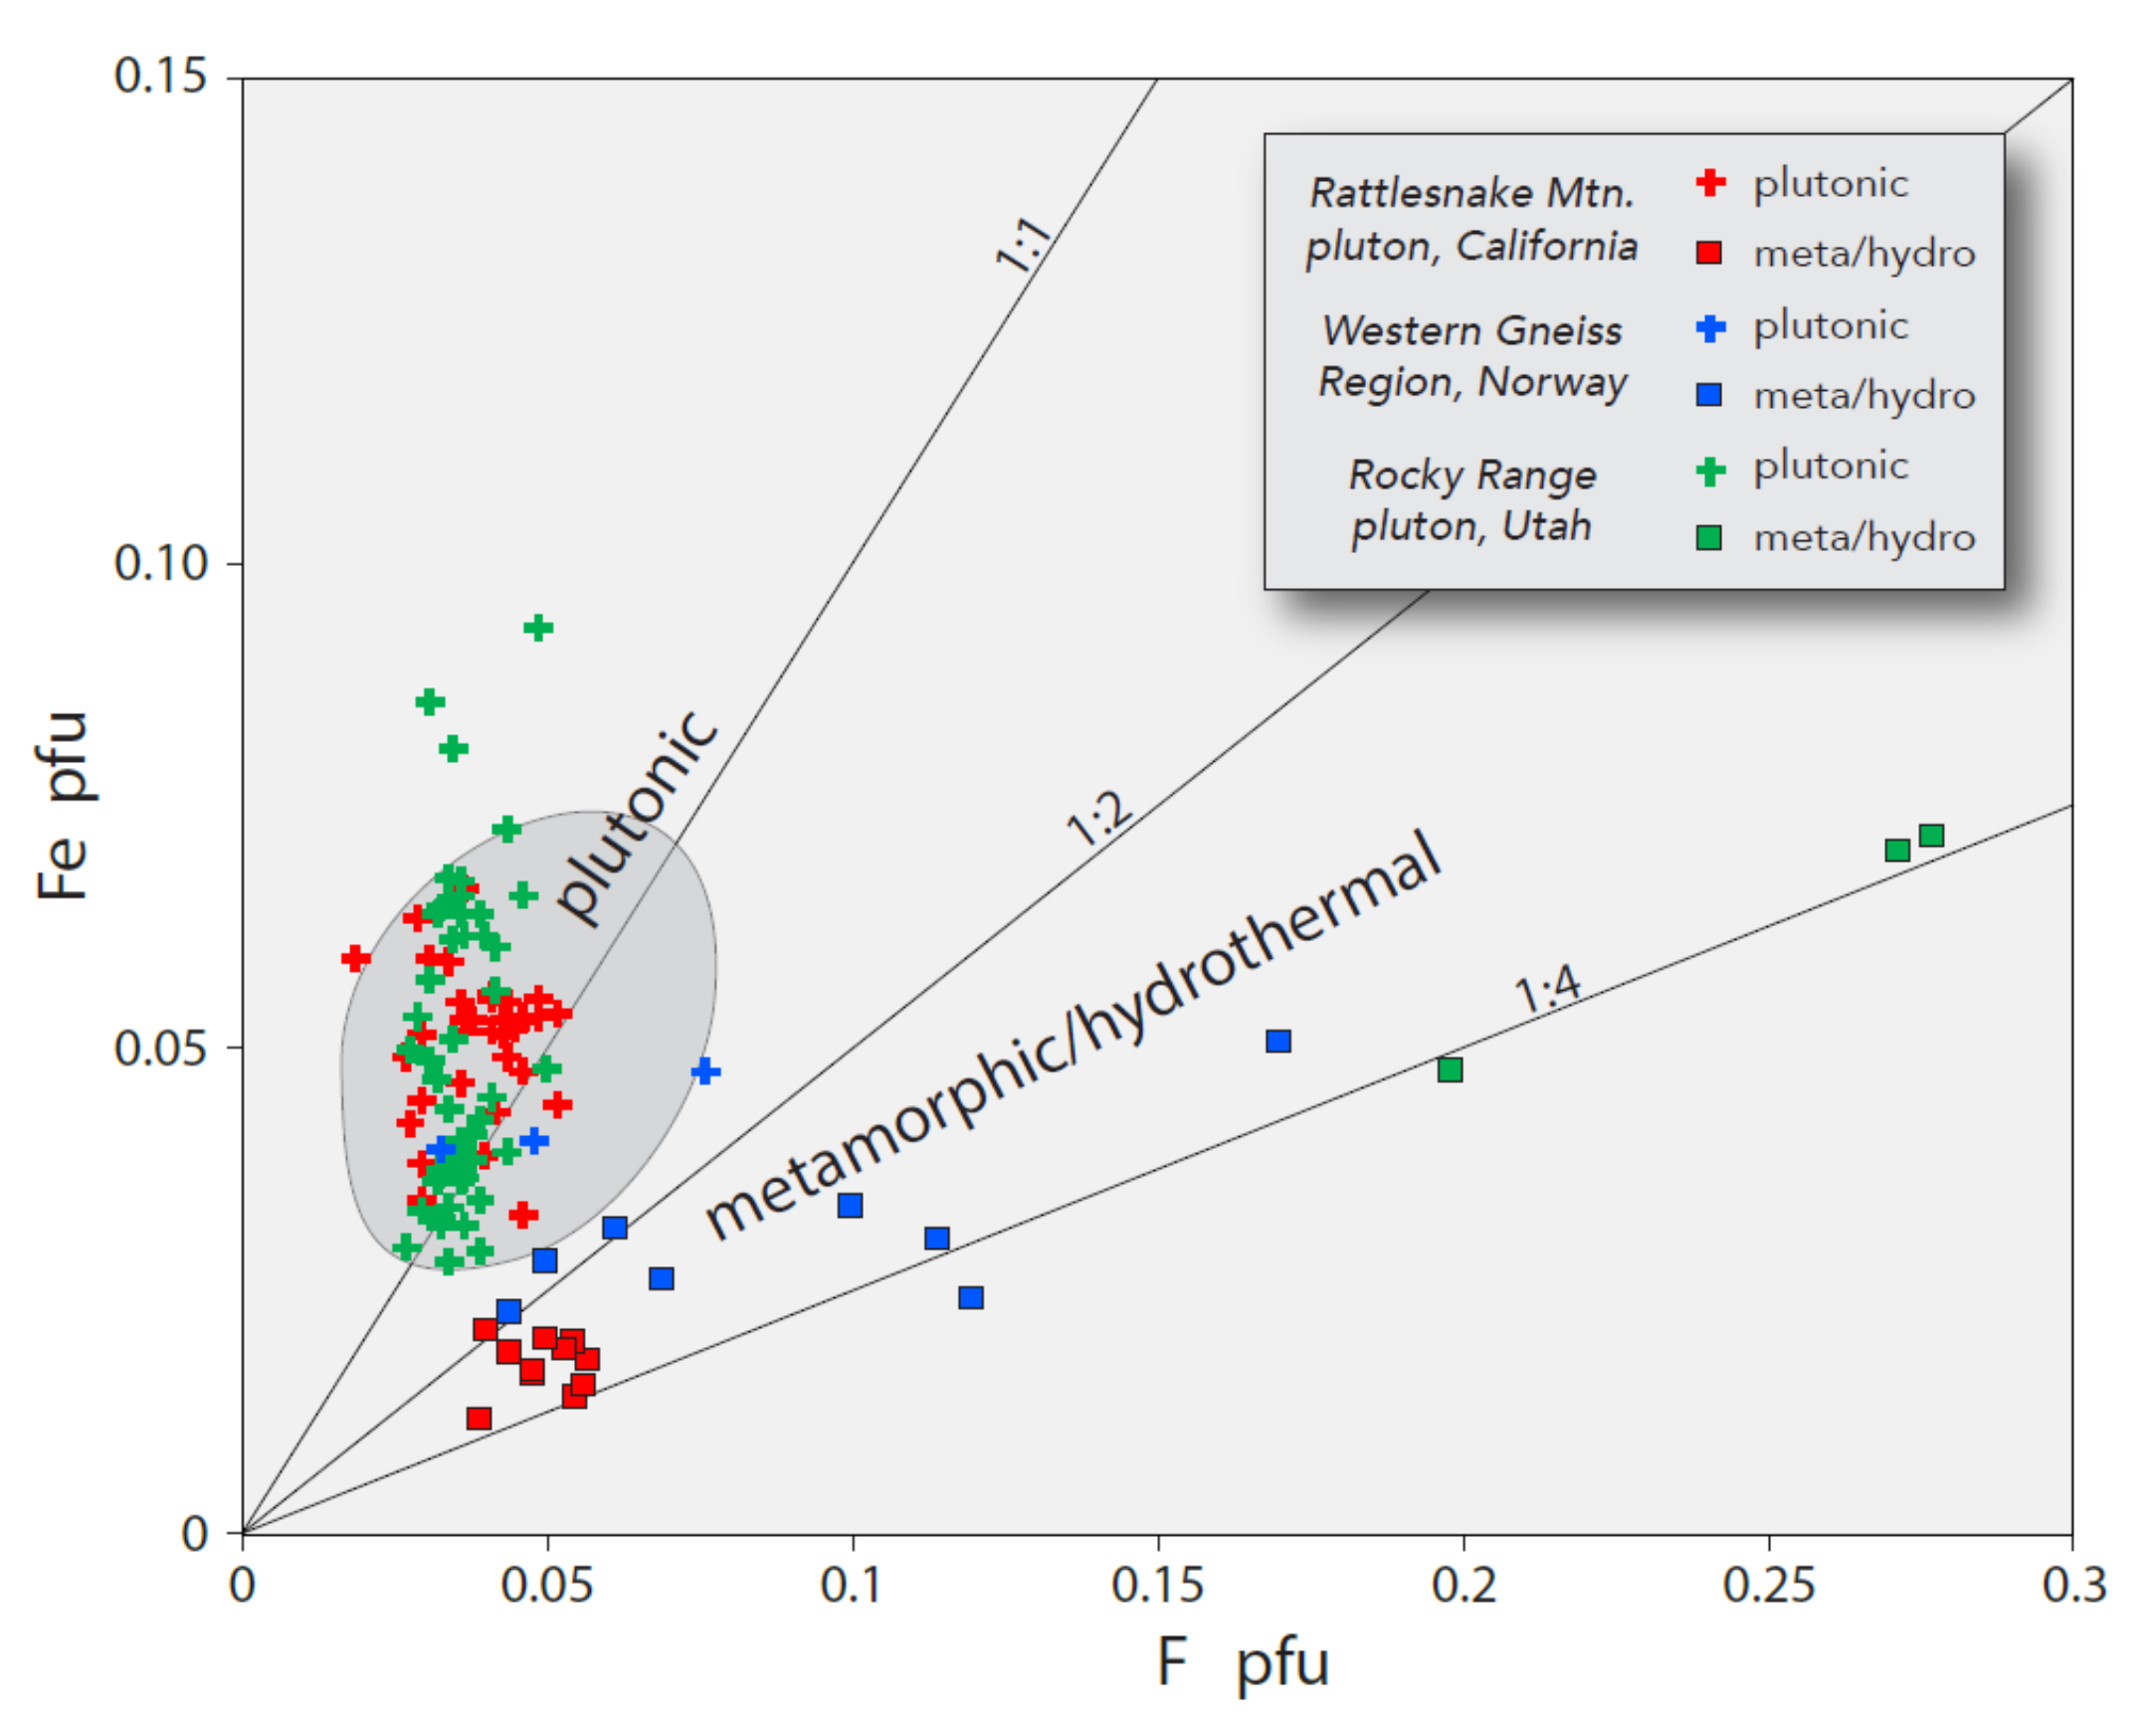
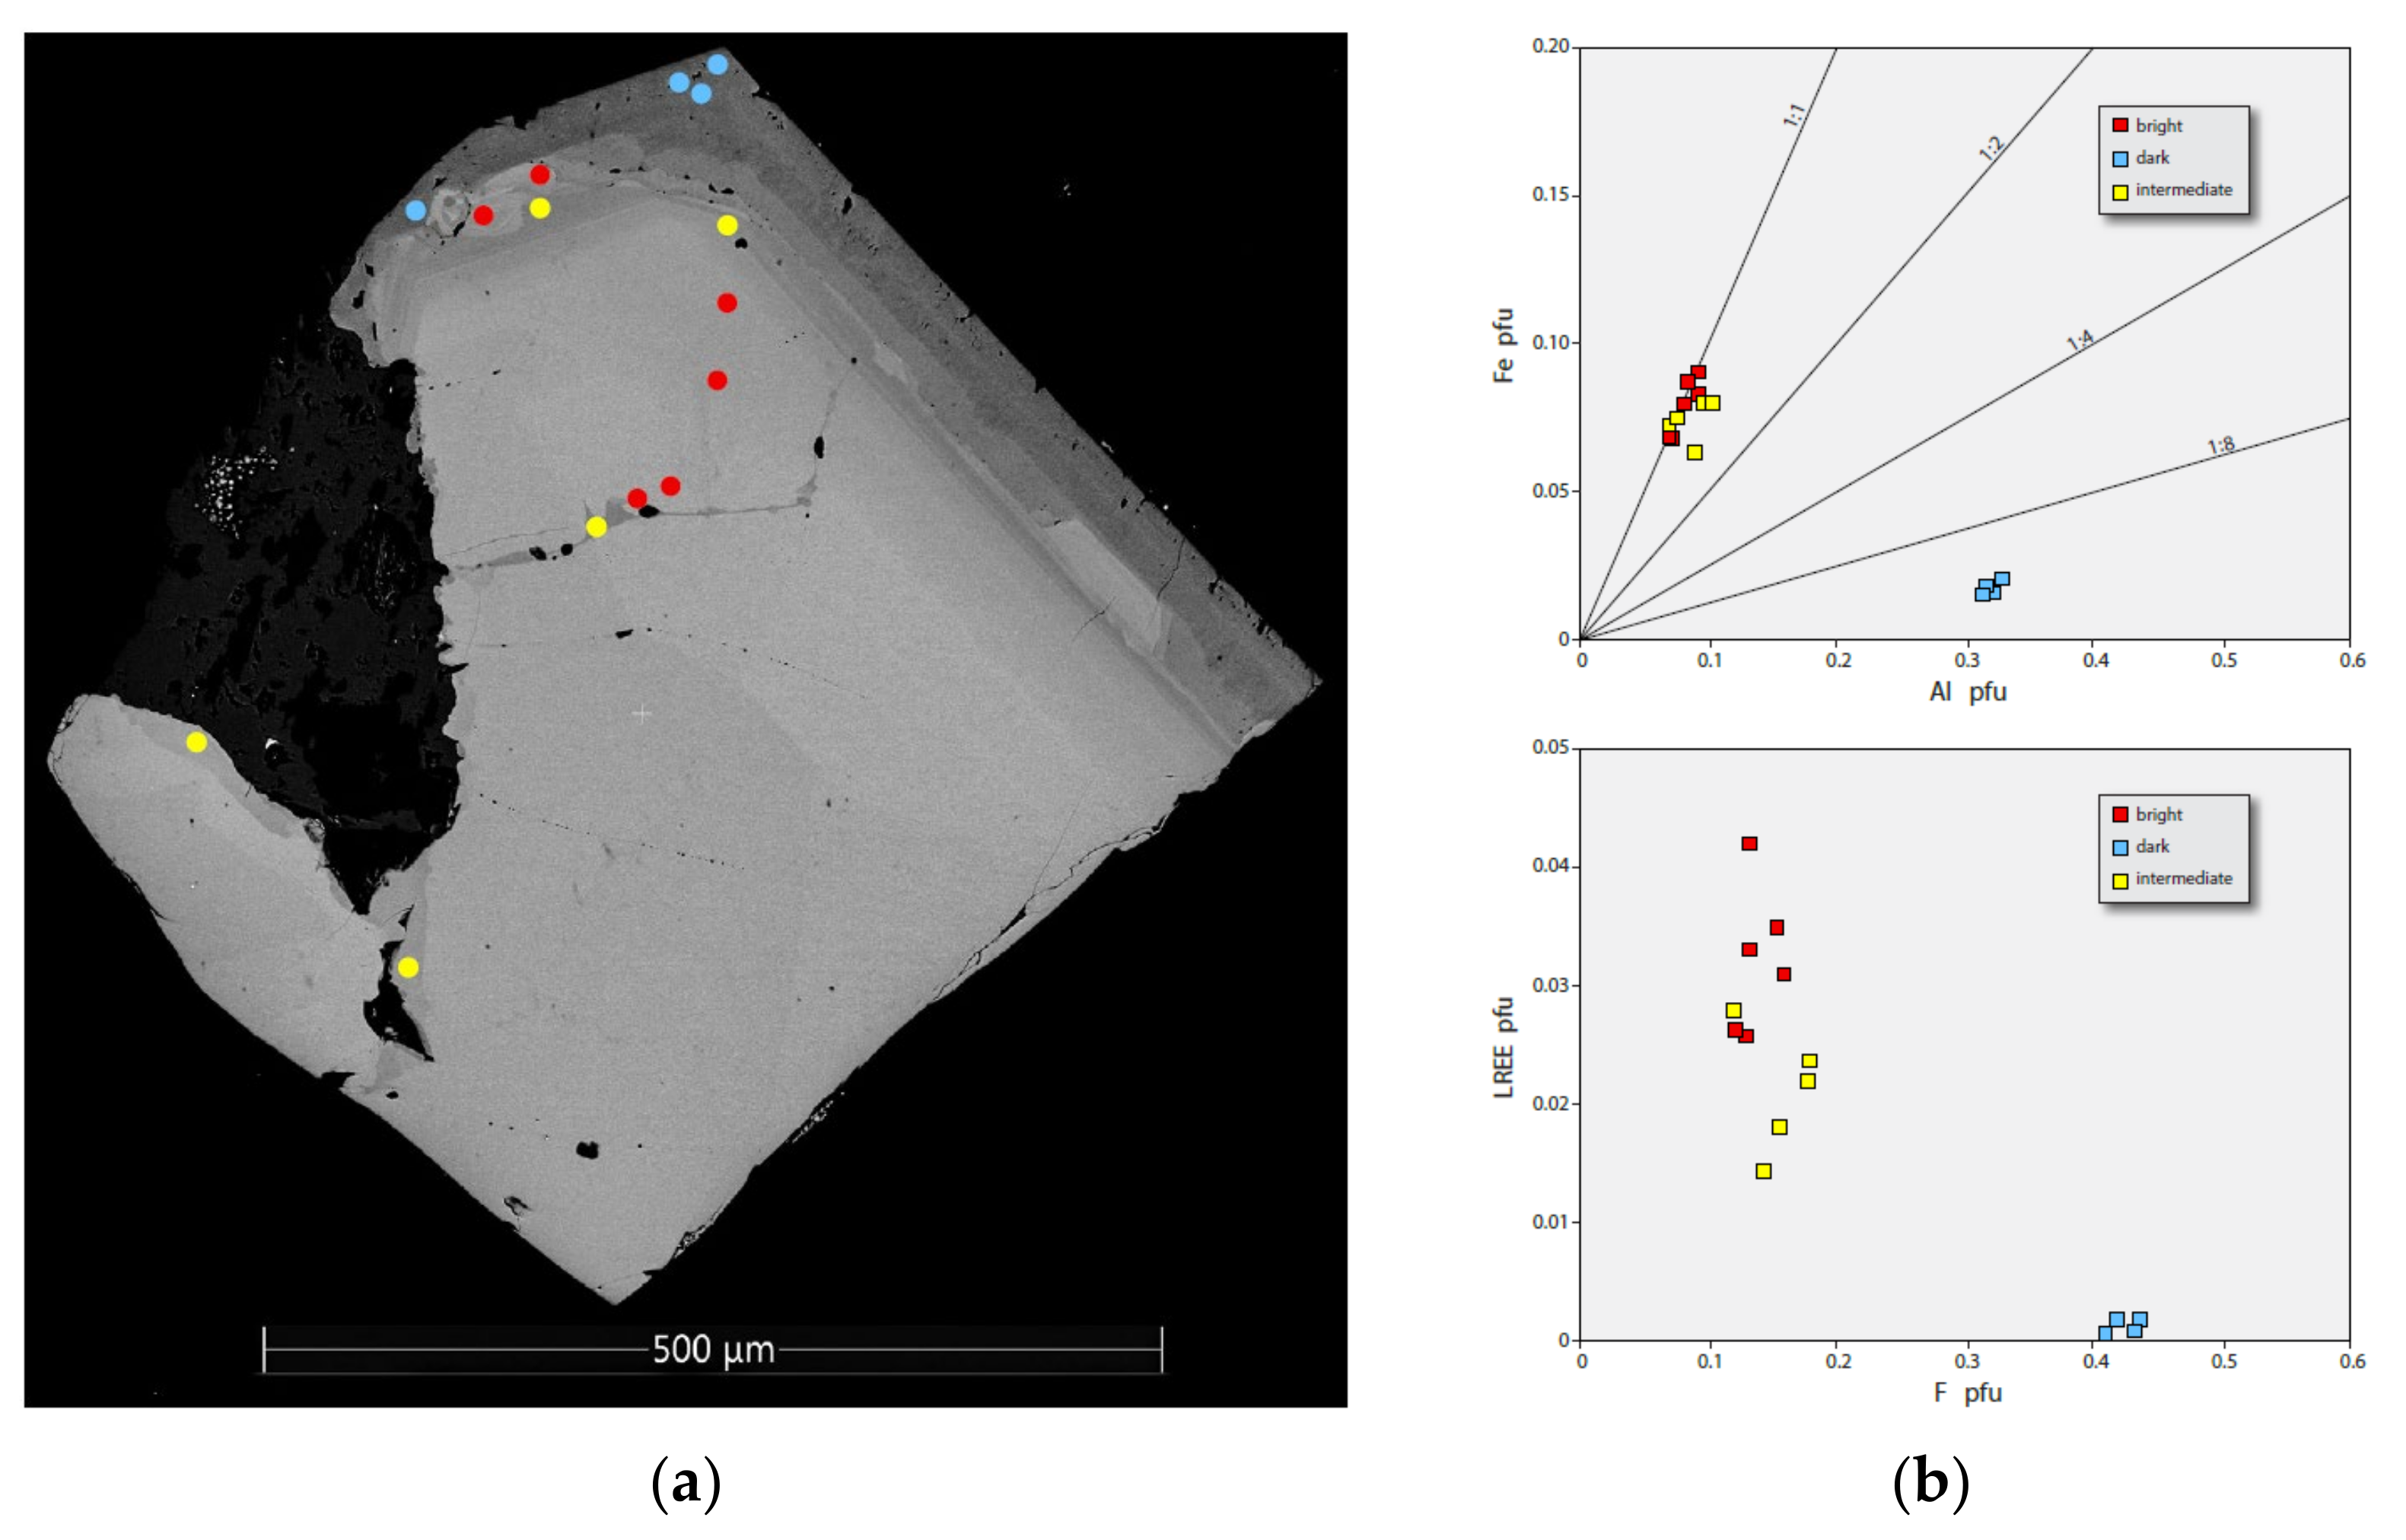
Charge balance in metamorphic, hydrothermal, and pegmatitic titanite due to Fe+3 and Al+3 substitution into the Ti+4 site is largely accomplished by the coupled substitution of F for O−2. However, in volcanic and plutonic titanite the charge imbalance due to Fe+3 and Al+3 substitution appears to be mainly coupled with REE+3 or Y+3 substitution into the Ca+2 site with a more minor contribution from F substitution.
(13)
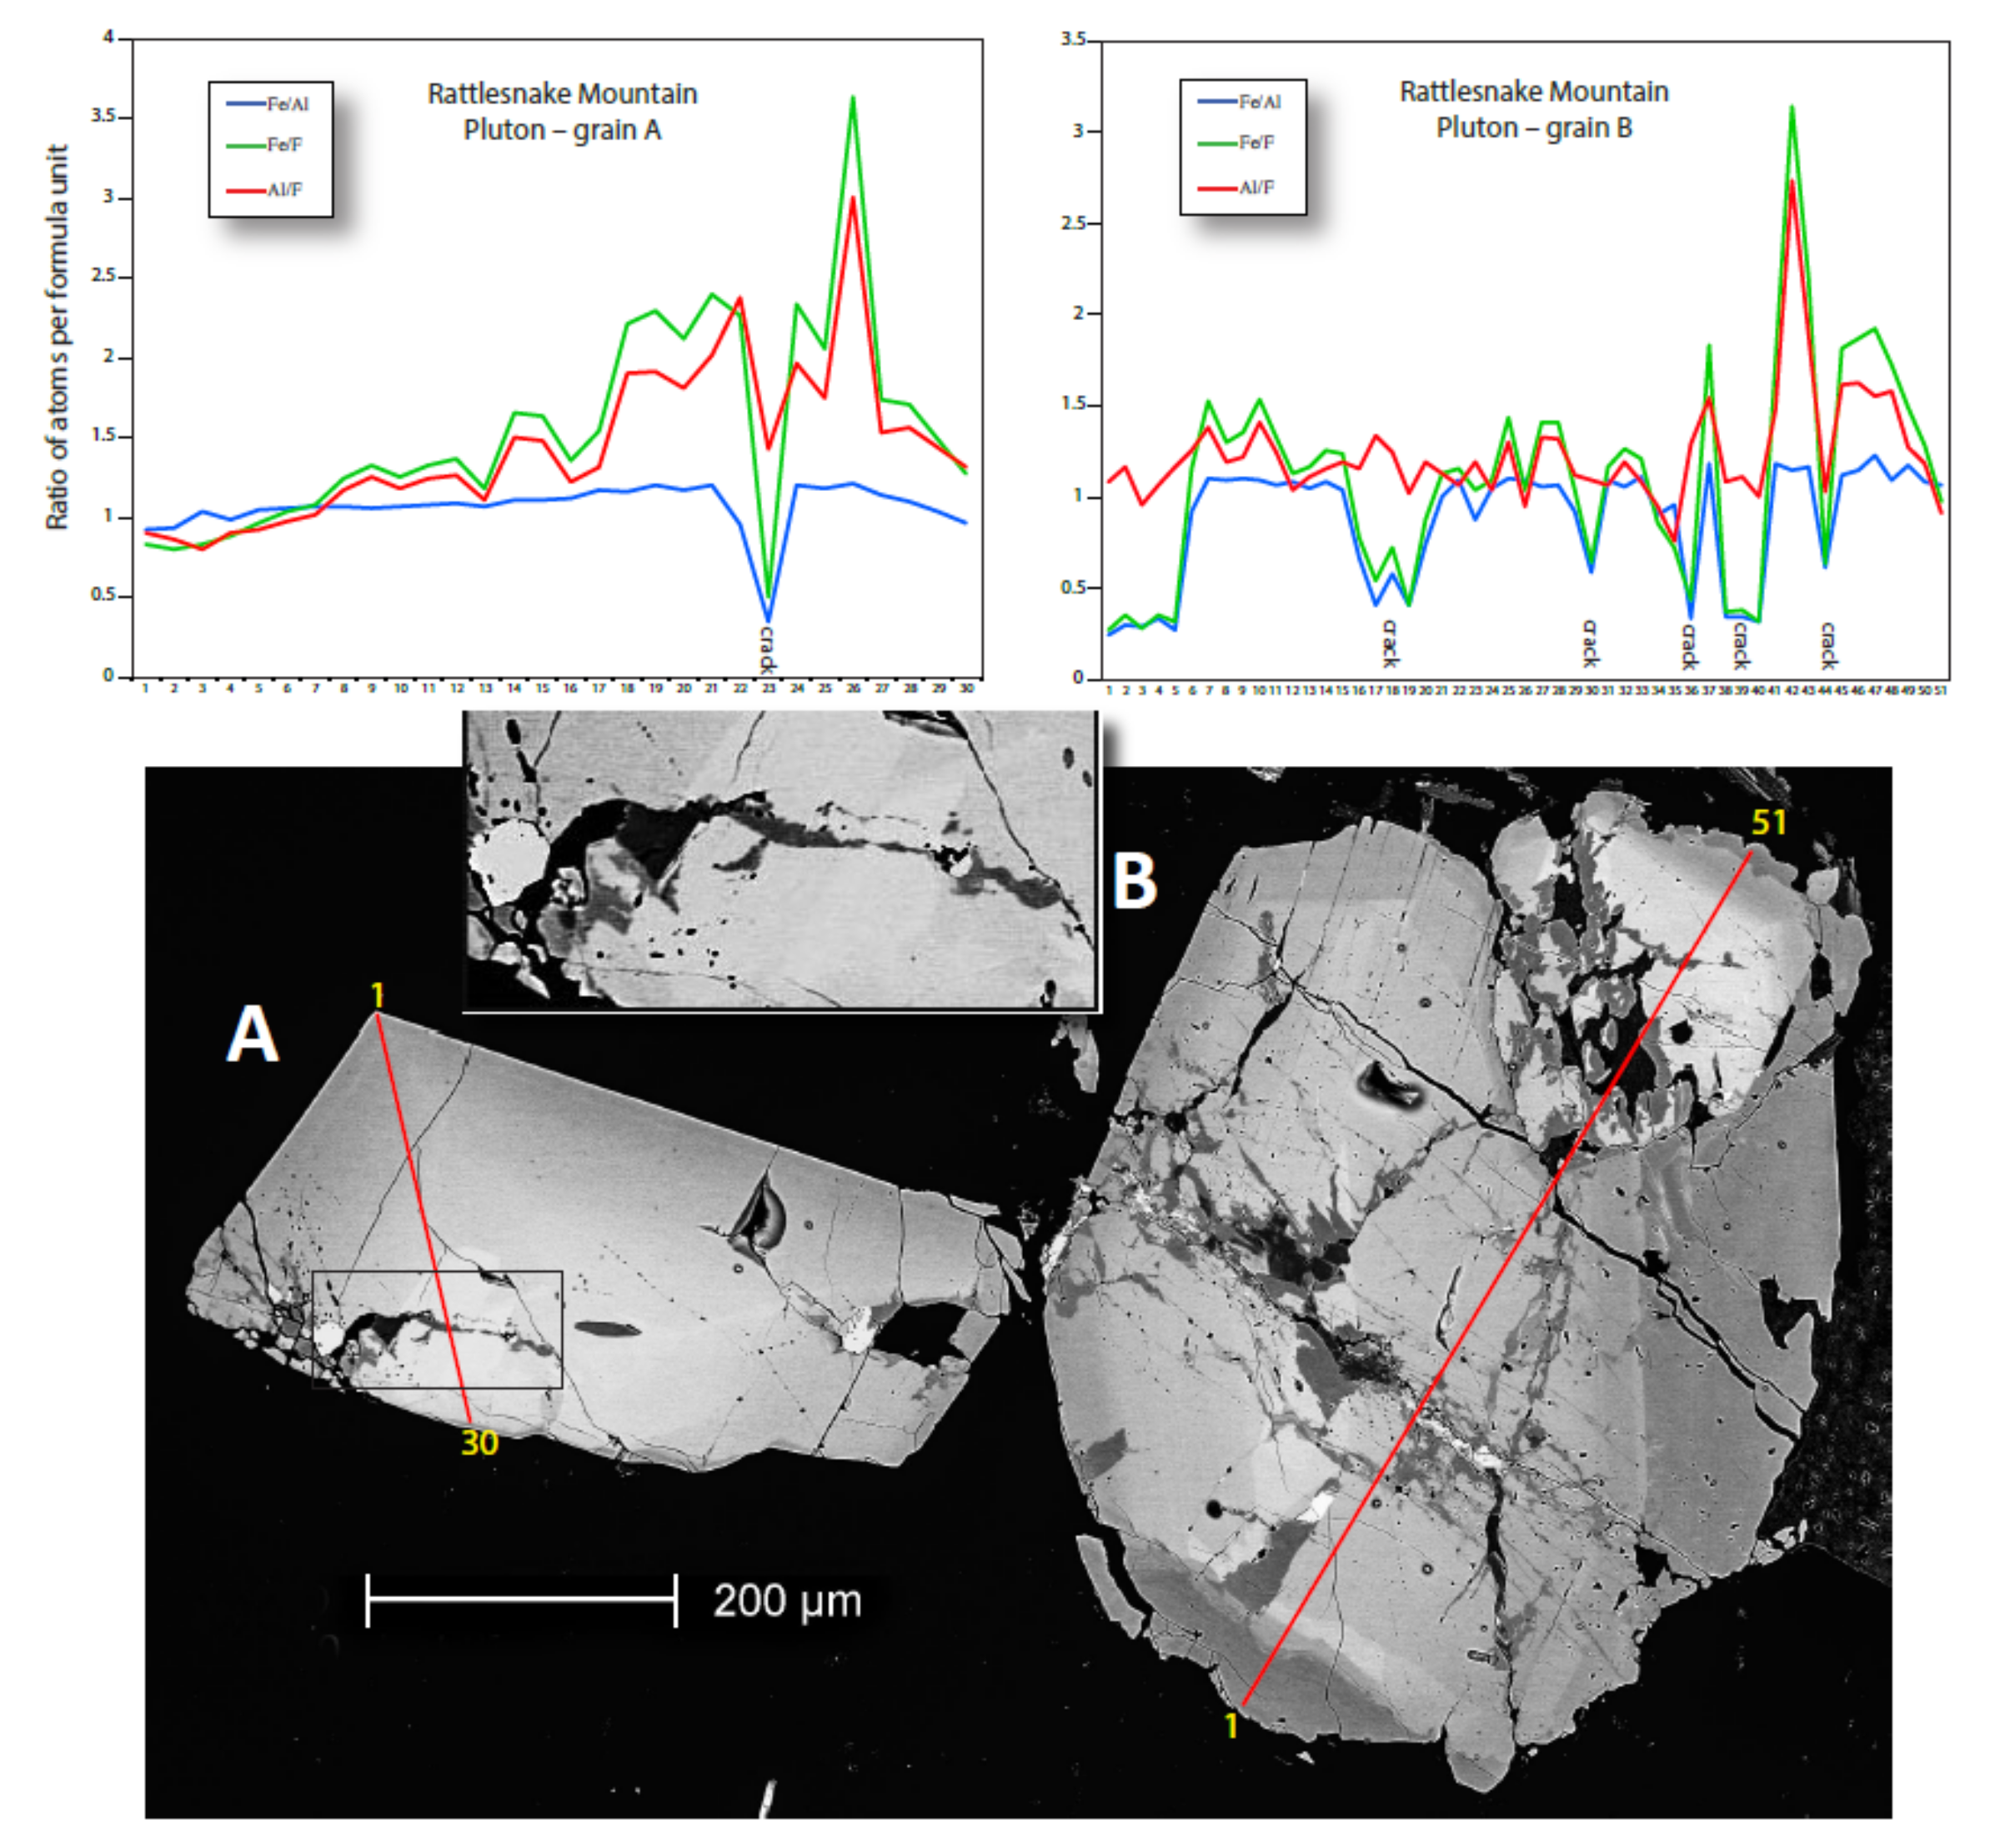
High quality BSE photos of titanite grains are critical in observing relationships and interpreting crystallization histories. Brightness variations correspond mainly with variations in REE concentrations, which typically anticorrelate with F and Al concentrations, particularly in igneous titanite.

7. Conclusions

The database of titanite analyses included with this paper provides researchers with information that will help as they use this interesting mineral to unravel complex geologic processes across a wide range of environments. The most useful elements in distinguishing titanites from different environments appear to be Fe, Al, F, Nb, and REE. BSE photos are an important tool in observing compositional variations. Used along with U/Pb ages from titanite, compositions may provide additional useful data for provenance studies of clastic sediments.

Supplementary Materials

The following supporting information can be downloaded at: https://0-www-mdpi-com.brum.beds.ac.uk/article/10.3390/geosciences12060229/s1, Table S1: data sources; Table S2: Electron microprobe data; Table S3: Repeat analyses on Taylor Sphene.

Author Contributions

Writing—original draft, B.J.K.; Writing—review & editing, E.H.C., M.J.D., A.W., P.H., L.F. and H.M. All authors have read and agreed to the published version of the manuscript.

Funding

Department of Geological Sciences at Brigham Young University, NSF grants EAR-8720651, EAR-8816805, and EAR 99-10664, as well as the EDMAP grants 05HQAG0049 and G14AC00206.

Data Availability Statement

Data supporting this research can be found in the Supplementary Table S2 and in the published papers listed in Table S1.

Acknowledgments

We acknowledge the assistance of Michael Standing with the BSE imaging and David Tingey and Kevin Rey at Brigham Young University with sample preparation. We also thank the Department of Geological Sciences at Brigham Young University for support for geochemical analyses, as well as travel to collect samples. Some of the samples used in this study were collected during research supported by the NSF grants EAR-8720651, EAR-8816805, and EAR 99-10664, as well as the EDMAP grants 05HQAG0049 and G14AC00206.

Conflicts of Interest

The authors declare no conflict of interest.

References

  1. Deer, W.A.; Howie, R.A.; Zussman, J. Rock Forming Minerals: V. 1A, Orthosilicates, 2nd ed.; The Geological Society: London, UK, 1997. [Google Scholar]
  2. Frost, B.R.; Chamberlain, K.R.; Schumacher, J.C. Sphene (titanite): Phase relations and role as a geochonometer. Chem. Geol. 2000, 172, 131–148. [Google Scholar] [CrossRef]
  3. Jaffe, H.W. Reexamination of sphene (titanite). Am. Mineral. 1947, 32, 637–642. [Google Scholar]
  4. Kohn, M.J. Titanite petrochronology. Rev. Mineral. Geochem. 2017, 83, 419–441. [Google Scholar] [CrossRef]
  5. Marks, M.A.W.; Coulson, I.M.; Schilling, J.; Jacob, D.E.; Schmitt, A.K.; Markl, G. The effect of titanite and other HFSE-rich mineral (Ti-bearing andradite, zircon, eudialyte) fractionation on the geochemical evolution of silicate melts. Chem. Geol. 2008, 257, 153–172. [Google Scholar] [CrossRef]
  6. Prowatke, S.; Klemme, S. Effect of melt composition on the partitioning of trace elements between titanite and silicate melt. Geochim. Cosmochim. Acta 2015, 69, 695–709. [Google Scholar] [CrossRef]
  7. Prowatke, S.; Klemme, S. Rare earth element partitioning between titanite and silicate melts: Henry’s law revisited. Geochim. Cosmochim. Acta 2006, 70, 4997–5012. [Google Scholar] [CrossRef]
  8. Tiepolo, M.; Oberti, R.; Vannucci, R. Trace-element incorporation in titanite: Constraints from experimentally determined solid/liquid partition coefficients. Chem. Geol. 2002, 191, 105–119. [Google Scholar] [CrossRef]
  9. Emsley, J. Nature’s Building Blocks; Oxford University Press: Oxford, UK, 2001. [Google Scholar]
  10. Klaproth, M.H. Beiträge zur Chemischen Kenntniss der Mineralkörper, Erster Band; Decker und Compagnie: Posen, Prussia, 1795. [Google Scholar]
  11. Mellor, J.W. A Comprehensive Treatise on Inorganic and Theoretical Chemistry; Longmans, Green, and Co., Ltd.: London, UK, 1927. [Google Scholar]
  12. Dana, E.S. A Text-Book of Mineralogy; John Wiley & Sons, Inc.: New York, NY, USA, 1916. [Google Scholar]
  13. Dana, J.D. A System of Mineralogy; John Wiley & Sons, Publishers: New York, NY, USA, 1869. [Google Scholar]
  14. Vakh, A.S.; Avchenko, O.V.; Karabtsov, A.A.; Stepanov, V.A. The first find of grothite in gold ore deposits. Dok. Earth Sci. 2009, 428, 1083–1087. [Google Scholar] [CrossRef]
  15. Vakh, A.S.; Avchenko, O.V.; Karabtsov, A.A.; Stepanov, V.A. High-alumina titanite in mineral assemblages of the Berezitovy gold-base-metal deposit, Upper Amur Region. Geol. Ore Depos. 2012, 54, 580–588. [Google Scholar] [CrossRef]
  16. Aleksandrov, S.M.; Troneva, M.A. Composition, mineral assemblages, and genesis of titanite and malayaite in skarns. Geochem. Int. 2007, 45, 1012–1024. [Google Scholar] [CrossRef]
  17. Alexander, J.B.; Flinter, B.H. A note on varlamoffite and associated minerals from the Batang Padang district, Perak, Malaya, Malaysia. Mineral. Mag. 1965, 35, 622–627. [Google Scholar] [CrossRef]
  18. Higgins, J.B.; Ribbe, P.H. The structure of malayaite, CaSnOSiO4, a tin analog of titanite. Am. Mineral. 1977, 62, 801–806. [Google Scholar]
  19. Takenouchi, S. Hydrothermal synthesis and consideration of the genesis of malayaite. Mineral. Depos. 1971, 6, 335–347. [Google Scholar] [CrossRef]
  20. Hey, M.H. International Mineralogical Association: Commission on New Minerals and Mineral Names. Mineral. Mag. 1982, 46, 513–514. [Google Scholar] [CrossRef]
  21. Angiboust, S.; Harlov, D. Ilmenite breakdown and rutile-titanite stability in metagranitoids: Natural observations and experimental results. Am. Mineral. 2017, 102, 1696–1708. [Google Scholar] [CrossRef]
  22. Broska, I.; Harlov, D.; Tropper, P.; Siman, P. Formation of magmatic titanite and titanite–ilmenite phase relations during granite alteration in the Tribeč Mountains, Western Carpathians, Slovakia. Lithos 2007, 95, 58–71. [Google Scholar] [CrossRef]
  23. Broska, I.; Petrík, I. Accessory Fe-Ti oxides in the West-Carpathian I-type granitoids: Witnesses of the granite mixing and late oxidation processes. Mineral. Petrol. 2011, 102, 87–97. [Google Scholar] [CrossRef]
  24. Henze, P.K.; Christiansen, E.H.; Kowallis, B.J.; Dorais, M.J.; Mosher, H.D.; Franzen, L.M.; Martin, A.J.; Nabelek, P.I. Titanite geochemistry and textures: Implications for magmatic and post-magmatic processes in the Notch Peak and Little Cottonwood granitic intrusions, Utah. Am. Mineral. 2020, in press. [Google Scholar] [CrossRef]
  25. Horie, K.; Hidaka, H.; Gauthier-Lafaye, F. Elemental distribution in apatite, titanite and zircon during hydrothermal alteration: Durability of immobilization mineral phases for actinides. Phys. Chem. Earth 2008, 33, 962–968. [Google Scholar] [CrossRef]
  26. Middleton, A.W.; Förster, H.-J.; Uysal, I.T.; Golding, S.D.; Rhede, D. Accessory phases from the Soultz monzogranite, Soultz-sous-Forêts, France: Implications for titanite destabilisation and differential REE, Y and Th mobility in hydrothermal systems. Chem. Geol. 2013, 335, 105–117. [Google Scholar] [CrossRef]
  27. Pan, Y.; Fleet, M.E.; MacRae, N.D. Late alteration in titanite (CaTiSiO5): Redistribution and remobilization of rare earth elements and implications for U/Pb and Th/Pb geochronology and nuclear waste disposal. Geochim. Cosmochim. Acta 1993, 57, 355–367. [Google Scholar] [CrossRef]
  28. Scott, D.J.; St.-Onge, M.R. Constraints on Pb closure temperature in titanite based on rocks from the Ungava orogen, Canada: Implications for U-Pb geochronology and P-T-t path determinations. Geology 1995, 23, 1123–1126. [Google Scholar] [CrossRef]
  29. Tilley, D.; Eggleton, R.A. Titanite low-temperature alteration and Ti mobility. Clays Clay Mineral. 2005, 53, 100–107. [Google Scholar] [CrossRef]
  30. Cao, M.-J.; Qin, K.-Z.; Li, G.-M.; Evans, N.J.; Jin, L.-Y. In situ LA-(MC)-ICP-MS trace element and Nd isotopic compositions and genesis of polygenetic titanite from the Baogutu reduced porphyry Cu deposit, Western Junggar, NW China. Ore Geol. Rev. 2015, 65, 940–954. [Google Scholar] [CrossRef]
  31. Che, X.D.; Linnen, R.L.; Wang, R.C.; Groat, L.A.; Brand, A.A. Distribution of trace and rare earth elements in titanite from tungsten and molybdenum deposits in Yukon and British Columbia, Canada. Can. Mineral. 2013, 51, 415–438. [Google Scholar] [CrossRef]
  32. Fleischer, M. Relation of the relative concentrations of lanthanides in titanite to type of host rocks. Am. Mineral. 1978, 63, 869–873. [Google Scholar]
  33. Fleischer, M.; Altschuler, Z.S. The relationship of the rare-earth composition of minerals to geological environment. Geochim. Cosmochim. Acta 1969, 33, 725–732. [Google Scholar] [CrossRef]
  34. Gros, K.; Słaby, E.; Birski, Ł.; Kozug-Budzyń, G.; Sláma, J. Geochemical evolution of a composite pluton: Insight from major and trace element chemistry of titanite. Mineral. Petrol. 2020, 114, 375–401. [Google Scholar] [CrossRef]
  35. Ismail, R.; Ciobanu, C.L.; Cook, N.J.; Teale, G.S.; Giles, D.; Mumm, A.S.; Wade, B. Rare earths and other trace elements in minerals from skarn assemblages, Hillside iron oxide–copper–gold deposit, Yorke Peninsula, South Australia. Lithos 2014, 184–187, 456–477. [Google Scholar] [CrossRef]
  36. Kowallis, B.J.; Christiansen, E.H.; Dorais, M.J.; Barth, A.P. Are titanite grains found in Middle and Late Jurassic tuffs of the Carmel and Morrison Formations of Utah volcanic in origin or detrital grains from non-volcanic sources? Geol. Soc. Am. Abstr. Prog. 2016, 48. [Google Scholar] [CrossRef]
  37. Kowallis, B.J.; Christiansen, E.H.; Griffen, D.T. Compositional variations in titanite. Geol. Soc. Am. Abstr. Prog. 1997, 29, A402. [Google Scholar]
  38. Mazdab, F.K.; Wooden, J.L.; Barth, A.P. Trace element variability in titanite from diverse geologic environments. Geol. Soc. Am. Abstr. Prog. 2007, 39, 406. [Google Scholar]
  39. Nakada, S. Magmatic processes in titanite-bearing dacites, central Andes of Chile and Bolivia. Am. Mineral. 1991, 76, 548–560. [Google Scholar]
  40. Piuzana, D.; Casteñeda, C.; Noce, C.M.; Soares, A.C.P.; Silva, L.C. Titanite crystal chemistry and U-Pb isotopic data: A petrogenetic indicator for Precambrian granitoid plutons of the eastern Brazilian Shield. Geonomos 2008, 16, 29–36. [Google Scholar]
  41. Scibiorski, E.A.; Cawood, P.A. Titanite as a petrogenetic indicator. Terra Nova 2022, 34, 177–183. [Google Scholar] [CrossRef]
  42. Xie, L.; Wang, R.-C.; Chen, J.; Zhu, J.-Z. Mineralogical evidence for magmatic and hydrothermal processes in the Qitianling oxidized tin-bearing granite (Hunan, South China): EMP and (MC)-LA-ICPMS investigations of three types of titanite. Chem. Geol. 2010, 276, 53–68. [Google Scholar] [CrossRef]
  43. Xu, L.; Bi, X.; Hu, R.; Tang, Y.; Wang, X.; Xu, Y. LA-ICP-MS mineral chemistry of titanite and the geological implications for exploration of porphyry Cu deposits in the Jinshajiang—Red River alkaline igneous belt, SW China. Mineral. Petrol. 2015, 109, 181–200. [Google Scholar] [CrossRef]
  44. Jarosewich, E. Smithsonian microbeam standards. J. Res. Natl. Inst. Stand. Technol. 2002, 107, 681–685. [Google Scholar] [CrossRef]
  45. Ribbe, P.H. Titanite. In Orthosilicates; Burns, R.G., Ed.; Mineralogical Society of America: Chantilly, VA, USA, 1980; pp. 137–154. [Google Scholar]
  46. Sharova, O.I.; Chudnenko, K.V.; Avchenko, O.V.; Badredinov, Z.G.; Vakh, A.S. Aluminum-fluorine sphene (titanite) as an indicator of fluorine fluid. Dok. Earth Sci. 2012, 422, 126–129. [Google Scholar] [CrossRef]
  47. Avchenko, O.V.; Vakh, A.S.; Cudnenko, K.V.; Sharova, O.I. Physicochemical crystallization conditions of Al-F sphene in metasomatic rocks with ore mineralization at the Berezitovoe Deposit. Geochem. Int. 2012, 50, 409–424. [Google Scholar] [CrossRef]
  48. Bernau, R.; Franz, G. Crystal chemistry and genesis of Nb-, V-, and Al-rich metamorphic titanite from Egypt and Greece. Can. Mineral. 1987, 25, 695–705. [Google Scholar]
  49. Carswell, D.A.; Wilson, R.N.; Zhai, M. Ultra-high pressure aluminous titanites in carbonate-bearing eclogites at Shuanghe in Dabieshan, central China. Mineral. Mag. 1996, 60, 461–471. [Google Scholar] [CrossRef]
  50. Cave, B.J.; Stepanov, A.S.; Craw, D.; Large, R.R.; Halpin, J.A.; Thompson, J. Release of trace elements through the sub-greenschist facies breakdown of detrital rutile to metamorphic titanite in the Otago Schist, New Zealand. Can. Mineral. 2015, 53, 379–400. [Google Scholar] [CrossRef]
  51. Cempírek, J.; Houzar, S.; Novak, M. Complexly zoned niobian titanite from hedenbergite skarn at P|isek, Czech Republic, constrained by substitutions Al(Nb,Ta)Ti2, Al(F,OH)(TiO)1 and SnTi1. Mineral. Mag. 2008, 72, 1293–1305. [Google Scholar] [CrossRef]
  52. Černý, P.; Novak, M.; Chapman, R. The Al (Nb, Ta) Ti (in− 2) substitution in titanite: The emergence of a new species? Mineral. Petrol. 1995, 52, 61–73. [Google Scholar] [CrossRef]
  53. Enami, M.; Suzuki, K.; Liou, J.G.; Bird, D.K. Al-Fe3+ and F-OH substitutions in titanite and constraints on their PT dependence. Eur. J. Mineral. 1993, 5, 219–231. [Google Scholar] [CrossRef]
  54. Estrade, G.; Salvi, S.; Béziat, D.; Williams-Jones, A.E. The origin of skarn-hosted rare-metal mineralization in the Ambohimirahavavy alkaline complex, Madagascar. Econ. Geol. 2015, 110, 1485–1513. [Google Scholar] [CrossRef]
  55. Exley, R.A. Microprobe studies of REE-rich accessory minerals: Implications for Skye Granite petrogenesis and REE mobility in hydrothermal systems. Earth Planet. Sci. Lett. 1980, 48, 97–110. [Google Scholar] [CrossRef]
  56. Foord, E.E.; Hlava, P.F.; Erd, R.C.; Lichte, F.E. Rhyolite-hosted REE-Fe-Nb-bearing titanite from Willow Spring Draw, Sierra County, New Mexico, USA. In Rare Earth Minerals: Chemistry, Origin, and Ore Deposits; Mineralogical Society of Great Britain and Ireland: London, UK, 1993; pp. 39–41. [Google Scholar]
  57. Fu, Y.; Sun, X.; Zhou, H.; Lin, H.; Yang, T. In-situ LA–ICP–MS U–Pb geochronology and trace elements analysis of polygenetic titanite from the giant Beiya gold–polymetallic deposit in Yunnan Province, Southwest China. Ore Geol. Rev. 2016, 77, 43–56. [Google Scholar] [CrossRef]
  58. Grapes, R.; Watanabe, T. Paragenesis of titanite in metagreywackes of the Franz Josef-Fox Glacier area, Southern Alps, New Zealand. Eur. J. Mineral. 1992, 4, 547–555. [Google Scholar] [CrossRef] [Green Version]
  59. Groat, L.A.; Carter, R.T.; Hawthorne, F.C.; Ercit, T.S. Tantalian niobian titanite from the Irgon claim, southeastern Manitoba. Can. Mineral. 1985, 23, 569–571. [Google Scholar]
  60. Hansen, E.; Reimink, J.; Harlov, D. Titaniferous accessory minerals in very low-grade metamorphic rocks, Keweenaw Peninsula Michigan, USA. Lithos 2010, 116, 167–174. [Google Scholar] [CrossRef]
  61. Houzar, S.; Litochleb, J.; Sejkora, J.; Cempírek, J.; Cícha, J. Unusual mineralization with niobian titanite and Bi-tellurides in scheelite skarn from Kamenné doly quarry near Písek, Moldanubian Zone, Bohemian Massif. J. Geosci. 2008, 53, 1–16. [Google Scholar] [CrossRef] [Green Version]
  62. Janeczek, J. Nb-, Ta-and Sn-rich titanite and its alteration in pegmatites from Zólkiewka, Poland. Neues Jahr. Mineral. Monat. 1996, 10, 459–469. [Google Scholar]
  63. Liferovich, R.P.; Mitchell, R.H. Composition and paragenesis of Na-, Nb-, and Zr-bearing titanite from Khibina, Russia, and crystal-structure data for synthetic analogues. Can. Mineral. 2005, 43, 795–812. [Google Scholar] [CrossRef] [Green Version]
  64. Lussier, A.J.; Cooper, M.A.; Hawthorne, F.C.; Kristiansen, R. Triclinic titanite from the Heftetjern granitic pegmatite, Tordal, southern Norway. Mineral. Mag. 2009, 73, 709–722. [Google Scholar] [CrossRef]
  65. Markl, G.; Piazolo, S. Stability of high-Al titanite from low-pressure calcsilicates in light of fluid and host-rock composition. Am. Mineral. 1999, 84, 37–47. [Google Scholar] [CrossRef]
  66. Moore, J.M.; McStay, J.H. The formation of allanite-(Ce) in calcic granofelses, Namaqualand, South Africa. Can. Mineral. 1990, 28, 77–86. [Google Scholar]
  67. Paul, B.J.; Černý, P.; Chapman, R.; Hinthorne, J.R. Niobian titanite from the Huron Claim pegmatite, southeastern Manitoba. Can. Mineral. 1981, 19, 549–552. [Google Scholar]
  68. Sobolev, N.V.; Shatsky, V.S. Diamond inclusions in garnets from metamorphic rocks: A new environment for diamond formation. Nature 1990, 343, 742–746. [Google Scholar] [CrossRef]
  69. Xie, L.; Wand, R.C.; Wang, D.Z.; Qiu, J.S. A survey of accessory mineral assemblages in peralkaline and more aluminous A-type granites of the southeast coastal area of China. Mineral. Mag. 2006, 70, 709–729. [Google Scholar] [CrossRef]
  70. Bernau, R.; Franz, G.; Langer, K. Experimental Investigation of Titanite in the System CaO-Al2O3-TiO2-SiO2-H2O; Experimental Mineralogy and Geochemistry International Symposium: Nancy, France, 1986; pp. 21–22. [Google Scholar]
  71. Franz, G.; Spear, F.S. Aluminous titanite (sphene) from the eclogite zone, south-central Tauren Window, Austria. Chem. Geol. 1985, 50, 33–46. [Google Scholar] [CrossRef]
  72. Hollabaugh, C.L.; Foit, F.F., Jr. The crystal structure of an Al-rich titanite from Grisons, Switzerland. Am. Mineral. 1984, 69, 725–732. [Google Scholar]
  73. Oberti, R.; Smith, D.C.; Rossi, G.; Caucia, F. The crystal-chemistry of high-aluminium titanites. Eur. J. Mineral. 1991, 3, 777–792. [Google Scholar] [CrossRef] [Green Version]
  74. Sahama, T.G. On the chemistry of the mineral titanite. Bull. Comm. Géol. Finland 1946, 138, 88–120. [Google Scholar]
  75. Troitzsch, U.; Ellis, D.J. Thermodynamic properties and stability of AlF-bearing titanite CaTiOSiO4–Ca-AlFSiO4. Contrib. Mineral. Petrol. 2002, 142, 543–563. [Google Scholar] [CrossRef]
  76. Laurent, O.; Zeh, A.; Gerdes, A.; Villaros, A.; Gros, K.; Słaby, E. How do granitoid magmas mix with each other? Insights from textures, trace element and Sr–Nd isotopic composition of apatite and titanite from the Matok pluton (South Africa). Cont. Mineral. Petrol. 2017, 172, 80. [Google Scholar] [CrossRef] [Green Version]
  77. Wu, B.; Wang, R.-C.; Yang, J.-H.; Wu, F.-Y.; Zhang, W.-L.; Gu, X.-P.; Zhang, A.-C. Zr and REE mineralization in sodic lujavrite from the Saima alkaline complex, northeastern China: A mineralogical study and comparison with potassic rocks. Lithos 2016, 262, 232–246. [Google Scholar] [CrossRef]
  78. Jiang, S.-Y.; Palmer, M.R. Mn-rich ilmenite from the Sullivan Pb-Zn-Ag deposit, British Columbia. Can. Mineral. 1996, 34, 29–36. [Google Scholar]
  79. Higgins, J.B.; Ribbe, P.H. The crystal chemistry and space groups of natural and synthetic titanites. Am. Mineral. 1976, 61, 878–888. [Google Scholar]
  80. Colombini, L.L.; Miller, C.A.; Gualda, G.A.R.; Wooden, J.L.; Miller, J.S. Sphene and zircon in the Highland Range volcanic sequence (Miocene, southern Nevada, USA): Elemental partitioning, phase relations, and influence on evolution of silicic magma. Mineral. Petrol. 2011, 102, 29–50. [Google Scholar] [CrossRef]
  81. Frost, B.R.; Lindsley, D.H. Occurrence of iron-titanium oxides in igneous rocks. Rev. Mineral. Geochem. 1991, 25, 433–468. [Google Scholar]
  82. Bachmann, O.; Dungan, M.A.; Bussy, F. Insights into shallow magmatic processes in large silicic magma bodies: The trace element record in the Fish Canyon magma body, Colorado. Contrib. Mineral. Petrol. 2005, 149, 338–349. [Google Scholar] [CrossRef] [Green Version]
  83. Christiansen, E.H.; Kowallis, B.J.; Skidmore, C.N.; Pickard, M.; Parks, E. The record of volcanism in the Brushy Basin Member of the Morrison Formation: Implications for the Late Jurassic of Western North America. In Late Jurassic Margin of Laurasia—A Record of Faulting Accommodating Plate Rotation; Anderson, T.H., Didenko, A.N., Johnson, C.L., Khanchuk, A.I., MacDonald, J.H., Jr., Eds.; Geological Society of America: Boulder, CO, USA, 2015; pp. 399–439. [Google Scholar]
  84. Kowallis, B.J.; Christiansen, E.H.; Deino, A.L.; Zhang, C.; Everett, B.H. The record of Middle Jurassic volcanism in the Carmel and Temple Cap Formations of southwestern Utah. Geol. Soc. Am. Bull. 2001, 113, 373–387. [Google Scholar] [CrossRef]
  85. Maughan, L.L.; Christiansen, E.H.; Best, M.G.; Grommé, C.S.; Deino, A.L.; Tingey, D.G. The Oligocene Lund Tuff, Great Basin, USA: A very large volume monotonous intermediate. J. Vol. Geother. Res. 2002, 113, 129–157. [Google Scholar] [CrossRef]
  86. Ackerson, M.R. Trace Element Partitioning between Titanite and Groundmass in Silicic Volcanic Systems. Master’s Thesis, University of North Carolina, Chapel Hill, NC, USA, 2011. [Google Scholar]
  87. Della Ventura, G.; Bellatreccia, F. Zr- and LREE-rich titanite from Tre Croci, Vico Volcanic complex (Latium, Italy). Mineral. Mag. 1999, 63, 123–130. [Google Scholar] [CrossRef]
  88. Iddon, F.; McLeod, G.W.; Dempster, T.J. Titanite from the Fish Canyon Tuff: Searching for clues to pre-eruptive magma chamber processes. In Proceedings of the Goldschmidt Conference Abstracts, Florence, Italy, 25–30 August 2013; p. 1354. [Google Scholar]
  89. Padilla, A.J.; Gualda, G.A.R. Crystal-melt elemental partitioning in silicic magmatic systems: An example from the Peach Spring Tuff high-silica rhyolite, southwest USA. Chem. Geol. 2016, 440, 326–344. [Google Scholar] [CrossRef]
  90. Pamukcu, A.S.; Carley, T.L.; Gualda, G.A.R.; Miller, C.A.; Ferguson, C.A. The evolution of the Peach Spring giant magma body: Evidence from accessory mineral textures and compositions, bulk pumice and glass geochemistry, and rhyolite-MELTS modeling. J. Petrol. 2013, 54, 1109–1148. [Google Scholar] [CrossRef] [Green Version]
  91. Bonamici, C.E.; Kozdon, R.; Ushikubo, T.; Valley, J.W. Intragraing oxygen isotope zoning in titanite by SIMS: Cooling rates and fluid infiltration along the Carthage-Colton mylonite zone, Adirondack Mountains, NY, USA. J. Metal. Geol. 2014, 32, 71–92. [Google Scholar] [CrossRef]
  92. Barth, A.P.; Wooden, J.L.; Howard, K.A.; Richards, J.L. Late Jurassic plutonism in the southwest U.S. Cordillera. In Ophiolites, Arcs, and Batholiths: A Tribute to Cliff Hopson; Wright, J.E., Shervais, J.W., Eds.; Special Paper 2008; Geological Society of America: Boulder, CO, USA, 2008; Volume 438, pp. 379–396. [Google Scholar]
  93. Dawson, J.B.; Hill, P.G. Mineral chemistry of a peralkaline combeite–lamprophyllite nephelinite from Oldoinyo Lengai, Tanzania. Mineral. Mag. 1998, 62, 179–196. [Google Scholar] [CrossRef]
  94. Dawson, J.B. Peralkaline nephelinite–natrocarbonatite relationships at Oldoinyo Lengai, Tanzania. J. Petrol. 1998, 39, 2077–2094. [Google Scholar] [CrossRef]
  95. Dawson, J.B.; Smith, J.V.; Steele, I.M. Petrology and mineral chemistry of plutonic igneous xenoliths from the carbonatite volcano, Oldoinyo Lengai, Tanzania. J. Petrol. 1995, 36, 797–826. [Google Scholar] [CrossRef]
  96. Krmíček, L.; Cempírek, J.; Havlín, A.; Přichystal, A.; Houzar, S.; Krmíčková, M.; Gadas, P. Mineralogy and petrogenesis of a Ba–Ti–Zr-rich peralkaline dyke from Šebkovice (Czech Republic): Recognition of the most lamproitic Variscan intrusion. Lithos 2011, 121, 74–86. [Google Scholar] [CrossRef]
  97. Mikhailova, J.A.; Pakhomovsky, Y.A.; Ivanyuk, G.Y.; Bazai, A.V.; Yakovenchuk, V.N.; Elizarova, I.R.; Kalashnikov, A.O. REE mineralogy and geochemistry of the Western Keivy peralkaline granite massif, Kola Peninsula, Russia. Ore Geol. Rev. 2017, 82, 181–197. [Google Scholar] [CrossRef]
  98. Paslick, C.R.; Halliday, A.N.; Lange, R.A.; James, D.; Dawson, J.B. Indirect crustal contamination: Evidence from isotopic and chemical disequilibria in minerals from alkali basalts and nephelinites from northern Tanzania. Cont. Mineral. Petrol. 1996, 125, 277–292. [Google Scholar] [CrossRef] [Green Version]
  99. Shellnutt, J.G.; Iizuka, Y. Mineralogy from three peralkaline granitic plutons of the Late Permian Emeishan large igneous province (SW China): Evidence for contrasting magmatic conditions of A-type granitoids. Eur. J. Mineral. 2010, 23, 45–61. [Google Scholar] [CrossRef] [Green Version]
  100. Wang, R.-C.; Wang, D.-Z.; Zhao, G.-T.; Lu, J.-J.; Chen, X.-M.; Xu, S.-J. Accessory mineral record of magma-fluid interaction in the Laoshan I- and A-type granitic complex, eastern China. Phys. Chem. Earth 2001, 26, 835–849. [Google Scholar] [CrossRef]
  101. Woolley, A.R.; Platt, R.G.; Eby, N. Niobian titanite and eudialyte from the Ilomba nepheline syenite complex, north Malawi. Mineral. Mag. 1992, 56, 428–430. [Google Scholar] [CrossRef]
  102. Seifert, W. REE-, Zr-, and Th-rich titanite and associated accessory minerals from a kersantite in the Frankenwald, Germany. Mineral. Petrol. 2005, 84, 129–146. [Google Scholar] [CrossRef]
  103. Deng, X.-D.; Li, J.-W.; Zhou, M.-F.; Zhao, X.-F.; Yan, D.-R. In-situ LA-ICPMS trace elements and U–Pb analysis of titanite from the Mesozoic Ruanjiawan W–Cu–Mo skarn deposit, Daye district, China. Ore Geol. Rev. 2015, 65, 990–1004. [Google Scholar] [CrossRef]
  104. Fu, Y.; Sun, X.; Hollings, P.; Li, D.; Yang, T. Geochronology and trace element geochemistry of titanite in the Machangqing Cu-Mo-dominated polymetallic deposit, Yunnan Province, southwest China. J. Asian Earth Sci. 2018, 158, 398–414. [Google Scholar] [CrossRef]
  105. Hu, H.; Li, J.-W.; McFarlane, C.R.M.; Luo, Y.; McCarron, T. Textures, trace element compositions, and U-Pb ages of titanite from the Mangling granitoid pluton, East Qinling Orogen: Implications for magma mixing and destruction of the North China Craton. Lithos 2017, 284-285, 50–68. [Google Scholar] [CrossRef]
  106. Whelan, J.A.; Hintze, L.F. Geologic road logs in the Star Range, Rocky Range, and San Francisco mountains, Beaver County, Utah. In Geology of the Milford Area; Hintze, L.F., Whelan, J.A., Eds.; Publication 3; Utah Geol. Assoc.: Salt Lake City, UT, USA, 1973; pp. 75–94. [Google Scholar]
  107. Whelan, J.A. Geology, ore deposits and mineralogy of the Rocky Range, near Milford, Beaver County, Utah. Utah Geol. Mineral. Sur. Special Stud. 1982, 57, 1–35. [Google Scholar]
  108. Tulloch, A.J. Secondary Ca-Al silicates as low-grade alteration products of granitoid biotite. Cont. Mineral. Petrol. 1979, 69, 105–117. [Google Scholar] [CrossRef]
  109. Garber, J.M.; Hacker, B.R.; Kylander-Clark, A.R.C.; Stearns, M.; Seward, G. Controls on trace element uptake in metamorphic titanite: Implications for petrochronology. J. Petrol. 2017, 58, 1031–1058. [Google Scholar] [CrossRef] [Green Version]
  110. Bauer, J.E. Complex Zoning Patterns and Rare Earth Element Variations across Titanite Crystals from the Half Dome Granodiorite, Central Sierra Nevada, California. Master’s Thesis, University of North Carolina, Chapel Hill, NC, USA, 2015. [Google Scholar]
  111. Broska, I.; Petrík, I. Variscan thrusting in I- and S-type granitic rocks of the Tribeč Mountains, Western Carpathians (Slovakia): Evidence from mineral compositions and monazite dating. Geol. Carpathica 2015, 66, 455–471. [Google Scholar] [CrossRef] [Green Version]
  112. Viana da Cunha, I.R.; Dall’Agnol, R.; Feio, G.R.L. Mineral chemistry and magnetic petrology of the Archean Planalto Suite, Carajás Province—Amazonian Craton: Implications for the evolution of ferroan Archean granites. J. South Am. Earth Sci. 2016, 67, 100–121. [Google Scholar] [CrossRef]
  113. Harlov, D.E.; Förster, H.-J. Titanite reaction textures around ilmenite in amphibolite-facies rocks: Fluid induced? J Czech Geol. Soc. 2003, 48, 1–2. [Google Scholar]
  114. Oliveira, V.E.S.; Oliveira, D.C.; Marangoanha, B.; Lamarão, C.N. Geology, mineralogy and petrological affinities of the Neoarchean granitoids from the central portion of the Canaã dos Carajás domain, Amazonian craton, Brazil. J. South Am. Earth Sci. 2018, 85, 135–159. [Google Scholar] [CrossRef]
  115. Harlov, D.; Tropper, P.; Seifert, W.; Nijland, T.; Förster, H.-J. Formation of Al-rich titanite (CaTiSiO4–CaAlSiO4OH) reaction rims on ilmenite in metamorphic rocks as a function of FH2O and FO2. Lithos 2006, 88, 72–84. [Google Scholar] [CrossRef]
  116. Gogoi, B.; Saikia, A.; Ahmad, M. Titanite-centered ocellar texture: A petrological tool to unravel the mechanism enhancing magma mixing. Period. Di Mineral. 2017, 86, 245–273. [Google Scholar]
  117. Rossetti, F.; Asti, R.; Faccenna, C.; Gerdes, A.; Lucci, F.; Theye, T. Magmatism and crustal extension: Constraining activation of the ductile shearing along the Gediz detachment, Menderes Massif (western Turkey). Lithos 2017, 282–283, 145–162. [Google Scholar] [CrossRef] [Green Version]
  118. Kraml, M.; Pik, R.; Rahn, M.; Selbekk, R.; Carignan, J.; Keller, J. A new multi-mineral age Reference material for 40Ar/39Ar, (U-Th)/He and fission track dating methods: The Limberg t3 Tuff. Geostand. Geoanaly. Res. 2006, 30, 73–86. [Google Scholar] [CrossRef]
  119. Schleicher, H.; Keller, J.; Kramm, U. Isotope studies on alkaline volcanics and carbonatites from the Kaiserstuhl, Federal Republic of Germany. Lithos 1990, 26, 21–35. [Google Scholar] [CrossRef]
  120. Wimmenauer, W. Beiträge zu Petrographie des Kaiserstuhls, Einführung und Teil I: Die Ergußgesteine und Tuffe. Neues Jahr. Mineral. Abhand. 1957, 91, 131–150. [Google Scholar]
  121. Erickson, R.L.; Blade, L.V. Geochemistry and petrology of the alkalic igneous complex at Magnet Cove, Arkansas. U.S. Geol. Surv. Prof. 1963, 425, 95. [Google Scholar]
  122. Flohr, M.J.K.; Ross, M. Alkaline igneous rocks of Magnet Cove, Arkansas: Mineralogy and geochemistry of syenites. Lithos 1990, 26, 67–98. [Google Scholar] [CrossRef]
  123. Howard, J.M.; Steele, K.F. Igneous rocks at Granite Mountain and Magnet Cove, Arkansas. In South-central Section of the Geological Society of America Centennial Field Guide; Hayward, O.T., Ed.; Geological Society of America: Boulder, CO, USA, 1988; Volume 4, pp. 259–262. [Google Scholar]
  124. Chen, Y.-X.; Zhou, K.; Zheng, Y.-F.; Gao, X.-Y.; Yang, Y. Polygenetic titanite records the composition of metamorphic fluids during the exhumation of ultrahigh-pressure metagranite in the Sulu orogen. J. Meta. Geol. 2016, 34, 573–594. [Google Scholar] [CrossRef]
  125. Gao, X.-Y.; Zheng, Y.-F.; Chen, Y.-X.; Guo, J. Geochemical and U-Pb age constraints on the occurrence of polygenetic titanites in UHP metagranite in the Dabie orogen. Lithos 2012, 136–139, 93–108. [Google Scholar] [CrossRef]
  126. Jung, S.; Hellebrand, E. Textural, geochronological and chemical constraints from polygenetic titanite and monogenetic apatite from a mid-crustal shear zone: An integrated EPMA, SIMS, and TIMS study. Chem. Geol. 2007, 241, 88–107. [Google Scholar] [CrossRef]
  127. Marsh, J.H.; Kelly, E.D. Petrogenetic relations among titanium-rich minerals in an anatectic high-P mafic granulite. J. Meta. Geol. 2017, 35, 717–738. [Google Scholar] [CrossRef]
  128. Papapavlou, K.; Darling, J.R.; Storey, C.D.; Lightfoot, P.C.; Moser, D.E.; Lasalle, S. Dating shear zones with plastically deformed titanite: New insights into the orogenic evolution of the Sudbury impact structure (Ontario, Canada). Precamb. Res. 2017, 291, 220–235. [Google Scholar] [CrossRef] [Green Version]
  129. Walters, J.B. Protracted Thrusting Followed by Late Rapid Cooling of the Greater Himalayan Sequence, Annapurna Himalaya, Central Nepal: Insights from Titanite Petrochronology. Master’s Thesis, Boise State University, Boise, ID, USA, 2016. [Google Scholar]
  130. Wintsch, R.P.; Aleinikoff, J.N.; Yi, K. Foliation development and reaction softening by dissolution and precipitation in the transformation of granodiorite to orthogneiss, Glastonbury Complex, Connecticut, U.S.A. Can. Mineral. 2005, 43, 327–347. [Google Scholar] [CrossRef]
  131. Ye, K.; Liu, J.-B.; Cong, B.-L.; Ye, D.-N.; Xu, P.; Omori, S.; Maruyama, S. Ultrahigh-pressure (UHP) low-Al titanites from carbonate-bearing rocks in Dabieshan-Sulu UHP terrane, eastern China. Am. Mineral. 2002, 87, 875–881. [Google Scholar] [CrossRef]
  132. Ahmed, Z.; Hariri, M.M. Formation and mineral chemistry of a calcic skarn from Al-Madhiq, SW Saudi Arabia. Chem. Der Erde 2006, 66, 187–201. [Google Scholar] [CrossRef]
  133. Liu, Y.; Fan, Y.; Zhou, T.; Zhang, L.; White, N.C.; Hong, H.; Zhang, W. LA-ICP-MS titanite U-Pb dating and mineral chemistry of the Luohe magnetite-apatite (MA)-type deposit in the Lu-Zong volcanic basin, Eastern China. Ore Geol. Rev. 2018, 92, 284–296. [Google Scholar] [CrossRef]
  134. Smith, M.P.; Storey, C.D.; Jeffries, T.E.; Ryan, C. In situ U-Pb and trace element analysis of accessory minerals in the Kiruna District, Norrbotten, Sweden: New constraints on the timing and origin of mineralization. J. Petrol. 2009, 50, 2063–2094. [Google Scholar] [CrossRef] [Green Version]
  135. Alderton, D.H.M. Calc-silicate minerals from the Dartmoor granite. Mineral. Mag. 1988, 52, 527–529. [Google Scholar] [CrossRef]
  136. Janeczek, J. The effect of aluminous titanite on the biotite-chlorite and amphibole-chlorite reactions. Eur. J. Mineral. 1994, 6, 623–625. [Google Scholar] [CrossRef]
  137. Morad, S.; Sirat, M.; El-Ghali, M.A.K.; Mansurbeg, H. Chloritization in Proterozoic granite from the Äspö Laboratory, southeastern Sweden: Record of hydrothermal alterations and implications for nuclear waste storage. Clay Mineral. 2011, 46, 495–513. [Google Scholar] [CrossRef]
  138. Piccoli, P.; Candela, P.; Rivers, M. Interpreting magmatic processes from accessory phases: Titanite–a small-scale recorder of large-scale processes. Transactions of the Royal Society of Edinburgh: Earth Sci. 2000, 91, 257–267. [Google Scholar] [CrossRef]
  139. Astrelina, E.; Smirnov, S.; Ragozin, A.; Karmanov, N.; Konovalenko, S. Late magmatic crystallization in the tourmaline-bearing miarolitic granitic pegmatites (by example of Shakhdarinskaya and Leskhozovskaya veins, SW Pamir, Tajikistan. In Proceedings of the European Current Research on Fluid Inclusions (ECROFI-XXI), Montanuniversität Leoben, Austria, 9–11 August 2011; pp. 24–25. [Google Scholar]
  140. Bakker, R.J.; Elburg, M.A. A magmatic-hydrothermal transition in Arkaroola (northern Flinders Ranges, South Australia): From diopside–titanite pegmatites to hematite–quartz growth. Contrib. Mineral. Petrol. 2006, 152, 541–569. [Google Scholar] [CrossRef]
  141. London, D. Pegmatites. Can. Mineral. 2008; Special Publication 10, 347p. Available online: https://www.mineralogicalassociation.ca/publications/special-publications/sp10/ (accessed on 14 April 2022).
  142. Thomas, R.; Davidson, P.; Rhede, D.; Leh, M. The miarolitic pegmatites from the Königshain: A contribution to understanding the genesis of pegmatites. Contrib. Mineral. Petrol. 2009, 157, 505–523. [Google Scholar] [CrossRef] [Green Version]
  143. Yeliseyev, N.A. Pneumatolytic crystallization of minerals. Int. Geol. Rev. 1962, 4, 799–816. [Google Scholar] [CrossRef]
  144. Uher, P.; Černý, P.; Chapman, R.; Határ, J.; Miko, O. Evolution of Nb, Ta-oxide minerals in the Prašivá granitic pegmatites, Slovakia. II. External hydrothermal Pb, Sb overprint. Can. Mineral. 1998, 36, 535–545. [Google Scholar]
  145. Russell, J.K.; Groat, L.A.; Halleran, A.A.D. LREE-rich niobian titanite from Mount Bisson, British Columbia: Chemistry and exchange mechanisms. Can. Mineral. 1994, 32, 575–587. [Google Scholar]
  146. Chakhmouradian, A.R. Crystal chemistry and paragenesis of compositionally unique (Al-, Fe-, Nb-, and Zr-rich) titanite from Afrikanda, Russia. Am. Mineral. 2004, 89, 1752–1762. [Google Scholar] [CrossRef]
  147. Aramu, F.; Brovetto, P.; Delunas, A.; Maxia, V.; Rinaldi, R. Mössbauer spectroscopy of a natural titanite. Il Nuovo Cim. D 1990, 12, 132–138. [Google Scholar] [CrossRef]
  148. Holényi, K.; Annersten, H. Iron in titanite: A Mössbauer-spectroscopy study. Can. Mineral. 1987, 25, 429–433. [Google Scholar]
  149. Muir, I.J.; Metson, J.B.; Bancroft, G.M. 57Fe Mössbauer spectra of perovskite and titanite. Can. Mineral. 1984, 22, 689–694. [Google Scholar]
  150. Salje, E.K.H.; Safarik, D.J.; Taylor, R.D.; Pasternak, M.P.; Modic, K.A.; Groat, L.A.; Lashley, J.C. Determination of iron sites and the amount of amorphization in radiation-damaged titanite (CaSiTiO5). J. Phys. Cond. Matter 2011, 23, 105402. [Google Scholar] [CrossRef] [PubMed]
  151. Vuorinen, J.H.; Hålenius, U. Nb-, Zr- and LREE-rich titanite from the Alnö alkaline complex: Crystal chemistry and its importance as a petrogenetic indicator. Lithos 2005, 83, 128–142. [Google Scholar] [CrossRef]
Figure 1. Ti (atoms per formula unit) in titanite plotted versus Fe + Al (red) and other elements likely to substitute into the Ti-site (blue). Fe + Al follow closely along a 1:1 substitution line, other elements that likely go into this site also trend along this line but at a shallower slope. The scatter of blue dots along the Ti axis is likely due to analytical difficulties in measuring low concentrations of these other elements. Data sources for this and other diagrams are given in Supplementary Table S1.
Geosciences 12 00229 g001
Figure 2. Ti vs. the sum of all other Ti-site elements (mainly Fe, Al, Nb, Ta, Mg, Zr, Sn, and to a lesser extent V, Cr, U, and Th) in titanite from various environments. The number of analyses (n) in each group is shown. A few outliers are identified and labeled. The anomalous A-type granites from China are peralkaline [69].
Geosciences 12 00229 g002
Figure 3. Fe versus Al in titanite from various environments. Lines of constant Fe/Al ratios from 2:1 to 1:8 are shown for reference. Hydrothermal includes titanite from skarns (dark blue) and metamorphic includes high-pressure eclogite and blue schist (orange), a large data set from the Diana metasyenite in New York [91], as well as titanite from mafic rocks such as metabasite and metabasalt (black).
Geosciences 12 00229 g003
Figure 4. Examples of the clustering of titanite compositions from individual volcanic units on an Fe versus Al plot. Unit ages range from Jurassic to Cenozoic and come from Utah, Colorado, and Nevada.
Geosciences 12 00229 g004
Figure 5. Fe versus Al for three titanite grains from the Cenozoic Lund Tuff of western Utah.
Geosciences 12 00229 g005
Figure 6. Al, Fe, F, and REE plotted along an EMP traverse (yellow line) for a titanite phenoclast from the Lund Tuff. The light gray zones in the backscattered electron (BSE) image are due mostly to variations in REE. F, on the other hand, is higher in the dark zones and lower in the bright zones.
Geosciences 12 00229 g006
Figure 7. BSE images of titanite grains from pyroclastic rocks. (A) Broken euhedral grain from the Cenozoic Racer Canyon Tuff, western Utah with a patchy interior zone overgrown by oscillatory zones. (B) Euhedral grain from the Cenozoic tuff of Toiyabe, central Nevada with prominent sector zoning.
Geosciences 12 00229 g007
Figure 8. Fe versus Al for titanite from peralkaline igneous rocks compared with fields (90% of data) for titanite from other volcanic (red shading) and plutonic rocks (green shading). Titanite from peralkaline rocks typically has Fe/Al > 2:1. It is possible that the clump of volcanic data (red dots) that plot with Fe/Al > 2:1 is also peralkaline, but these data points were collected from altered volcanic tuffs (bentonites) from the Jurassic Morrison Formation where the original rock compositions are difficult to determine.
Geosciences 12 00229 g008
Figure 9. Fe versus Al for some plutonic titanites where overgrowths of secondary metamorphic or hydrothermal titanite have been identified. Overgrowths have low Fe and high Al. Data sources are Rattlesnake Mountain pluton (California, this paper); Tribeč Mountains granites (Slovakia [23]; Western Gneiss Region, (Norway [109]), and Rocky Range pluton (Utah, this paper).
Geosciences 12 00229 g009
Figure 10. Backscattered electron (BSE) image of titanite grains in the Rocky Range pluton, Utah. Electron microprobe spots are shown in the partially resorbed, irregular shaped cores (red spots) and in the darker hydrothermal overgrowth rims (yellow spots). Titanite grew around Fe-Ti oxides that are now exsolved into Fe-oxides (bright) and rutile (gray). The hydrothermal overgrowths on titanite grains have feathered out into the surrounding chloritized biotite along cleavage planes. Minerals in the photo include titanite (Ttn), apatite (Ap), biotite/chlorite (Bio/Chl), quartz (Qz), hornblende (Hb), and feldspar (Fsp).
Geosciences 12 00229 g010
Figure 11. Backscattered electron (BSE) images of (A) titanite grain from the Oligocene Little Cottonwood stock, Utah showing patchy core zone with association with abundant Fe-Ti oxide grains overgrown by wavy light and dark oscillatory zones; (B) titanite grain from the Jurassic Notch Peak pluton, Utah similar to grain A above with patchy zoning and Fe-Ti oxides in the core overgrown by oscillatory-zoned titanite.
Geosciences 12 00229 g011
Figure 12. Fe versus Al in titanite from four Middle Jurassic plutons from the San Bernardino Mountains of southern California: John Bull Flat granite, Crystal Creek syenite, Rattlesnake Mountain granite, and the A-type Juniper Flats syenite. The high Al spots (Fe/Al < 1:1.5) are probably from hydrothermally precipitated titanite.
Geosciences 12 00229 g012
Figure 13. Ce + Nd versus Y pathways from core to rim in titanite grains from Middle Jurassic plutons from the San Bernardino Mountains of southern California compared to the same core to rim paths for several Cenozoic tuffs from the Great Basin and Colorado. On the diagram for the Cenozoic tuffs, fields are also shown for two of the grains from the California granites for comparison.
Geosciences 12 00229 g013
Figure 14. Top: Fe/Al, Fe/F, and Al/F ratios along electron microprobe traverses in two titanite grains (A and B) in a thin section of the Middle Jurassic Rattlesnake Mountain granite in southern California. Grain A has 30 analyses along the traverse and grain B has 51 analyses. Part of grain A (box) is blown up to give a better view of the dark titanite along the crack. Grain B has some open (plucked) black spaces along the traverse at the top right of the photo and a dark gray recrystallized or overgrowth section at the lower left of the grain from microprobe point 1 to about point 6 that is high in F.
Geosciences 12 00229 g014
Figure 15. Fe versus F for plutonic titanite and their metamorphic or hydrothermal overgrowths. Data sources are Rattlesnake Mountain pluton, California (this paper); Western Gneiss Region, Norway [109], and Rocky Range pluton, Utah (this paper). Shaded area is for 90% of other plutonic titanite in our database.
Geosciences 12 00229 g015
Figure 16. Fe versus Al in titanite for a few data sets where some points do not plot in the typical plutonic range (Fe/Al close to 1:1). Data sources are listed on the figure.
Geosciences 12 00229 g016
Figure 17. REE’s plotted versus normalized Fe in titanite. Data from different genetic groups are shown along with data from granodiorite of the Menderes Massif, western Turkey [117].
Geosciences 12 00229 g017
Figure 18. Backscattered electron (BSE) images of (A) titanite grains from the Oligocene Little Cottonwood stock, Utah, showing typical euhedral shape for plutonic grains and, on the right side of the photo, overgrowths of titanite (Ttn) out into the surrounding chloritized biotite (Bt and Chl). Other mineral inclusions are magnetite (Mag), apatite (Ap), and ilmenite (Ilm). (B) Blow-up of the tip of the grain on the right in (A). (C) Titanite grain from the Jurassic Notch Peak pluton, Utah, with overgrowth extensions out into a neighboring chloritized biotite.
Geosciences 12 00229 g018
Figure 19. Backscattered electron (BSE) images of titanite from the Jurassic Notch Peak pluton, Utah. These grains have been partially recrystallized, probably as they interacted with a hydrothermal fluid. The replaced portions of the crystals are darker (lower in REE) and cut across the earlier formed oscillatory zones, but the exterior shapes were nearly preserved. In (A), the large grain has a prominent dark embayment of recrystallized titanite along the lower central margin. Below this embayment are several smaller titanite crystals that have all been partially replaced. (B) A titanite grain where almost half of the original has been replaced with a distinctive low REE and high Al composition. In all the grains, the original euhedral shape has been preserved during the recrystallization process.
Geosciences 12 00229 g019
Figure 20. Fe versus Al in titanite from SiO2-undersaturated rocks with the four main data sets from Granite Mountain, Arkansas (green), Magnet Cove, Arkansas (red), Limberg t3 Tuff of Kaiserstuhl region, Germany (blue), and Saima alkaline complex, China (yellow), highlighted. Data for Saima complex [77], and for Magnet Cove, Granite Mountain, and Kaiserstuhl (this paper). Shaded area is for 90% of plutonic titanite for comparison.
Geosciences 12 00229 g020
Figure 21. Fe/(Fe + Al) plotted versus Nb/(Nb + Y) for various types of titanite. Not included are analyses of titanite from hydrothermal, skarn, and pegmatite environments, which scatter more widely.
Geosciences 12 00229 g021
Figure 22. BSE images of titanite grains from silica-undersaturated rocks. (A) Euhedral titanite grain from ijolite xenolith in nepheline syenite from the Magnet Cove complex, Arkansas, with oscillatory zoning parallel to (111) crystal faces. (B) Euhedral titanite grain from the phonolitic Limberg t3 Tuff, Kaiserstuhl region, Germany, with patchy and oscillatory zoning.
Geosciences 12 00229 g022
Figure 23. Fe versus Al in titanite from eclogites. Titanite grains from these rocks are typically more Al-rich and Fe-poor than any other genetic group. Data sources are shown on the figure.
Geosciences 12 00229 g023
Figure 24. BSE images of some titanite grains from metamorphic rocks. (A) Subhedral titanite grain with dark REE-poor rim from a banded Precambrian granitic gneiss, Herschel Township, Hastings County, Ontario. (B) Titanite (Ttn—light gray) between grains of amphibole (Amp—medium gray) and feldspar (Fsp—dark gray) in a Precambrian gneiss, north of Lake Clear, Renfrew County, Ontario. (C) Subhedral titanite with bright REE-enriched rim from biotite schist in the Precambrian Santaquin Complex near Santaquin, Utah.
Geosciences 12 00229 g024
Figure 25. Fe versus Al in titanite from skarns and related ore deposits. Titanite from deposits rich in Fe, Cu, and Au (squares and red shades) plot at higher Fe/Al values (>1:3) than does titanite from deposits rich in W and Sn (circles and green shades, which have Fe/Al values (<1:4), except for a few data point exceptions. The data come from the following sources: [16,31,35,51,57,61,105,132,133,134].
Geosciences 12 00229 g025
Figure 26. Fe versus Al for titanite from several pegmatites. Fields shown are drawn at 90% of data for titanite from volcanic (red shading) and plutonic rocks (green shading) for comparison. Sources for the data are shown in the figure.
Geosciences 12 00229 g026
Figure 27. BSE image of titanite grain from a miarolitic cavity in an aplite west of Milford, Utah (a). These miarolitic cavities also contain K-feldspar, albite, epidote, smoky quartz, and fluorite crystals. This titanite grain was broken out of the cavity but preserves (along top of photo) the euhedral edge that was growing into the cavity. The graphs at the right show that the dark gray rim has high Al and F as well as low Fe and LREE (La, Ce, Nd, Sm) concentrations (b).
Geosciences 12 00229 g027
Figure 28. Blow-up of part of the titanite crystal shown in Figure 27. (A) Bright core zone with Fe/Al ~ 1:1 and high LREE. (B) Wavy zone with Fe/Al still about 1:1, but more variable LREE trending to lower values (and brightness). (C) Euhedral rim zone with many fluid inclusions, high Al and F, and low Fe and LREE. Annealed cracks terminating at the boundary between the core and wavy zones now represented by fluid inclusion trails (D) or by cracks with a secondary titanite that has lower LREE (E).
Geosciences 12 00229 g028
Figure 29. Fe + Al versus F in titanite from various environments. The correlation coefficients (r) and number of analyses (n) in each group are shown.
Geosciences 12 00229 g029
Figure 30. Al versus F in titanite from various environments. The correlation coefficients (r) and number of analyses (n) in each group are shown. Data from two samples constitute most of the points on the pegmatite graph and are enclosed and labeled-Bancroft, Ontario, and Dunje, Macedonia.
Geosciences 12 00229 g030
Figure 31. Fe versus F in titanite from various environment. The correlation coefficients (r) and number of analyses (n) in each group are shown.
Geosciences 12 00229 g031
Figure 32. Fe versus LREE + Y in titanite from volcanic and plutonic rocks. The correlation coefficients (r) and number of analyses (n) in each group are shown.
Geosciences 12 00229 g032
Figure 33. Fe versus LREE + Y in titanite from silica undersaturated rocks and metamorphic rocks. The correlation coefficient (r) and number of analyses (n) are shown.
Geosciences 12 00229 g033
Figure 34. Fe versus Nb in titanite from silica-undersaturated rocks plotted as atoms per formula unit (pfu). A general positive correlation of Nb and Fe suggests a coupled substitution for charge balancing in the Ti site.
Geosciences 12 00229 g034
Publisher’s Note: MDPI stays neutral with regard to jurisdictional claims in published maps and institutional affiliations.

