
Environmental and Biological Controls on Sedimentary Bottom Types in the Puquios of the Salar de Llamara, Northern Chile

 , , ,
, , ,
Abstract
:1. Introduction
Background
2. Materials and Methods
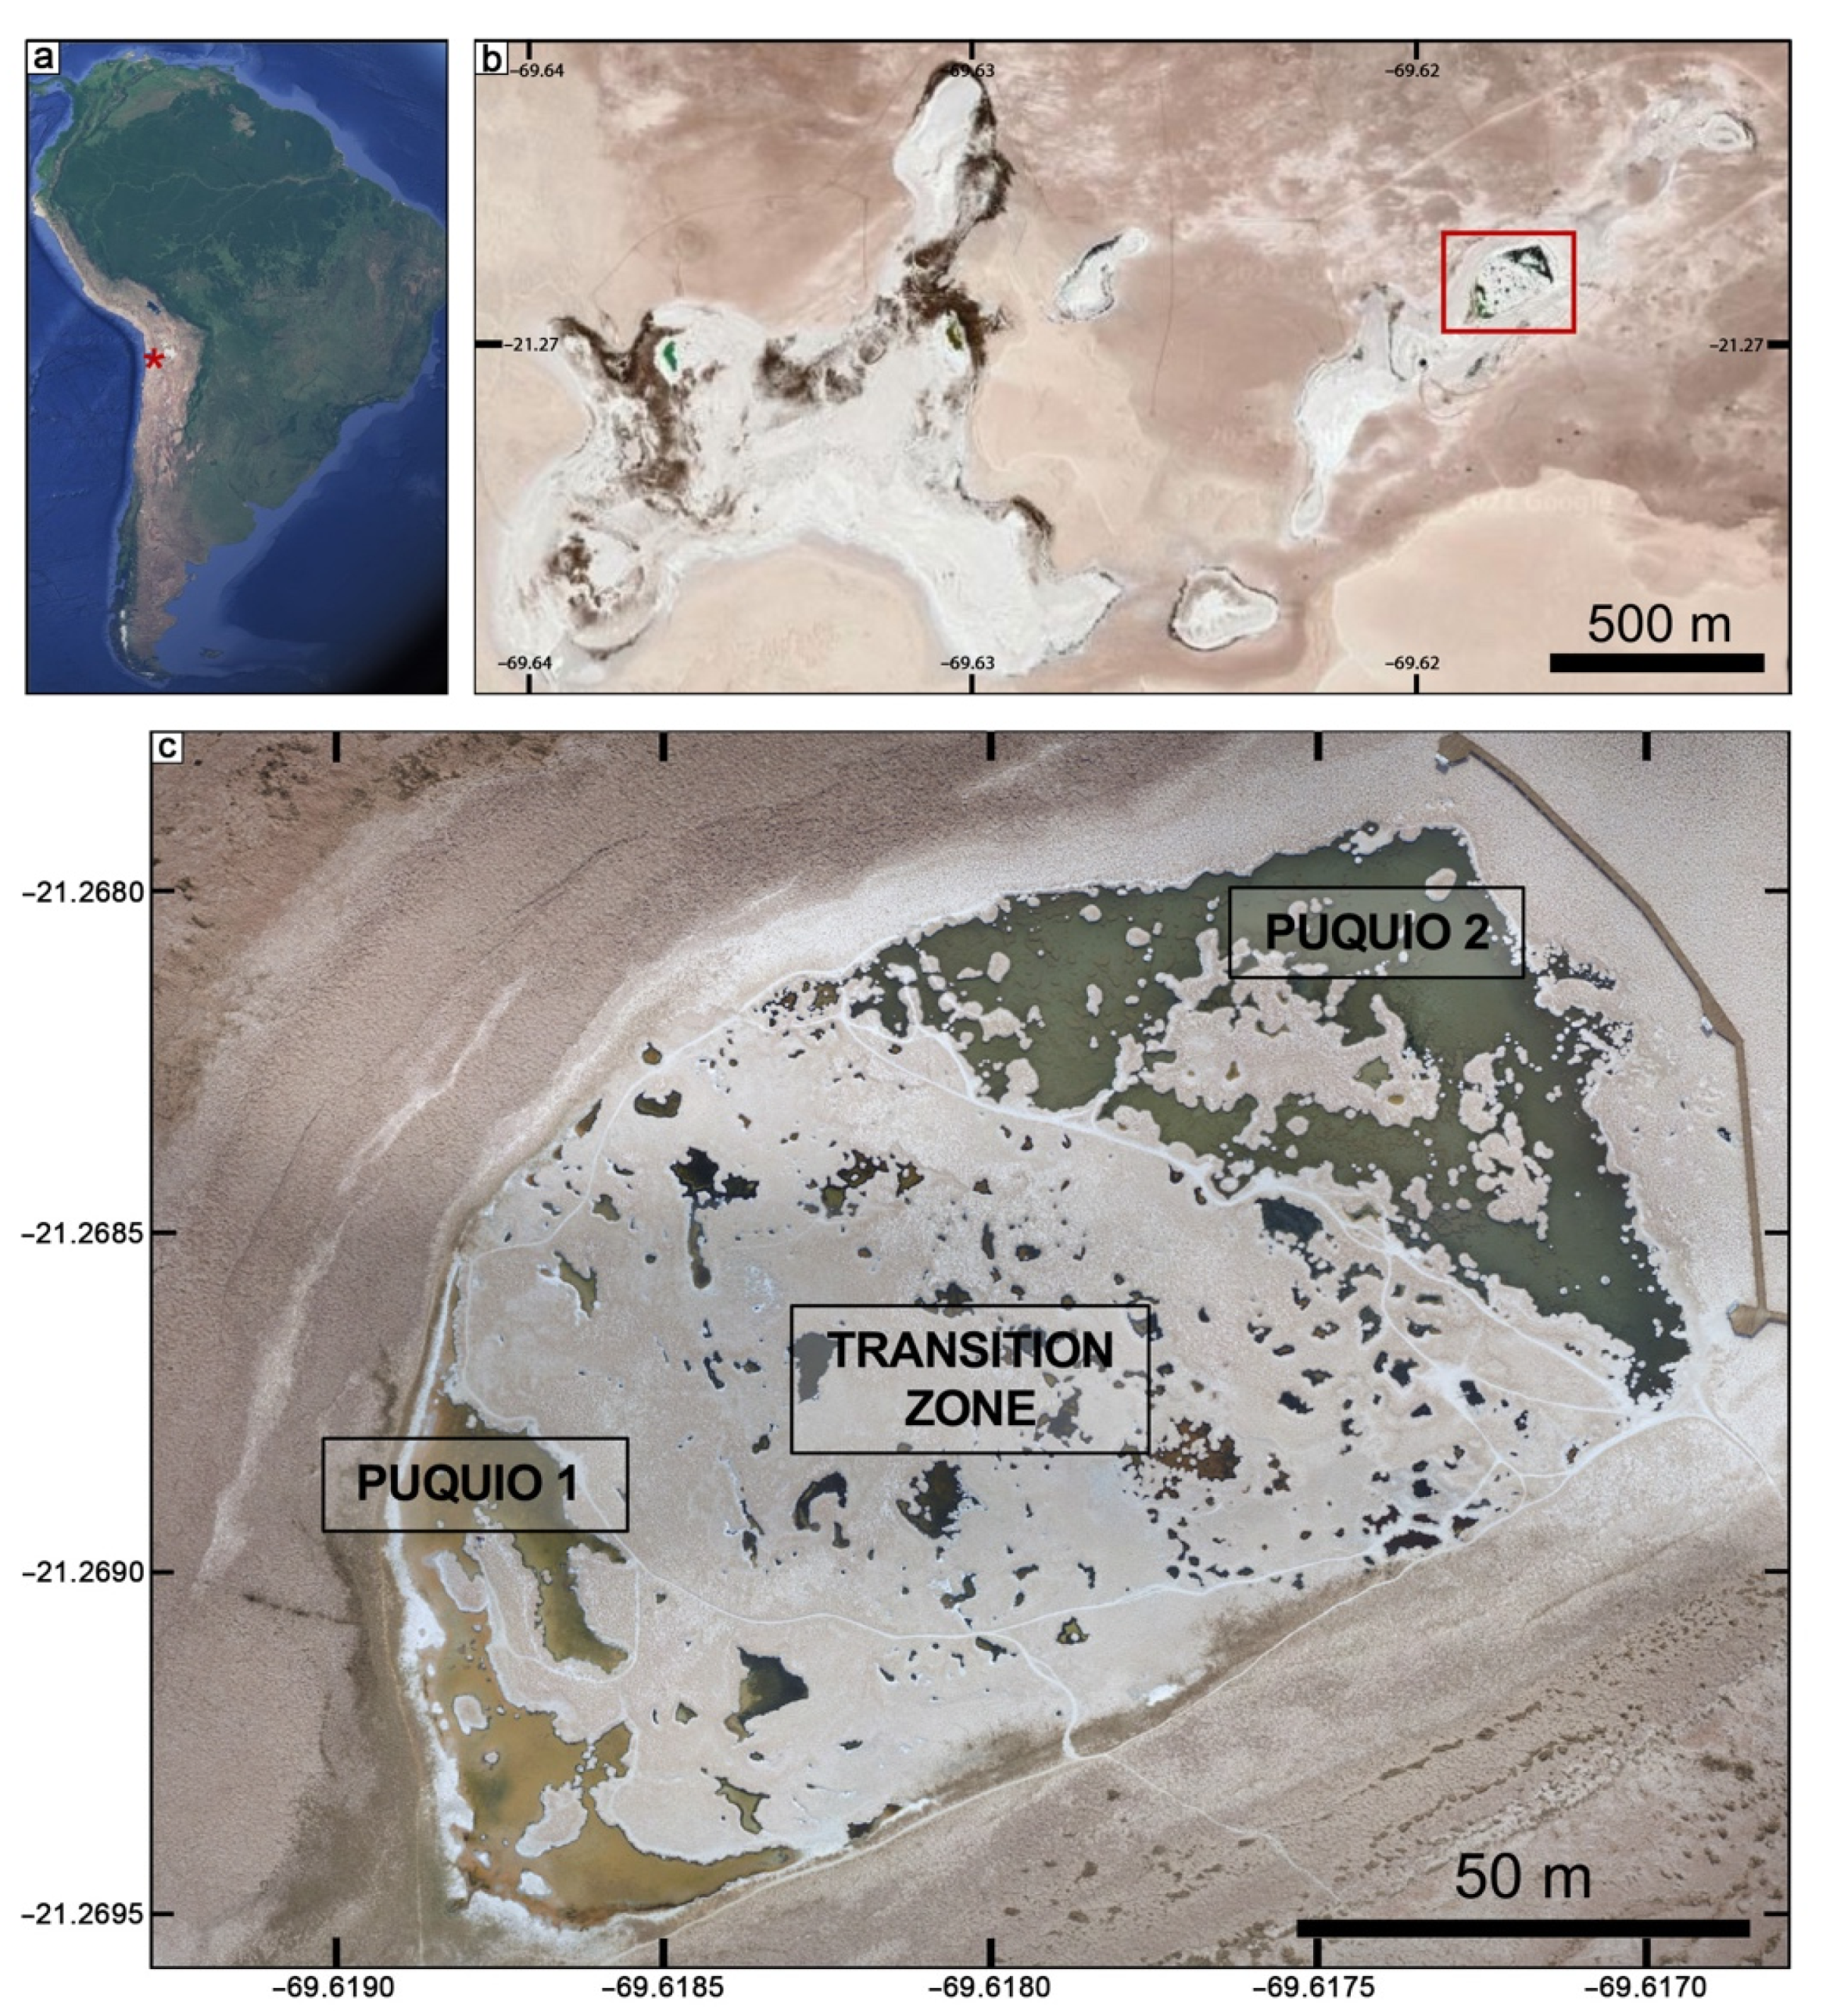
2.1. Field Studies
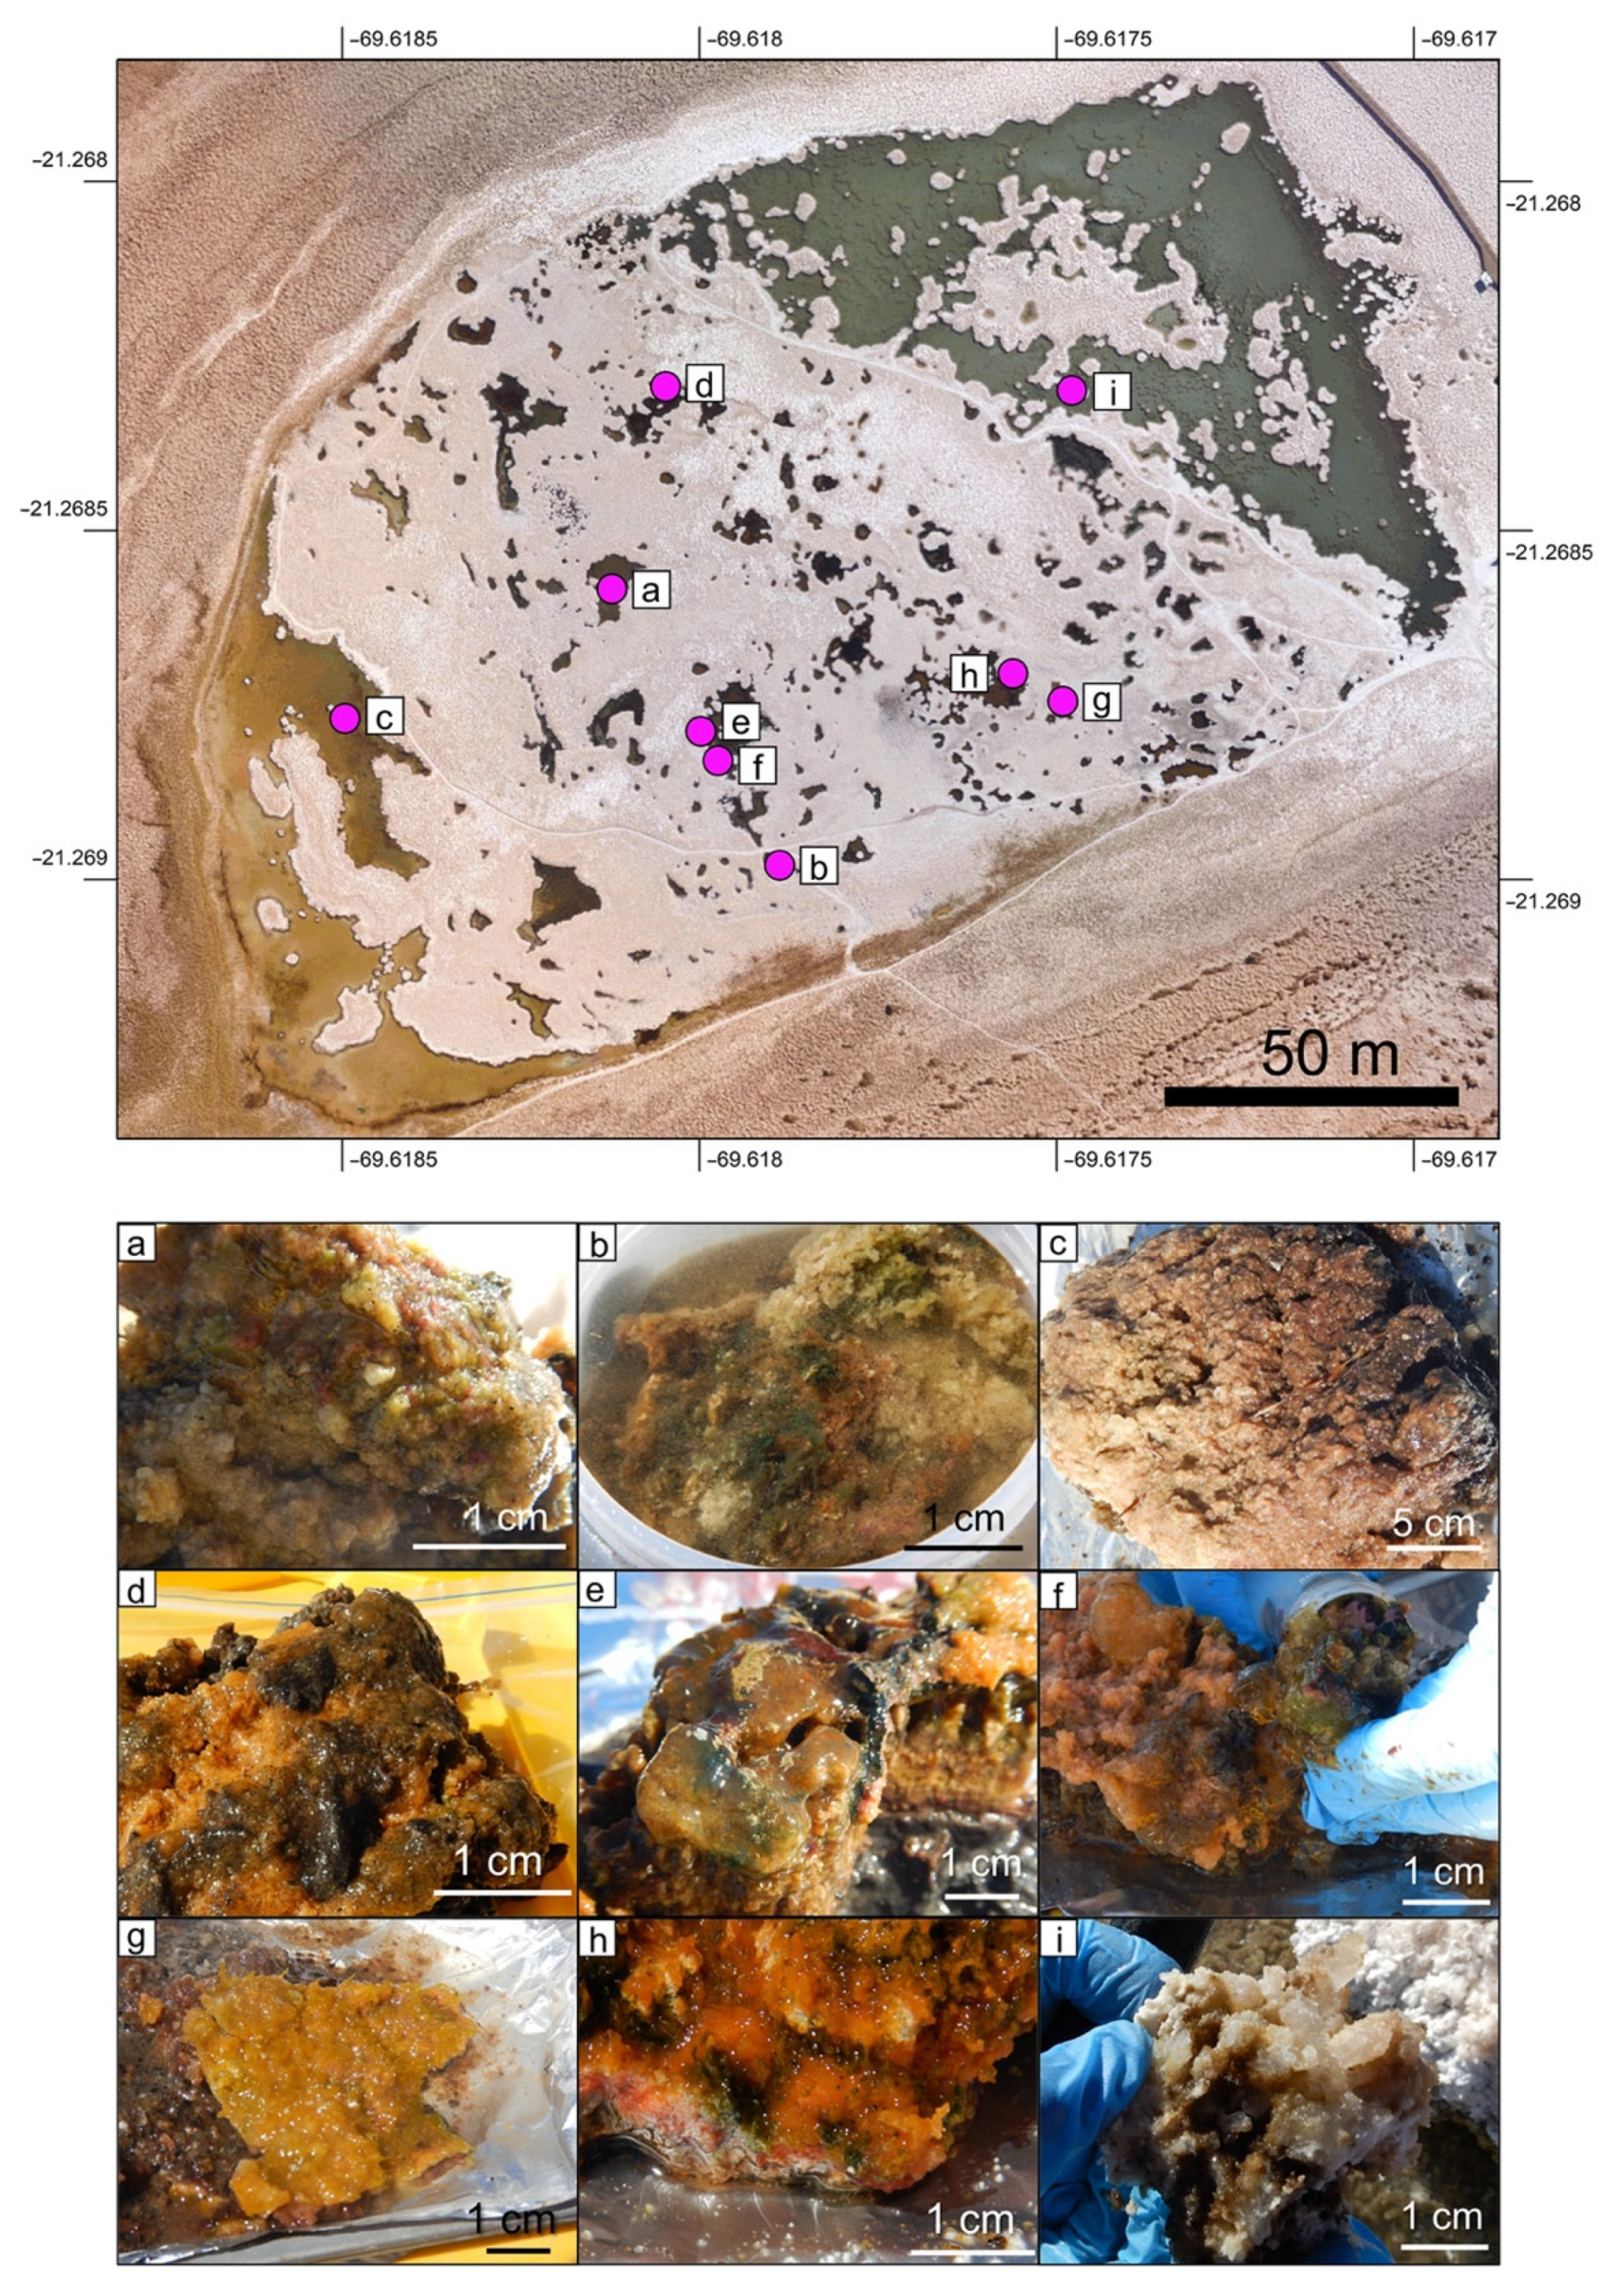
2.2. Laboratory Analyses of Samples
2.3. Statistical Analyses
3. Results
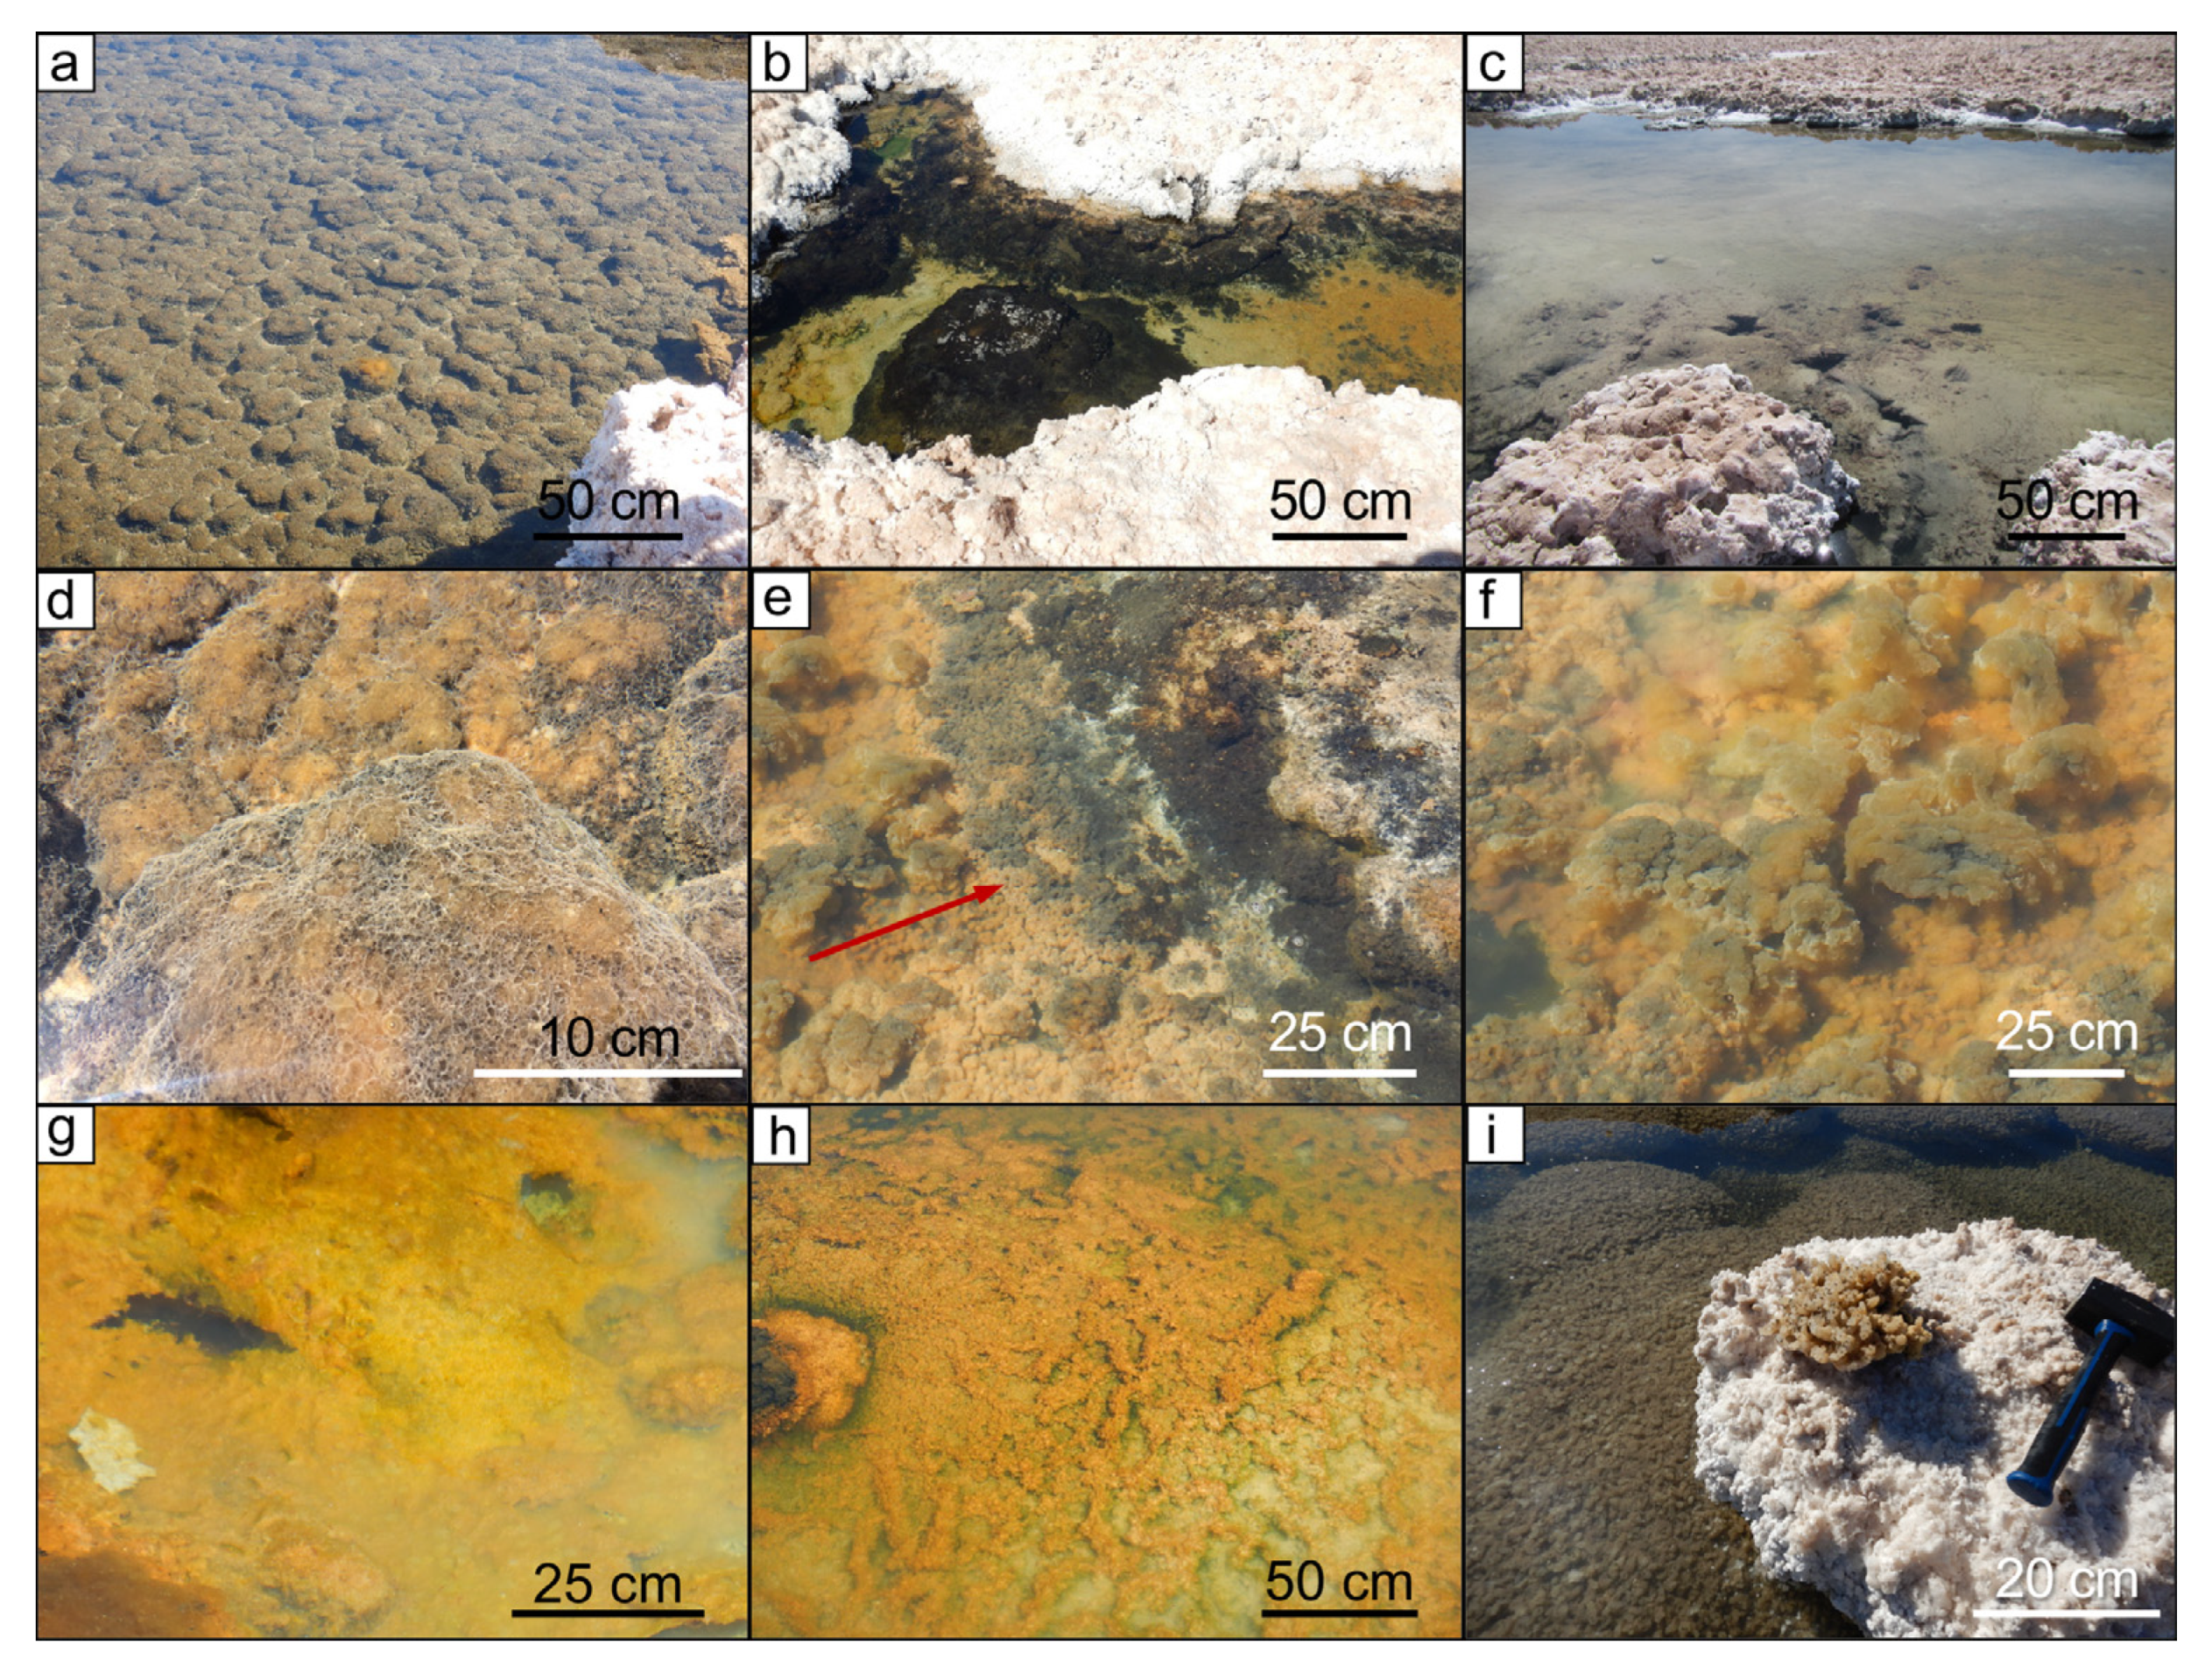
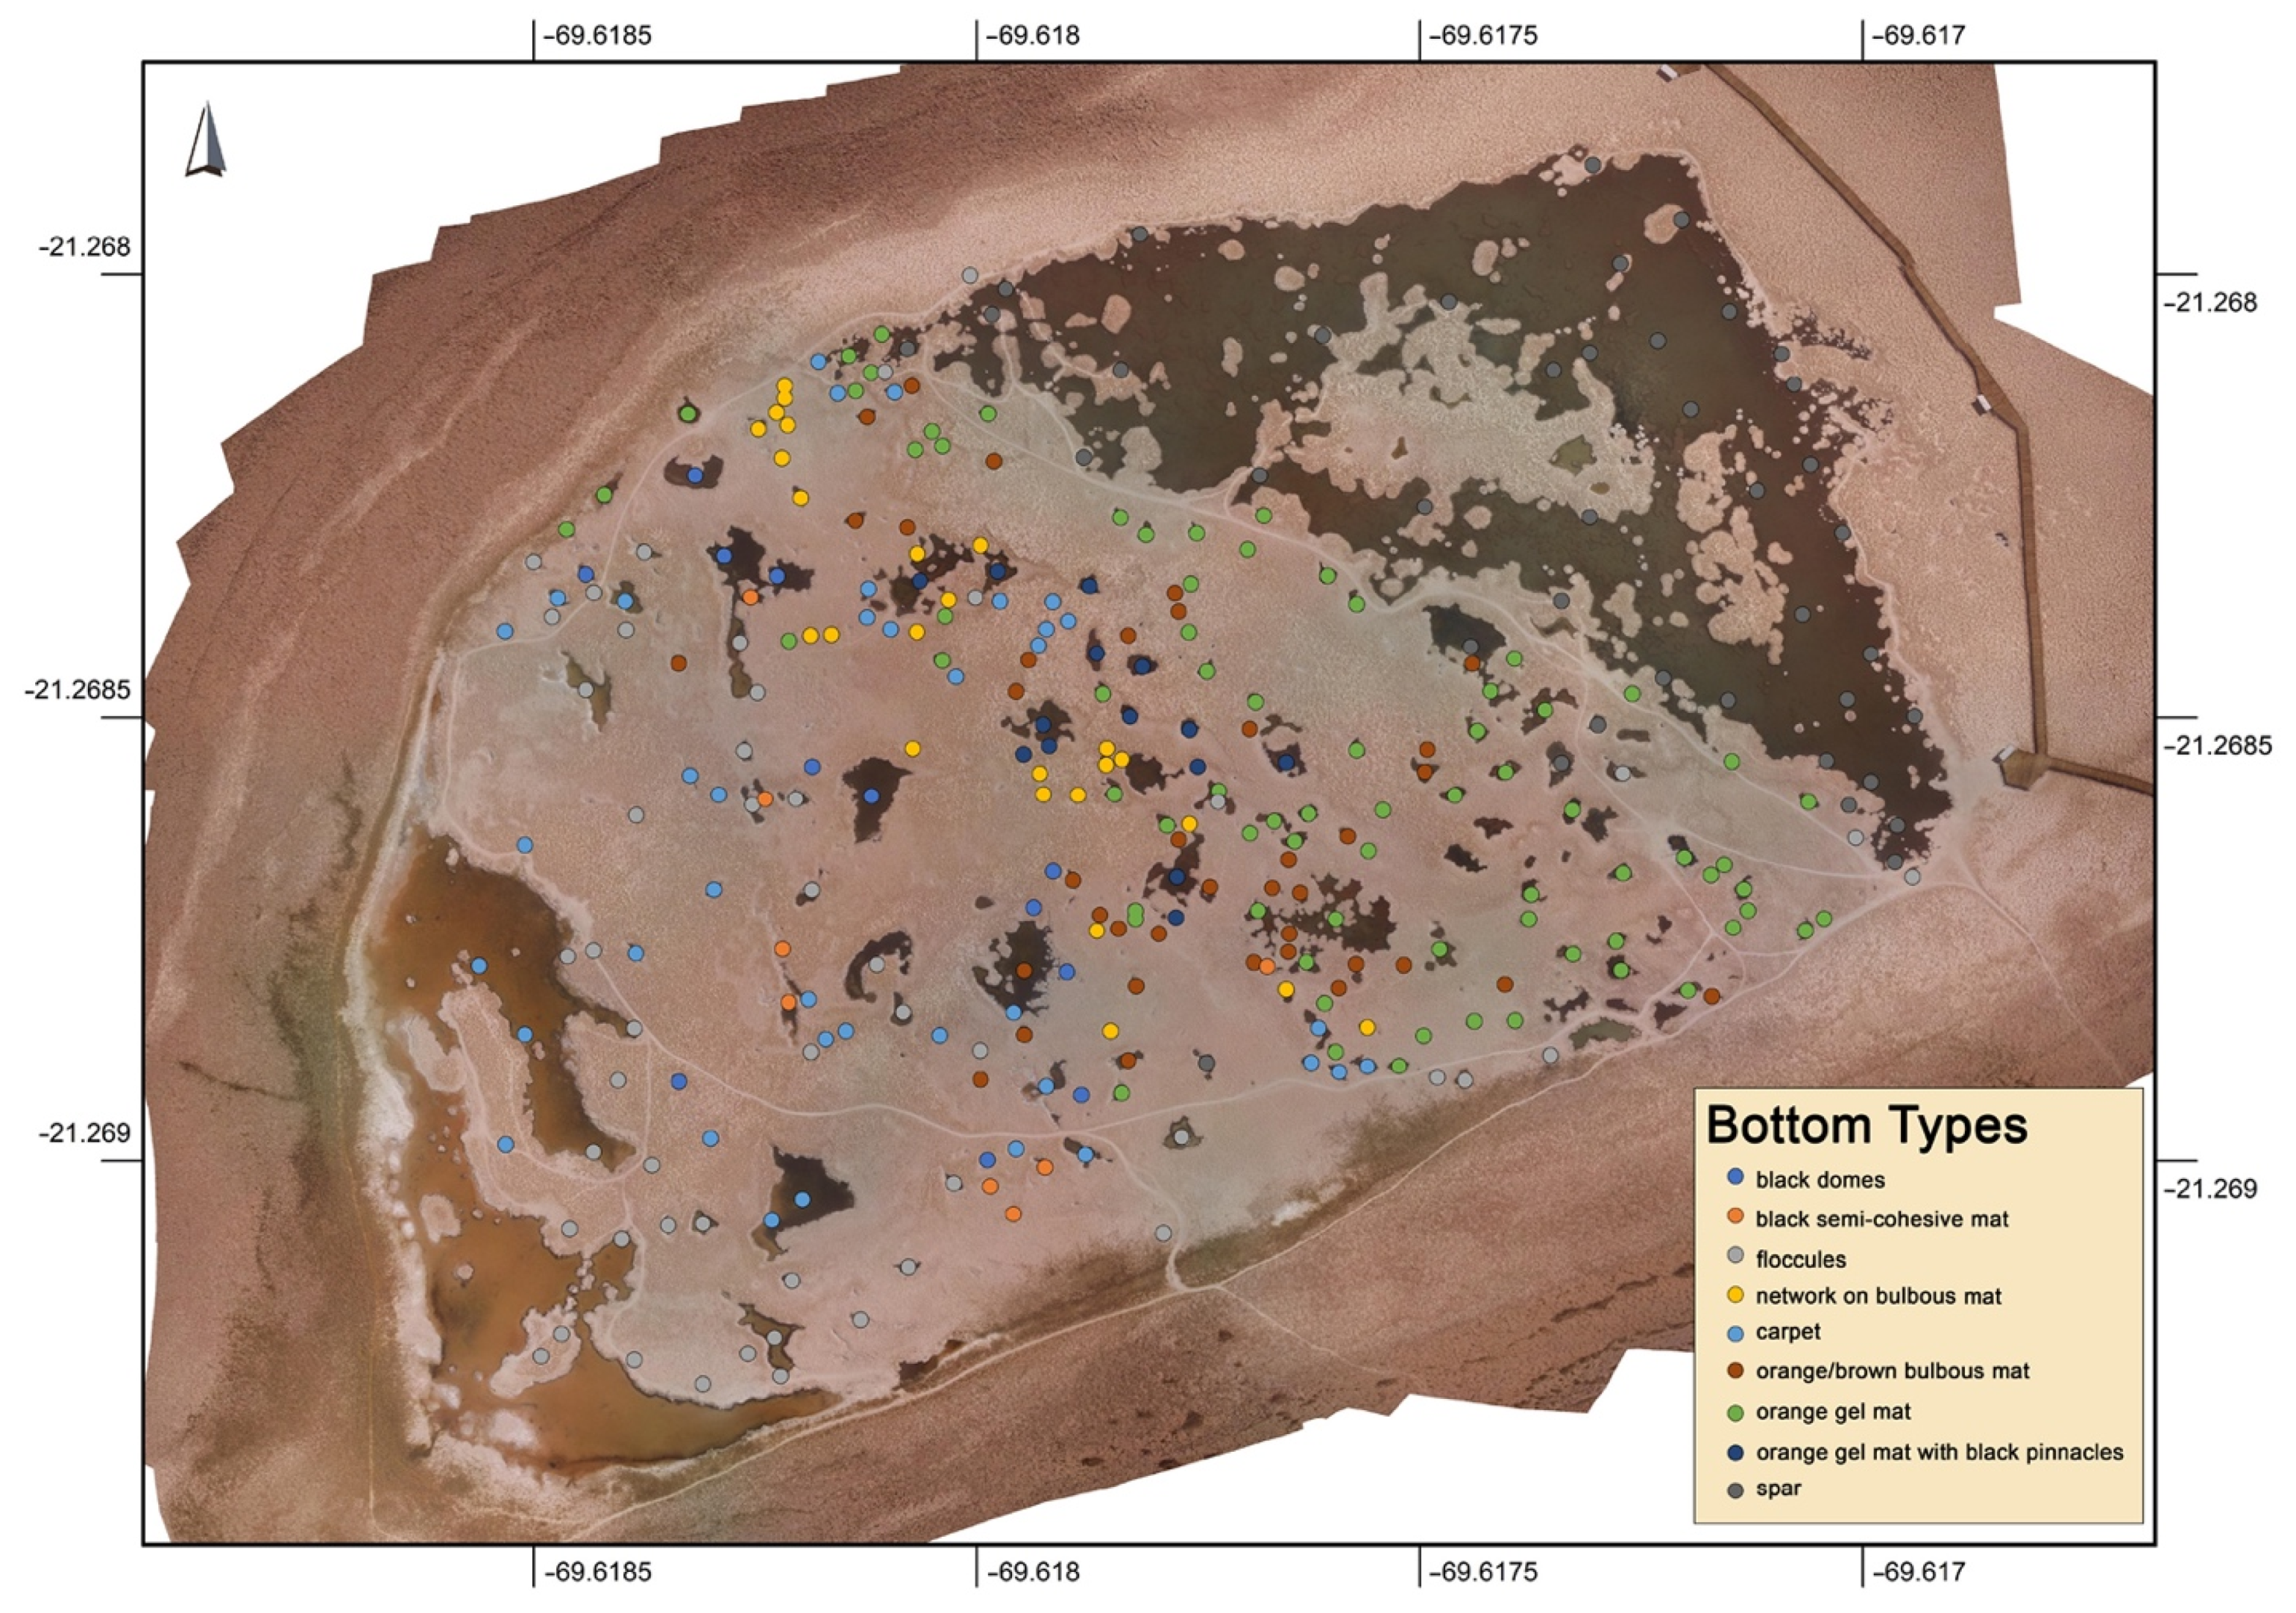
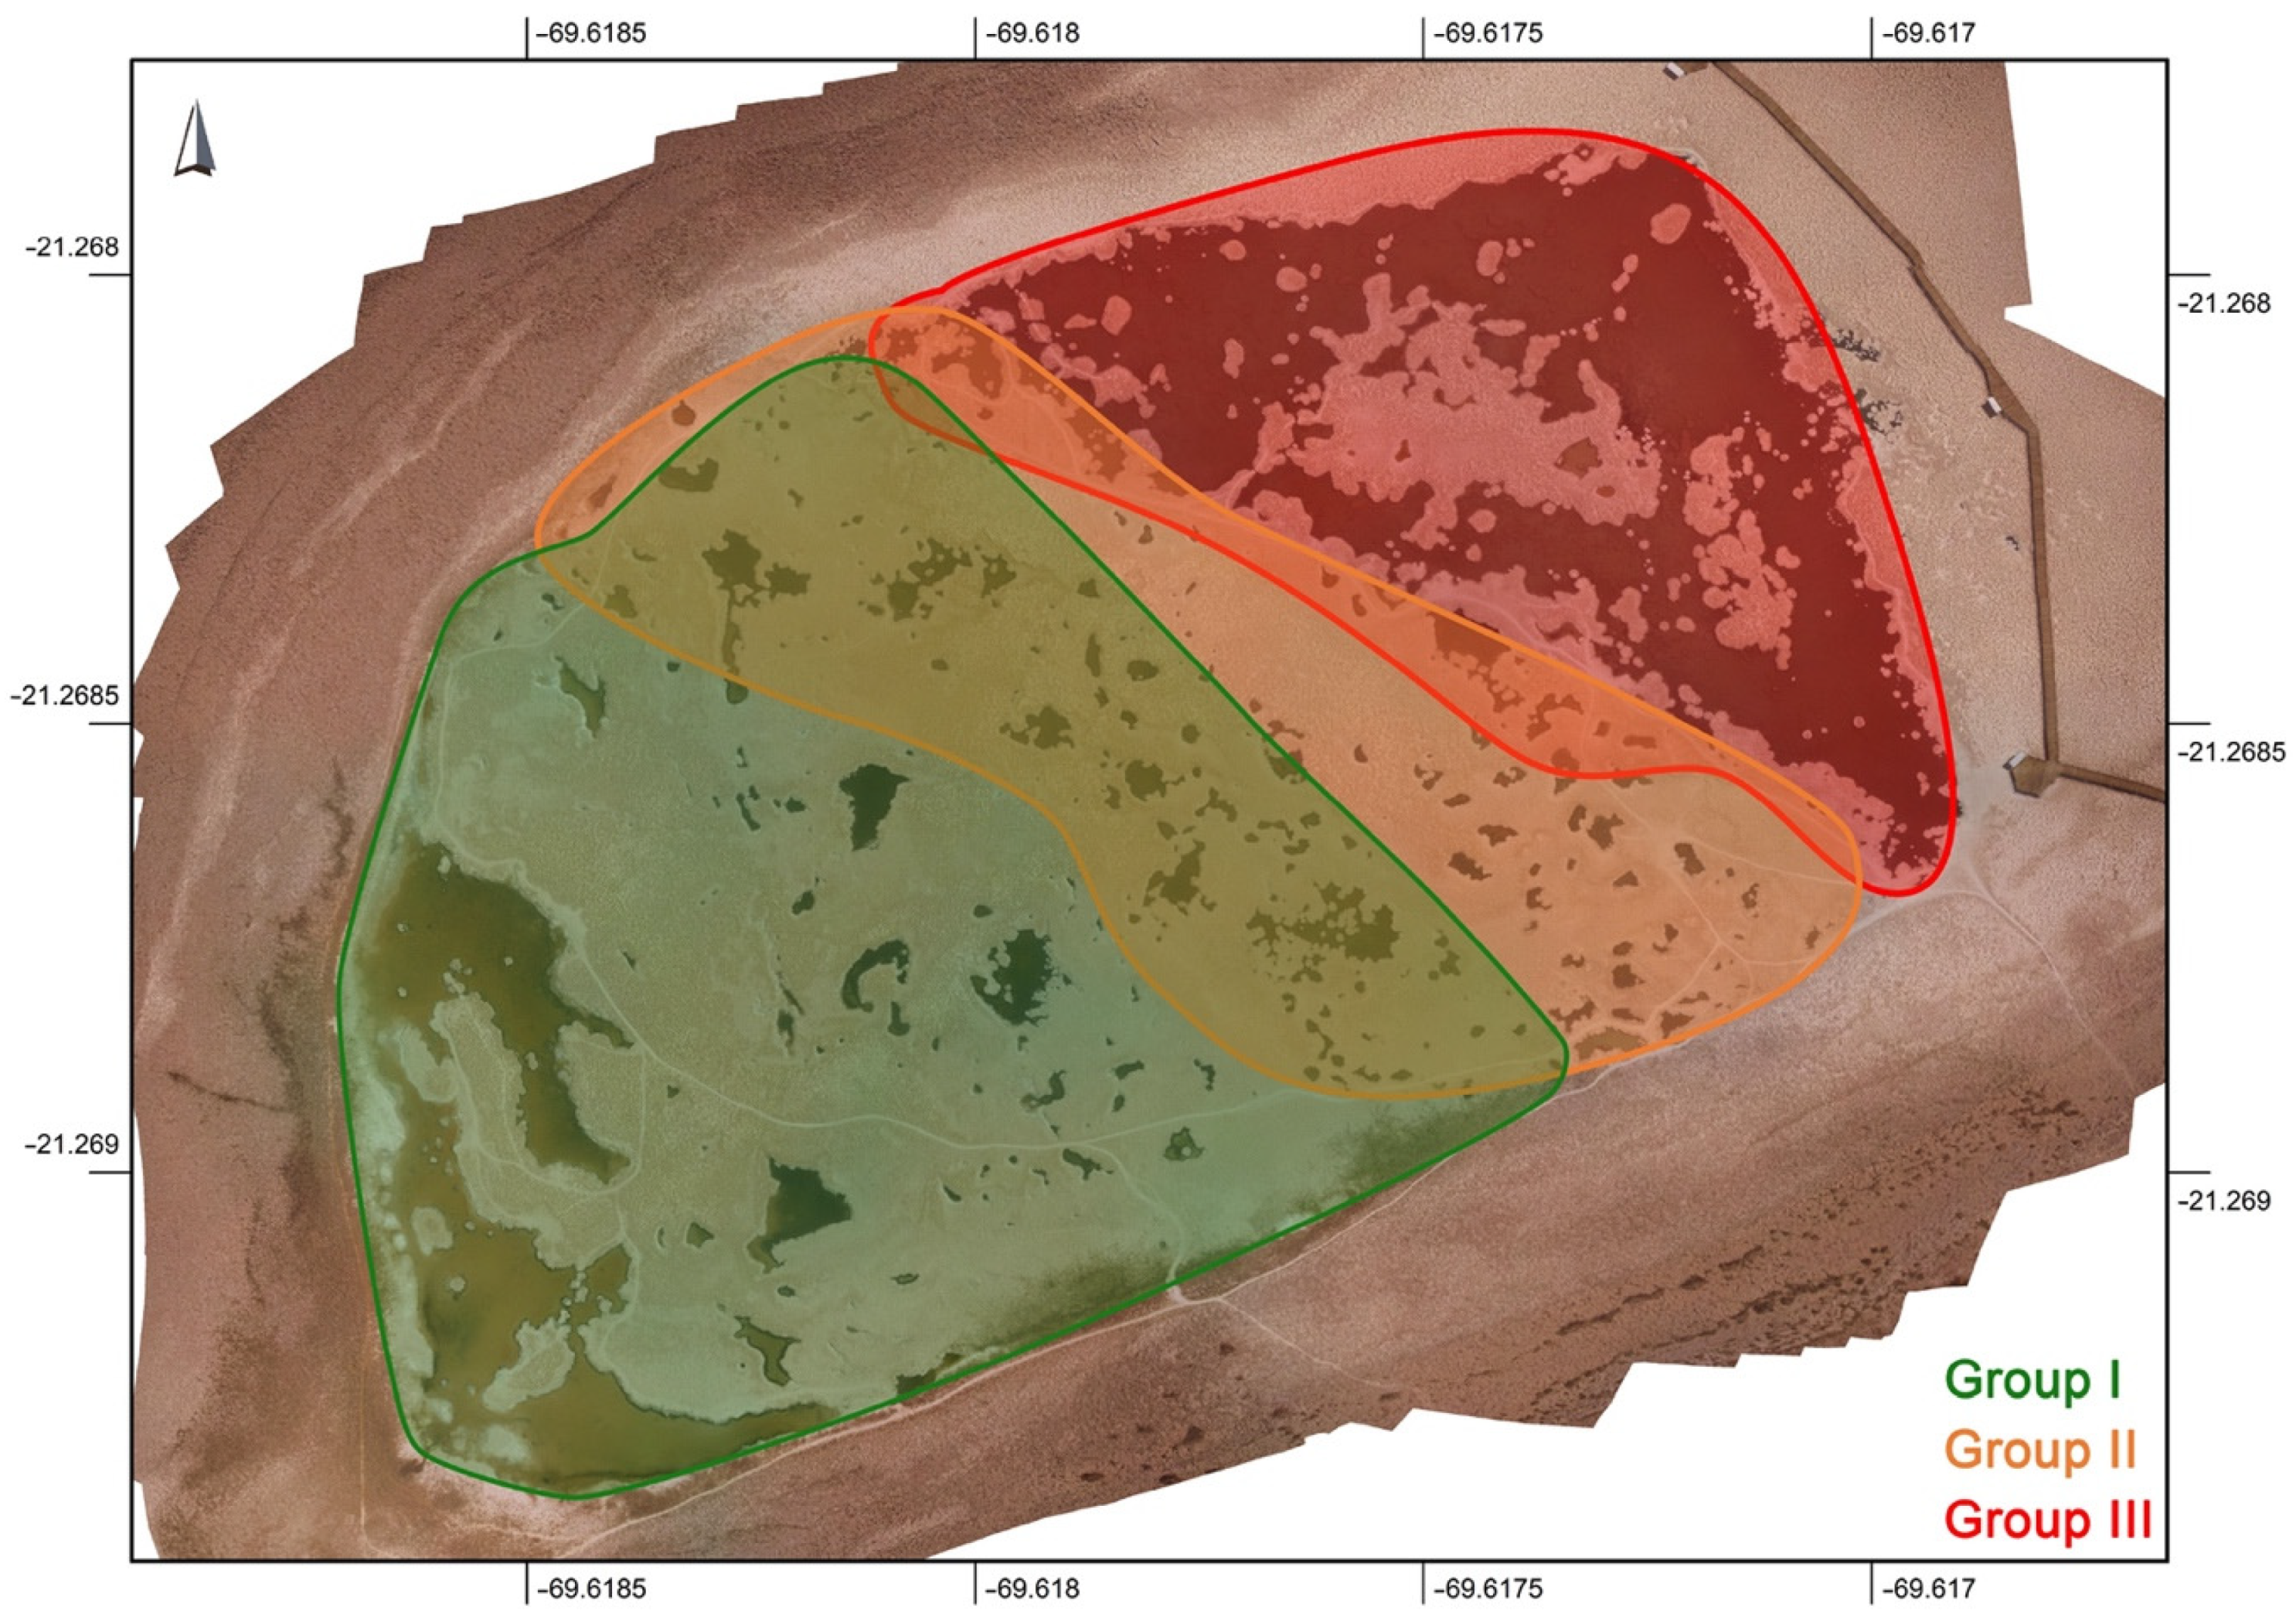
3.1. Field Studies
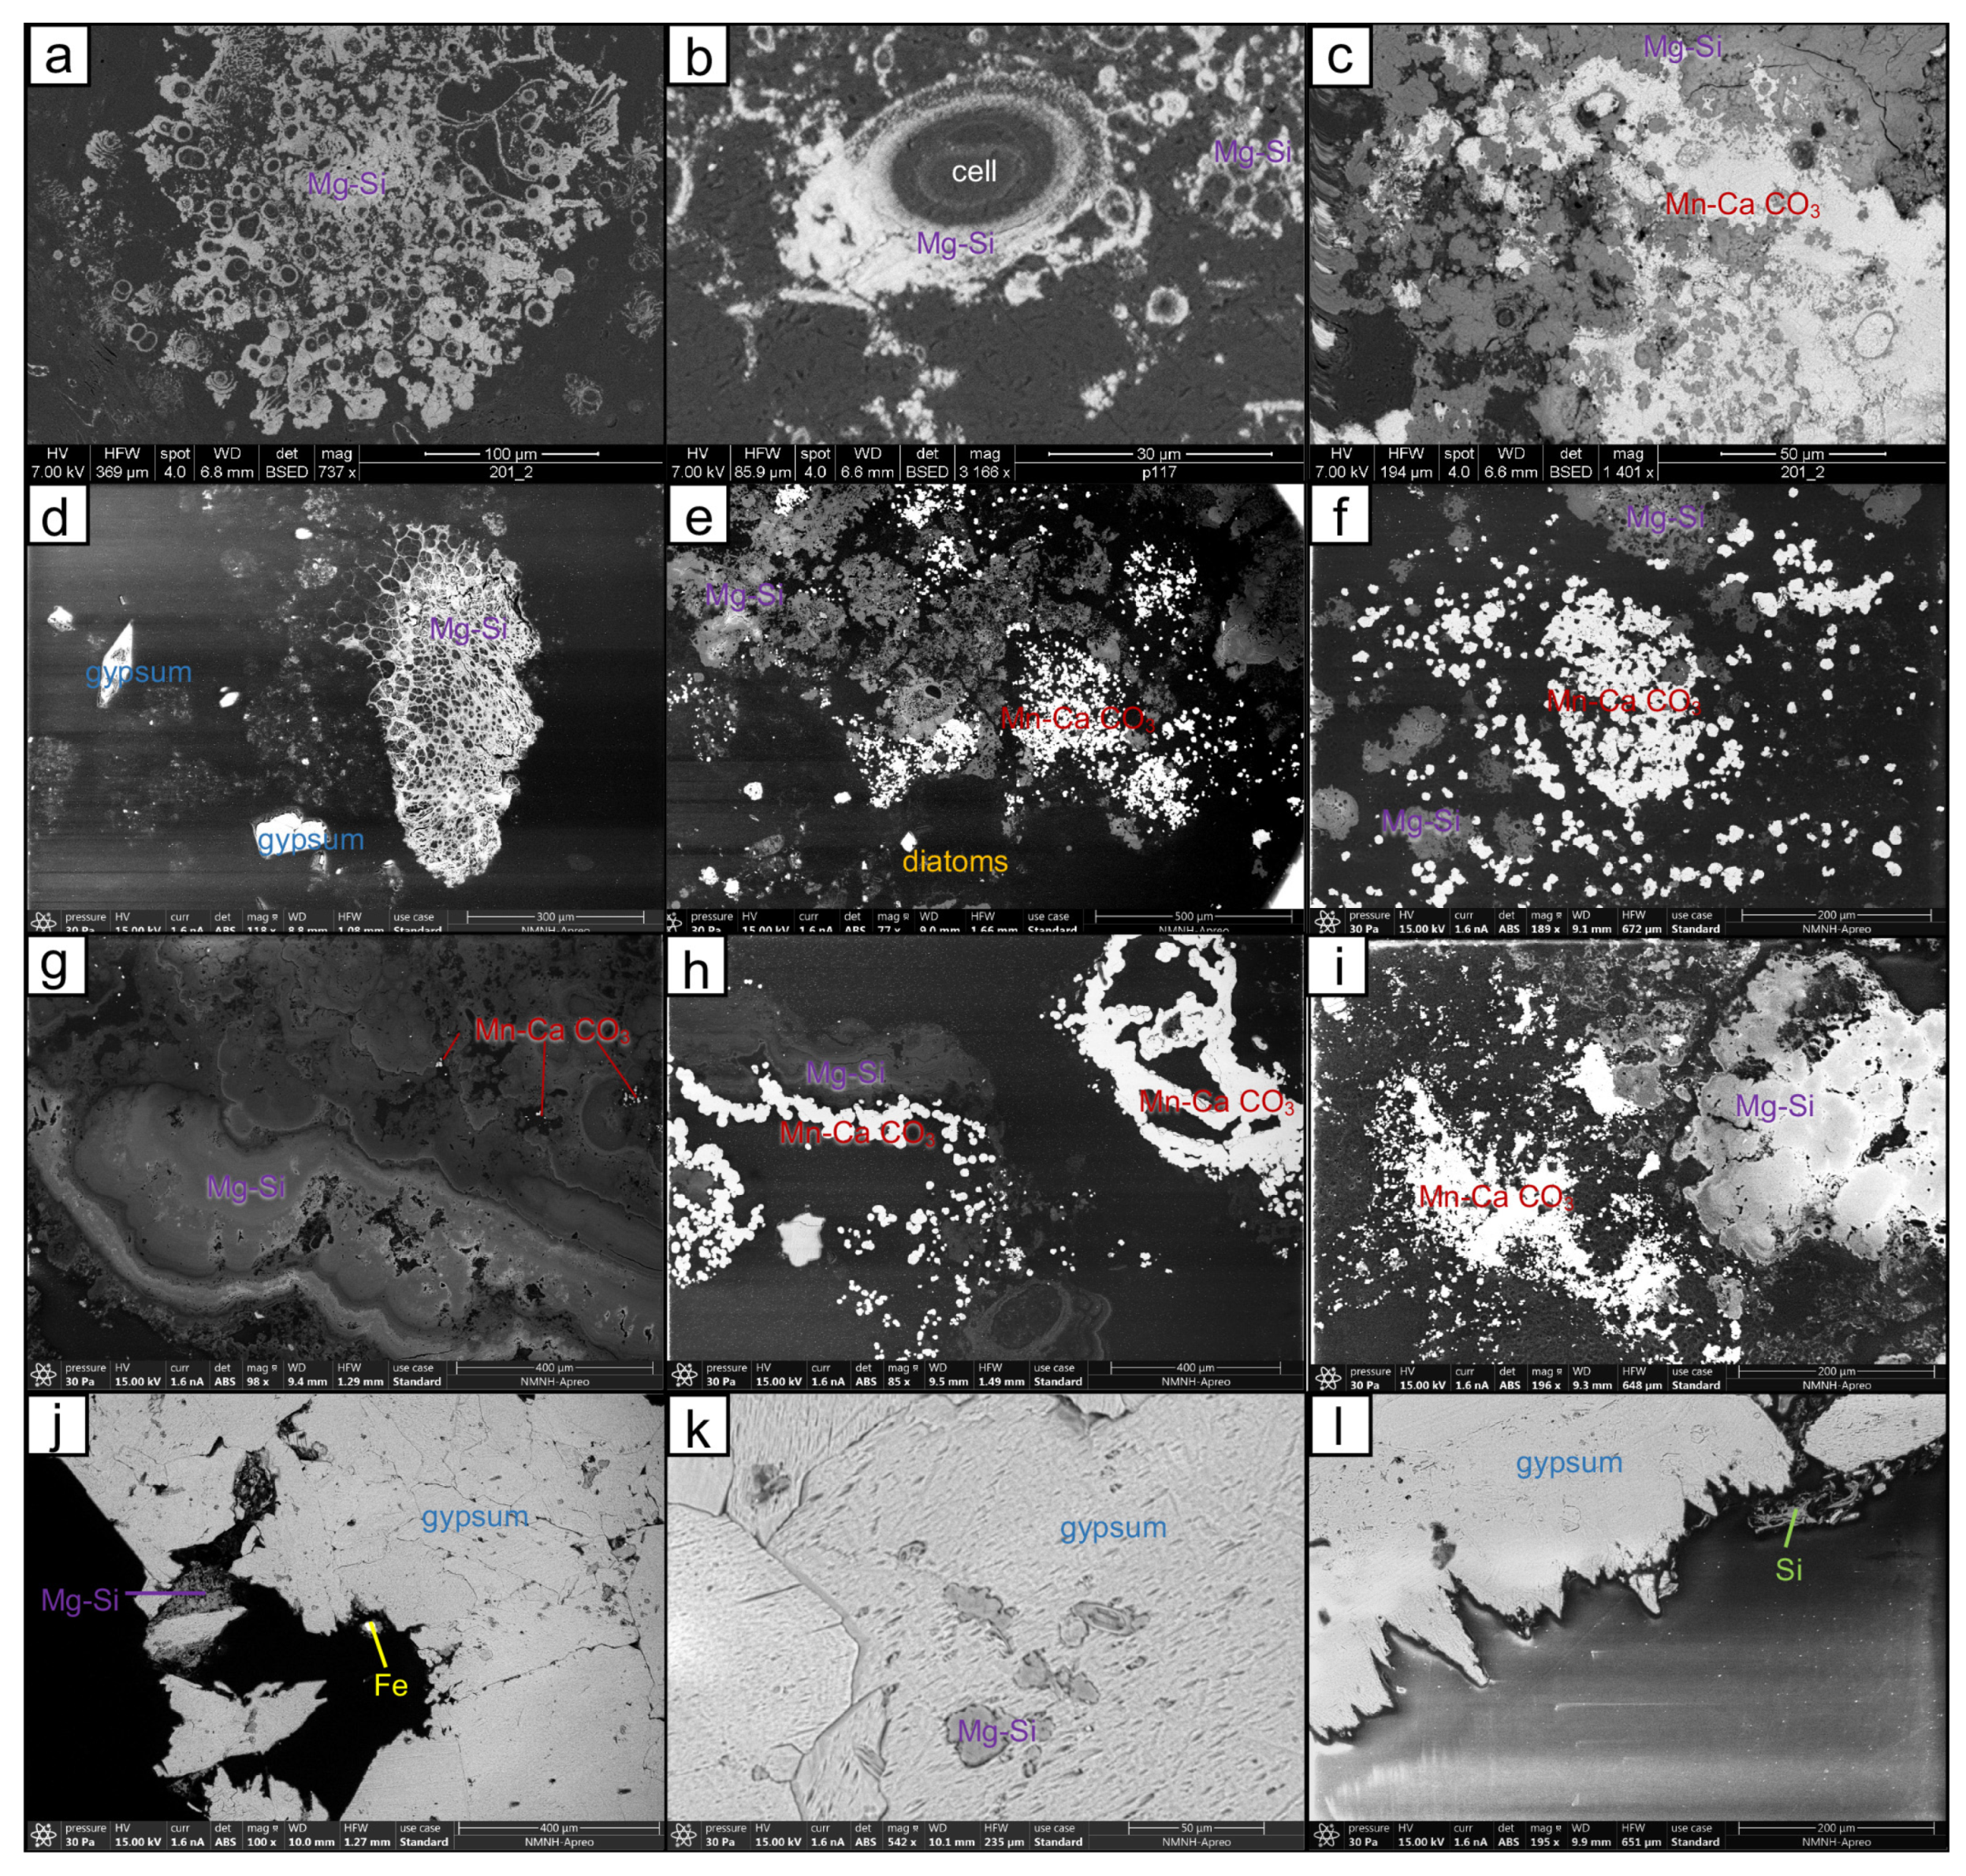
3.2. Laboratory Analyses of Bottom Type Samples
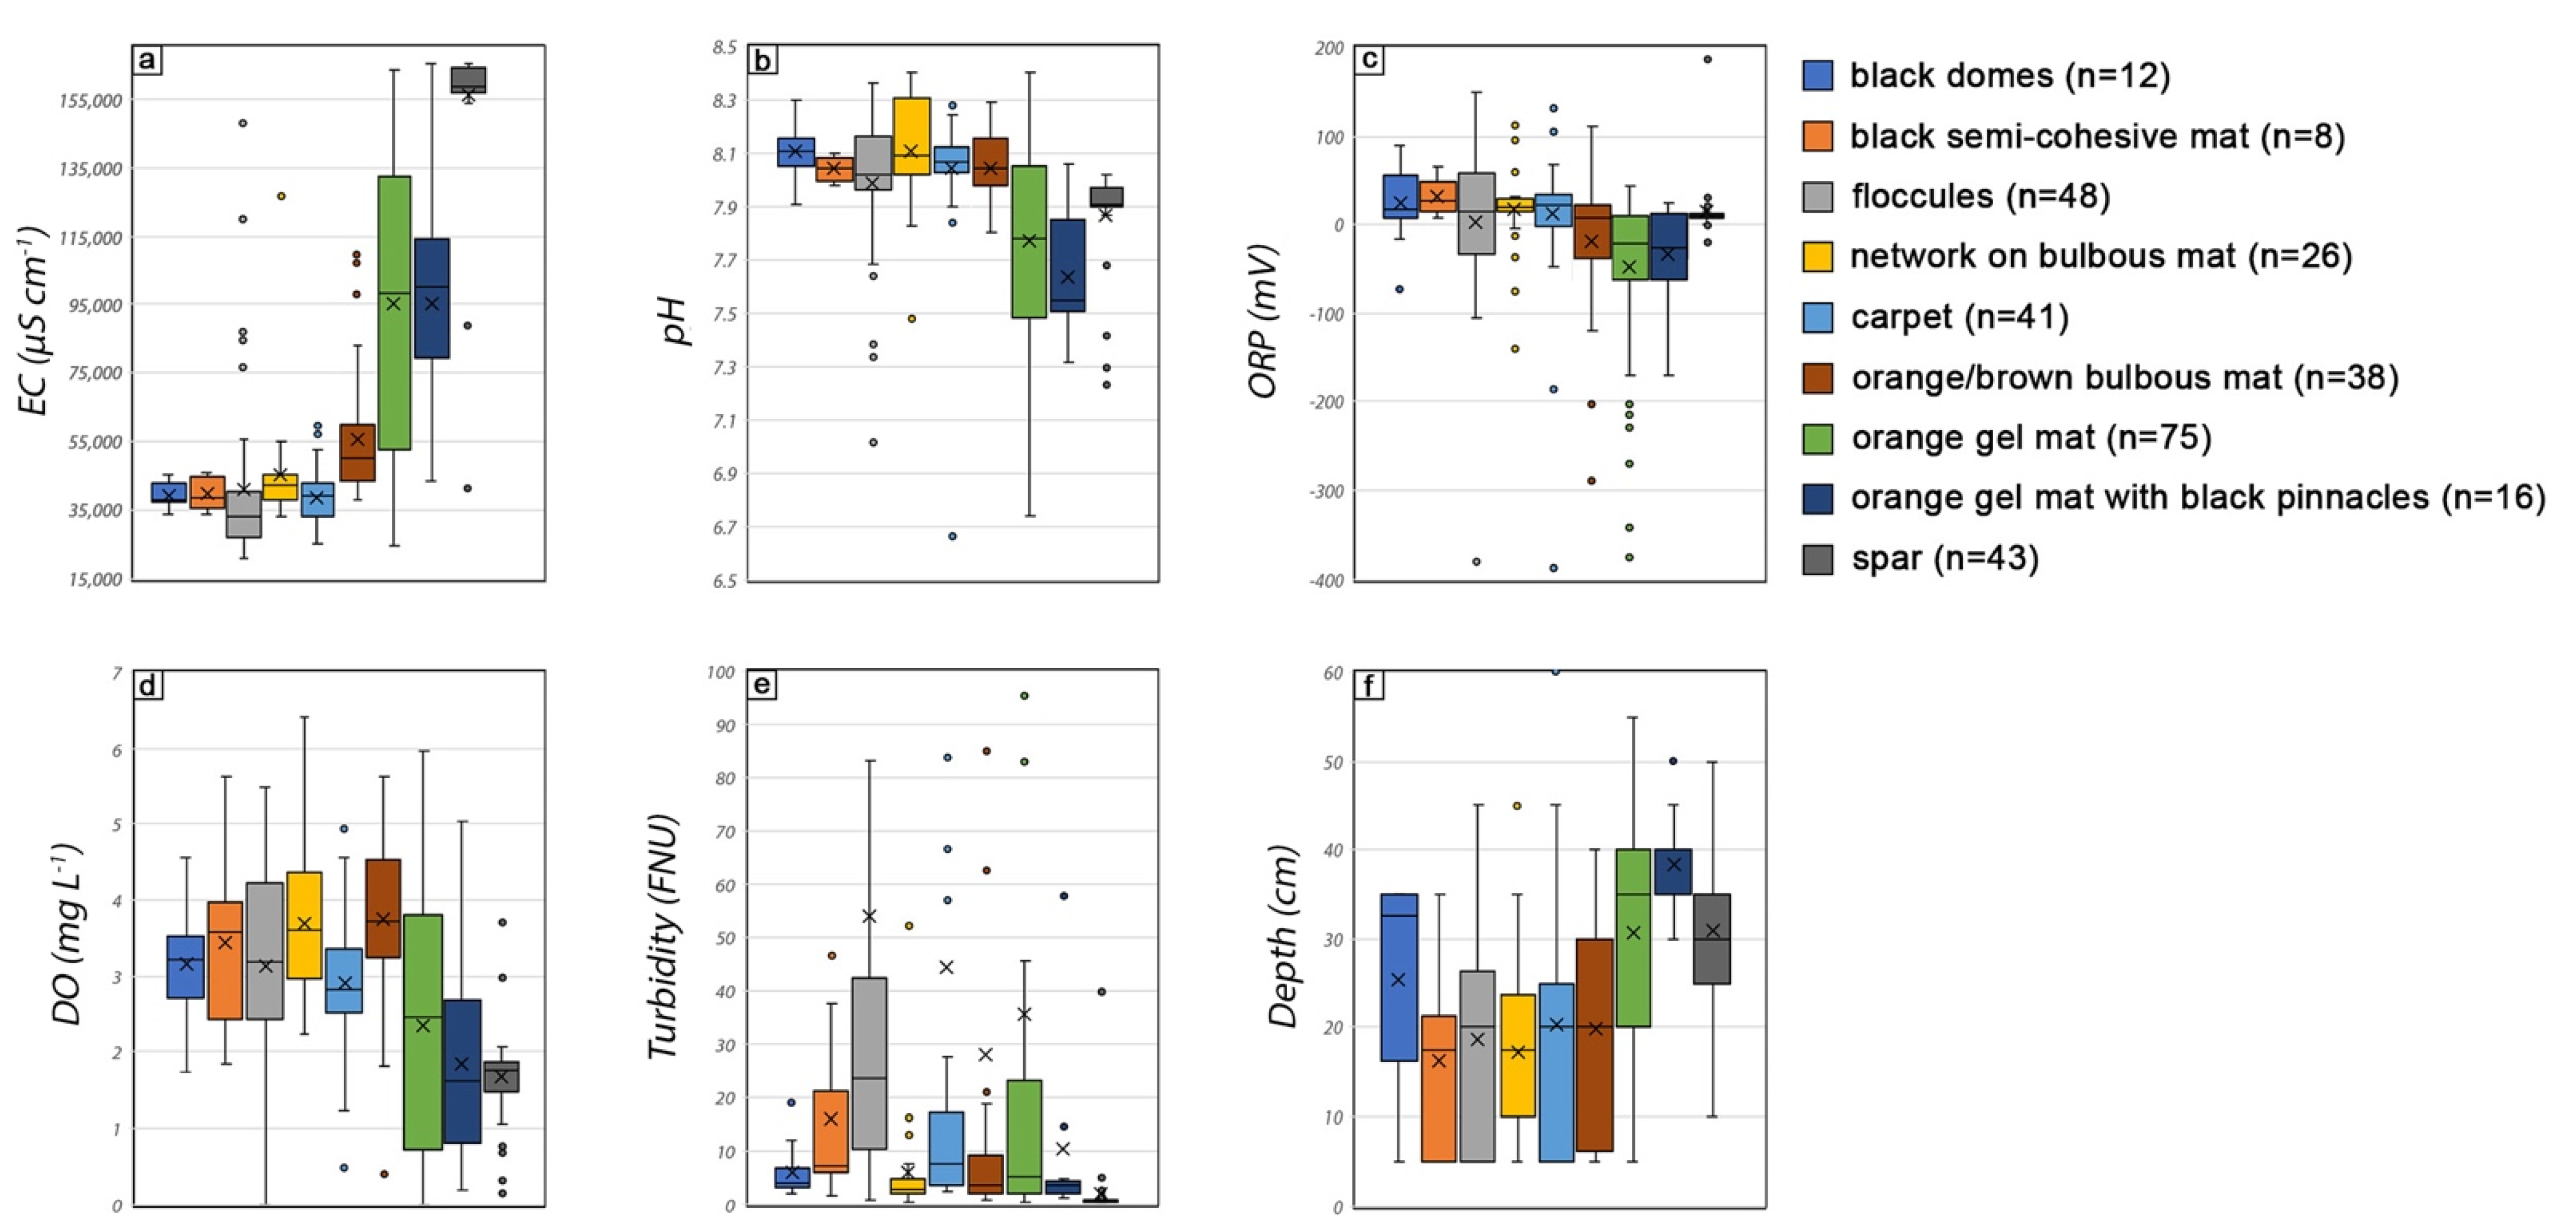
3.3. Statistical Analyses of Environmental Parameters
ANOVA
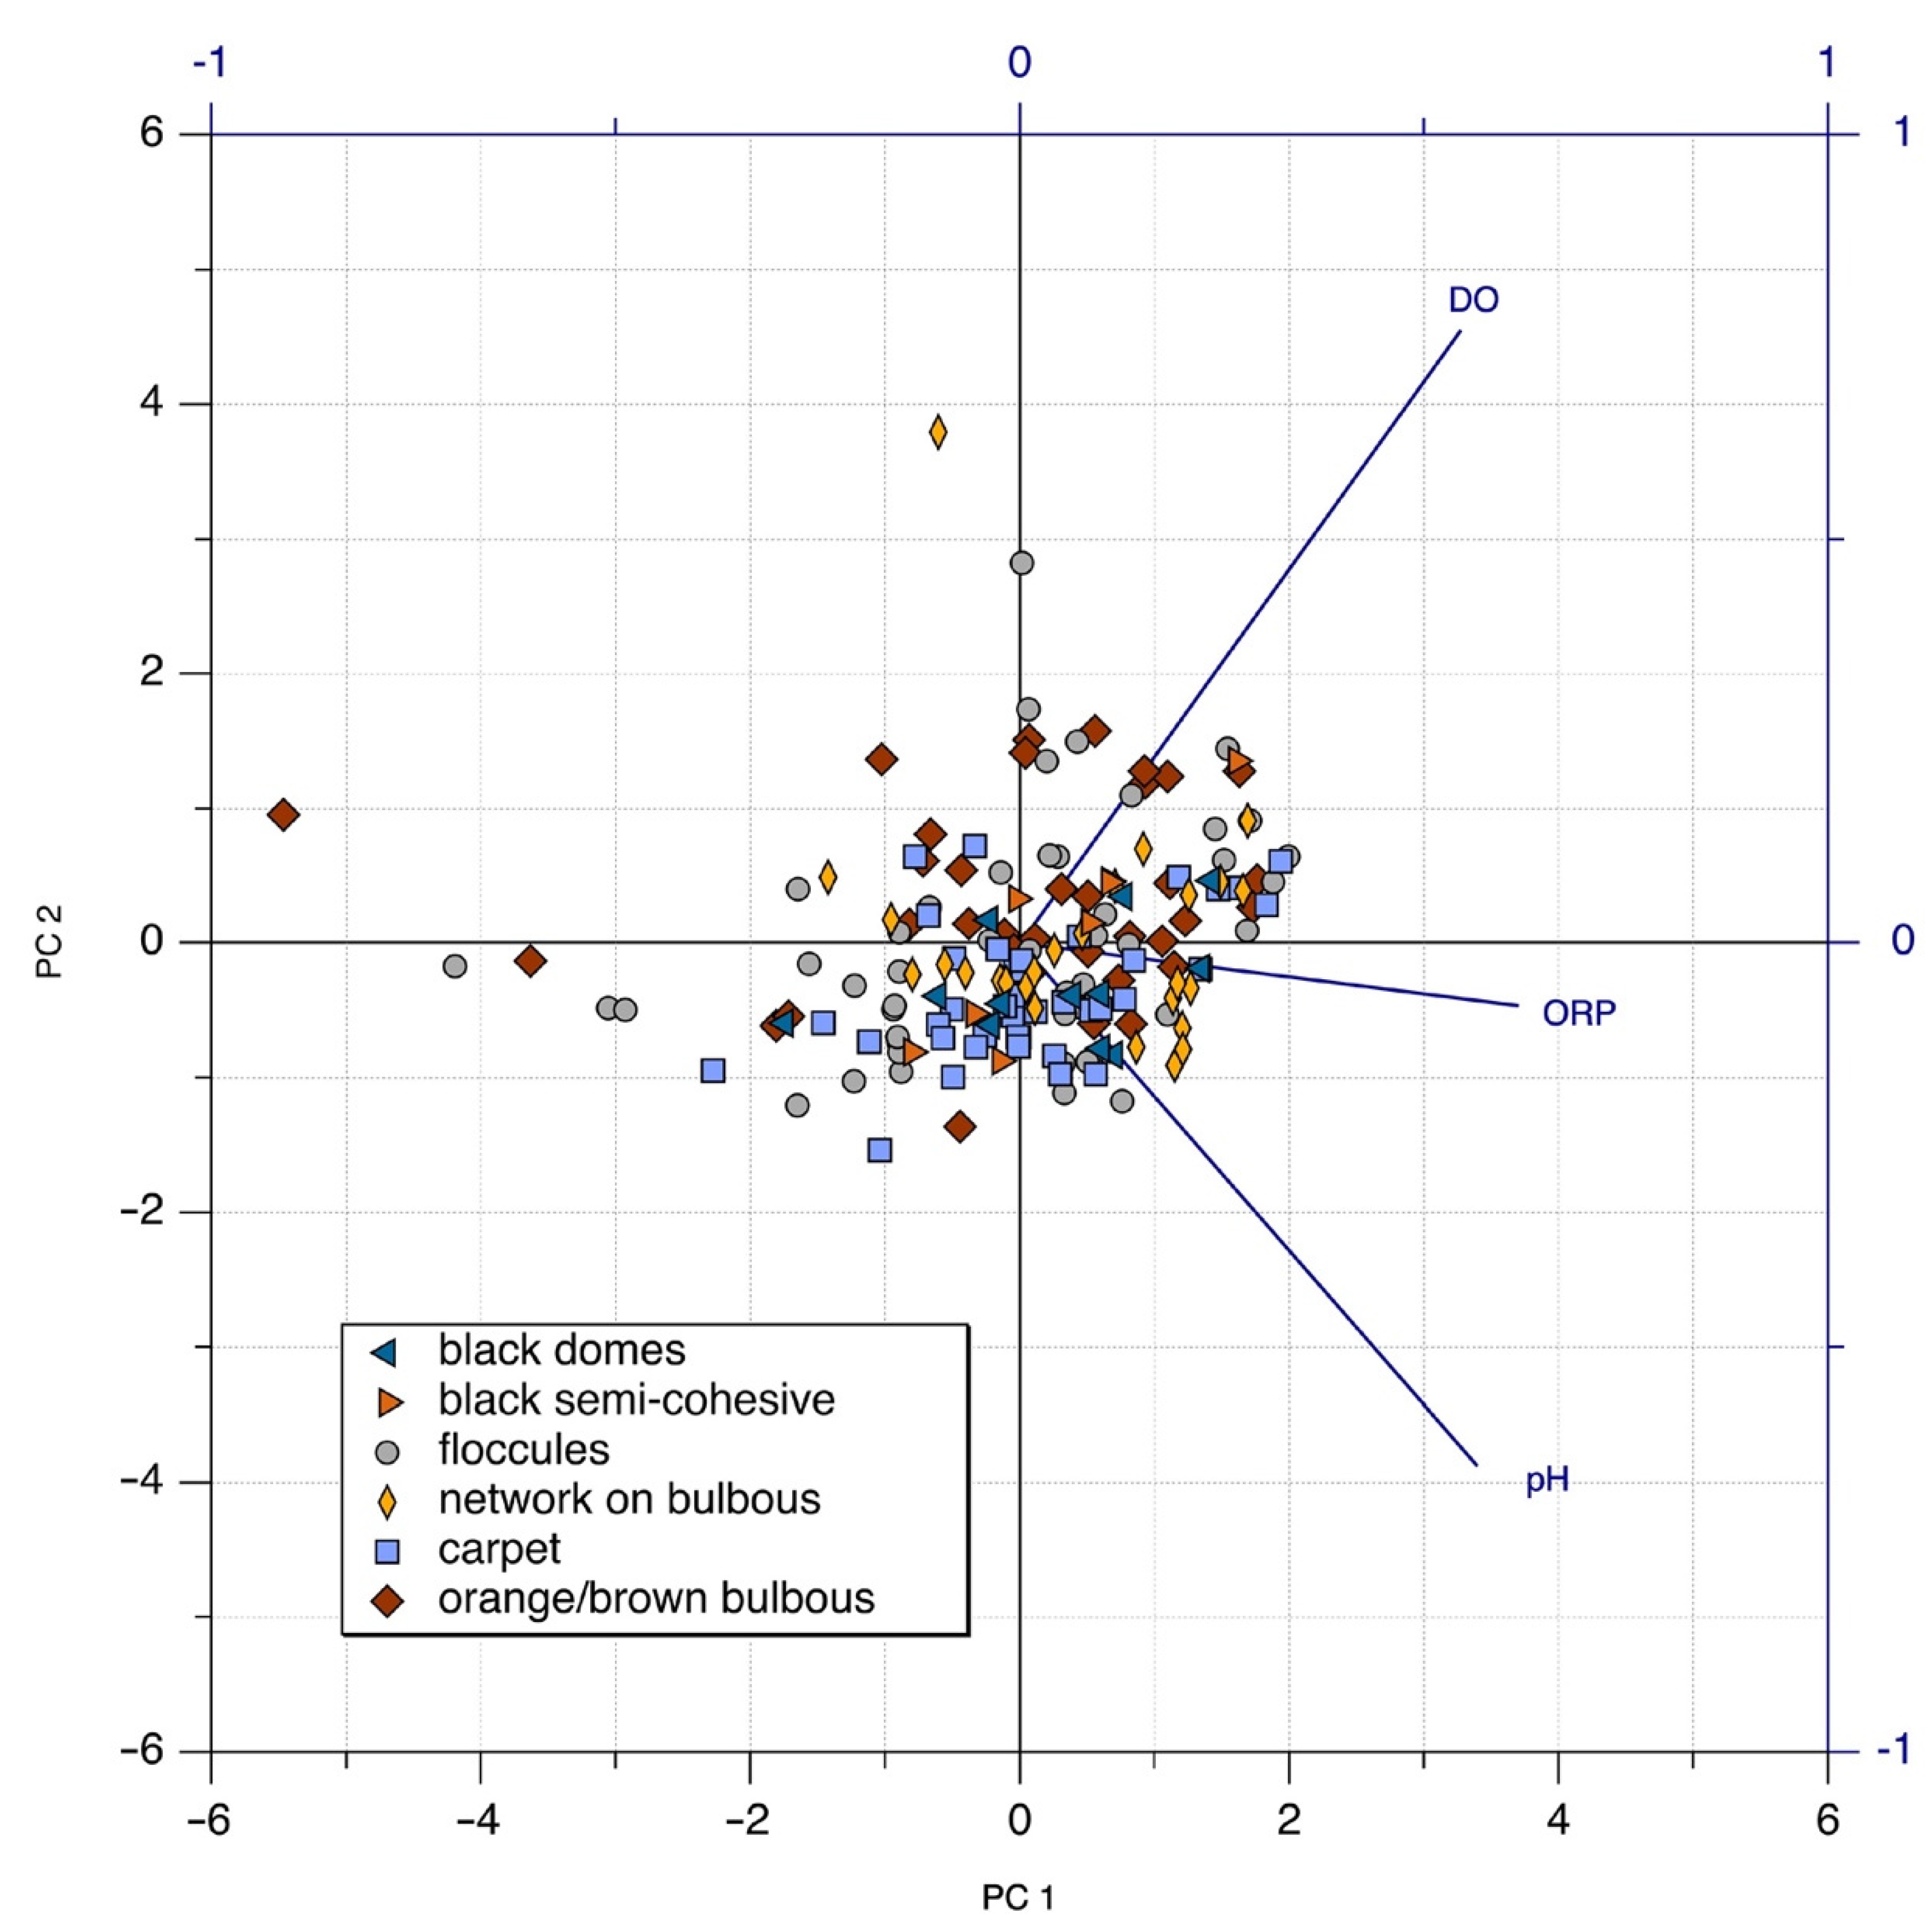
3.4. Principal Component Analysis
3.5. Synthesis of Results
4. Discussion
4.1. Electrical Conductivity
4.2. The EPS Story
4.3. Mineral Formation
5. Summary and Conclusions
Supplementary Materials
Author Contributions
Funding
Institutional Review Board Statement
Informed Consent Statement
Data Availability Statement
Acknowledgments
Conflicts of Interest
References
- Wierzchos, J.; Ascaso, C.; Artieda, O.; Casero, M.C. The Desert Polyextreme Environment and Endolithic Habitats. In Microbial Ecosystems in Central Andes Extreme Environments; Farías, M.E., Ed.; Springer: Cham, Switzerland, 2020; pp. 37–49. [Google Scholar]
- Farías, M.E. Microbial Ecosystems in Central Andes Extreme Environments; Farías, M.E., Ed.; Springer: Cham, Switzerland, 2020. [Google Scholar]
- Reid, R.P.; Oehlert, A.M.; Suosaari, E.P.; Demergasso, C.; Chong, G.; Escudero, L.V.; Piggot, A.M.; Lascu, I.; Palma, A.T. Electrical Conductivity as a Driver of Biological and Geological Spatial Heterogeneity in the Puquios, Salar de Llamara, Atacama Desert, Chile. Sci. Rep. 2021, 11, 12769. [Google Scholar] [CrossRef]
- Otálora, F.; Criado-Reyes, J.; Baselga, M.; Canals, A.; Verdugo-Escamilla, C.; García Ruiz, J.M. Hydrochemical and Mineralogical Evolution through Evaporitic Processes in Salar de Llamara Brines (Atacama, Chile). ACS Earth Space Chem. 2020, 4, 882–896. [Google Scholar] [CrossRef]
- Oehlert, A.M.; Suosaari, E.P.; Kong, T.; Piggot, A.M.; Maizel, D.; Lascu, I.; Demergasso, C.; Chong, G.; Reid, R.P. Physical, Chemical, and Microbial Feedbacks Controlling Brine Geochemistry and Lake Morphology in Polyextreme Salar Environments. Sci. Total Environ. 2022, 836, 19. [Google Scholar] [CrossRef] [PubMed]
- Eugster, H.P.; Hardie, L.A. Saline Lakes BT—Lakes: Chemistry, Geology, Physics; Lerman, A., Ed.; Springer: New York, NY, USA, 1978; pp. 237–293. ISBN 978-1-4757-1152-3. [Google Scholar]
- Eugster, H.P. Geochemistry of Evaporitic Lacustrine Deposits. Annu. Rev. Earth Planet. Sci. 1980, 8, 35–63. [Google Scholar] [CrossRef]
- Nye, O.B.; Dean, D.A.; Hinds, R.W. Improved Thin Section Techniques for Fossil and Recent Organisms. J. Paleontol. 1972, 46, 271–275. [Google Scholar]
- Hammer, Ø.; Harper, D.A.T.; Ryan, P.D. PAST: Paleontological Statistics Software Package for Education and Data Analysis. Palaeontol. Electron. 2001, 4, 9. [Google Scholar]
- Walton, N.R.G. Electrical Conductivity and Total Dissolved Solids—What Is Their Precise Relationship? Desalination 1989, 72, 275–292. [Google Scholar] [CrossRef]
- Millero, F.J. The Physical Chemistry of Natural Waters. Pure Appl. Chem. 1985, 57, 1015–1024. [Google Scholar] [CrossRef]
- Hayashi, M. Temperature-Electrical Conductivity Relation of Water for Environmental Monitoring and Geophysical Data Inversion. Environ. Monit. Assess. 2004, 96, 119–128. [Google Scholar] [CrossRef]
- Blanco, Y.; Rivas, L.A.; González-Toril, E.; Ruiz-Bermejo, M.; Moreno-Paz, M.; Parro, V.; Palacín, A.; Aguilera, Á.; Puente-Sánchez, F. Environmental Parameters, and Not Phylogeny, Determine the Composition of Extracellular Polymeric Substances in Microbial Mats from Extreme Environments. Sci. Total Environ. 2019, 650, 384–393. [Google Scholar] [CrossRef]
- Yin, W.; Wang, Y.; Liu, L.; He, J. Biofilms: The Microbial “Protective Clothing” in Extreme Environments. Int. J. Mol. Sci. 2019, 20, 3423. [Google Scholar] [CrossRef] [PubMed] [Green Version]
- Stoodley, P.; Sauer, K.; Davies, D.G.; Costerton, J.W. Biofilms as Complex Differentiated Communities. Annu. Rev. Microbiol. 2002, 56, 187–209. [Google Scholar] [CrossRef] [PubMed] [Green Version]
- Dupraz, C.; Reid, R.P.; Braissant, O.; Decho, A.W.; Norman, R.S.; Visscher, P.T. Processes of Carbonate Precipitation in Modern Microbial Mats. Earth-Science Rev. 2009, 96, 141–162. [Google Scholar] [CrossRef]
- Decho, A.W. Extracellular Polymeric Substances (EPS). In Encyclopedia of Geobiology; Reitner, J., Thiel, V., Eds.; Springer: Berlin/Heidelberg, Germany, 2011; pp. 359–362. [Google Scholar]
- De Philippis, R.; Vincenzini, M. Exocellular Polysaccharides from Cyanobacteria and Their Possible Applications. FEMS Microbiol. Rev. 1998, 22, 151–175. [Google Scholar] [CrossRef]
- Sutherland, I.W. Biofilm Exopolysaccharides: A Strong and Sticky Framework. Microbiology 2001, 147, 3–9. [Google Scholar] [CrossRef] [Green Version]
- Rossi, F.; De Philippis, R. Role of Cyanobacterial Exopolysaccharides in Phototrophic Biofilms and in Complex Microbial Mats. Life 2015, 5, 1218–1238. [Google Scholar] [CrossRef] [Green Version]
- Flemming, H.C.; Wingender, J.; Szewzyk, U.; Steinberg, P.; Rice, S.A.; Kjelleberg, S. Biofilms: An Emergent Form of Bacterial Life. Nat. Rev. Microbiol. 2016, 14, 563–575. [Google Scholar] [CrossRef]
- Applegate, D.H.; Bryers, J.D. Effects of Carbon and Oxygen Limitations and Calcium Concentrations on Biofilm Removal Processes. Biotechnol. Bioeng. 1991, 37, 17–25. [Google Scholar] [CrossRef]
- Flemming, H.C.; Wingender, J. The Biofilm Matrix. Nat. Rev. Microbiol. 2010, 8, 623–633. [Google Scholar] [CrossRef]
- Conradi, F.D.; Zhou, R.-Q.; Oeser, S.; Schuergers, N.; Wilde, A.; Mullineaux, C.W. Factors Controlling Floc Formation and Structure in the Cyanobacterium Synechocystis Sp. Strain PCC 6803. J. Bacteriol. 2019, 201, e00344-19. [Google Scholar] [CrossRef] [Green Version]
- Wilking, J.N.; Zaburdaev, V.; De Volder, M.; Losick, R.; Brenner, M.P.; Weitz, D.A. Liquid Transport Facilitated by Channels in Bacillus Subtilis Biofilms. Proc. Natl. Acad. Sci. USA 2013, 110, 848–852. [Google Scholar] [CrossRef] [PubMed] [Green Version]
- Kim, L.H.; Chong, T.H. Physiological Responses of Salinity-Stressed Vibrio Sp. and the Effect on the Biofilm Formation on a Nanofiltration Membrane. Environ. Sci. Technol. 2017, 51, 1249–1258. [Google Scholar] [CrossRef] [PubMed]
- Mayer, C.; Moritz, R.; Kirschner, C.; Borchard, W.; Maibaum, R.; Wingender, J.; Flemming, H.C. The Role of Intermolecular Interactions: Studies on Model Systems for Bacterial Biofilms. Int. J. Biol. Macromol. 1999, 26, 3–16. [Google Scholar] [CrossRef]
- Zhao, L.; She, Z.; Jin, C.; Yang, S.; Guo, L.; Zhao, Y.; Gao, M. Characteristics of Extracellular Polymeric Substances from Sludge and Biofilm in a Simultaneous Nitrification and Denitrification System under High Salinity Stress. Bioprocess Biosyst. Eng. 2016, 39, 1375–1389. [Google Scholar] [CrossRef]
- Yildiz, F.H.; Schoolnik, G.K. Vibrio Cholerae O1 El Tor: Identification of a Gene Cluster Required for the Rugose Colony Type, Exopolysaccharide Production, Chlorine Resistance, and Biofilm Formation. Proc. Natl. Acad. Sci. USA 1999, 96, 4028–4033. [Google Scholar] [CrossRef] [Green Version]
- Paerl, H.W.; Pinckney, J.L. A Mini-Review of Microbial Consortia: Their Roles in Aquatic Production and Biogeochemical Cycling. Microb. Ecol. 1996, 31, 225–247. [Google Scholar] [CrossRef]
- Sorokin, D.Y.; Berben, T.; Melton, E.D.; Overmars, L.; Vavourakis, C.D.; Muyzer, G. Microbial Diversity and Biogeochemical Cycling in Soda Lakes. Extremophiles 2014, 18, 791–809. [Google Scholar] [CrossRef] [Green Version]
- Paerl, H.W.; Pinckney, J.L.; Steppe, T.F. Cyanobacterial-Bacterial Mat Consortia: Examining the Functional Unit of Microbial Survival and Growth in Extreme Environments. Environ. Microbiol. 2000, 2, 11–26. [Google Scholar] [CrossRef]
- Allen, M.A.; Goh, F.; Burns, B.P.; Neilan, B.A. Bacterial, Archaeal and Eukaryotic Diversity of Smooth and Pustular Microbial Mat Communities in the Hypersaline Lagoon of Shark Bay. Geobiology 2009, 7, 82–96. [Google Scholar] [CrossRef]
- Spring, S.; Brinkmann, N.; Murrja, M.; Spröer, C.; Reitner, J.; Klenk, H.-P. High Diversity of Culturable Prokaryotes in a Lithifying Hypersaline Microbial Mat. Geomicrobiol. J. 2015, 32, 332–346. [Google Scholar] [CrossRef]
- Ruvindy, R.; White, R.A.; Neilan, B.A.; Burns, B.P. Unravelling Core Microbial Metabolisms in the Hypersaline Microbial Mats of Shark Bay Using High-Throughput Metagenomics. ISME J. 2016, 10, 183–196. [Google Scholar] [CrossRef] [PubMed] [Green Version]
- Dorador, C.; Molina, V.; Hengst, M.; Eissler, Y.; Cornejo, M.; Fernández, C.; Pérez, V. Microbial Communities Composition, Activity, and Dynamics at Salar de Huasco: A Polyextreme Environment in the Chilean Altiplano BT—Microbial Ecosystems in Central Andes Extreme Environments: Biofilms, Microbial Mats, Microbialites and Endoevaporites; Farías, M.E., Ed.; Springer International Publishing: Cham, Switzerland, 2020; pp. 123–139. ISBN 978-3-030-36192-1. [Google Scholar]
- Rasuk, M.C.; Visscher, P.T.; Leiva, M.C.; Farías, M.E. Mats and Microbialites from Laguna La Brava. In Microbial Ecosystems in Central Andes Extreme Environments; Farías, M.E., Ed.; Springer: Cham, Switzerland, 2020; pp. 221–230. [Google Scholar] [CrossRef]
- Visscher, P.T.; Stolz, J.F. Microbial Mats as Bioreactors: Populations, Processes, and Products. Palaeogeogr. Palaeoclimatol. Palaeoecol. 2005, 219, 87–100. [Google Scholar] [CrossRef]
- Knoll, A.H.; Bauld, J. The Evolution of Ecological Tolerance in Prokaryotes. Earth Environ. Sci. Trans. R. Soc. Edinburgh 1989, 80, 209–223. [Google Scholar] [CrossRef] [PubMed]
- Ba̧bel, M. Models for Evaporite, Selenite and Gypsum Microbialite Deposition in Ancient Saline Basins. Acta Geol. Pol. 2004, 54, 219–249. [Google Scholar]
- Pflüger, F.; Gresse, P.G. Microbial Sand Chips - A Non-Actualistic Sedimentary Structure. Sediment. Geol. 1996, 102, 263–274. [Google Scholar] [CrossRef]
- Franks, J.; Stolz, J.F. Flat Laminated Microbial Mat Communities. Earth-Science Rev. 2009, 96, 163–172. [Google Scholar] [CrossRef]
- Wong, H.; Ahmed-Cox, A.; Burns, B. Molecular Ecology of Hypersaline Microbial Mats: Current Insights and New Directions. Microorganisms 2016, 4, 6. [Google Scholar] [CrossRef] [Green Version]
- Del Buey, P.; Sanz-Montero, M.E.; Braissant, O.; Cabestrero, Ó.; Visscher, P.T. The Role of Microbial Extracellular Polymeric Substances on Formation of Sulfate Minerals and Fibrous Mg-Clays. Chem. Geol. 2021, 581. [Google Scholar] [CrossRef]
- Cody, R.D.; Cody, A.M. Gypsum Nucleation and Crystal Morphology in Analog Saline Terrestrial Environments. J. Sediment. Res. 1988, 58, 247–255. [Google Scholar]
- Vogel, M.B.; Des Marais, D.J.; Turk, K.A.; Parenteau, M.N.; Jahnke, L.L.; Kubo, M.D.Y. The Role of Biofilms in the Sedimentology of Actively Forming Gypsum Deposits at Guerrero Negro, Mexico. Astrobiology 2009, 9, 875–893. [Google Scholar] [CrossRef]
- Vogel, M.B.; Des Marais, D.J.; Parenteau, M.N.; Jahnke, L.L.; Turk, K.A.; Kubo, M.D.Y. Biological Influences on Modern Sulfates: Textures and Composition of Gypsum Deposits from Guerrero Negro, Baja California Sur, Mexico. Sediment. Geol. 2010, 223, 265–280. [Google Scholar] [CrossRef]
- Guerrero, R.; Piqueras, M.; Berlanga, M. Microbial Mats and the Search for Minimal Ecosystems. Int. Microbiol. 2002, 5, 177–188. [Google Scholar] [CrossRef] [PubMed]
- Knorre, H.V.; Krumbein, W.E. Bacterial Calcification BT—Microbial Sediments; Riding, R.E., Awramik, S.M., Eds.; Springer: Berlin/Heidelberg, Germany, 2000; pp. 25–31. ISBN 978-3-662-04036-2. [Google Scholar]
- Visscher, P.T.; Reid, R.P.; Bebout, B.M. Microscale Observations of Sulfate Reduction: Correlation of Microbial Activity with Lithified Micritic Laminae in Modern Marine Stromatolites. Geology 2000, 28, 919–922. [Google Scholar] [CrossRef]
- Pace, A.; Bourillot, R.; Bouton, A.; Vennin, E.; Galaup, S.; Bundeleva, I.; Patrier, P.; Dupraz, C.; Thomazo, C.; Sansjofre, P.; et al. Microbial and Diagenetic Steps Leading to the Mineralisation of Great Salt Lake Microbialites. Sci. Rep. 2016, 6, 31495. [Google Scholar] [CrossRef] [Green Version]
- Walker, J.J.; Pace, N.R. Endolithic Microbial Ecosystems. Annu. Rev. Microbiol. 2007, 61, 331–347. [Google Scholar] [CrossRef]
- Wierzchos, J.; de los Ríos, A.; Ascaso, C. Microorganisms in Desert Rocks: The Edge of Life on Earth. Int. Microbiol. 2012, 15, 173–183. [Google Scholar] [CrossRef] [Green Version]


| Electrical Conductivity | ||||
|---|---|---|---|---|
| Bottom Types | N | Subset for Alpha = 0.05 | ||
| Group I | Group II | Group III | ||
| Carpet | 41 | 38,560.24 | ||
| Black domes | 12 | 39,124.17 | ||
| Black semi-cohesive mat | 8 | 39,660.00 | ||
| Floccules | 48 | 40,704.79 | ||
| Network on bulbous mat | 26 | 45,266.54 | ||
| Orange/brown bulbous mat | 38 | 55,533.95 | ||
| Orange gel mat | 75 | 95,509.60 | ||
| Orange gel mat with black pinnacles | 16 | 95,519.38 | ||
| Spar | 43 | 156,318.37 | ||
| Significance | 0.499 | 1.000 | 1.000 | |
| Location | Bottom Types | median in situ environmental measurements | Microbial development | Mineralogy | ||||||
| EC (µS/cm) | pH | ORP | DO (mg/L) | Turbidity (FNU) | ||||||
| Puquio 1 | floccules, carpet (low cohesivity) | <40,000 | >8 | oxidative | ~3 | low | flocculent microbial mats: abundant cells, diatoms, and EPS | abundance of irregularly shaped gypsum grains, irregularly shaped CaCO3 grains formed from agglutinated crystals smaller than 10 µm | Group I | |
| Transition Zone | Closer to Puquio 1 | floccules, carpet, black domes, black semi-cohesive, network on bulbous, orange/brown bulbous mat (low cohesivity) | ~38,000–55,000 | >8 | generally oxidative | ~3–4 | low | flocculent microbial mats: abundant cells, diatoms, and EPS | irregularly and lenticular shaped gypsum grains, Mg-clay, irregularly shaped carbonate precipitates often enriched in Mn; Mn-oxide in black semi-cohesive | |
| Closer to Puquio 2 | orange gel mat, orange gel mat with black pinnacles (highly cohesive) | ~95,000 | <8 | reducing | ~2–3 | low | well-developed, often laminated microbial mats: abundant cells, diatoms, and EPS | irregular and lenticular gypsum grains and laminations, Mn-rich calcium-carbonates, and Mg-clay that was observed forming around cells and as dense botryoidal accumulations | Group II | |
| Narrow band to the SW of Puquio 2 | spar | >155,000 | <8 | reducing | <2 | low | thin biofilms | large gypsum crystals (selenite), often with a sutured mosaic fabric and intracrystalline Mg-clay, or infilling crevices | Group III | |
| Puquio 2 | spar | >155,000 | <8 | oxidative | <2 | low | thin biofilms | large gypsum crystals (selenite), often with a sutured mosaic fabric and intracrystalline Mg-clay, or infilling crevices; dissolution observed along margins | ||
Publisher’s Note: MDPI stays neutral with regard to jurisdictional claims in published maps and institutional affiliations. |
© 2022 by the authors. Licensee MDPI, Basel, Switzerland. This article is an open access article distributed under the terms and conditions of the Creative Commons Attribution (CC BY) license (https://creativecommons.org/licenses/by/4.0/).
Share and Cite
Suosaari, E.P.; Oehlert, A.M.; Lascu, I.; Decho, A.W.; Piggot, A.M.; Palma, A.T.; Machabee, P.F.; Reid, R.P. Environmental and Biological Controls on Sedimentary Bottom Types in the Puquios of the Salar de Llamara, Northern Chile. Geosciences 2022, 12, 247. https://0-doi-org.brum.beds.ac.uk/10.3390/geosciences12060247
Suosaari EP, Oehlert AM, Lascu I, Decho AW, Piggot AM, Palma AT, Machabee PF, Reid RP. Environmental and Biological Controls on Sedimentary Bottom Types in the Puquios of the Salar de Llamara, Northern Chile. Geosciences. 2022; 12(6):247. https://0-doi-org.brum.beds.ac.uk/10.3390/geosciences12060247
Chicago/Turabian StyleSuosaari, Erica P., Amanda M. Oehlert, Ioan Lascu, Alan W. Decho, Alan M. Piggot, Alvaro T. Palma, Paul F. Machabee, and R. Pamela Reid. 2022. "Environmental and Biological Controls on Sedimentary Bottom Types in the Puquios of the Salar de Llamara, Northern Chile" Geosciences 12, no. 6: 247. https://0-doi-org.brum.beds.ac.uk/10.3390/geosciences12060247