Article

Anthrax and the Geochemistry of Soils in the Contiguous United States

1
Coastal and Marine Science Center, U.S. Geological Survey, 600 4th Street South, St. Petersburg, FL 33701, USA
2
National Homeland Security Research Center, U.S. Environmental Protection Agency, 26 W. Martin Luther King Drive, MS NG16, Cincinnati, OH 45268, USA
3
National Homeland Security Research Center, Oak Ridge Institute for Science and Education, with the U.S. Environmental Protection Agency, 109 T.W. Alexander Drive, Research Triangle Park, NC 27709, USA
4
Denver Federal Center, U.S. Geological Survey, Box 25046, MS 973, Denver, CO 80225, USA
5
National Homeland Security Research Center, Threat and Consequence Assessment Division, U.S. Environmental Protection Agency, Ronald Reagan Building, MC 8801RR, 1200 Pennsylvania Avenue, NW, Washington, DC 20460, USA
*
Author to whom correspondence should be addressed.
Submission received: 26 March 2014 / Revised: 15 July 2014 / Accepted: 5 August 2014 / Published: 11 August 2014
(This article belongs to the Special Issue Medical Geology: Impacts of the Natural Environment on Public Health)

Abstract

:
Soil geochemical data from sample sites in counties that reported occurrences of anthrax in wildlife and livestock since 2000 were evaluated against counties within the same states (MN, MT, ND, NV, OR, SD and TX) that did not report occurrences. These data identified the elements, calcium (Ca), manganese (Mn), phosphorus (P) and strontium (Sr), as having statistically significant differences in concentrations between county type (anthrax occurrence versus no occurrence). Tentative threshold values of the lowest concentrations of each of these elements (Ca = 0.43 wt %, Mn = 142 mg/kg, P = 180 mg/kg and Sr = 51 mg/kg) and average concentrations (Ca = 1.3 wt %, Mn = 463 mg/kg, P = 580 mg/kg and Sr = 170 mg/kg) were identified from anthrax-positive counties as prospective investigative tools in determining whether an outbreak had “potential” or was “likely” at any given geographic location in the contiguous United States.

Graphical Abstract

1. Introduction

B. anthracis infections in wildlife and livestock have been recognized as a critically important disease in the United States for over 200 years. Historical data on environmental, weather/climate and geographical factors that influence the occurrence of these infections are well known and include; (1) warm seasons during dry periods that follow moderate to heavy precipitation events (weather/climate); (2) regions containing post-flood organic detritus and/or short dry grazing grasses (environmental); and (3) topological lows, such as waterholes or riverbanks, calcareous and alluvial soils with elevated nutrient content and pH values greater than 6.0 (geology). Other geological factors that may influence B. anthracis outbreak occurrence, as noted through in vivo or in vitro observations, are elevated phosphate (which results in higher protective antigen production), magnesium, sodium, copper, zinc (needed for lethal factor production) and manganese (typically found in very low concentrations in calcareous soils and needed for gene regulation of exotoxins and antibiotics) [1,2,3,4,5].
There are over 140 strains of Bacillus anthracis, and all pathogenic strains carry both pX01 and pX02 virulence plasmids [6]. Two separate groups of B. anthracis, the “Ames” and Western North America (WNA) clades, are responsible for wildlife and livestock anthrax outbreaks in North America. Animal outbreaks of anthrax are a common occurrence in the contiguous United States, and they are typically constrained to a few geographical regions (e.g., Texas, Minnesota, Montana and the Dakotas). The “Ames” or “Ames-like” clade has caused periodic outbreaks in southern Texas and is believed to have been introduced through the importation of infected livestock during European colonization [7,8]. The WNA clade is genetically most similar to isolates of the Eurasian clade and account for ~89% of non-human cases in North America [7]. It is believed that the WNA clade was introduced to the Americas by human migration across the Bering Strait that occurred prior to ~11,000 years ago when the land bridge between Asia and North America last closed at the end of the Younger Dryas [7,9,10]. Genetic analyses of WNA clade isolates show evidence of a north to south distribution pattern that is rooted in northern Canada [7]. Costs associated with outbreaks can be significant. The 2005 North Dakota outbreak was estimated to have cost ~$650 thousand U.S. dollars (costs associated with activities, such as surveillance, diagnosis, immunization and disposal) [11]. Similarly, the periodic large outbreaks that affect bison and other wildlife in Canada are believed to cost ~$500 thousand Canadian dollars per episode, and various Canadian agencies spend an estimated $15 thousand to $26 thousand per year on aerial carcass surveillance [12]. Even small outbreaks can significantly impact the economic well-being of the livestock industry, where profit margins are based on low expected annual herd losses [13].
Given the geographic restriction of most annually-occurring cases and outbreaks of anthrax in the contiguous United States, geochemical data obtained by the U.S. Geological Survey’s (USGS) “North American Soil Geochemical Landscapes Project” were evaluated in collaboration with the Environmental Protection Agency (EPA) to determine which elements may influence the background distribution of this pathogen. These data may help decision makers better prepare for and mitigate potential or actual outbreak events and provide an accurate graphical representation of areas within the contiguous United States that favor the natural propagation of this species.

2. Experimental Section

2.1. Sample Sites and Geochemical Data

Using a generalized random tessellation stratified design for sample site selection, 4,857 sample sites (~1 site per 1,600 km2) were utilized for the USGS North American Soil Geochemical Landscapes Project, and 209 of those sites were utilized in this study [14]. In a major geochemical mapping project such as this, the quality of chemical analyses is of utmost importance. Reimann et al. (2008) recommend the following five quality control (QC) procedures [15]:
  • Collection and analysis of field duplicates;
  • Randomization of samples prior to analysis;
  • Insertion of international reference materials (RMs);
  • Insertion of project standards; and
  • Insertion of analytical duplicates of project samples.
In this project, field duplicates were not collected. This approach was evaluated during the pilot studies (Smith et al., 2009) and reported on by Garrett (2009) [16,17]. Based on the results of the pilot studies, it was felt that the additional collection of field duplicates during the national-scale study would not add significantly to the QC analysis and, therefore, was not worth the added expense. The remaining four QC procedures were carried out fully.
To estimate trueness as measured in terms of bias, one or more standards consisting of both international RMs and internal project standards were analyzed with the project samples. In this project, trueness estimation was done on three separate levels. The USGS contract laboratory analyzed an RM with every batch of 48 samples. At the second tier, the USGS QC officer inserted at least one RM between every batch of 20–30 samples. The USGS principal investigator for the project (David B. Smith) initiated the final QC tier, which included the insertion of two blind RMs within each batch of 20–30 samples. Precision was assessed both by repeated analyses of RMs and by replicate analyses of real project samples. Quality control samples (RMs and analytical duplicates) constituted approximately 12% of the total number of samples analyzed. A complete discussion of the QC protocols used in this project, including detailed tables of bias and precision, is given in Smith et al. (2013) [14].
In short, the <2-mm fraction of each sample that was collected from a depth of 0 to 5 cm below the soil surface was analyzed for aluminum (Al), arsenic (As), calcium (Ca), iron (Fe), mercury (Hg), potassium (K), magnesium (Mg), sodium (Na), sulfur (S), titanium (Ti), silver (Ag), barium (Ba), beryllium (Be), bismuth (Bi), cadmium (Cd), cerium (Ce), cobalt (Co), chromium (Cr), cesium (Cs), copper (Cu), gallium (Ga), indium (In), lanthanum (La), lithium (Li), manganese (Mn), molybdenum (Mo), niobium (Nb), nickel (Ni), phosphorus (P), lead (Pb), rubidium (Rb), antimony (Sb), scandium (Sc), selenium (Se), tin (Sn), strontium (Sr), tellurium (Te), thorium (Th), thallium (Tl), uranium (U), vanadium (V), tungsten (W), yttrium (Y) and zinc (Zn) [14]. Elemental concentrations were reported as weight percent (wt % = Al, Ca, Fe, K, Mg, Na, Ti and S) or milligrams per kilogram (mg/kg) [14].

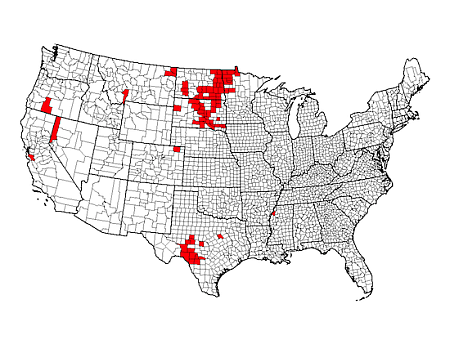
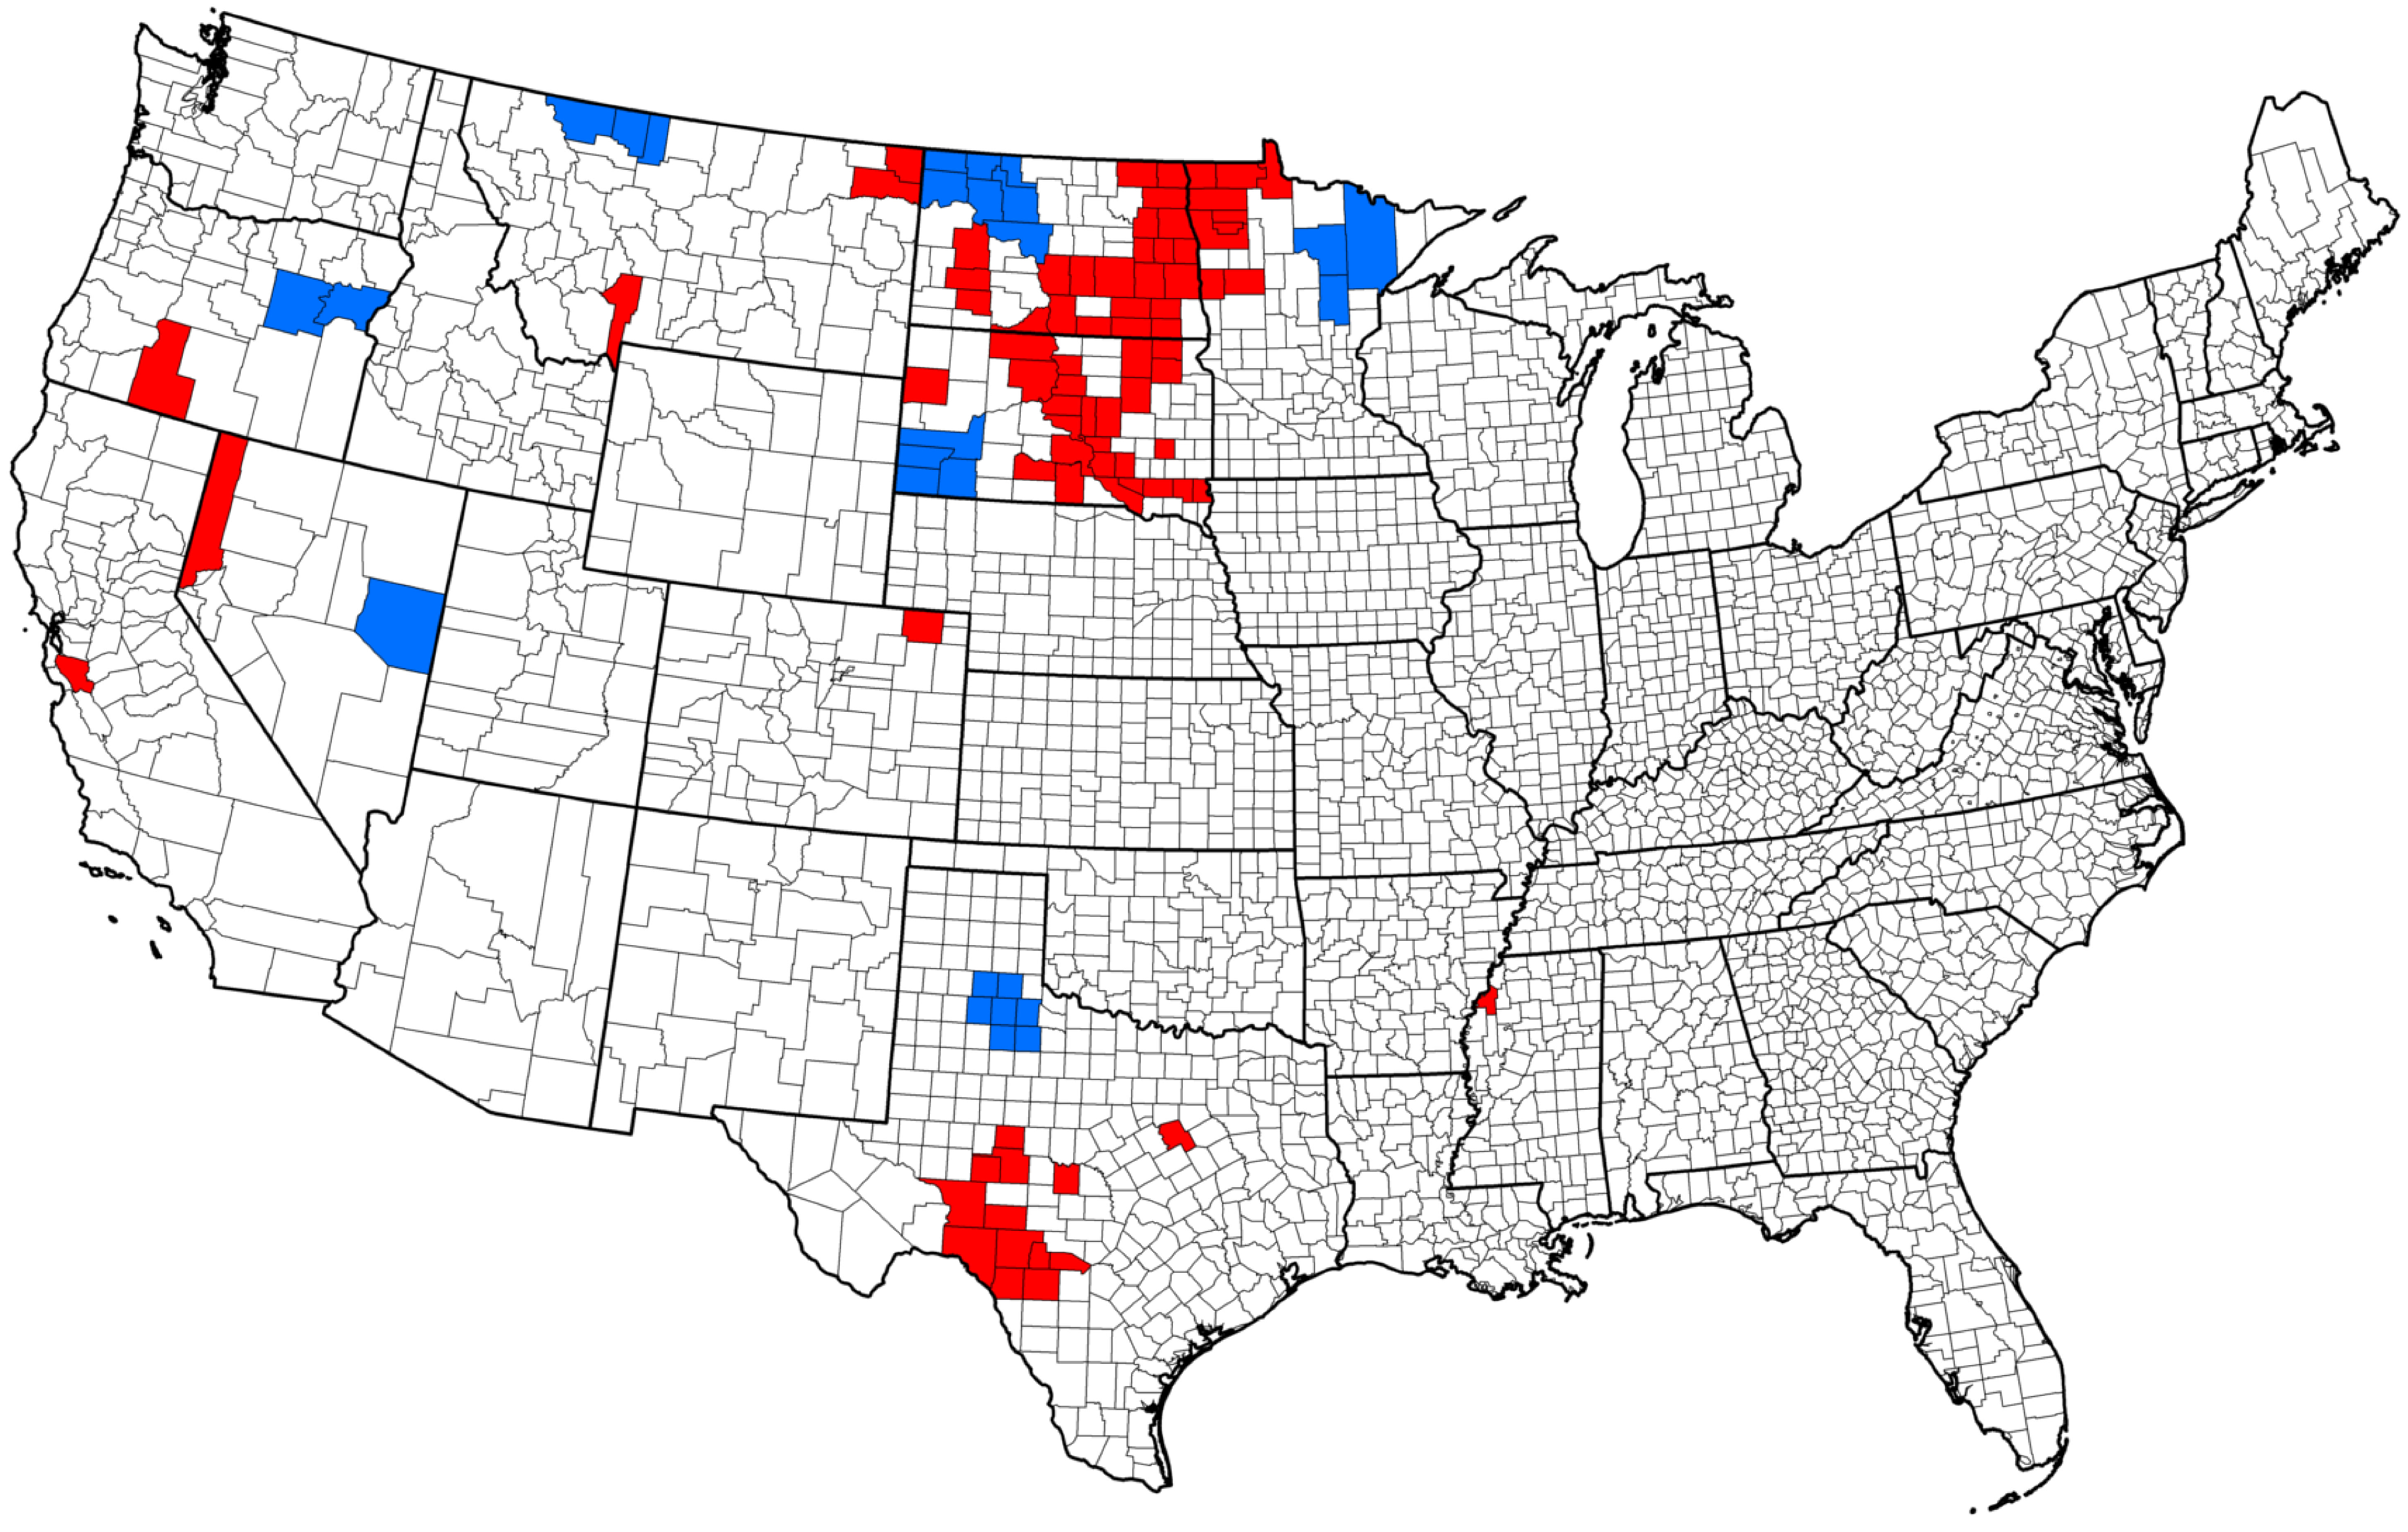
2.2. B. Anthracis Case and Outbreak Data by State County, 2000–2013

Figure 1 illustrates state counties reporting outbreaks or cases of anthrax in agricultural animals/wildlife since 2000 (red counties). States utilized for statistical analyses included Minnesota, Montana, North Dakota, Nevada, Oregon, Texas and South Dakota. State county outbreak and case data were compiled from state animal health organizations and the National Animal Health Reporting System [18]. Geochemical sample sites (USGS Geochemical Landscape Project sample site numbers presented in data tables [14]) were chosen within each county (Table 1). The following anthrax-positive counties were utilized for statistical evaluation: (1) Minnesota: Clay, Kittson, Lake of the Woods, Marshall Pennington, Polk and Roseau; (2) Montana: Gallatin, Sheridan and Roosevelt; (3) Nevada: Washoe; (4) North Dakota: Barnes, Cass, Grand Forks, Nelson, Pembina, Stark, Steele and Traill; (5) Oregon: Klamath; (6) South Dakota: Aurora, Brown, Brule, Buffalo, Charles Mix, Corson, Day, Dewey, Hand, Hughes, Hyde, Lyman, Marshall, Mellette, Potter, Spink, Tripp and Walworth; and (7) Texas: Edwards, Irion, Kinney, McCulloch, Real, Sutton, Uvalde and Val Verde. In summary, there were 120 sample sites located within these 46 counties.
Figure 1. Counties (red) in the contiguous United States reporting cases and/or outbreaks of agricultural/wildlife anthrax since 2000. Counties with no reported cases (blue) where sample sites were utilized for geochemical statistical analyses versus those sample sites in counties in the same state that reported cases and/or outbreaks.
Geosciences 04 00114 g001
Table 1. State, county and U.S. Geological Survey’s (USGS) sample site data [14].
State Counties Reporting Outbreaks or Cases of Anthrax in Livestock or Wildlife, 2000–2013 Utilized for Statistical Evaluation
StateCounties (total number)USGS Geochemical Landscape Project sample site numbers (numbers grouped by county (total number)
MinnesotaClay, Kittson, Lake of the Woods, Marshall, Pennington, Polk and Roseau (7)2265, 6361, 857, 9094, 7129, 10969, 4825, 4953, 8921, 9177, 12121, 729, 1753, 3545, 6617, 7641 and 2009 (17)
MontanaGallatin, Sheridan and Roosevelt (3)2798, 3310, 5246, 6974, 11070, 1854, 7742 and 12414 (8)
NevadaWashoe (1)671, 1503, 2719, 3551, 5791, 6815, 8863, 9695, 10719, 11743 and 12447 (11)
North DakotaBarnes, Cass, Grand Forks, Nelson, Pembina, Stark, Steele and Traill (8)601, 1177, 4697, 8793, 3417, 7513, 11609, 5273, 8025, 8345, 9369, 1881, 3966, 5310, 8062, 12441, 2201 and 6297 (18)
OregonKlamath (1)14, 927, 1951, 5023, 6047, 7162, 8186, 10143, 11258, 12282 and 13215 (11)
South DakotaAurora, Brown, Brule, Buffalo, Charles Mix, Corson, Day Dewey, Hand, Hughes, Hyde, Lyman, Marshall, Mellette, Potter, Spink, Tripp and Walworth (18)1224, 8648, 10120, 4185, 8985, 3528, 4808, 13000, 4296, 12744, 1662, 9086, 10878, 12926, 3865, 7961, 3275, 4734, 8830, 10443, 7624, 11720, 1736, 5832, 9928, 6347, 8904, 1113, 2137, 12377, 3723, 638, 6937, 11033, 89, 200, 712, 456, 2504, 10891, 11464, 2841 and 10009 (43)
TexasEdwards, Irion, Kinney, McCulloch, Real, Sutton, Uvalde and Val Verde (8)4804, 8900, 12095, 7364, 9656, 3356, 6092, 708, 6596, 11716, 7452 and 12996 (12)
State Counties Not Reporting Outbreaks or Cases of Anthrax in Livestock or Wildlife, 2000–2013 Utilized for Statistical Evaluation
MinnesotaAitkin, Itasca and St. Louis (3)1077, 11317, 12341, 473, 1653, 1689, 3289, 2677, 3701, 4725, 6005, 7797 and 8245 (13)
MontanaGlacier, Toole and Liberty (3)3502, 11694, 2222, 3246, 7342, 10414, 11438, 6318 and 8366 (9)
NevadaWhite Pine (1)271, 1359, 2015, 2063, 3087, 3407, 4367, 8463, 9231, 9551, 10255, 11279, 11375 and 11999 (14)
North DakotaBurke, Divide, Mclean, Mountrail, Renville, Ward and Williams (7)7150, 11246, 12270, 3054, 6462, 7486, 10558, 318, 11326, 2030, 62, 5438, 9534, 3134, 7230 and 13118 (16)
OregonBaker and Grant (2)3342, 6926, 8974, 9742, 10510, 13070, 1102, 1550, 2574, 4174, 4622, 5198, 5646, 9294 and 12366 (15)
South DakotaCuster, Fall River, Pennington and Shannon (4)1675, 4811, 11147, 3979, 13003, 651, 4123, 4747, 5771, 8395 and 12491 (11)
TexasBriscoe, Cottle, Dickens, Floyd, Hall, King and Motley (7)4735, 3967, 7039, 11135, 191, 11391, 8063, 11647, 6015, 10111 and 4287 (11)
The anthrax-negative counties utilized for statistical evaluation (these were chosen randomly without knowledge of site geochemistry from each relevant state after the anthrax positive counties were mapped) included: (1) Minnesota: Aitkin, Itasca and St. Louis; (2) Montana: Glacier, Toole and Liberty; (3) Nevada: White Pine; (4) North Dakota: Burke, Divide, Mclean, Mountrail, Renville, Ward and Williams; (5) Oregon: Baker and Grant; (6) South Dakota: Custer, Fall River, Pennington and Shannon; and (7) Texas: Briscoe, Cottle, Dickens, Floyd, Hall, King and Motley. In summary, there were 89 sample sites located within these 27 counties.

2.3. Statistics

The non-parametric Mann–Whitney U test was utilized to evaluate differences in geochemistry between counties where anthrax outbreaks or cases had been reported since the year 2000 and counties within the same states where no cases were noted for the same time period using SPSS (IBM, Tampa, FL, USA) [19]. In the USGS Geochemical Landscape Project element concentration data set, there are values expressed as below minimum detection limits (MDL) for certain elements (Ag = 189 of 209, Cs = 170/209, Cd = 19/209, S = 2/209, Se 67/209 and Te = 198/209 data points). For statistical analyses, those values were set at the MDL for the respective elements (e.g., <1 is set at 1).

3. Results and Discussion
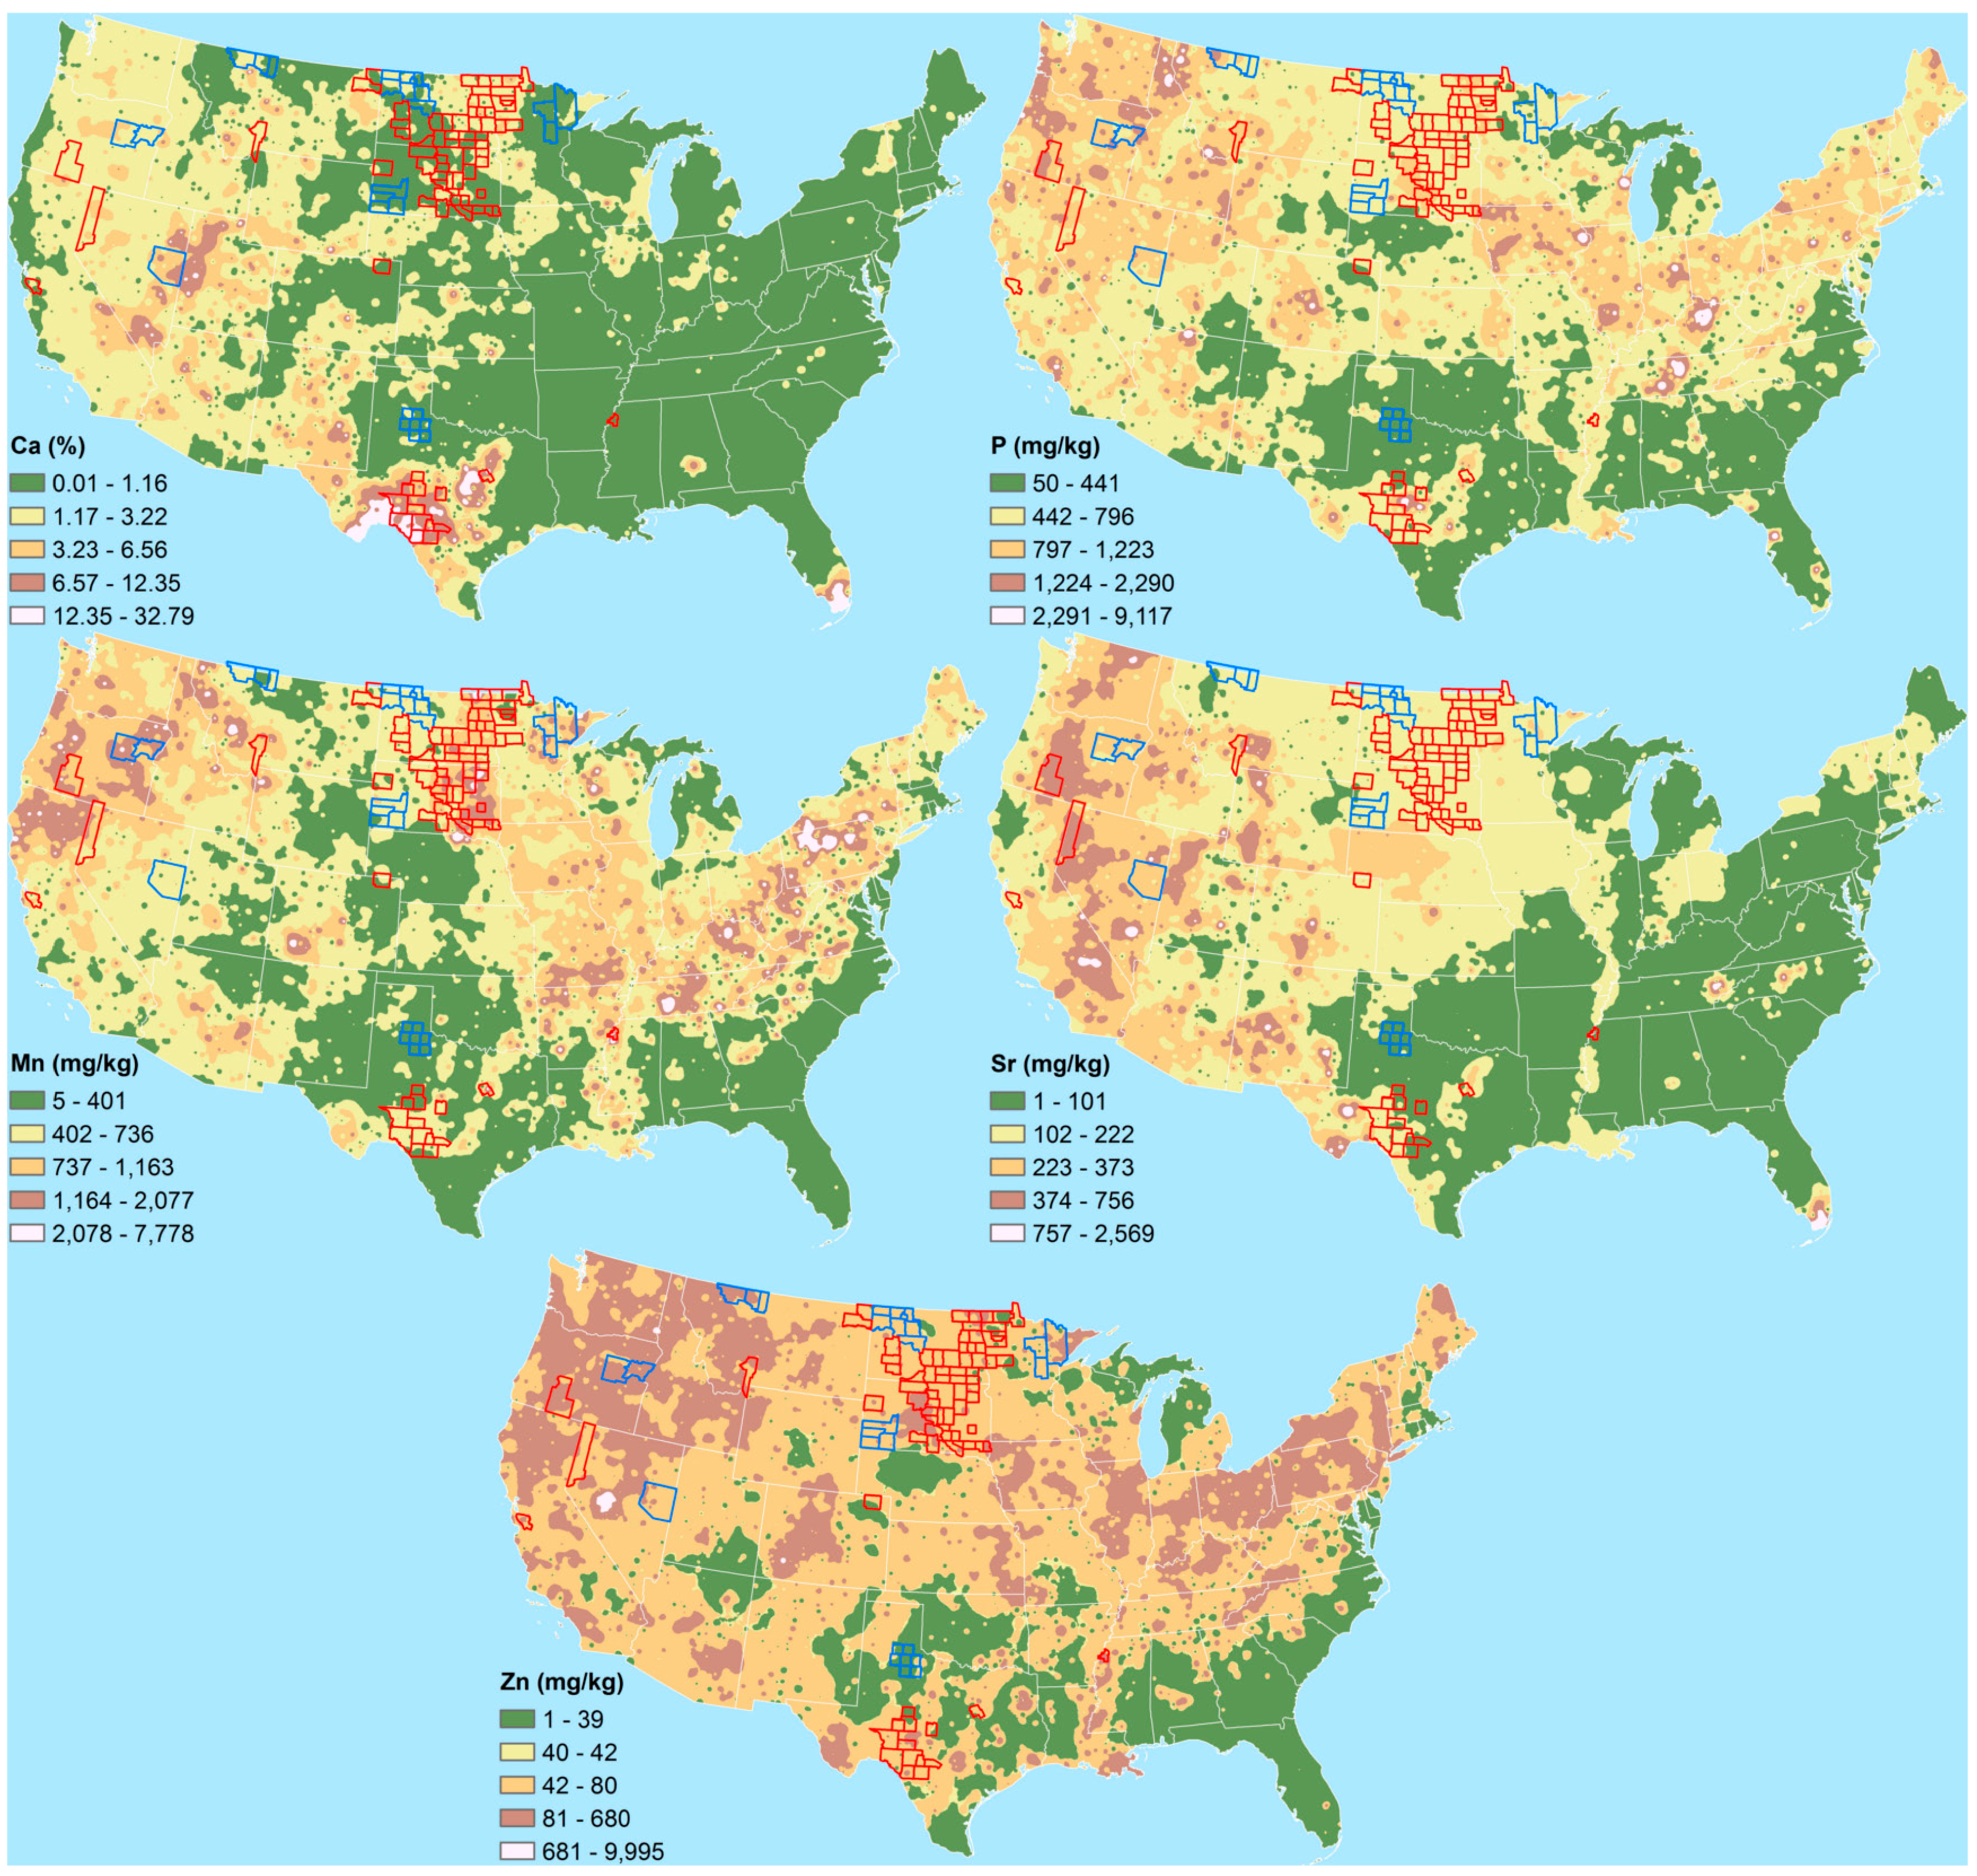
Comparing 120 sample sites from 46 counties (seven states, MN, MT, NV, ND, OR, TX and SD) that had reported anthrax outbreaks or cases to 89 sites from 27 counties (same states) that did not report outbreaks or cases resulted in the identification of seven elements with statistically significant differences in their respective concentrations (Table 2, all counties, Column 2). These elements included Ca (p = 0.006), Nb (p = 0.035), Ni (p = 0.028), P (p = 0.028), S (p = 0.002), Sn (p = 0.024) and Sr (p = 0.041). With the exception of Nb and Sr, the total state average of elemental concentrations was higher in anthrax-positive counties. When the elements were looked at individually, several trends emerged.

3.1. Strontium

When contrasting the elements by each state, only Sr had average concentrations that were higher in all anthrax-positive counties versus anthrax-negative counties, and the lowest observed concentration was 116 mg/kg. Strontium data were significantly different in three of the seven states.

3.2. Calcium

These concentrations were similar in both types of counties, with only one instance where average concentrations in negative counties exceeded positive counties, and that was in NV at 5.05 and 3.03 wt %, respectively. This anomaly can be explained in that the average concentrations in both the negative and positive counties were the second and third overall highest average concentrations in comparison to the data obtained from each of the other evaluated states. Overall, calcium data were significantly different between county types in three of the seven states.
Table 2. The significance (Mann–Whitney U test p-values; in bold where <0.05) of elemental concentrations (averages in brackets [#/#] where there was an overall or greater than two state significant p-values) in counties reporting outbreaks or cases of anthrax in livestock and wildlife versus counties that have not reported outbreaks or cases of anthrax since the year 2000.
ElementAll Counties 46 (120)/27 (89)Texas 8 (12)/7 (11)N. Dakota 8 (18)/7 (16)S. Dakota 18 (43)/4 (11)Minnesota 7 (17)/3 (13)Nevada 1 (11)/1 (14)Oregon 1 (11)/2 (15)Montana 3 (8)/3 (9)
Al0.791 0.0000.0010.034 *
[5.9/5.3][4.2/3.9][4.6/4.7] *[5.1/4.8][4.5/4.1][8.4/5.6][9.6/8.0][4.7/5.7]
As 0.018
Ba0.223 *0.001 *0.001 *0.021 *0.001
[582/634][283/444][556/627][691/755] *[485/520][928/672][528/682] *[599/740] *
Be 0.041 *
Bi 0.0020.015 *
Ca0.0060.0000.0040.005
[3.3/1.8][10.4/1.1][1.8/1.4][1.3/0.7][2.2/1.0][3.0/5.1] *[2.6/2.5][1.9/0.9]
Co 0.0000.023 *
Cr 0.019
Cu 0.034 *
Fe 0.000
Ga 0.000
K 0.019* 0.012 *
La 0.004 *0.023 *
Li 0.001 *
Ln 0.019
Mn0.0720.0060.0450.010.004 *0.014
[761/702][530/304][783/602][1024/530][463/1144][925/569][1120/1343][487/424]
Mo0.128 *0.0010.009 *0.002 *
[0.9/1.0][1.1/0.6][0.8/0.8][1.2/1.5][0.4/0.8][1.3/1.2][0.9/1.3] *[0.7/1.1] *
Na0.6930.001 *0.001 0.02
[1.2/0.9][0.2/0.5][0.8/0.9][0.9/0.6][1.1/1.1] *[2.2/1.0][2.3/1.6][0.9/0.9]
Nb0.035 *0.021 0.000 *
[7.9/9.0][10.1/7.5][6.8/6.8][8.8/9.9][5.7/6.1] *[10.2/12.7] *[6.2/10.8][7.7/9.3] *
Ni0.0280.01
[21/18][15/12][19/17][25/15][15/14][16/14][42/30][14/20] *
P0.0280.0030.0020.01
[761/692][580/330][652/518][737/566][675/620][818/886] *[1,203/1,099][658/827] *
Pb0.190 *0.0040.000 *0.013 *0.023 *0.043 *
[16/18][16/13][14/13][16/21][14/18][16/21][11/13][14/25] *
Rb0.21 * 0.001 *0.012 *0.034 *
[58/70][69/64][64/64][69/67][58/60] *[61/106][27/43][61/84]
S0.002 *0.000
[0.05/0.06][0.06/0.02][0.05/0.04][0.05/0.04][0.04/0.04][0.06/0.03][0.03/0.03][0.06/0.19] *
Sb 0.0000.045 *
Sn0.0240.003 *0.029 *
[1.53/1.34][3.67/1.19][1.03/0.93][1.18/1.40][0.89/0.95][1.46/1.81][1.39/1.75][1.09/1.34]
Sr0.0410.0030.0000.000
[250/169][116/86][165/154][170/137][189/179][457/262][495/229][157/140]
Th 0.001 *0.012 *
Ti 0.000
Tl0.498 *0.029 0.002 *0.013 *0.036 *
[0.4/0.47][0.46/0.35][0.44/0.43][0.52/0.55] *[0.35/0.36] *[0.37/0.61][0.23/0.35][0.44/0.62]
U0.837 * 0.0060.007 * 0.023 *
[1.90/1.91][1.70/1.71] *[1.92/1.45][1.99/2.40][2.11/1.14][2.05/2.42] *[1.42/1.69] *[1.80/2.58]
V 0.0000.014 *
W 0.040.015 *
Y 0.018 0.008 *
Zn 0.021 *
Notes: Numbers under column titles = the number of counties with anthrax cases (the total number of sample sites in those counties used for analyses)/the number of counties with no cases (the total number sample sites in those counties used for analyses). [#/#], [the average concentration in counties with reported cases/average concentration in counties with no reported cases]. * = lower concentration in anthrax-positive counties. Elemental concentrations are reported as weight percent (wt % = Al, Ca, Fe, K, Mg, Na, Ti and S) or mg/kg [14]. Elements Cd, Ce, Hg, Mg and Sc did not show significance in any of the states and were not included to simplify the table.

3.3. Phosphorus

Phosphorus concentration averages in NV (886 mg/kg) and MT (827 mg/kg) were greatest in negative counties, but these concentrations were the third and fourth highest overall concentrations in comparison to the data obtained from the other states. Overall, P data were significantly different in three of the seven states.

3.4. Nickel

Average Ni concentrations by state, with the exception of MT, were higher in anthrax-positive counties. The Ni concentrations in the MT counties averaged 20 mg/kg, which was the fourth highest overall. The only significant difference in Ni concentrations by state occurred in SD.

3.5. Niobium

Significant differences in total Nb concentrations occurred with only two states showing contrasting data, TX and OR, with average concentrations higher in anthrax-positive counties and in anthrax-negative counties, respectively.

3.6. Manganese

Manganese concentrations, while not significant for the total data set (p = 0.07), were significant when contrasting counties in TX, ND, SD, MN and NV. Only in MN was a significant difference noted where the Mn average concentration was greater in negative counties, and in this instance, the negative county average was the second highest observed (1144 mg/kg) across all states. Elevated concentrations such as this may mask a relationship.

3.7. Sulfur

The total S significant difference (high concentrations in negative counties) occurred over a small concentration range (0.02 to 0.19 wt %), and the only state-level significant difference that occurred was with the TX data set, which was opposite (high concentrations in positive counties) of the total.

3.8. Other Elements

Similar to the observation with sulfur, the total Sn significant difference (high concentrations in positive counties) was opposite that observed with the two state-level data sets. Several other elements, such as Al, Ba, Mo, Na, Pb, Rb and Tl, exhibited significant differences in multiple or individual states, but in many cases, one state produced a significant difference in anthrax-positive counties and, in another, in anthrax-negative counties. Cesium data produced a significant p-value below 0.05, but this was dismissed, due to the fact that 170 of the 209 data points were below the MDL. Of the remaining four elements (Ag, Cd, Te and Se) with MDL data, none produced p-values below 0.05.
Figure 1 illustrates the counties used for statistical analyses and the data (Mann–Whitney U p-values and, in relevant cases, the average elemental concentrations) are listed in Table 2. Of the 40 elements screened, seven (Ca, Nb, Ni, P, S, Sn and Sr) gave significant differences when samples from all seven states were evaluated as a whole. Of these, eight were positive (meaning the concentration was higher in anthrax counties) significant differences and one (Nb) was negative (the concentration was lower in anthrax counties). The Nb differences resulted in both negative (OR) and positive (TX) “by state” results, questioning the strength and/or validity of this “total” observation. The overall differences in concentrations of other elements, such as Ni and S, also resulted in both significant negative and positive results, and thus, the overall observation is either weak or not valid. The significant difference with Ni is also considered weak given that this was derived from a single positive difference (p = 0.01) that was observed within the SD sample set. This observation was also noted with the S data. It may be that one of these or other elements do contribute to virulence, but further research is needed to determine the potential role and threshold concentrations. The remaining three overall positive differences (Ca, P and Sr) had significant p-values in at least three of the seven states for each element. For Mn, there was one negative (due to the second highest average concentration at 1144 mg/kg, relative to the overall seven-state data set average of 808 mg/kg) and four significant positive state data. Manganese was selected for inclusion in the group of selected relevant elements (Ca, Mn, P and Sr) given the predominance of significantly positive state data and the skew produced by the lone negative. The regional distribution and concentration ranges for these four elements (Ca, Mn, P and Sr) and Zn (an element required for the lethal factor) are illustrated in Figure 2. Calcium, Mn and P have also been recognized as elements influencing the growth and/or virulence of this pathogen [1,5,20,21]. Other elements that have been reported to influence this pathogen include Na and S [2,4], and both of these elements resulted in at least one significantly positive state data set (Table 2). Also of note are elements, such as Ba and Rb (both close neighbors to calcium and strontium in the periodic table), which produced multi-state negative significance data, that may inhibit virulence by mechanisms, such as mimicking a critical virulence element [22]. In this case, the probability of conversion is suppressed in geographic regions where the mimicking element exceeds a given threshold concentration. It is interesting (as can be observed in Figure 3) that the concentrations of both of these elements are relatively low in many of the anthrax-positive counties of ND, SD, MN and TX.
Using concentrations observed at sample sites in the states listed in Table 2 for Ca, Mn, P and Sr, several tentative threshold concentrations can be selected for each element in regard to the likelihood of an outbreak occurring at a given location. As an example, the minimum concentration observed in any of these state counties for Ca is 0.43 wt %, and the lowest significant average listed in Table 2 is 1.3 wt %. These concentrations can be utilized as putative thresholds for an investigative tool to determine the likelihood of a naturally occurring outbreak being “potential” at 0.43 wt % or above and “likely” at 1.3 wt % or above. Similarly, “potential” and “likely” thresholds can also be set for Mn (144 and 463 mg/kg), P (180 and 580 mg/kg) and Sr (51 and 170 mg/kg). Figure 4 illustrates those sample sites where those upper or “likely” concentration levels occurred both individually and in combination.
Figure 2. Calcium, phosphorus, manganese, strontium and zinc soil concentration gradient maps for the contiguous United States. Red counties = cases and/or outbreaks of agricultural/wildlife anthrax since 2000. Blue counties = no reported cases and utilized for geochemical statistical comparisons with red counties.
Geosciences 04 00114 g002
Figure 3. Barium and rubidium soil concentration gradient maps for the contiguous United States. Red counties = cases and/or outbreaks of agricultural/wildlife anthrax since 2000. Blue counties = no reported cases and utilized for geochemical statistical comparisons with red counties.
Geosciences 04 00114 g003
Figure 4. USGS Geochemical Landscape Project sample sites where the average statistically significant concentrations of Ca, Mn, P and Sr were equal to or exceeded 1.3 wt %, 463 mg/kg, 580 mg/kg and 170 mg/kg, respectively. Individual maps and one combined showing the sites where each of these concentrations occurred.
Geosciences 04 00114 g004

4. Conclusions

The evaluation of geochemical data from a series of selected sample sites in seven states identified four elements that had significant differences in concentrations between anthrax-positive and anthrax-negative counties. The elements were Ca, Mn, P and Sr, which in part match historical observations. Tentative threshold values based on the lowest concentrations and the lowest average concentrations of each of these elements, in the anthrax positive-counties utilized in this study, were identified for use as prospective tools for determining whether or not a naturally occurring outbreak had “potential” or was “likely” at any given geographic location. While these elemental threshold values are preliminary in nature, they present an investigative tool that can be refined through future high-resolution studies that need to be conducted in and around “endemic” areas. The USGS data set is a valuable tool that can be used to determine the background distribution of pathogens in soils of the contiguous United States. Being able to predict the natural occurrence of this agent may help guide animal and public health planning and response efforts. These data also provide insight to assist in environmental remediation decisions following a suspected outbreak or release of this agent and, overall, provide a roadmap forward for investigating the natural background occurrence of other select agents.

Acknowledgments

This project was a joint USGS/USEPA (through its Office of Research and Development) collaboration under EPA IA# DW14957748. The authors would like to thank Sarah Perkins formerly of the USEPA for her help and assistance on this project. This content has been peer and administratively reviewed and has been approved for publication as a joint USGS and USEPA publication. Note that approval does not signify that the contents necessarily reflect the views of the USEPA or the USGS, but rather the authors. The use of trade names is for descriptive purposes only and does not imply endorsement by the U.S. Government.

Author Contributions

All authors contributed equally to this manuscript.

Conflicts of Interest

The authors declare no conflict of interest.

References

  1. Weinberg, E.D. The Influence of soil on infectious-disease. Experientia 1987, 43, 81–87. [Google Scholar] [CrossRef] [PubMed]
  2. Griffin, D.W.; Petrosky, T.; Morman, S.A.; Luna, V.A. A survey of the occurrence of Bacillus anthracis in North American soils over two long-range transects and within post-Katrina New Orleans. Appl. Geochem. 2009, 24, 1464–1471. [Google Scholar] [CrossRef]
  3. Kochi, S.K.; Schiavo, G.; Mock, M.; Montecucco, C. Zinc content of the Bacillus anthracis lethal factor. Fems Microbiol. Lett. 1994, 124, 343–348. [Google Scholar] [CrossRef] [PubMed]
  4. Hugh-Jones, M.; Blackburn, J. The ecology of Bacillus anthracis. Mol. Aspects Med. 2009, 30, 356–367. [Google Scholar] [CrossRef] [PubMed]
  5. Wright, G.G.; Angelety, L.H.; Swanson, B. Studies on immunity in anthax. XII. Requirement for phosphate for elaboration of protective antigen and its partial replacement by charcoal. Infect. Immun. 1970, 2, 772–777. [Google Scholar]
  6. Qi, Y.; Patra, G.; Liang, X.; Williams, L.E.; Rose, S.; Redkar, R.J.; DelVecchio, V.G. Utilization of the rpoB gene as a specific chromosomal marker for real-time PCR detection of Bacillus anthracis. Appl. Environ. Microb. 2001, 67, 3720–3727. [Google Scholar]
  7. Kenefic, L.J.; Pearson, T.; Okinaka, R.T.; Schupp, J.M.; Wagner, D.M.; Ravel, J.; Hoffmaster, A.R.; Trim, C.P.; Chung, W.K.; Beaudry, J.A.; Foster, J.T.; Mead, J.I.; Keim, P. Pre-Columbian origins for North American anthrax. PLoS One 2009, 4, e4813. [Google Scholar] [CrossRef] [PubMed]
  8. Van Ert, M.N.; Easterday, W.R.; Huynh, L.Y.; Okinaka, R.T.; Hugh-Jones, M.E.; Ravel, J.; Zanecki, S.R.; Pearson, T.; Simonson, T.S.; U’Ren, J.M.; et al. Global Genetic Population Structure of Bacillus anthracis. PLoS One 2007, 2, e461. [Google Scholar] [CrossRef] [PubMed]
  9. Elias, S.A.; Short, S.K.; Nelson, C.H.; Birks, H.H. Life and times of the Bering land bridge. Nature 1996, 382, 60–63. [Google Scholar] [CrossRef]
  10. Williams, R.C.; Steinberg, A.G.; Gershowitz, H.; Bennett, P.H.; Knowler, W.C.; Pettitt, D.J.; Butler, W.; Baird, R.; Dowdarea, L.; Burch, T.A.; et al. Gm Allotypes in Native Americans—Evidence for 3 Distinct Migrations across the Bering Land-Bridge. Am. J. Phys. Anthropol. 1985, 66, 1–19. [Google Scholar] [CrossRef] [PubMed]
  11. Mongoh, M.N. Characterization of Anthrax Occurrence in North Dakota: Determinants, Management Strategies, and Economic Impacts. Ph.D. Thesis, North Dakota State University of Agriculture and Applied Sciences, Fargo, North Dakota, USA, September 2007. [Google Scholar]
  12. Salb, A.; Stephen, C.; Ribble, C.; Elkin, B. Descriptive epidemiology of detected anthrax outbreaks in wild wood bison (bison bison athabascae) in northern Canada,1962–2008. J. Wildl. Dis. 2014, 50, 459–468. [Google Scholar] [CrossRef] [PubMed]
  13. Ramsey, R.; Doye, D.; Ward, C.; McGrann, J.; Falconer, L.; Bevers, S. Factors affecting beef cow-herd costs, production, and profits. J. Agr. Appl. Econ. 2005, 37, 91–99. [Google Scholar]
  14. Smith, D.B.; Cannon, W.F.; Woodruff, L.G.; Solano, F.; Kilburn, J.E.; Fey, D.L. Geochemical and Mineralogical Data for Soils of the Conterminous United States; U.S. Geological Survey Data Series 801; U.S. Geological Survey: Reston, VA, USA, 2013. Available online: http://pubs.usgs.gov/ds/801/ (accessed on 12 May 2014).
  15. Reimann, C.; Filzmoser, P.; Garrett, R.G.; Dutter, R. Statistical Data Analysis Explained; John Wiley & Sons: Chichester, UK, 2008. [Google Scholar]
  16. Smith, D.B.; Woodruff, L.G.; O’Leary, R.M.; Cannon, W.F.; Garrett, R.G.; Kilburn, J.E.; Goldhaber, M.B. Pilot studies for the North American Soil Geochemical Landscapes Project—Site selection, sampling protocols, analytical methods, and quality control protocols. Appl. Geochem. 2009, 24, 1357–1368. [Google Scholar] [CrossRef]
  17. Garrett, R.G. Relative spatial soil geochemical variability along two transects across the United States and Canada. Appl. Geochem. 2009, 24, 1405–1415. [Google Scholar] [CrossRef]
  18. Animal and Plant Health Inspection Service, United States Department of Agriculture. Available online: http://www.aphis.usda.gov/wps/portal/aphis/home/ (accessed on 8 August 2014).
  19. Dytham, C. Choosing and Using Statistics,A Biologist’s Guide; Blackwell Science: Oxford, UK, 1999. [Google Scholar]
  20. Pasteur, L. On the etiology of anthrax. Comptes Rendus Seances Acad. Sci. 1880, 91, 86–94. [Google Scholar]
  21. Van Ness, G.; Stein, C.D. Soils of the United States favorable for anthrax. J. Am. Vet. Med. Assoc. 1956, 128, 7–12. [Google Scholar] [PubMed]
  22. Heldman, E.; Levine, M.; Raveh, L.; Pollard, H.B. Barium ions enter chromaffin cells via voltage-dependent calcium. J. Biol. Chem. 1989, 264, 7914–7920. [Google Scholar] [PubMed]

