Recent Alpine Glacier Variability: Wind River Range, Wyoming, USA

Abstract
:1. Introduction
2. Data and Methods
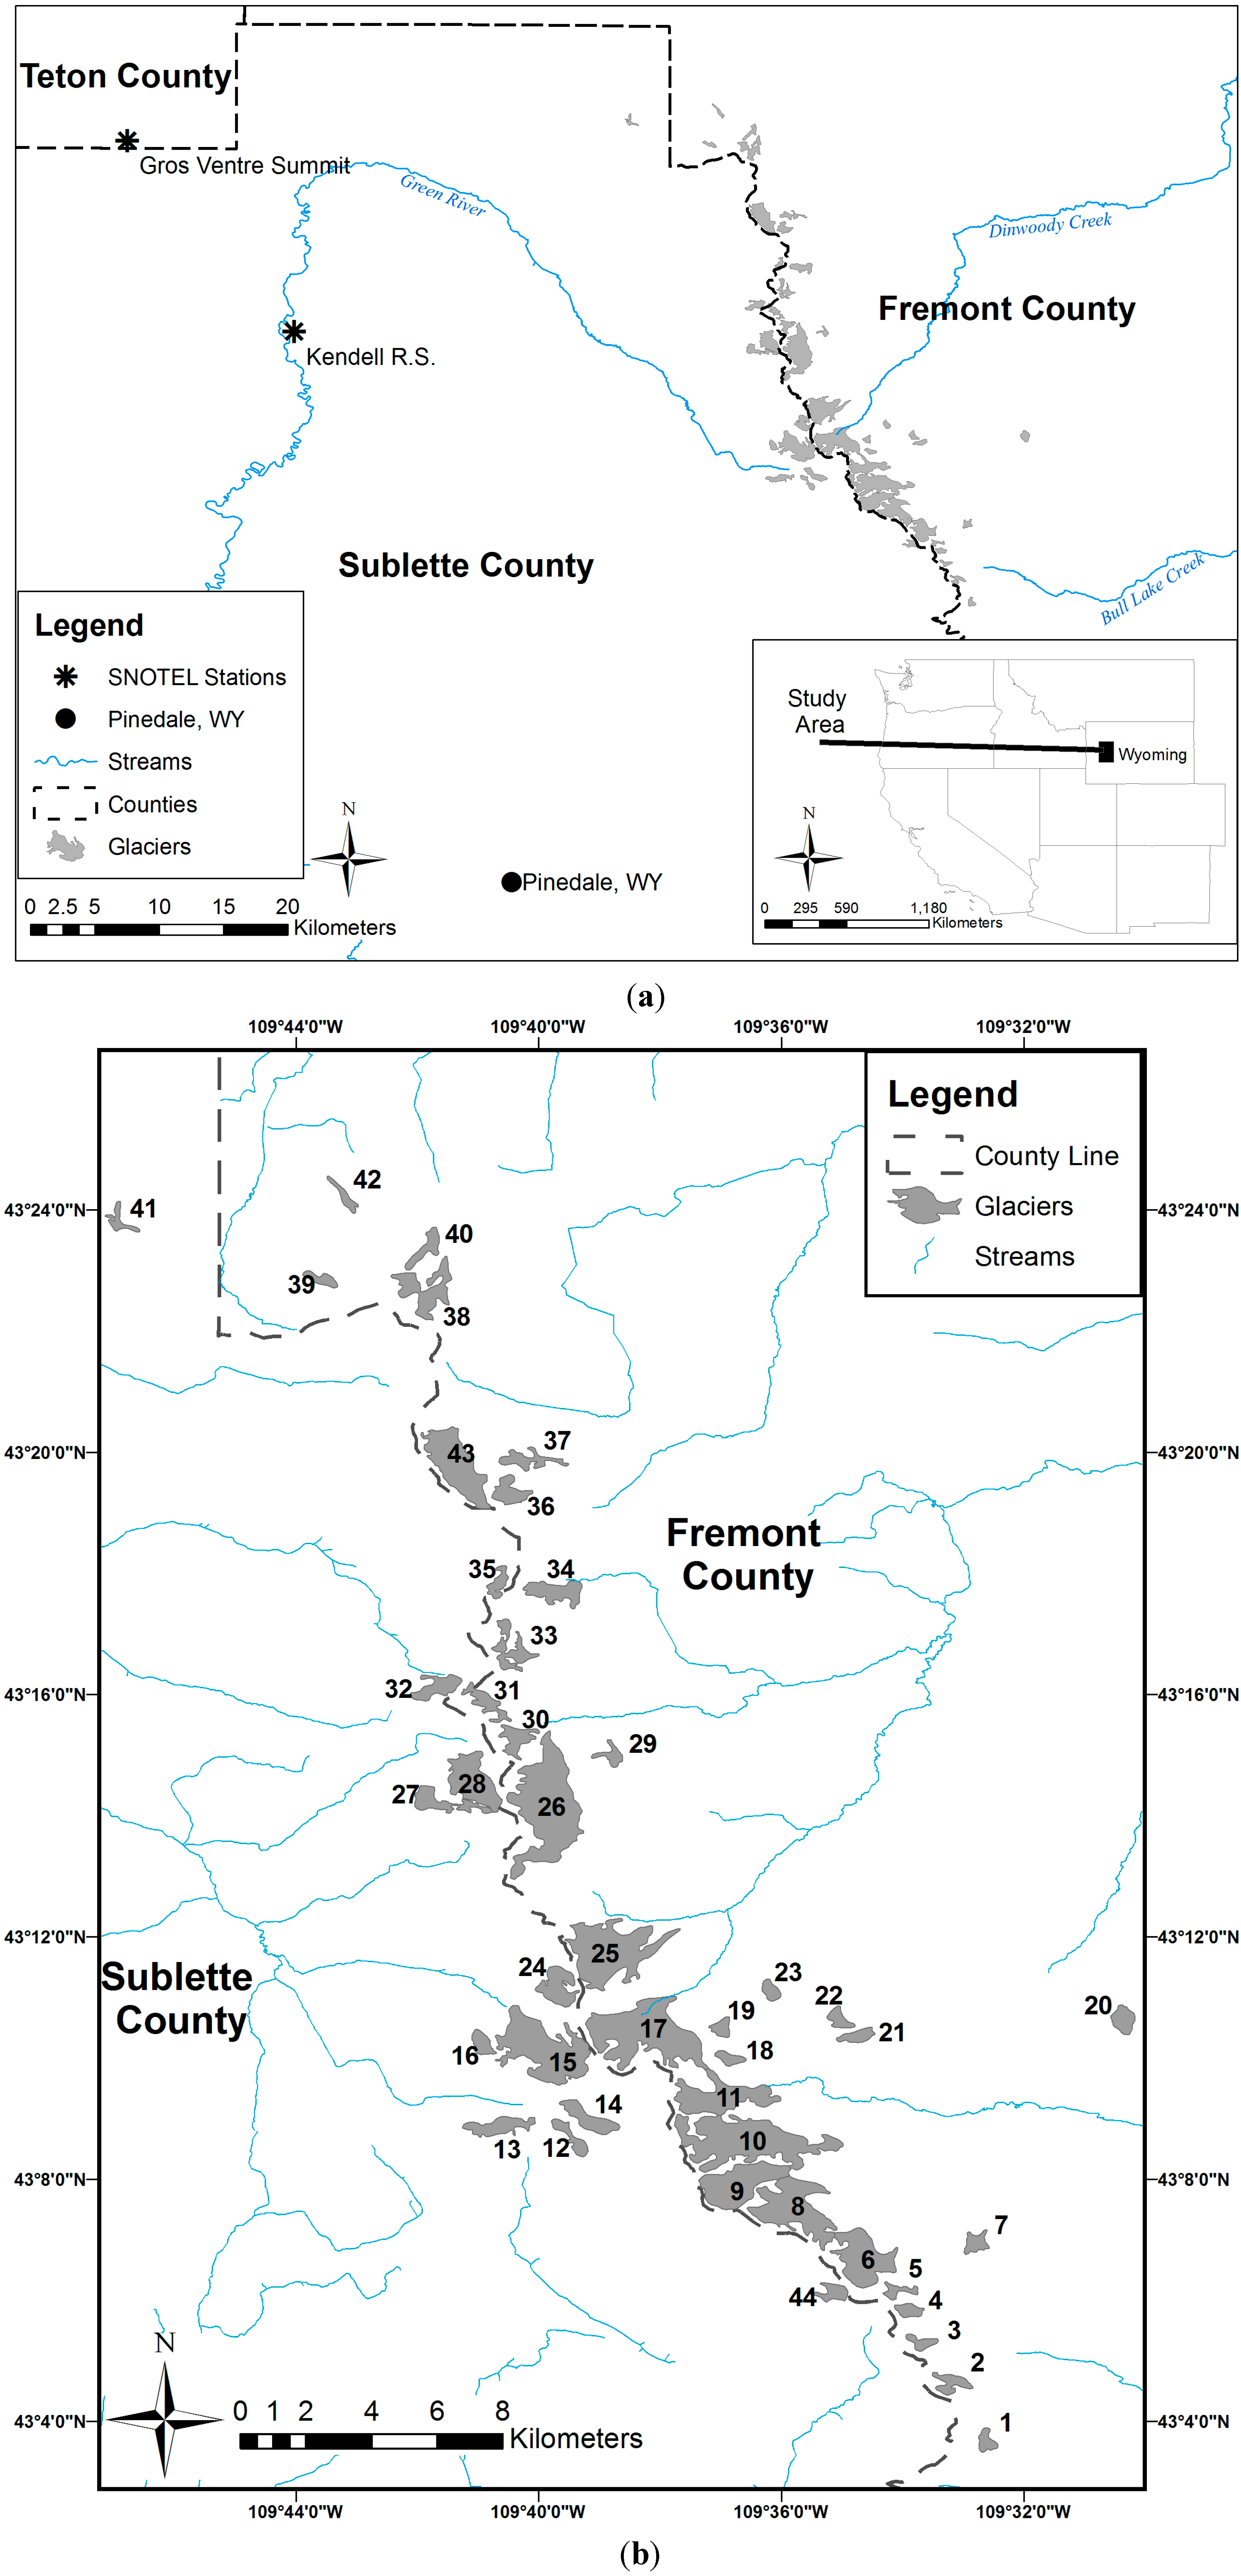
2.1. Study Area

2.2. Data
2.3. Methods

2.4. Uncertainty
2.4.1. Area Error Estimation
2.4.2. Volume Error Estimation
3. Results

| Glacier ID | Glacier Name | Glacier Surface Area (km2) | Glacier Volume (km3) | ||
|---|---|---|---|---|---|
| 2006 Thompson et al. [1] | 2006 | 2012 | 2012 | ||
| 1 | NN | 0.095 ± 0.001 | 0.095 ± 0.000 | 0.087 ± 0.003 | 0.001 ± 0.0003 |
| 2 | NN | 0.176 ± 0.007 | 0.178 ± 0.003 | 0.171 ± 0.003 | 0.003 ± 0.0004 |
| 3 | NN | 0.177 ± 0.004 | 0.178 ± 0.006 | 0.171 ± 0.006 | 0.003 ± 0.0004 |
| 4 | NN | 0.181 ± 0.003 | 0.183 ± 0.001 | 0.174 ± 0.005 | 0.003 ± 0.0004 |
| 5 | NN | 0.142 ± 0.004 | 0.142 ± 0.009 | 0.139 ± 0.001 | 0.002 ± 0.0004 |
| 6 | Knife Point | 0.79 ± 0.004 | 0.789 ± 0.003 | 0.714 ± 0.025 | 0.021 ± 0.0020 |
| 7 | NN | 0.174 ± 0.005 | 0.175 ± 0.005 | 0.164 ± 0.002 | 0.003 ± 0.0004 |
| 8 | Bull Lake | 1.716 ± 0.051 | 1.707 ± 0.002 | 1.637 ± 0.020 | 0.064 ± 0.0133 |
| 9 | Upper Fremont | 1.306 ± 0.006 | 1.292 ± 0.004 | 1.294 ± 0.001 | 0.046 ± 0.0083 |
| 10 | Sacagawea | 2.046± 0.030 | 2.039 ± 0.004 | 1.898 ± 0.008 | 0.078 ± 0.0177 |
| 11 | Helen | 1.075 ± 0.046 | 1.067 ± 0.010 | 1.048 ± 0.037 | 0.035 ± 0.0052 |
| 12 | NN | 0.142 ± 0.003 | 0.142 ± 0.006 | 0.131 ± 0.018 | 0.002 ± 0.0004 |
| 13 | Stroud | 0.409 ± 0.007 | 0.407 ± 0.004 | 0.403 ± 0.004 | 0.010 ± 0.0001 |
| 14 | Twins | 0.385 ± 0.009 | 0.371 ± 0.024 | 0.340 ± 0.001 | 0.008 ± 0.0001 |
| 15 | Mammoth | 2.028 ± 0.015 | 2.028 ± 0.023 | 1.990 ± 0.072 | 0.083 ± 0.0193 |
| 16 | Baby | 0.221 ± 0.004 | 0.221 ± 0.001 | 0.201 ± 0.002 | 0.004 ± 0.0004 |
| 17 | Dinwoody | 2.474 ± 0.054 | 2.478 ± 0.027 | 2.312 ± 0.034 | 0.102 ± 0.0254 |
| 18 | NN | 0.147 ± 0.003 | 0.146 ± 0.002 | 0.142 ± 0.001 | 0.002 ± 0.0004 |
| 19 | Heap Steep | 0.109 ± 0.002 | 0.109 ± 0.002 | 0.102 ± 0.003 | 0.001 ± 0.0004 |
| 20 | NN | 0.286 ± 0.005 | 0.288 ± 0.006 | 0.281 ± 0.006 | 0.006 ± 0.0003 |
| 21 | NN | 0.133 ± 0.010 | 0.133 ± 0.005 | 0.123 ± 0.001 | 0.002 ± 0.0004 |
| 22 | NN | 0.0986 ± 0.001 | 0.099 ± 0.004 | 0.093 ± 0.002 | 0.001 ± 0.0003 |
| 23 | NN | 0.159 ± 0.003 | 0.157 ± 0.002 | 0.153 ± 0.005 | 0.003 ± 0.0004 |
| 24 | Minor | 0.425 ± 0.004 | 0.425 ± 0.011 | 0.412 ± 0.008 | 0.010 ± 0.0002 |
| 25 | Gannett | 3.27 ± 0.025 | 3.282 ± 0.045 | 3.245 ± 0.034 | 0.162 ± 0.0464 |
| 26 | Grasshopper | 2.48 ± 0.026 | 2.465 ± 0.014 | 2.453 ± 0.034 | 0.111 ± 0.0283 |
| 27 | J | 0.344 ± 0.004 | 0.345 ± 0.004 | 0.331 ± 0.004 | 0.007 ± 0.0001 |
| 28 | Sourdough | 0.922 ± 0.001 | 0.923 ± 0.006 | 0.895 ± 0.030 | 0.028 ± 0.0036 |
| 29 | NN | 0.087 ± 0.003 | 0.086 ± 0.003 | 0.088 ± 0.009 | 0.001 ± 0.0003 |
| 30 | NN | 0.286 ± 0.005 | 0.281 ± 0.017 | 0.274 ± 0.012 | 0.006 ± 0.0003 |
| 31 | NN | 0.275 ± 0.016 | 0.297 ± 0.007 | 0.324 ± 0.012 | 0.007 ± 0.0002 |
| 32 | Connie | 0.332 ± 0.003 | 0.332 ± 0.000 | 0.303 ± 0.022 | 0.006 ± 0.0002 |
| 33 | NN | 0.442 ± 0.003 | 0.434 ± 0.003 | 0.468 ± 0.051 | 0.012 ± 0.0004 |
| 34 | Downs | 0.518 ± 0.003 | 0.516 ± 0.011 | 0.516 ± 0.009 | 0.013 ± 0.0007 |
| 35 | NN | 0.127 ± 0.004 | 0.128 ± 0.005 | 0.125 ± 0.022 | 0.002 ± 0.0004 |
| 36 | NN | 0.770 ± 0.011 | 0.770 ± 0.006 | 0.685 ± 0.078 | 0.020 ± 0.0018 |
| 37 | NN | 0.246 ± 0.000 | 0.244 ± 0.007 | 0.242 ± 0.034 | 0.005 ± 0.0003 |
| 38 | NN | 0.389 ± 0.008 | 0.387 ± 0.006 | 0.368 ± 0.048 | 0.008 ± 0.0000 |
| 39 | NN | 0.146 ± 0.000 | 0.144 ± 0.004 | 0.145 ± 0.014 | 0.002 ± 0.0004 |
| 40 | NN | 0.010 ± 0.000 | 0.098 ± 0.003 | 0.115 ± 0.014 | 0.002 ± 0.0004 |
| 41 | NN | 0.051 ± 0.001 | 0.053 ± 0.001 | 0.131 ± 0.004 | 0.002 ± 0.0004 |
| 42 | NN | 0.039 ± 0.001 | 0.038 ± 0.001 | 0.062 ± 0.001 | 0.001 ± 0.0003 |
| 43 | Continental | 2.671 ± 0.009 | 2.648 ± 0.008 | 2.661 ± 0.032 | 0.124 ± 0.0328 |
| 44 | Harrower | 0.141 ± 0.002 | 0.145 ± 0.004 | 0.160 ± 0.004 | 0.003 ± 0.0004 |
4. Conclusion
Acknowledgments
Author Contributions
Conflicts of Interest
References
- Thompson, D.; Tootle, G.; Kerr, G.; Sivanpillai, R.; Pochop, L. Glacier Variability in the Wind River Range, Wyoming. J. Hydrol. Eng. 2011, 16, 798–805. [Google Scholar] [CrossRef]
- Bahr, D.B.; Meier, M.F.; Peckman, S.D. The physical basis of glacier volume-area scaling. J. Geophys. Res. 1997, 102, 20355–20362. [Google Scholar] [CrossRef]
- Veettil, B.K. A remote sensing approach for monitoring debris-covered glaciers in the high altitude Karakoram Himalayas. Int. J. Geomat. Geosci. 2012, 2, 833–841. [Google Scholar]
- Cheesbrough, K.; Edmunds, J.; Tootle, G.; Kerr, G.; Pochop, L. Estimated Wind River Range (Wyoming, USA) glacier melt contributions to agriculture. Remote Sens. 2009, 1, 818–828. [Google Scholar] [CrossRef]
- Moore, R.D.; Fleming, S.W.; Menounos, B.; Wheate, R.; Fountain, A.; Stahl, K.; Holm, K.; Jakob, M. Glacier change in western North America: Influences on hydrology, geomorphic hazards and water quality. Hydrol. Process. 2009, 23, 42–61. [Google Scholar] [CrossRef]
- Jansson, P.; Hock, R.; Schneider, T. The concept of glacier storage: A review. J. Hydrol. 2003, 282, 116–129. [Google Scholar] [CrossRef]
- Mote, P.W. Trends in snow water equivalent in the Pacific Northwest and their climatic causes. Geophys. Res. Lett. 2003, 30. [Google Scholar] [CrossRef]
- United States Geological Survey (USGS). Changes in Streamflow Timing in the Western United States in Recent Decades; U.S. Geological Survey Fact Sheet 2006-3018; United States Geological Survey: Reston, VA, USA, 2005.
- Westerling, A.L.; Hidalgo, H.G.; Cayan, D.R.; Swetnam, T.W. Warming and earlier spring increase western U.S. forest wildfire activity. Science 2006, 313, 940–943. [Google Scholar]
- Marston, R.A.; Pochop, L.O.; Kerr, G.L.; Varuska, M.L. Recent Trends in Glaciers and Glacier Runoff, Wind River Range, Wyoming. In Proceedings of the Symposium on Headwater Hydrology; Woessner, W.W., Potts, D.F., Eds.; American Water Resources Association: Middleburg, VA, USA, 1989; pp. 159–169. [Google Scholar]
- Vanlooy, J.A.; Miège, C.; Vandeberg, G.S.; Forster, R.R. Ice volume estimation inferred from ice thickness and surface measurements for Continental Glacier, Wind River Range, Wyoming, USA. J. Glaciol. 2014, 60, 478–488. [Google Scholar] [CrossRef]
- Meier, M.F. Glaicers and water supply. J. Am. Water Work. Assoc. 1969, 61, 8–12. [Google Scholar]
- Gao, J.; Liu, Y. Application of remote sensing, GIS and GPS in glaciology: A review. Prog. Phys. Geogr. 2001, 25, 520–540. [Google Scholar] [CrossRef]
- Marston, R.A.; Pochop, L.O.; Kerr, G.L.; Varuska, M.L.; Veryzer, D.J. Recent glacier changes in the Wind River Range, Wyoming. Phys. Geogr. 1991, 12, 115–123. [Google Scholar]
- Meier, M.F. Glaciers of the Gannett Peak-Fremont Area, Wyoming. Master’s Thesis, University of Iowa, Iowa City, IA, USA, 1951. [Google Scholar]
- Krimmel, R.M. Glaciers of the Conterminous United States: Glaciers of the Western United States, with a Section on Glacier Retreat in Glacier National Park, Montana by Key, C.H., Fagre, D.B., Menicke, R.K. U.S. Geological Survey Professional Paper 1386-J-2; United States Geological Survey: Reston, VA, USA, 2002; pp. 329–381. [Google Scholar]
- Thompson, C.; Love, C.M. Reconnaissance Survey: Trace Metals Concentration in Wind River Glaciers; Report to Wyoming Water Research Center; Wyoming Water Research Center: Laramie, WY, USA, 1988.
- Mears, B., Jr. Wyoming’s Glaciers, Past and Present; Wyoming Game and Fish Commission: Cheyenne, WY, USA, 1972; pp. 26–34. [Google Scholar]
- Dyson, J.L. Glaciers of the American Rocky Mountains: Triennial Report 1950–1952; American Geographical Society: New York, NY, USA, 1952. [Google Scholar]
- Devisser, M. Glaciers of Wyoming. Retrieved 15 January 2009, from Glaciers Online—Glaciers of the American West. Available online: http://glaciers.us/glaciers-wyoming (accessed on 28 April 2014).
- Pochop, L.O.; Marston, R.A.; Kerr, G.L.; Veryzer, D.J.; Jacobel, R. Glacial Icemelt in the Wind River Range, Wyoming. In Watershed Planning and Analysis in Action, Symposium Proceedings of IR Conference Watershed Mgt/IR Div/ASCE, Durango, CO, USA, 9–11 July 1990; pp. 118–124.
- Curtis, J.; Grimes, K. Wyoming Climate Atlas. Retrieved 30 September 2009. Available online: http://www.wrds.uwyo.edu/sco/climateatlas/title_page.html (accessed on 5 May 2014).
- Oswald, E.B.; Wohl, E. Wood-mediated geomorphic effects of a jokulhlaup in the Wind River Mountains, Wyoming. Geomorphology 2008, 100, 549–562. [Google Scholar] [CrossRef]
- Foster, J.L.; Hall, D.K. Multisensor analysis of hydrologic features with emphasis of the Seasat SAR. Photogramm. Eng. Remote Sens. 1981, 47, 655–664. [Google Scholar]
- Thompson, D.R. Glacier Variability (1966–2006) in the Wind River Range, Wyoming, USA. Master’s Thesis, Department of Civil and Architectural Engineering, University of Wyoming, Laramie, WY, USA, November 2009. [Google Scholar]
- Lindgren, D.T. Land Use Planning and Remote Sensing; Springer-Verlag: Berlin, Germany, 1985. [Google Scholar]
- Jensen, J.R. Introductory Digital Image Processing; Prentice Hall: Upper Saddle River, NJ, USA, 1986. [Google Scholar]
- ESRI (Environmental Systems Research Institute). ArcMap 9.3 (Computer Software); ESRI: Redlands, CA, USA, 2008. [Google Scholar]
- Avery, T.E.; Berlin, G.L. Fundamentals of Remote Sensing and AirPhoto Interpretation, 5th ed.; Prentice Hall: Upper Saddle River, NJ, USA, 1992. [Google Scholar]
- DeBeer, C.M.; Sharp, M.J. Recent changes in glacier area and volume within the southern Canadian Cordillera. Ann. Glaciol. 2007, 46, 215–221. [Google Scholar] [CrossRef]
- Chen, J.; Ohmura, A. Estimation of Alpine Glacier Water Resources and Their Change since the 1870s. In Hydrology in Mountainous Regions I: Hydrological Measurements—The Water Cycle; Lang, H., Musy, A., Eds.; IAHS Press: Wallingford, UK, 1990; pp. 127–135. [Google Scholar]
- Driedger, C.L.; Kennard, P.M. Ice Volumes on Cascade Volcanoes: Mount Rainier, Mount Hood, Three Sisters, and Mount Shasta; USGS Professional Paper 1365; United States Geological Survey: Reston, VA, USA, 1986.
- Mote, P.W.; Hamlet, A.F.; Clark, M.P.; Lettenmaier, D.P. Declining mountain snowpack in western North America. Am. Meteorol. Soc. 2005, 86, 39–49. [Google Scholar] [CrossRef]
© 2014 by the authors; licensee MDPI, Basel, Switzerland. This article is an open access article distributed under the terms and conditions of the Creative Commons Attribution license (http://creativecommons.org/licenses/by/3.0/).
Share and Cite
Maloof, A.; Piburn, J.; Tootle, G.; Kerr, G. Recent Alpine Glacier Variability: Wind River Range, Wyoming, USA. Geosciences 2014, 4, 191-201. https://0-doi-org.brum.beds.ac.uk/10.3390/geosciences4030191
Maloof A, Piburn J, Tootle G, Kerr G. Recent Alpine Glacier Variability: Wind River Range, Wyoming, USA. Geosciences. 2014; 4(3):191-201. https://0-doi-org.brum.beds.ac.uk/10.3390/geosciences4030191
Chicago/Turabian StyleMaloof, Abigail, Jesse Piburn, Glenn Tootle, and Greg Kerr. 2014. "Recent Alpine Glacier Variability: Wind River Range, Wyoming, USA" Geosciences 4, no. 3: 191-201. https://0-doi-org.brum.beds.ac.uk/10.3390/geosciences4030191