Article

Thermal Activity Monitoring of an Active Volcano Using Landsat 8/OLI-TIRS Sensor Images: A Case Study at the Aso Volcanic Area in Southwest Japan

by
Md. Bodruddoza Mia
1,2,*,
Yasuhiro Fujimitsu
1 and
Jun Nishijima
1
1
Department of Earth Resources Engineering, Faculty of Engineering, Kyushu University, Fukuoka 819-0395, Japan
2
Department of Geology, Faculty of Earth and Environmental Sciences, University of Dhaka, Dhaka 1000, Bangladesh
*
Author to whom correspondence should be addressed.
Submission received: 25 September 2017 / Revised: 14 November 2017 / Accepted: 15 November 2017 / Published: 18 November 2017

Abstract

:
Thermal remote sensing is currently an emerging technique for monitoring active volcanoes around the world. The study area, the Aso volcano, is currently the most active and has erupted almost every year since 2012. For the first time, Landsat 8 TIRS thermal data were used in this study area to evaluate and monitor the recent thermal status of this volcano, situated in Southwest Japan, from 2013 to 2016 using four sets of images. The total heat discharged rate (HDR), radiative heat flux (RHF), land surface temperature (LST), and land cover (LC) were evaluated, and the relationship between them was determined, to understand the thermal status of the study area. We used the NDVI (normalized difference vegetation index) for land cover, the NDVI-threshold method for emissivity, the split-window algorithm for LST, and the Stefan–Boltzmann equation for radiative heat flux estimation in this study. The total heat discharge rate was computed using a relationship coefficient of RHF and HDR here. The highest HDR was obtained in 2013, at about 4715 MW, and was the lowest in 2016, at about 3819 MW. The total heat loss showed a declining trend, overall, from 2013 to 2016. The highest pixel RHF was in 2013 and the lowest was in 2014; after that, it increased gradually until 2016, coinciding with the LST of this study area. LC showed that, with decreasing heat loss, the vegetated coverage increased and bare land or mixed land decreased, and vice versa. From the spatial distribution of RHF, we saw that, within the Nakadake craters of the Aso volcano, Crater 1 was the most active part of this volcano throughout the study period, and Crater 3 was the most active after 2014. We inferred that the applied methods using the continuous Landsat 8 TIRS data showed an effective and efficient method of monitoring the thermal status of this active volcano.

1. Introduction

The Aso volcano, the study area, is an active thermal zone, situated in the central part of Kyushu Island, Southwest Japan, consisting of 10 cones of basaltic-andesitic ejecta (Figure 1). It is a large caldera of 25 × 18 km of Central Kyushu Island, one of the largest in the world [1]. The Aso volcano has erupted almost every year since 2012. Recently, on 16 April 2016, a strong earthquake, known as Kumamoto earthquake 2016, occurred near the Aso volcano, in the Kumamoto prefecture, with a magnitude of 7.0 on the Richter scale, at a depth of 10 km [2]. There was a minor eruption of the Aso volcano after the earthquake, although volcanologists believe that this eruption may not be related to the earthquake in this instance because the characteristics of the eruption were the same as the recent eruptions in this volcano [2]. Usually, for this volcano, the eruption processes involved are strombolian activity, phreatomagmatic explosion, and ash emission [3,4]. Nakadake craters are the most active zones of this volcano, which has a repetitive eruption history [4,5]. There are also three other thermal manifestations of this volcano, namely, the Yunotani, Yoshioka, and Jigoku-Tarutama hot springs, as west zone geothermal features [6]. The Nakadake crater erupted black ash during the first eruption period [4]. One recent study inferred a large-scale hydrothermal system beneath the center cone of the Aso volcano from which fluid and heat flow to the lake of the Nakadake crater [5]. Other recent studies have shown an increase in eruptive activity, including a decrease in the level of lake water, mud eruption, and red hot glows on the crater’s wall [7]. The Nakadake crater releases significant quantities of volatile gas, including ca. 200–400 tons of SO2 per day during the calm period [8]. There is a lake about 200 m in diameter in the Nakadake crater named Yudamari [6,9]. The temperature of the lake water is almost 60 °C in the calm period and is much higher (if the water even exists) in the active period. The observed heat discharge rate of this lake was consistently found to be about 220 MW in the calm period, except in 2007 when it increased to 280 MW as the water level rose [10]. The heat discharge rate in a new fumarole of the Yoshioka hot springs was estimated to be, since 2006, about 4.6 × 10⁶ W, which is much higher than that found in a previous study of thermal activity in these fumarolic areas [8]. As the volcano is presently the most active in Central Kyushu, the ground observation of the thermal status is difficult to measure and monitor; thus, remote measurement has been thought to be the most effective and efficient method for such tasks. The heat discharge rate (HDR) from this volcanic zone from 2002 to 2011 was studied for the first time recently using single thermal band images from Landsat TM/ETM+ in spite of image gaps after 2003, and an HDR value of ca. 350–600 MW was obtained [6]. Although some studies of thermal activity using ground or airborne imaging, video camera imaging, and thermal single band satellite imaging exist, no study based on multi-thermal band satellite images, such as Landsat 8 TIRS or ASTER sensor images had been done.
Satellite remote sensing is presently an essential part of volcanology in terms of monitoring thermal or eruption activity of the most active volcanoes. Thus, continuous thermal monitoring can be used to detect the thermal behavior of the active volcano so as to explore the geothermal system. In the early stage of volcano monitoring and resource exploration, ground measurement could be expensive and time-consuming, difficulties due to unstable ground in the national park around the active volcano region were faced. In this stage, satellite thermal infrared data can be used to estimate the land surface temperature (LST) anomaly and the radiative heat flux (RHF) of any volcano within several hours after image acquisition. It is well known that satellite images can only be used for the radiative portion of the heat flux, not the conductive and convective heat flux, but there should be a relationship between RHF and the total heat loss or (HDR) from any volcano. We utilized a relationship between RHF and HDR by the author’s recent works in this study [11]. RHF is the radiative portion of the surface heat loss that passed by the electromagnetic wave without any media, and HDR is the sum of radiative, conductive, and convective heat loss from any fumaroles of volcanoes [12]. There are presently a number of studies of successful volcano monitoring using satellite images for the surface temperature anomaly, and some of these have focused on heat loss [11,13,14,15,16,17]. Low-resolution satellite images, namely, MODIS, NOAA-AVHRR, MSG-SEVIRI images, taken during or after the eruption, are mostly used for thermal anomalies, ash detection, or eruption monitoring of active volcanoes [18,19,20,21]. Most notably, Landsat TM/ETM+ sensors have a long history of volcano or geothermal studies [6]. The major limitations of Landsat TM/ETM+ images are single thermal bands, image gaps in the ETM+ sensor after 2003, and the non-availability of Landsat TM images after 2009 of the study area. Recently, the Landsat 8 satellite was launched with two sensors, OLI and TIRS, in 2013. The TIRS sensor has two thermal bands with a 100 m resolution and supplies the thermal data with resampled 30 m imagery from the United States Geological Survey (USGS) archive. The TIRS Band 11 has some uncertainties due to stray-light problems, and the USGS tried to refine and implemented the Landsat product generation system in early 2017. Presently, high-quality images supplied as Landsat collection-1 data from the USGS archives have narrowed the uncertainty associated with stray light [22,23]. The OLI sensor has nine visible to infrared bands with a 30 m resolution. TIRS images are now used for land surface temperatures, but no study has used them for volcano thermal heat estimation and monitoring. To overcome the limitation of a single thermal band and the image gaps in previous Landsat sensors, the current initiative was to assess the thermal status of the recent abnormality of the Aso volcano using Landsat 8 TIRS images for the first time in this study area with the split-window algorithm for LST and the NDVI-threshold method of emissivity measurement.
The prime objective here was to monitor the recent abnormal thermal activity of the Aso volcano based on LST, RHF, and HDR using the images of the recently launched Landsat 8 OLI and TIRS sensors from 2013 to 2016. The secondary objective was to, in this region, evaluate the relationship between the recent thermal activity and the land cover. The first section of this paper includes information about the study area, previous studies, study materials, and the idea, motivation, and objectives of this study. The second section describes the geological settings of the study area. The third section presents the materials and methods. The fourth section explains the study results and offers a discussion of the results. Finally, we draw conclusions and explore study limitations in the final part.

2. Geological Setting of the Study Area

The Aso volcano is one of the largest calderas in the world and is situated in the central part of Kyushu Island in Southwest Japan [24] (Figure 1). The caldera consists of pyroclastic-flow deposits divided into four units, namely, in ascending order, Aso-1 (270 ka), Aso-2 (140 ka), Aso-3 (120 ka), and Aso-4 (90 ka) [25]. The pyroclastic flows deposited successfully into valleys between the Basement Mountains and formed pyroclastic-flow plateaus after filling these valleys up [5]. Numerous tephra fallout layers were produced after the eruption of four large pyroclastic-flow units. There are at least 17 visible cones on the surface of this volcano, which consists of both pyroclastics and lava [26]. The topography and internal structure of this caldera depends on the rock chemistry, ranging from basalt to rhyolite [27]. Nakadake is the only active crater in the Aso volcano that is composed of basaltic andesite and basalt [28]. Firstly, it became active at ca. 22–21 ka and formed an edifice known as the old edifice; later on, a young edifice of a pyroclastic cone was formed [27,29]. The young edifice was formed during the Holocene epoch and is the composite of seven craterlets that are aligned in the north–south direction [28]. The northernmost Nakadake crater has been the most active in the last 70 years, and the others were active before the 1933 eruption [28]. An important characteristic of the Nakadake crater eruption is the black sandy ash fallout from the plume, derived from the solid glassy top of a magma column. This type of eruption phenomenon is also known as an ash eruption [4].

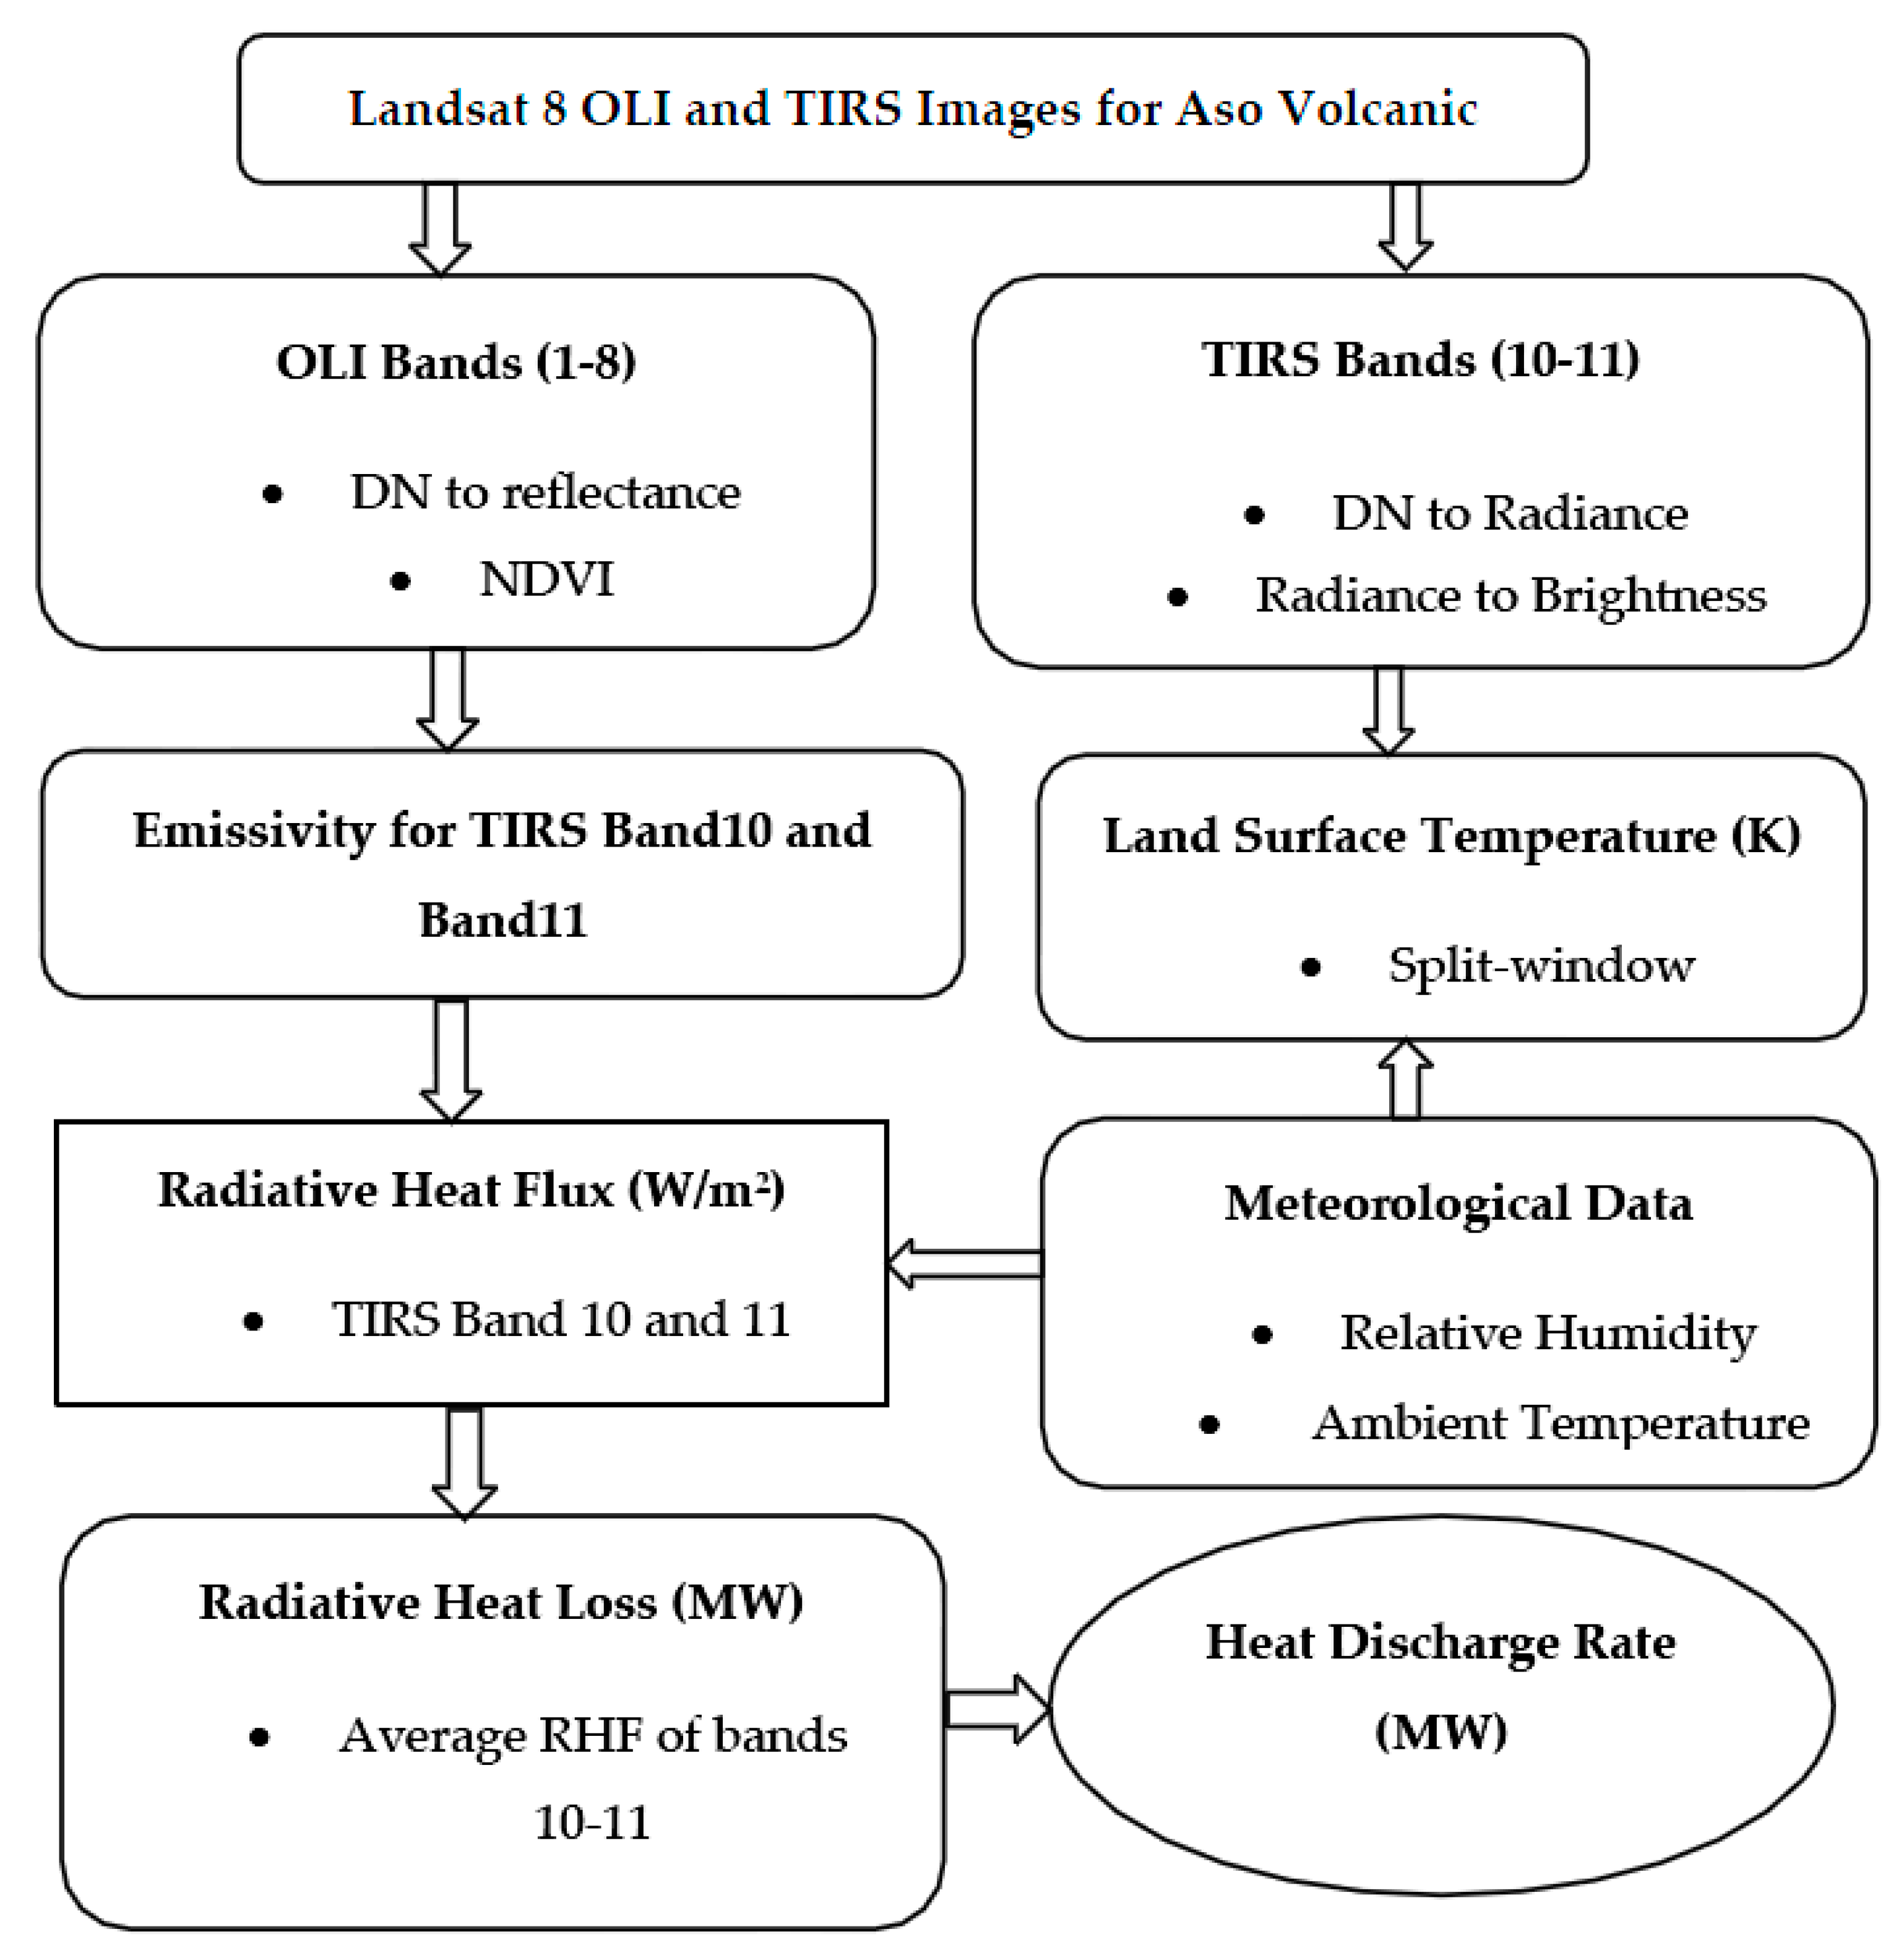
3. Materials and Methods

In this study, we used daytime Landsat 8 OLI and TIRS sensor images (path/row: 112/37) for the first time for geothermal heat loss estimation and monitoring of the most active region of the Aso volcanic area. Four sets of these images were collected from USGS archives in a Landsat L1T (terrain corrected) format, which was both radiometrically and geometrically corrected during the study period from 2013 to 2016. The Landsat 8 satellite was launched in 2013 and captures images of Earth’s surface every 16 days with two sensors, OLI and TIRS, according to the Landsat 8 Data User Handbook of the USGS published 29 March 2016 [30]. The sensor OLI has a total of nine bands—visible–near infrared, shortwave infrared, and cirrus bands have a 30 m spatial resolution, and the panchromatic band has a resolution of 15 m over a 190 km swath width. The TIRS sensor has two thermal bands (10.6–11.19 µm and 11.5–12.51 µm) with a spatial resolution of 100 m over a 190 km swath width. The images were acquired during Japan’s late spring on 23 May 2016, 21 May 2015, 02 May 2014, and 13 April 2013, respectively, at times varying between 10:46 to 10:49 (local time). All those images were cloud free and high quality, as the image quality rank is shown as 9 (out of 9), i.e., a perfect scene with no errors detected [30]. Here, we used the local meteorological station (AMEDAS ASO-SAN Station) data of ambient temperature and humidity. The AMEDAS ASO-SAN meteorological station is located very close to the craters of the Aso volcano (32°52.8’ N; 131°4.4’ E).
After acquiring the images, we conducted image processing according to the flowchart shown below (Figure 2). At first, the OLI bands were stacked, and a subset of our selected study area’s images was then created. Then, we converted the DN value of the OLI bands into TOA (top of atmosphere) reflectance, considering the solar elevation angle according to Equation (1), following the Landsat 8 Data User Handbook of the USGS [30].
ρλ = (Mρ × Qcal + Aρ)/sin(θ)
where ρλ = TOA planetary reflectance (unitless), Mρ = the reflectance multiplicative scaling factor for the band (from metadata), Aρ = the reflectance additive scaling factor for the band, Qcal = the L1 pixel value in DN, and θ = the solar elevation angle (from metadata).
Subsequently, we converted the reflectance value of red and near infrared into the NDVI, which was later used to estimate the emissivity of the study area [15,31]. There are many effective methods for estimating the emissivity of LST measurements [32,33,34]. Among them, the NDVI-threshold method was selected for estimating the emissivity of the study area because this method can be used to estimate the emissivity of various land surfaces in the EM range of 10–12 µm, coinciding with the thermal range of the TIRS sensors (10.5–12.5 µm) [22,33]. We constructed a model using ERDAS Imagine (Hexagon Geospatial, USA) 2014 for the emissivity estimation of TIRS Band 10 and Band 11 according to Equation (2) of [35].
ε i = { a i Q r e d + b i N D V I < 0.2 ε v , i P v + ε s , i ( 1 P v ) + C i 0.2 N D V I 0.5 ε v , i + C i N D V I > 0.5 }
where Pv = the vegetation fraction (NDVI − NDVImin/NDVImax − NDVImin)2, NDVImax = 0.5, NDVImin = 0.2, εv,i = the emissivity of vegetation (TIRS Band 10 = 0.9863 and Band 11 = 0.9896), εs,i = emissivity of soil (TIRS Band 10 = 0.9668 and Band 11 = 0.9747), Ci = surface roughness = (1 − εs,i) εv,i F’ (1 − Pv), and F’ = the geometric factor ranging between 0 and 1 (0.55 typical) [30]. In the case of bare soil (NDVI < 0.2 and Pv = 0), the emissivity of Bands 10 and 11 are ε10 = 0.973 − 0.047ρ4, and ε11 = 0.984 − 0.026ρ4, and ρi is the reflectance of the OLI bands [35].
The land surface temperature (LST) is the primary parameter for conducting heat loss assessment, and it was computed from the Landsat TIRS thermal bands using the split-window (sw) algorithm. At first, the pixel values of Band 10 and Band 11 were converted into radiance using the following physical transformation (Equation (3)):
Lλ = ML × Qcal + AL
where Lλ = the spectral radiance (W/(m2∙sr∙μm)), ML = the radiance multiplicative scaling factor for the band (taken from the metadata), AL = the radiance additive scaling factor for the band (taken from the metadata), and Qcal = the L1 pixel value in DN.
Secondly, the radiance values of thermal bands were transformed into brightness temperature using the following formula (Equation (4)), which is the effective temperature at the sensor with the assumption of unit emissivity following the Landsat 8 Data User Handbook of the USGS [30]:
Ti = K2/ln(K1/Lλ + 1)
where Ti = the brightness temperature of the TIRS bands, K1 and K2 = the thermal conversion coefficient of the bands obtained from the metadata, and Lλ = the radiance of the respective thermal bands.
In the third stage, by the method of the split-window algorithm for LST estimation using the approximation of the atmospheric radiances and linearization of Planck’s equation, the true land surface temperature was estimated, as the Landsat 8 TIRS sensor has two thermal bands, from Equations (5)–(15) [35,36]:
Ts = T10 + B1(T10 − T11) + B0
B1 = C10/C11A10 − C10A11
B0 = (C11(1 − A10 − C10) L10 − C10(1 − A11 − C11)L11)/(C11A10 − C10A11)
A10 = ε10 × τ10; A11 = ε11 × τ11
C10 = (1 − τ10) × (1 + (1 − ε10) × τ10)
C11 = (1 − τ11) × (1 + (1 − ε11) × τ11)
L10 = −55.58 + 0.4087T10
L11 = −59.85 + 0.4442T11
τ10 = −0.0164w2 − 0.014203w + 0.9715 (mid-latitude summer in case of w = 0.2–3.0 g/cm2
τ11 = −0.01218w2 − 0.07735w + 0.9603 (mid-latitude summer in case of w = 0.2–3.0 g/cm2)
w = (H × E × A/1000)/Rw(0)
where Ts = true LST in Kelvin, T10 = brightness temperature of Band 10, T11 = brightness temperature of Band 11, εi = emissivity of TIRS Band 10 and Band 11, τi = the atmospheric transmissivity for Bands 10 and 11 calculated using the equation of Yu et al. (2014) for mid-latitude summer profile after obtaining the water vapor content range, w = total water vapor content (g/cm2), H = air humidity (%), E = saturation mix ratio (g/Kg) of water vapor, and A = air density (g/m3); Rw (0) = 0.6834 and 0.6356 for mid-latitude summer and winter. Li = the linear fitting parameter, used from a study where the temperature ranged from −10 to 20 °C and from 20 to 50 °C for Landsat 8 TIRS Bands 10 and 11 [35].
Then, the radiative heat flux (RHF) was calculated using the Stefan–Boltzmann law by Equation (16) for the TIRS thermal Bands 10 and 11 [6,15,37]. Finally, we computed the average pixel wise RHF values of the study area from the calculated RHF using TIRS Bands 10 and 11:
Qr = σ × ε × (Ts4 − Ta4)
where Qr = radiative heat flux (W/m2), σ = Stefan–Boltzmann constant, ε = emissivity, Ts = land surface temperature (LST) (K), and Ta = ambient temperature (K). The ambient temperature from the AMEDAS meteorological Aso San station's hourly data was used here.
There are three methods of heat loss from any volcano: convection, conduction, and radiation. It is possible to compute only radiative heat loss from volcanoes using remote measurement or satellite thermal infrared data. Recent studies have shown that there is a relationship between total heat discharge rate and radiative heat flux from several active thermal grounds in Japan and New Zealand, derived using ground and remote sensing techniques [11,13]. Hence, total heat discharge of the study area was computed accordingly after multiplying the total average radiative heat loss with the relationship coefficient of RHF and total heat loss (i.e., 6.46).

4. Results and Discussion

The Landsat 8 TIRS sensor was used for the first time for estimating heat losses from the Aso volcanic area to evaluate the recent thermal activity from 2013 to 2016 using four sets of images. In the first stage, the OLI sensor images of Landsat 8 were used for computing the vegetation index (NDVI) values of this region, which was used later to map land cover. The NDVI value is divided into four categories for different land cover types: fully healthy vegetated (NDVI > 0.5), mixed land (NDVI = 0.2–0.5), bare land (NDVI = 0–0.2), and water or wetland (NDVI < 0). The NDVI value was also used for emissivity estimation of this study area using the NDVI-threshold method (Figure 3). NDVI results showed that the vegetated area increased from zero to about 9.37 sq. km of the study area from 2013 to 2016, as bare land was reduced by about half, to 21.49 sq. km, from 2013 to 2016 (Table 1; Figure 4). On the other hand, for certain land cover types, namely, water and mixed land, the area was the lowest in 2015. Emissivity was estimated for the two thermal bands of TIRS sensors separately using the NDVI-threshold method. The results showed that the values range from 0.92 to 0.99. A higher value indicates water or bare ground, and the vegetated region shows a low value of emissivity in this region. The atmospheric transmissivity values were calculated for the Landsat TIR Band 10 and Band 11 using ambient temperature and relative humidity percentage of the Aso volcanic area during the time of image acquisition. The atmospheric transmissivity value ranges ca. 89–95% for Band 10 and 84–92% for Band 11 during the study period (Table 1).
Land surface temperature was estimated using the split-window algorithm from TIRS two-band images of the study area. The highest pixel temperature of ca. 54.1 °C was obtained in 2013. This highest temperature was reduced by about one-third the following year, but increased again consecutively every year until 2016, up to ca. 52.2 °C (Table 1; Figure 5). The lowest pixel temperature, ca. 8.7 °C, was found in 2013, and it steadily increased up to 20.83 °C in 2016, as the ambient temperature of this region was highest in 2016, at ca. 18.5 °C, and lowest in 2013, at ca. 7 °C.
Radiative heat flux (RHF) was computed using the Stefan–Boltzmann equation of heat transfer considering the calculated emissivity, atmospheric transmissivity, and ambient temperature taken from the nearest AMEDAS meteorological station (ASO San). RHF was estimated separately for the TIRS Band 10 and Band 11. Later on, the pixel-based average RHF value was computed using the estimated RHF value for Band 10 and Band 11 of the study area. The highest maximum pixel RHF, ca. 289.92 W/m2, was obtained in 2013, and the lowest maximum RHF, ca. 141.25 W/m2, was found in the following year, 2014, but this increased gradually to 177.92 W/m2 and 221.58 W/m2, respectively, in 2015 and 2016 (Table 1; Figure 6). The total radiative heat loss (RHL) was computed after the summation of the RHF positive values of the study area from 2013 to 2016. The highest RHL, ca. 726.49 MW, was obtained in 2013, and the lowest value, ca. 588.43 MW, was obtained in 2016; i.e., there was an overall declining trend from 2013 to 2016 in the Aso volcano area in Japan (Table 1; Figure 7). The total heat discharge rate (HDR) was computed after multiplying the total RHL using a relationship coefficient (i.e., 6.49) between RHL and HDR based on previous studies [11,13]. Thus, we obtained the highest total HDR, ca. 4714 MW, in 2013 and the lowest total HDR, ca. 3819 MW, in 2016 (Table 1).
The following can be summarized:
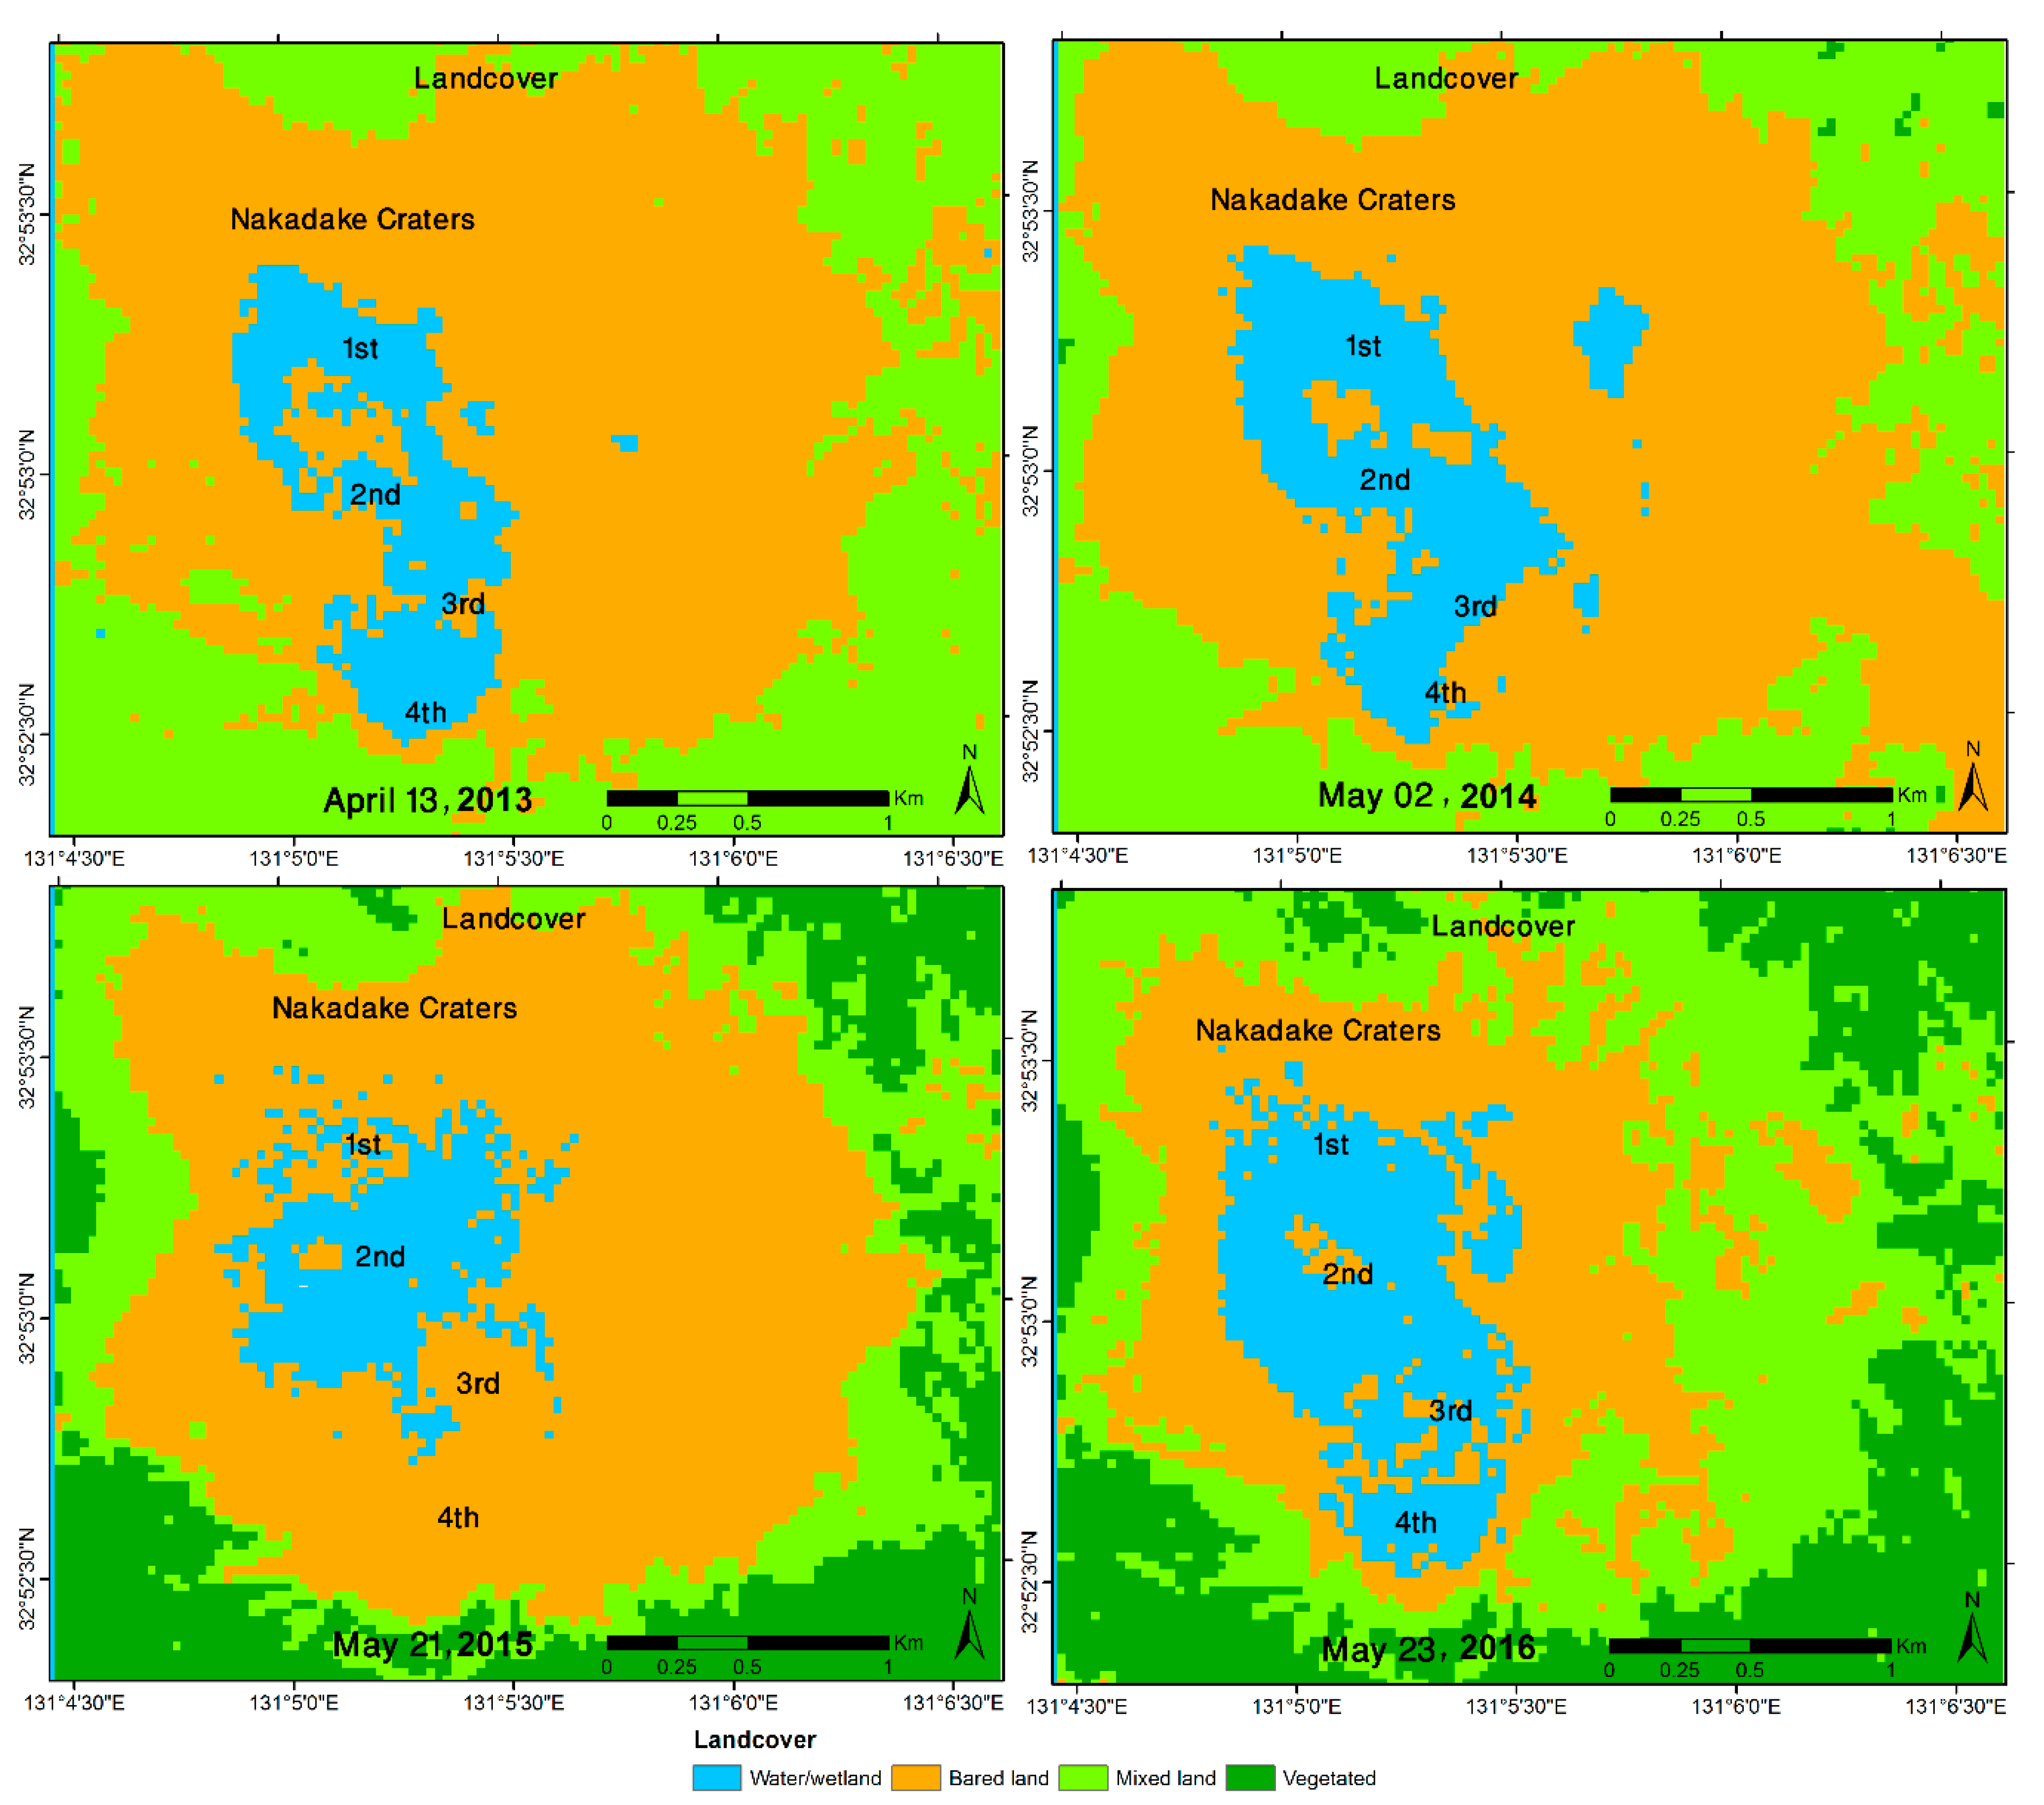
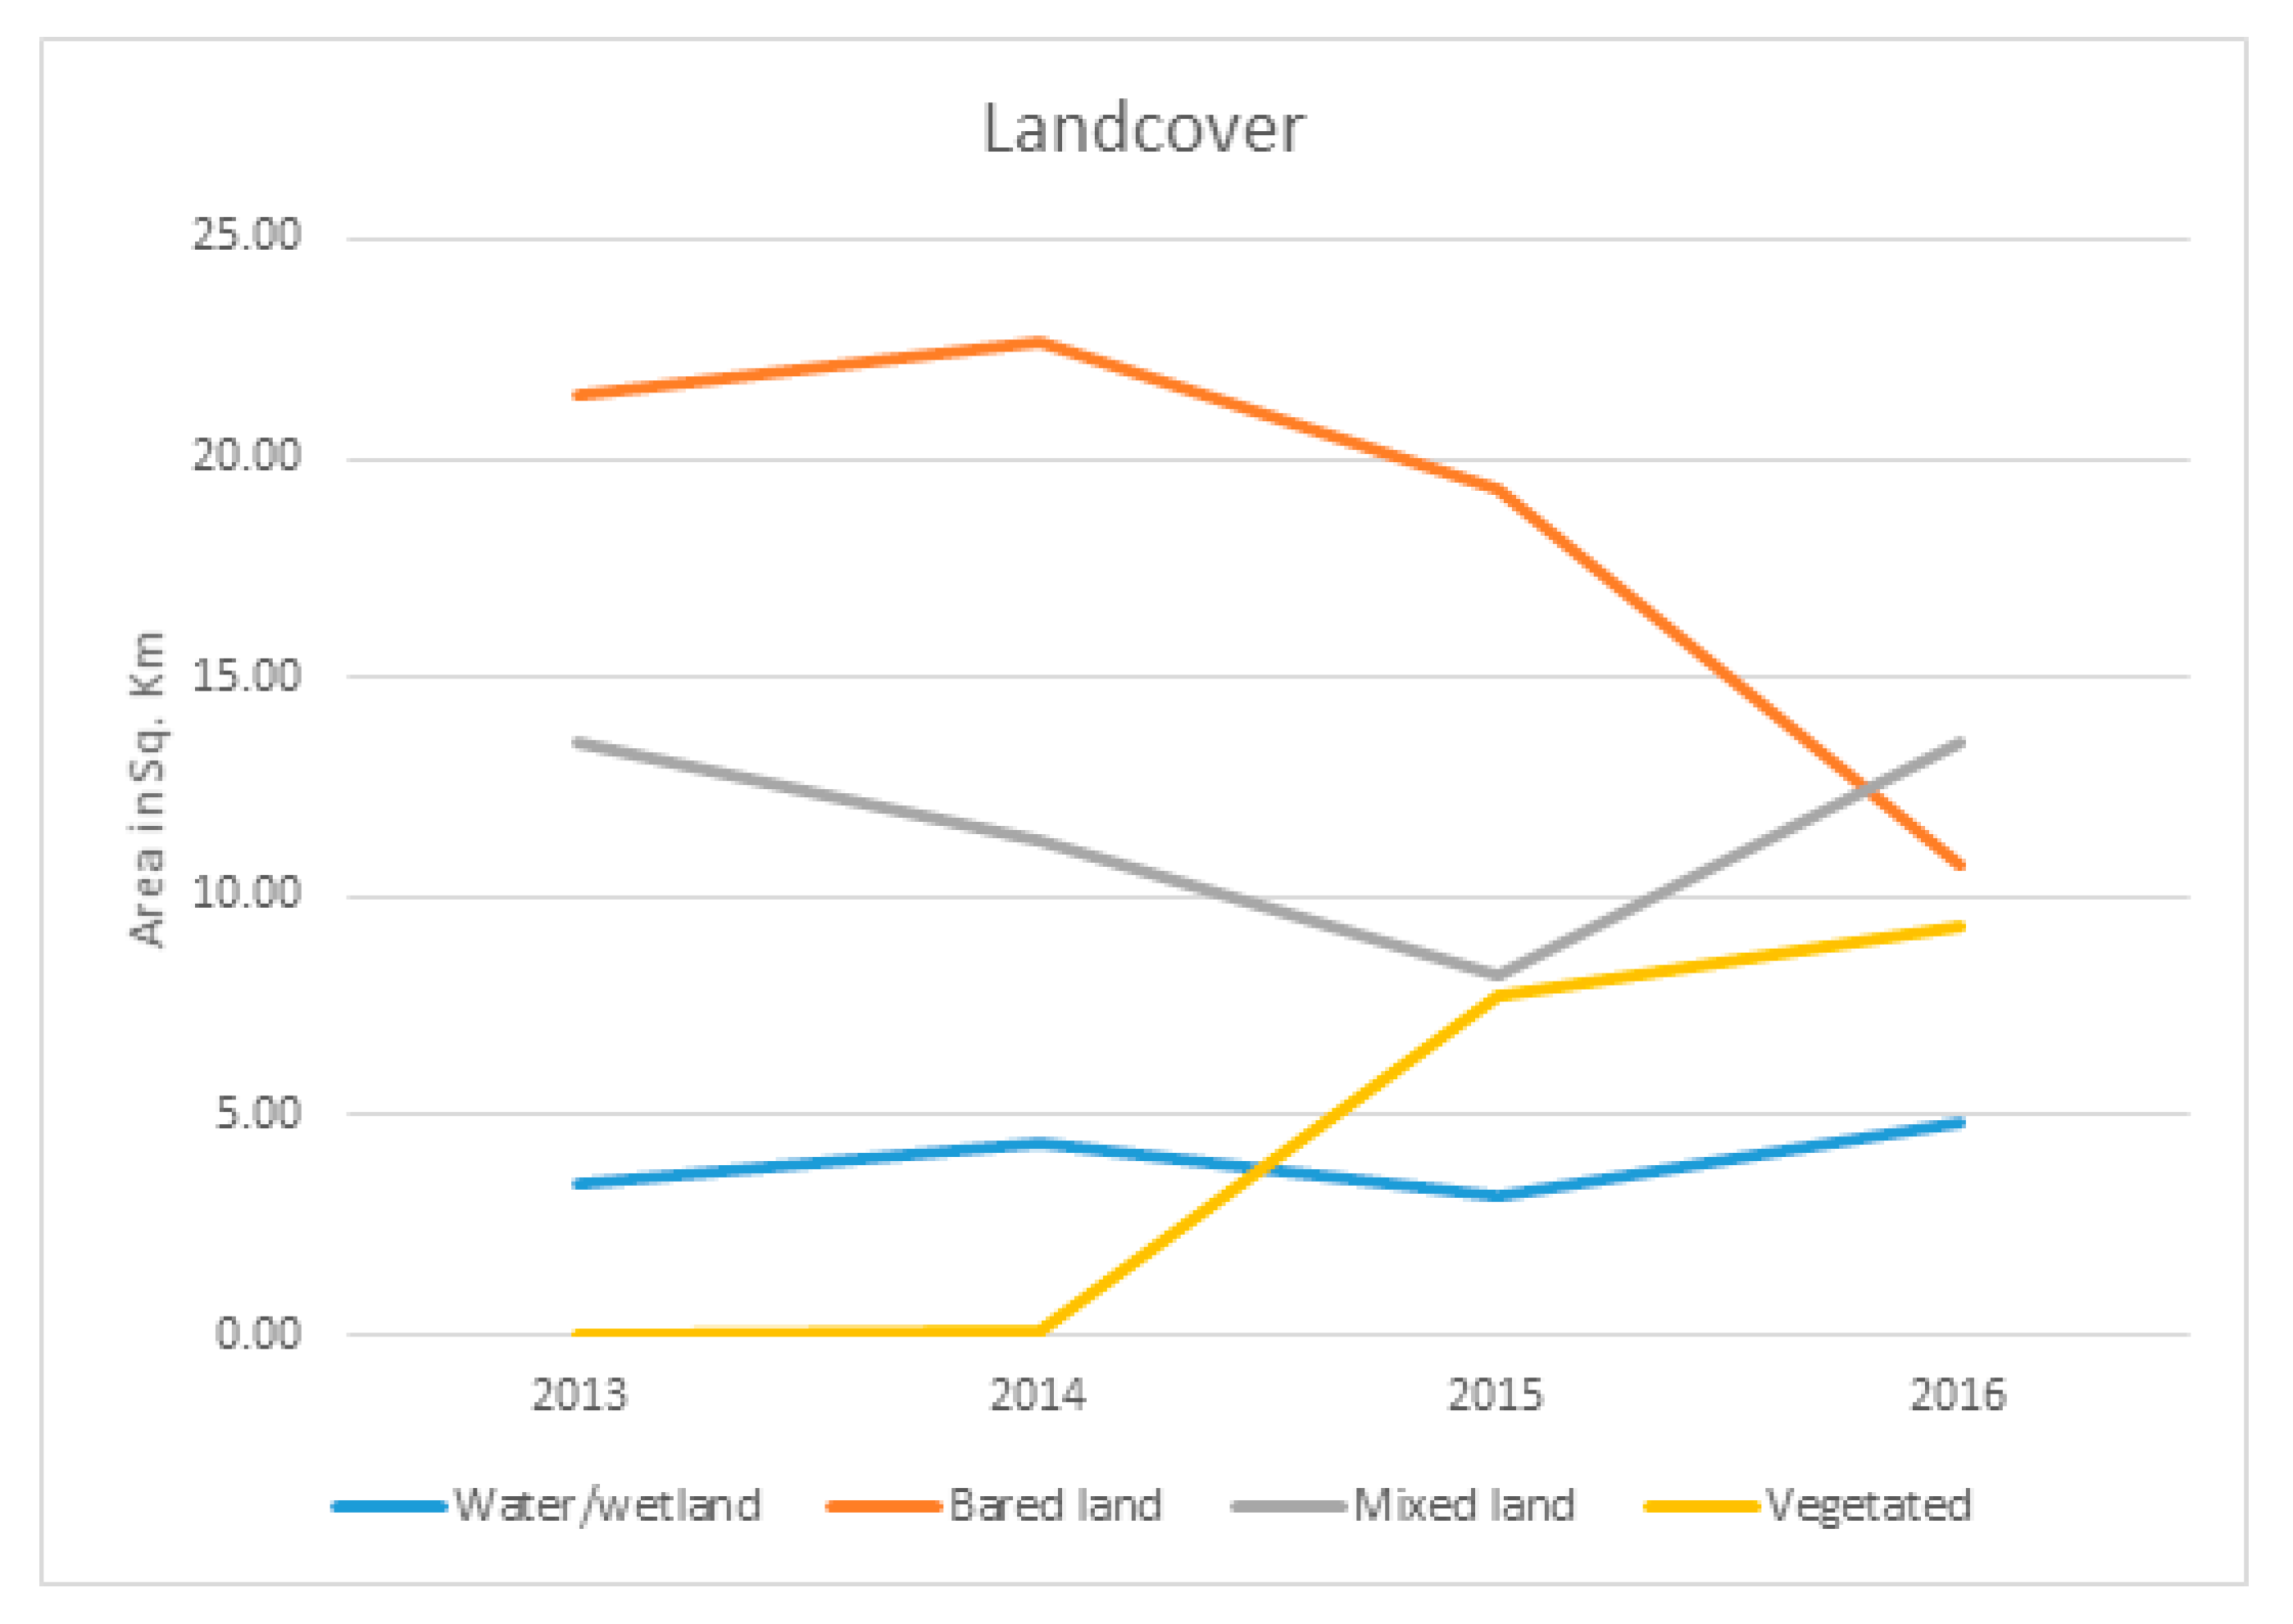
  • As the thermal anomaly was mapped as higher in 2013, with respect to both LST and RHF, there was no healthy vegetation or vegetated coverage of any pixel area in this region, nor was there any vegetation in the stress stage showing as a mixed land area. An NDVI value above 0.5 indicates a healthy vegetated area. Another reason there was no vegetation coverage in 2013 might be the spatial resolution (30 m) of the image used in this study. There might have been some healthy vegetation in 2013, but the area would have been lower than the spatial resolution of the images, so the pixel would have appeared as a mixed area pixel. With the decline of LST surrounding the crater, greater vegetated coverage area was found after 2013. The area of bare land as well as the LST had declined from 2014 to 2016 in some parts around the Nakadake crater. After 2015, the bare land area declined and the mixed area increased, indicating the lower LST surrounding the crater.
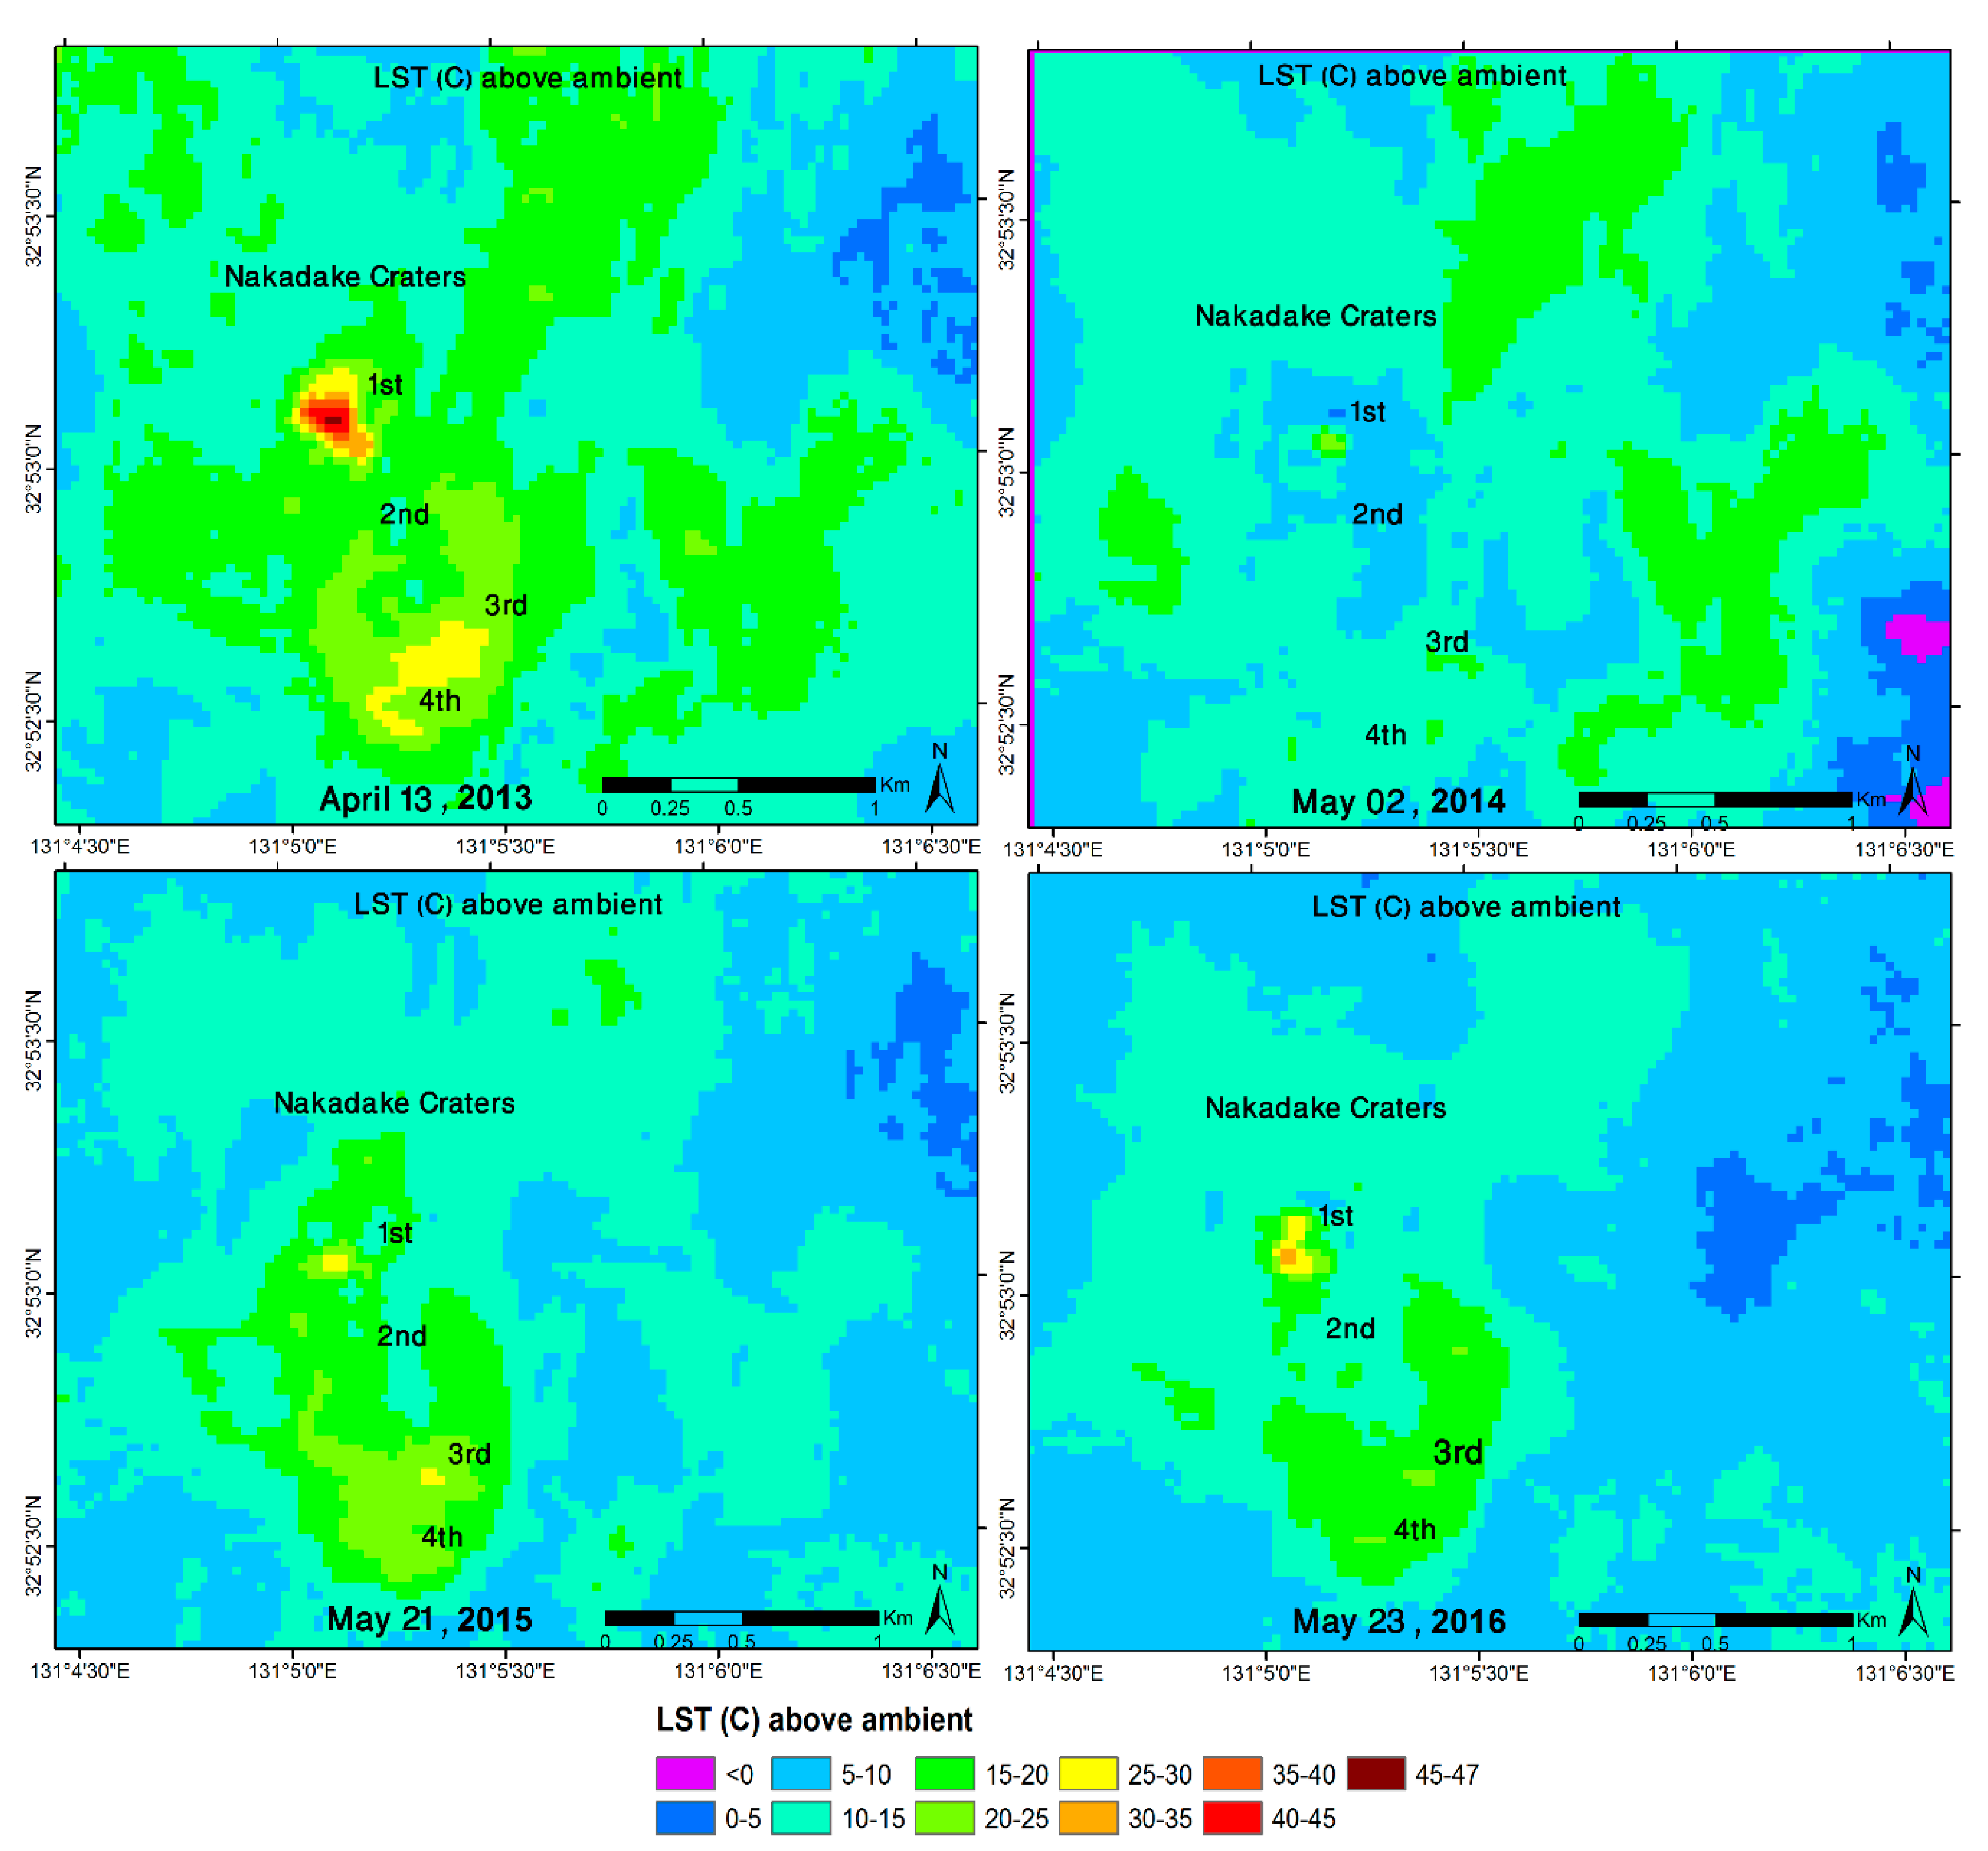
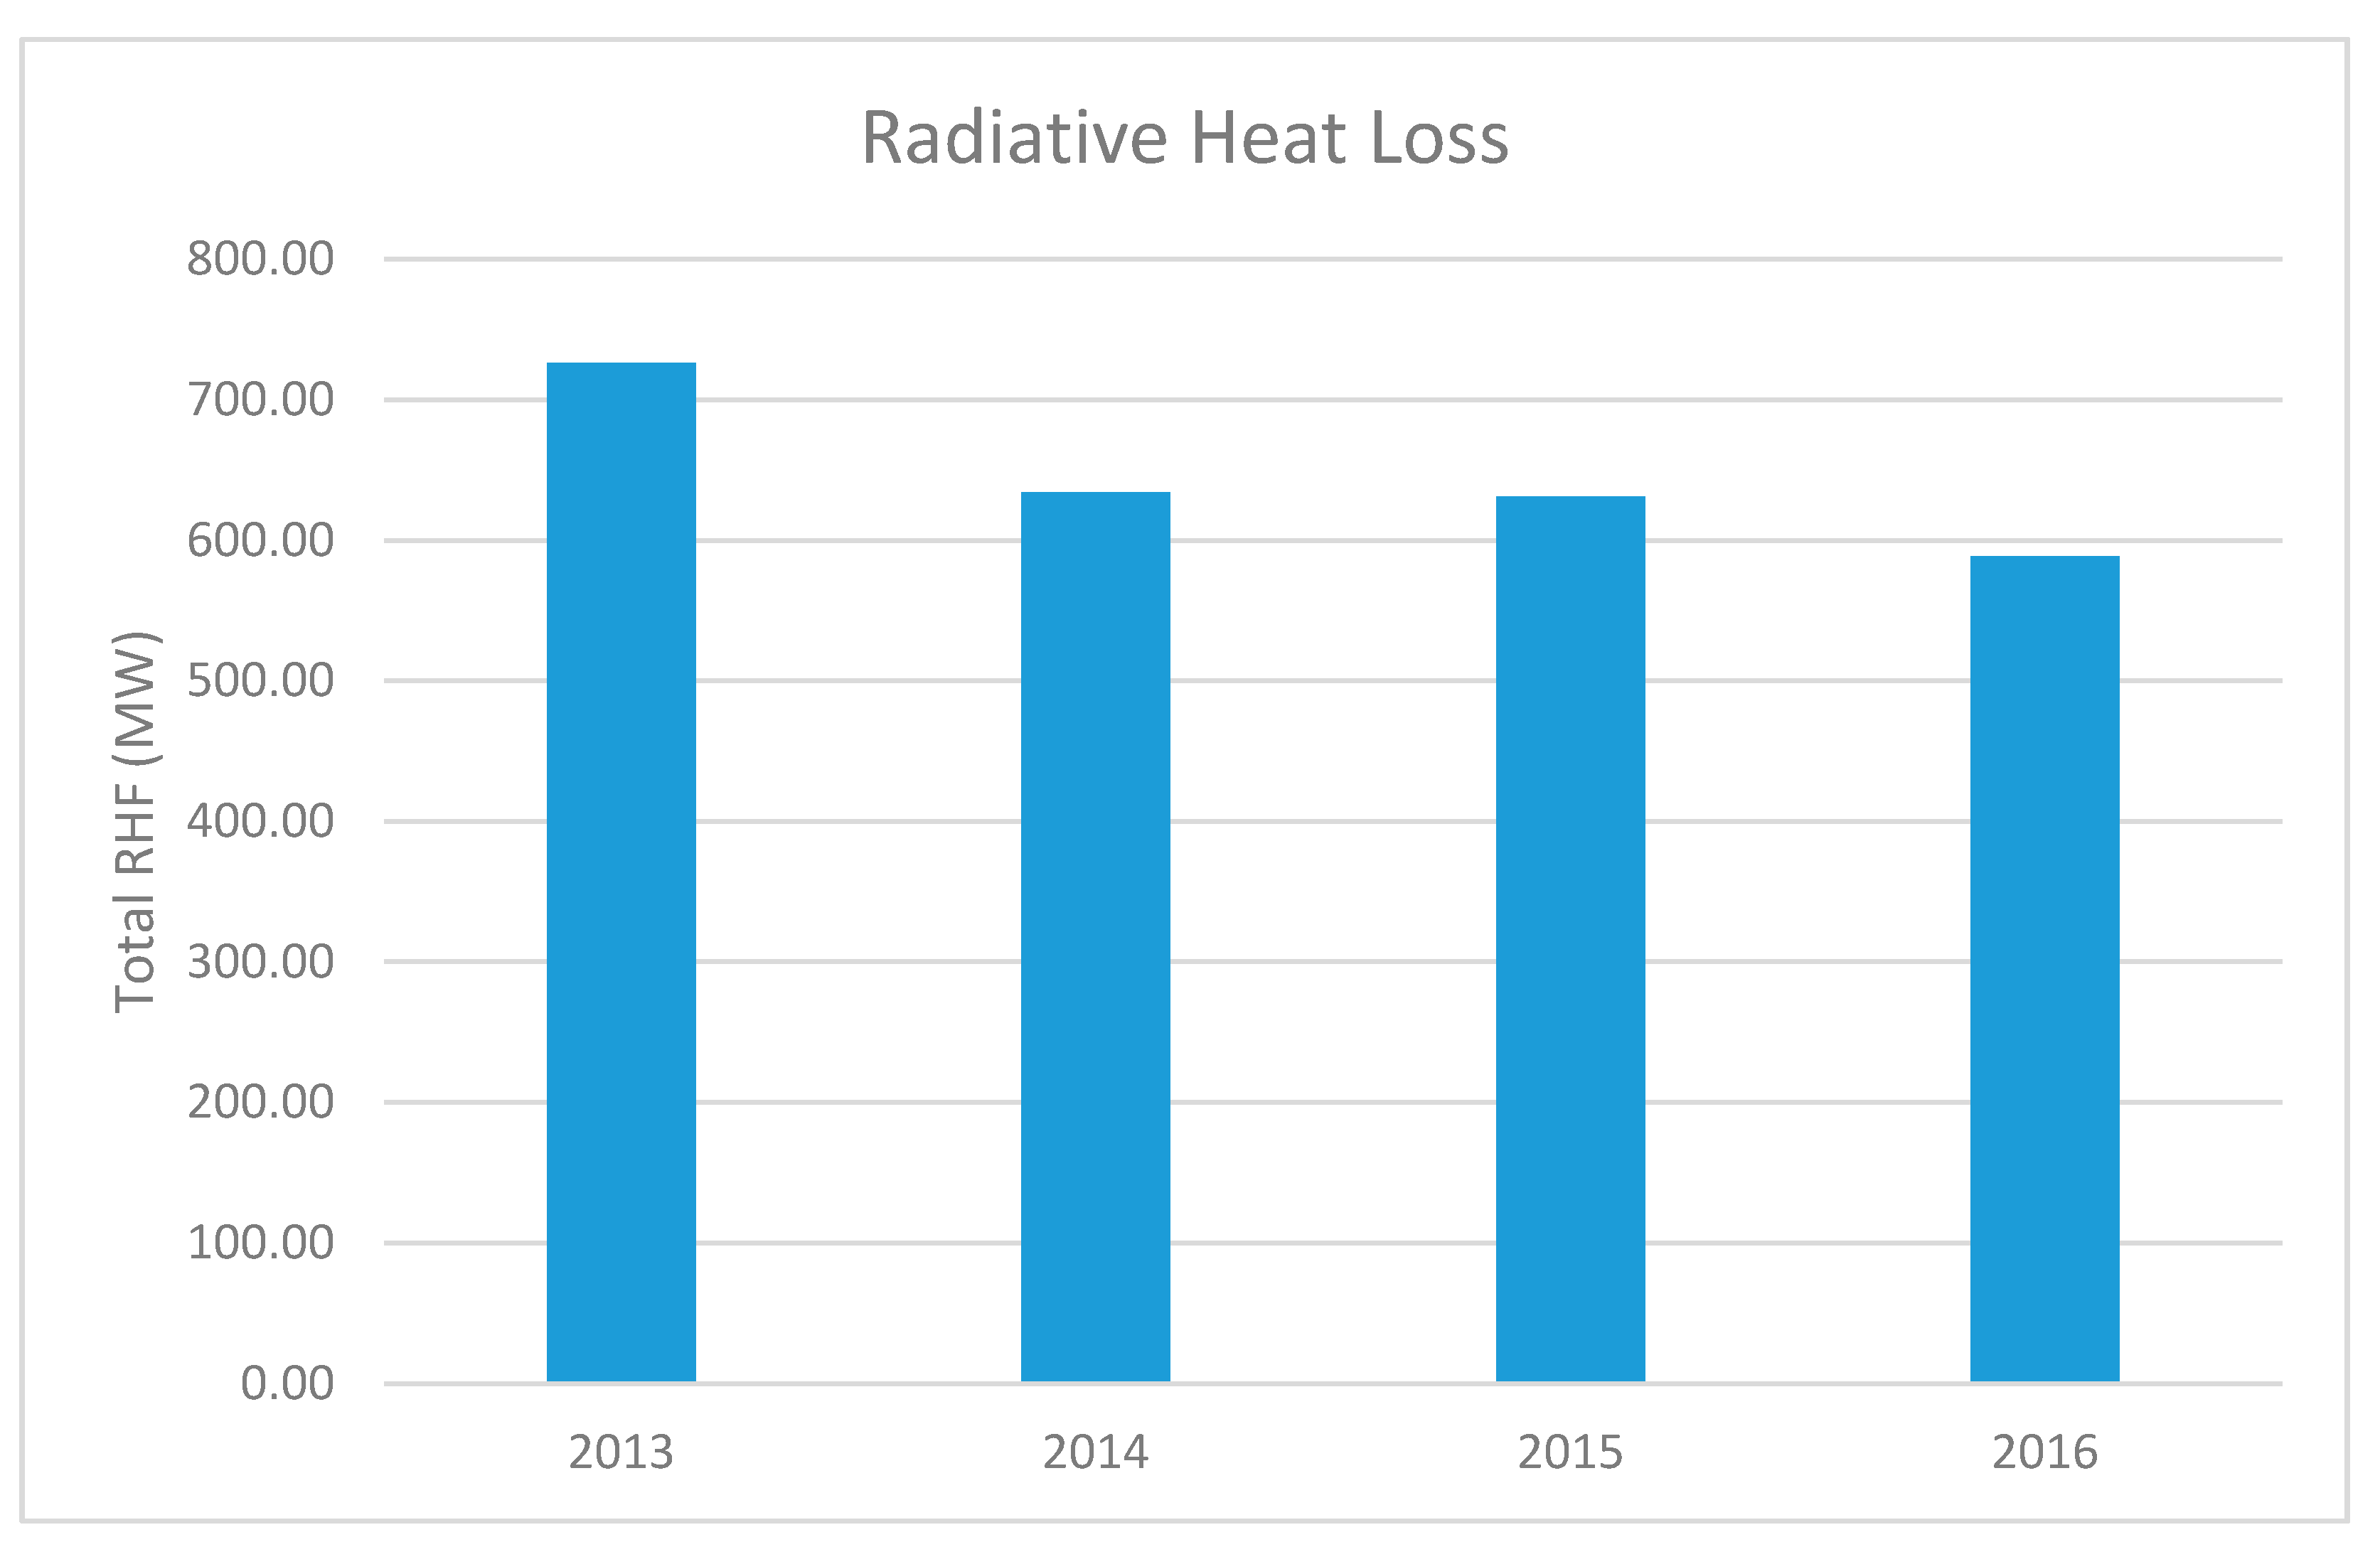
  • The radiative heat loss was highest in 2013 and lowest in 2016 due to the continuing thermal activity and eruption processes in this region. Between April 2013 and May 2014, the eruption that occurred in the Aso volcanic area was the reason why the radiative heat loss declined. After 2014, the Aso volcano again showed an increasing trend in radiative heat flow, resulting in eruption activity in 2015 and on 7 October 2016.
  • Regarding the four distinct craters at the Aso volcano, Crater 1 was the most active throughout the study period, while Craters 3 and 4 showed higher heat loss in 2013. We found an active zone only in Crater 1 in 2014. Craters 1 and 3 showed higher activity in 2015 (Figure 6).
  • Total HDR was higher in the study period than that of the previous study of this volcano using Landsat 7 ETM+ thermal data [6]. The Kumamoto earthquake occurred on 16 April 2016 near the study area. This may be one of the reasons why the lowest HDR level was obtained in 2016 during our study period.
  • The study used the split-window algorithm for LST in the Aso volcano, and this algorithm was shown to be efficient and effective, considering the availability of continuum data of Landsat 8 OLI and TIRS data for monitoring the RHL and the HDR.
  • One of the major limitations of this research is the ground validation due to the inaccessibility of the recent thermal abnormal activity in the Aso volcano from 2013, but this work is the continuation of our monitoring for thermal activity in this volcano using satellite images.

5. Conclusions

From this study, we found a higher thermal activity throughout the study period, with a total radiative heat loss above 500 MW, a higher loss of about 726 MW in 2013, and finally a decline to 588 MW in 2016. The total heat discharge rate showed the highest value of about 4714 MW in 2013 and the lowest value of about 3819 MW in 2016. This result indicates higher thermal activity than the previous study in this volcanic area. Total RHL obtained its highest value in 2013 of about 726 MW and its lowest values of about 588 MW in 2016. The highest pixel RHF was obtained at about 290 W/m2 in 2013 and the lower highest RHF values were about 141 W/m2 in 2014. After 2014, the pixel RHF increased gradually to 178 W/m2 and 222 W/m2, respectively, in 2015 and 2016. The relationship between RHF and LC showed that the more vegetated region, compared to bare and mixed land, had a lower LST and RHF. The Landsat 8 TIRS images, with the split-window algorithm of the LST and NDVI-threshold methods of emissivity, allow for efficient data extraction for the estimation and monitoring of heat loss from the Aso volcanic area. From this study, we can infer that continuous study with the available Landsat 8 sensor images is an efficient and effective technique for exploring and monitoring the active volcano, as well as assessing the geothermal resources in earlier stages.

Acknowledgments

We acknowledge the Grant-in-Aid for JSPS fellow’s research fund (KAKENHI) supporting this research (Grant No. JP16F16081). The first author is an overseas researcher under a Postdoctoral Fellowship of the Japan Society for the Promotion of Science (P16081). The authors gratefully thank the editor and reviewers for upgrading the manuscript. We also acknowledge the USGS archives authority for supporting the satellite imagery for this research free of cost. Special thanks go to the authority of the Japan Meteorological Agency for providing the necessary weather data for this research.

Author Contributions

This research was carried out with the collaboration of all authors. The author, Md. Bodruddoza Mia, was involved in conceptualizing the problem, data gathering, satellite imagery analysis, and writing the manuscript. Yasuhiro Fujimitsu and Jun Nishijima were mostly involved with addressing the issue, helping with the data collection, fund collection, writing, and checking the language of the manuscript.

Conflicts of Interest

The authors declare no conflict of interest.

References

  1. Abe, Y.; Ohkura, T.; Shibutani, T.; Hirahara, K.; Kato, M. Crustal structure beneath Aso Caldera, southwest Japan, as derived from receiver function analysis. J. Volcanol. Geotherm. Res. 2010, 195, 1–12. [Google Scholar] [CrossRef]
  2. Otake, T.; Aoki, M.; Yoshida, R. Questions and Answers: The Kumamoto Earthquakes. Available online: https://www.japantimes.co.jp/news/2016/04/18/national/questions-and-answers-the-kumamoto-earthquakes/#.Wg5SuVIYOGs (accessed on 25 September 2017).
  3. Miyabuchi, Y.; Terada, A. Subaqueous geothermal activity revealed by lacustrine sediments of the acidic Nakadake crater lake, Aso Volcano, Japan. J. Volcanol. Geotherm. Res. 2009, 187, 140–145. [Google Scholar] [CrossRef]
  4. Ono, K.; Watanabe, K.; Hoshizumi, H.; Ikebe, S. Ash eruption of the Naka-dake crater, Aso volcano, southwestern Japan. J. Volcanol. Geotherm. Res. 1995, 66, 137–148. [Google Scholar] [CrossRef]
  5. Miyabuchi, Y. A 90,000-year tephrostratigraphic framework of Aso Volcano, Japan. Sedim. Geol. 2009, 220, 169–189. [Google Scholar] [CrossRef]
  6. Mia, M.B.; Nishijima, J.; Fujimitsu, Y. Exploration and monitoring geothermal activity using Landsat ETM + images—A case study at Aso volcanic area in Japan. J. Volcanol. Geotherm. Res. 2014, 275, 14–21. [Google Scholar] [CrossRef]
  7. Kanda, W.; Tanaka, Y.; Utsugi, M.; Takakura, S.; Hashimoto, T.; Inoue, H. A preparation zone for volcanic explosions beneath Naka-dake crater, Aso volcano, as inferred from magnetotelluric surveys. J. Volcanol. Geotherm. Res. 2008, 178, 32–45. [Google Scholar] [CrossRef]
  8. Terada, A.; Sudo, Y. Thermal activity within the western-slope geothermal zone of Aso volcano, Japan: Development of a new thermal area. Geothermics 2012, 42, 56–64. [Google Scholar] [CrossRef]
  9. Hase, H.; Hashimoto, T.; Sakanaka, S.; Kanda, W.; Tanaka, Y. Hydrothermal system beneath Aso volcano as inferred from self-potential mapping and resistivity structure. J. Volcanol. Geotherm. Res. 2005, 143, 259–277. [Google Scholar] [CrossRef]
  10. Terada, A.; Hashimoto, T.; Kagiyama, K.; Sasaki, H. Precise remote-monitoring technique of water volume and temperature of a crater lake in Aso volcano, Japan: Implication for a sensitive window of volcanic hydrothermal system. Earth Planets Space 2008, 60, 705–710. [Google Scholar] [CrossRef]
  11. Mia, M.B.; Bromley, C.J.; Fujimitsu, Y. Monitoring heat losses using Landsat ETM + thermal infrared data: A case study in Unzen geothermal field, Kyushu, Japan. Pure Appl. Geophys. 2013, 170, 2263–2271. [Google Scholar] [CrossRef]
  12. Mia, M.B.; Fujimitsu, Y. Monitoring heat losses using Landsat ETM+ thermal infrared data—A case study at Kuju Fumarolic area in Japan. Acta Geophys. 2013, 61, 1262–1278. [Google Scholar] [CrossRef]
  13. Harris, A.J.L.; Lodato, L.; Dehn, J.; Spampinato, L. Thermal characterization of the Vulcano field. Bull. Volcanol. 2009, 71, 441–458. [Google Scholar] [CrossRef]
  14. Li, Y.; Shi, T.; Yang, Y.; Wu, B.; Wang, L.; Shi, C.; Guo, J.; Ji, C.; Wen, H. Satellite-Based Investigation and Evaluation of the Observational Environment of Meteorological Stations in Anhui Province, China. Pure Appl. Geophys. 2015, 172, 1735–1749. [Google Scholar] [CrossRef]
  15. Mia, M.B.; Bromley, C.J.; Fujimitsu, Y. Monitoring heat flux using Landsat TM/ETM + thermal infrared data—A case study at Karapiti (‘Crater of the Moon’) thermal area, New Zealand. J. Volcanol. Geotherm. Res. 2012, 235, 1–10. [Google Scholar] [CrossRef]
  16. Savage, S.L.; Lawrence, R.L.; Custer, S.G.; Jewett, J.T.; Powell, S.L.; Shaw, J.A. Review of Alternative Methods for Estimating Terrestrial Emittance and Geothermal Heat Flux for Yellowstone National Park Using Landsat Imagery. Gisci. Remote Sens. 2013, 47, 460–479. [Google Scholar] [CrossRef]
  17. Walawender, J.P.; Szymanowski, M.; Hajto, M.J.; Bokwa, A. Land Surface Temperature Patterns in the Urban Agglomeration of Krakow (Poland) Derived from Landsat-7/ETM+ Data. Pure Appl. Geophys. 2014, 171, 913–940. [Google Scholar] [CrossRef]
  18. Blackett, M. An initial comparison of the thermal anomaly detection products of MODIS and VIIRS in their observation of Indonesian volcanic activity. Remote Sens. Environ. 2015, 171, 75–82. [Google Scholar] [CrossRef]
  19. Andronico, D.; Spinetti, C.; Cristaldi, A.; Buongiorno, M.F. Observations of Mt. Etna volcanic ash plumes in 2006: An integrated approach from ground-based and polar satellite NOAA–AVHRR monitoring system. Remote Sens. Environ. 2009, 180, 135–147. [Google Scholar] [CrossRef]
  20. Pergola, N.; D’Angelo, G.; Lisi, M.; Marchese, F.; Mazzeo, G.; Tramutoli, V. Time domain analysis of robust satellite techniques (RST) for near real-time monitoring of active volcanoes and thermal precursor identification. Phys. Chem. Earth 2009, 34, 380–385. [Google Scholar] [CrossRef]
  21. Marchese, F.; Filizzola, C.; Genzano, N.; Mazzeo, G.; Pergola, N.; Tramutoli, V. Assessment and improvement of a robust satellite technique (RST) for thermal monitoring of volcanoes. Remote Sens. Environ. 2011, 115, 1556–1563. [Google Scholar] [CrossRef]
  22. Wang, F.; Qin, Z.; Song, C.; Tu, L.; Karnieli, A.; Zhao, S. An Improved Mono-Window Algorithm for Land Surface Temperature Retrieval from Landsat 8 Thermal Infrared Sensor Data. Remote Sens. 2015, 7, 4268–4289. [Google Scholar] [CrossRef]
  23. Gerace, A.; Montanaro, M. Derivation and validation of the stray light correction algorithm for the thermal infrared sensor onboard Landsat 8. Remote Sens. Environ. 2017, 191, 246–257. [Google Scholar] [CrossRef]
  24. Miyabuchi, Y. Post-caldera explosive activity inferred from improved 67–30 ka tephrostratigraphy at Aso Volcano, Japan. J. Volcanol. Geotherm. Res. 2011, 205, 94–113. [Google Scholar] [CrossRef]
  25. Ono, K.; Matsumoto, Y.; Miyahisa, M.; Teraoka, Y.; Kambe, N. Geology of the Taketa District. With Geological Sheet Map at 1:50,000; Geological Survey of Japan: Tokyo, Japan, 1977; 145p, (In Japanese with English abstract). [Google Scholar]
  26. Hoshizumi, H.; Watanabe, K.; Sakaguchi, K.; Uto, K.; Ono, K.; Nakamura, T. The Aso-4 Pyroclastic Flow Deposit Confirmed from the Deep Drill Holes inside the Aso Caldera; Volcanological Society of Japan: Tokyo, Japan, 1997; Volume 2, p. 5. (In Japanese) [Google Scholar]
  27. Ono, K.; Watanabe, K. Geological Map of Aso Volcano (1:50,000). Geological Map of Volcanoes; Geological Survey of Japan: Tokyo, Japan, 1985; Volume 4, (In Japanese with English abstract). [Google Scholar]
  28. Miyabuchi, Y.; Ikebe, S.; Watanabe, K. Geological constraints on the 2003–2005 ash emissions from the Nakadake crater lake, Aso Volcano, Japan. J. Volcanol. Geotherm. Res. 2008, 178, 169–183. [Google Scholar] [CrossRef]
  29. Miyabuchi, Y.; Masuda, N.; Watanabe, K. Geologic history of the western part of post-caldera central cones of Aso Volcano, southwestern Japan, based on stratigraphic relationships between lava flows and airfall tephra layers. Bull. Volcanol. Soc. Jpn. 2004, 49, 267–282. [Google Scholar]
  30. LSDS-1574, Version 2; Landsat 8 Data User Handbook; Department of the Interior U.S. Geological Survey: Reston, VA, USA, 2016; pp. 1–98.
  31. Alfieri, J.G.; Niyogi, D.; Lemone, M.A.; Chen, F.; Fall, S. A Simple Reclassification Method for Correcting Uncertainty in Land Use/Land Cover Data Sets Used with Land Surface Models. Pure Appl. Geophys. 2007, 164, 1789–1809. [Google Scholar] [CrossRef]
  32. Wan, Z.; Li, Z.L. A physics-based algorithm for retrieving land-surface emissivity and temperature from EOS/MODIS data. IEEE Trans. Geosci. Remote Sens. 1997, 35, 980–996. [Google Scholar]
  33. Sobrino, J.A.; Jiménez-Muñoz, J.C.; Sòria, G.; Romaguera, M.; Guanter, L.; Moreno, J.; Plaza, A.; Martínez, P. Land Surface Emissivity Retrieval from Different VNIR and TIR Sensors. IEEE Trans. Geosci. Remote Sens. 2008, 46, 316–327. [Google Scholar] [CrossRef]
  34. Barducci, A.; Pippi, I. Temperature and emissivity retrieval from remotely sensed images using the grey body emissivity method. IEEE Trans. Geosci. Remote Sens. 1996, 34, 681–695. [Google Scholar] [CrossRef]
  35. Yu, X.; Guo, X.; Wu, Z. Land Surface Temperature Retrieval from Landsat 8 TIRS—Comparison between Radiative Transfer Equation-Based Method, Split Window Algorithm and Single Channel Method. Remote Sens. 2014, 6, 9829–9852. [Google Scholar] [CrossRef]
  36. Qin, Z.; Dall’, O.G.; Karnieli, A.; Berliner, P. Derivation of split window algorithm and its sensitivity analysis for retrieving land surface temperature from NOAA-AVHRR data. J. Geophys. Res. 2001, 106, 22655–22670. [Google Scholar] [CrossRef]
  37. Bromley, C.J.; Manen, S.M.; Mannington, W. Heat flux from steaming ground: Reducing uncertainties. In Proceedings of the 36th Workshop on Geothermal Reservoir Engineering; Stanford University: Stanford, CA, USA, 2011. [Google Scholar]
Figure 1. Location map of the study. It shows the Aso volcanic area with spatial elevation data above mean sea level as contour lines. Nakadake consists of four active craters in this volcano, shown as Craters 1, 2, 3 and 4.
Geosciences 07 00118 g001
Figure 2. Flowchart showing the various steps of image processing in this study.
Geosciences 07 00118 g002
Figure 3. The land cover maps of the study area from 2013 to 2016, derived from the NDVI values for healthy vegetated area, mixed land, bare land, and water or wetlands.
Geosciences 07 00118 g003
Figure 4. Changes of land cover during the study period from 2013 to 2016 in the Aso volcanic area in Japan.
Geosciences 07 00118 g004
Figure 5. Thermal status of the study area shown using land surface temperature above ambient during the study period.
Geosciences 07 00118 g005
Figure 6. Radiative heat loss of the study area, showing pixel-based spatial RHF. Nakadake craters shown in the maps using consecutive numbers.
Geosciences 07 00118 g006
Figure 7. The changes of radiative heat loss (RHL) of the study area from 2013 to 2016.
Geosciences 07 00118 g007
Table 1. Summary of the results of the study.
YearLand Cover (Sq. km)Ambient Temp. (°C)Relative Humidity (%)Atmos. Transmissivity (%) LST (°C)RHF (W/m2)Total RHL (MW)Total HDR (MW)
Water/WetlandBare landMixed landVegetatedBand 10Band 11MinMaxMinMax
20133.521.513.50.07.04494.591.78.754.18.4289.97274715
20144.422.611.30.113.67089.284.312.237.6–7.1141.36344115
20153.219.48.27.714.54392.588.817.243.414.8177.96314096
20164.910.713.69.418.54690.385.820.852.213.1221.65883819
Notes: Land cover derived from NDVI value. Ambient temperature and relative humidity were obtained from the AMEDAS meteorological station every 10 min. The atmospheric transmissivity value was calculated using the ambient temperature and relative humidity of the study area with their respective image acquisition times. Total radiative heat loss (RHL) value was calculated after summation of the RHF of all pixels’ values in the study area, but the negative value was considered as a zero value during the summation process because a negative RHF value indicates the ground temperature below ambient of any region. The heat discharge rate is the projected value after multiplying the RHL with a relationship coefficient (about 15%) from the previous two studies, but we think this relationship could vary from 10% to 15%.

