2.1. Feather River Basin Characteristics
Oroville Dam’s catchment, the Feather River Basin, lies between the north end of the Sierra Nevada range and the east side of the Sacramento River Valley. It is bounded by Mt. Lassen to the northwest, and by the Diamond Mountains to the northeast. Documented results of geological studies in the vicinity [
19,
20] suggest that the area immediately in and around Lake Oroville composed mostly of what is called the “Bedrock Series”. This consists mostly of metavolcanic and pyroclastic rock, such as amphibolite. Above this bedrock lie various younger sedimentary rocks such as shales, dolomites, Quaternary alluvium, playas, terraces, glacial till and moraines, and finally various marine and non-marine sediments [
21]. In general, the Feather River Basin is considered an area of low seismicity [
20]. The Feather River Basin as well as the city of Oroville are characterized by a Mediterranean climate. Precipitation in the Feather River basin occurs most usually during the cooler months, in rare yet intense events. On average, there are only 57 days of precipitation per year, and 36 of those are liquid. Large floods in the Feather River basin occur due to severe winter rain storms, in some cases augmented by snowmelt. A typical event may last several days, not being a single storm, but a sequence of smaller individual storms in quick succession. In these cases, runoff can produce high-peak intense flows downstream with a variety of flood characteristics [
22].
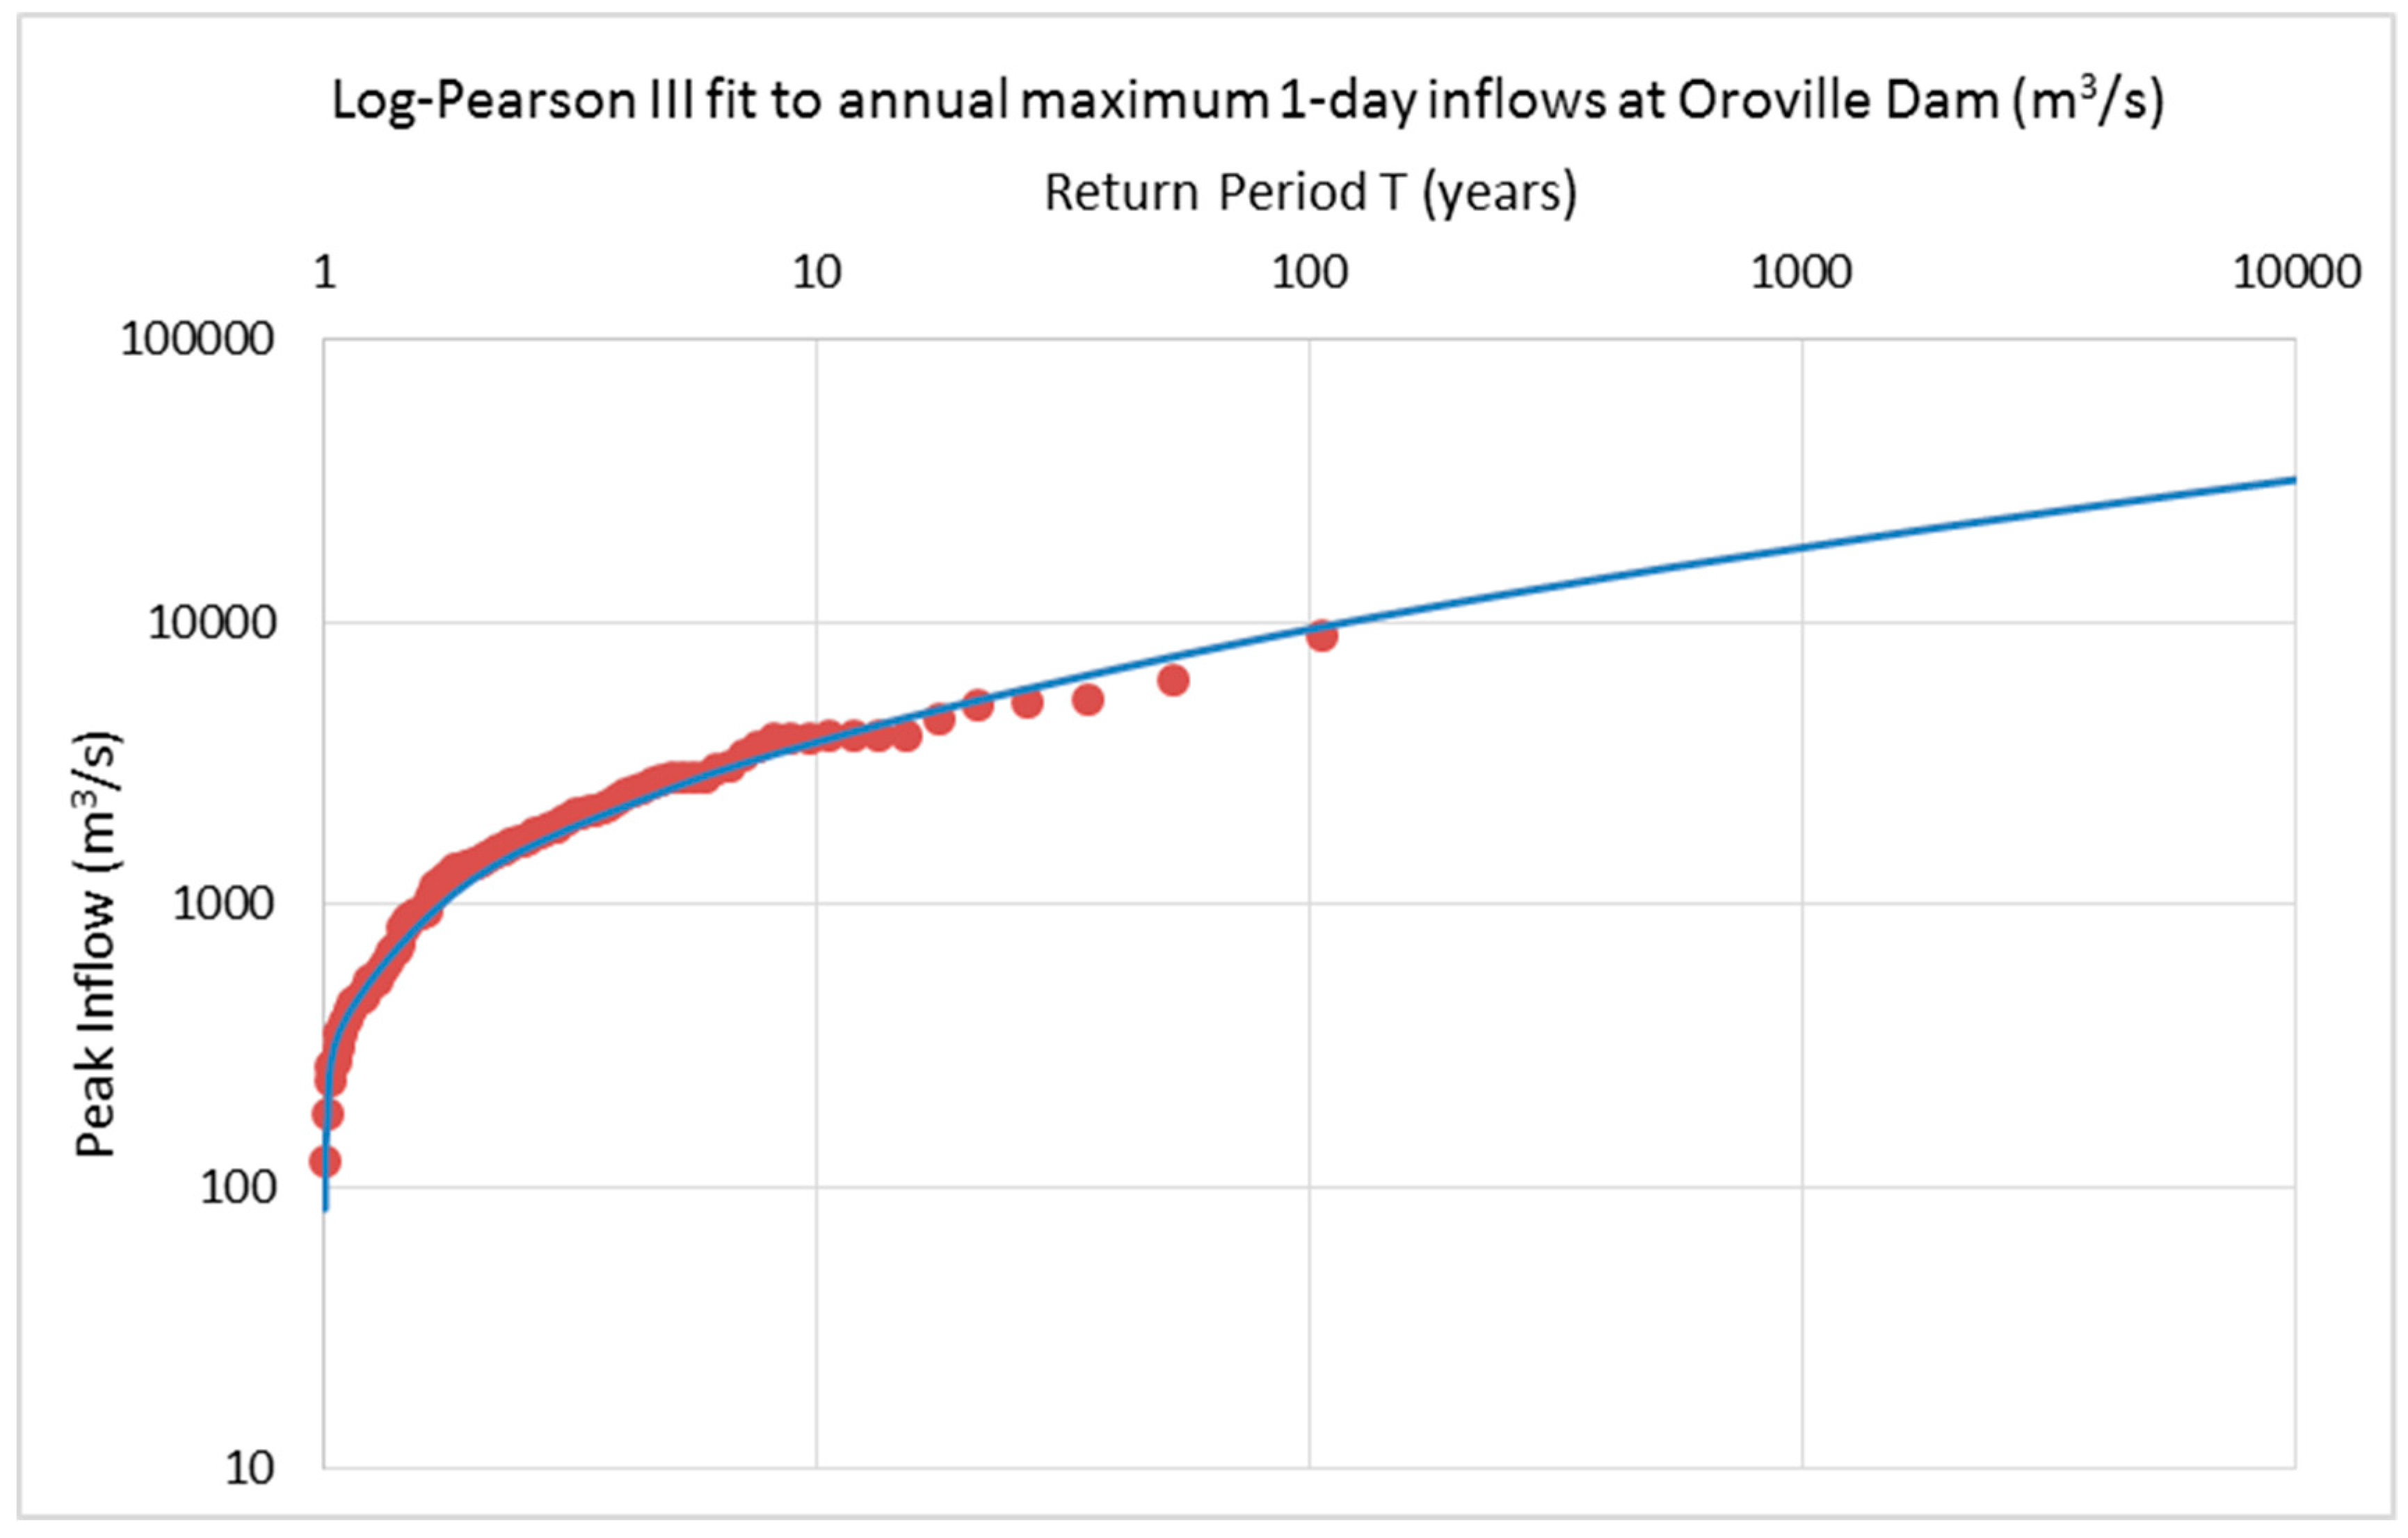
A report [
23] contains unregulated, annual maximum flow data for the Feather River at Oroville station resulting from rainfall for 1-day, 3-day, 7-day, 15-day, and 30-day durations as provided by the US Army Corps of Engineers. Each n-day period is useful for different aspects of reservoir management [
22,
23,
24,
25]. The most intense floods from this analysis can be found in
Table 1.
2.2. Oroville Dam Characteristics
Oroville Dam is a zoned earth-fill embankment structure with a maximum height of 235 m above river excavation as shown in
Figure 1. The dam embankment has a volume of approximately 61 million m
3 and comprises an inclined impervious core on a concrete foundation, supplemented by zoned earth-fill sections on both sides.
This dam has a large catchment, with an area of approximately 9342 km
2 and reservoir surface area of approximately 64 km
2. The reservoir capacity (up to the main spillway sill level) is 3427 hm
3, whereas the maximum operating volume is stated to be 4364 hm
3 (up to the emergency spillway sill level). Further pertinent data on the dam, including a stage-storage capacity curve can be found in related design reports released shortly after the dam’s construction [
19,
22]. An important additional note is that this dam is not the only one that operates in the Feather Basin; it is part of a network that includes several upstream reservoirs and diversion pools [
27,
28].
Oroville Dam’s spillway is located on a natural ridge adjacent to right abutment of the main embankments. It consists of two independent structures, a combined flood control outlet and an emergency weir. The former consists of an unlined approach channel with walls in such a way as to make flows smoothly transit into an outlet passage, a headworks structure, and a concrete lined chute, approximately 929 m in length. The headworks structure is comprised of eight top-seal radial gates, 17.78 cm thick and 5.18 m wide by 10.06 m high. At the end of the lined chute, chute blocks help absorb some of the energy from the outgoing flow before it pours into the Feather River.
The main concept behind designing the flood control outlet was to limit Feather River flow to 5094 m
3/s in the occurrence of a flood event known as the Standard Project Flood (SPF). For Oroville Dam, the peak inflow of the SPF was estimated at 12,700 m
3/s, and is claimed to have a return period of 450 years in related design documents [
19]. In order to meet this criterion, the flood control was designed for a 4245 m
3/s controlled release, and a flood control reservation volume of 925.11 hm
3 was deemed necessary. This volume is also mentioned in the official manual for flood control operation of Oroville Dam [
19,
22].
According to references [
19,
29], the combined capacity of the main and emergency spillways is 17,472 m
3/s, which corresponds to a peak inflow of 20,160 m
3/s. The event that would cause this inflow corresponds to what has been known as the Probable Maximum Flood (PMF). Given the known design capacity of the main spillway, this would set the design capacity of the emergency spillway to approximately 9900 m
3/s in order to meet the combined outflow required by the PMF.
Blasting was used for almost 90% of the main spillway chute foundation, in order to reach grade. The remaining amount consisted of the removal of several seams of clay located in the foundation, and a few areas where the slope failed [
19]. The slopes in the flood control outlet section were of a lower quality rock than initially presumed and several large seams ran parallel with the main spillway chute. The countermeasure that was applied was the replacement of planned anchor bars with grouted rock blots, pigtail anchors and a chain-link covering the area’s surface [
19].
2.3. Annual Maxima Rainfall Analysis
Until now, known flood control studies for Oroville Dam and the Feather Basin have attempted to determine the Probable Maximum Flood (PMF) for Lake Oroville, based on the Probable Maximum Precipitation (PMP). The most recent existing study available detailing PMP calculations in California is Hydrometeorological Report No. 59 or HMR 59 [
30]. In brief, the computational procedure includes tracing an outline of the drainage basin, placing this outline on top of a given PMP 10-m
2, 24-h index map, then determining depth-duration relationships and areal reduction factors, and finally conducting temporal distribution of incremental depths extracted from a given curve.
While this method is simple to use, and the analysis involved in creating these PMP index maps undoubtedly contains valuable information, it would be better to adopt a probabilistic approach to precipitation analysis, where instead of assuming a deterministic, theoretical upper limit, a return period would be assigned to any precipitation and flood value. This would be achieved by studying existing precipitation data and extracting a return period for the already calculated 24-h index depths, for every sub-area of the Feather River Basin, as determined by the California Department of Water Resources [
27]. One of the possible methods to achieve this is exposed below.
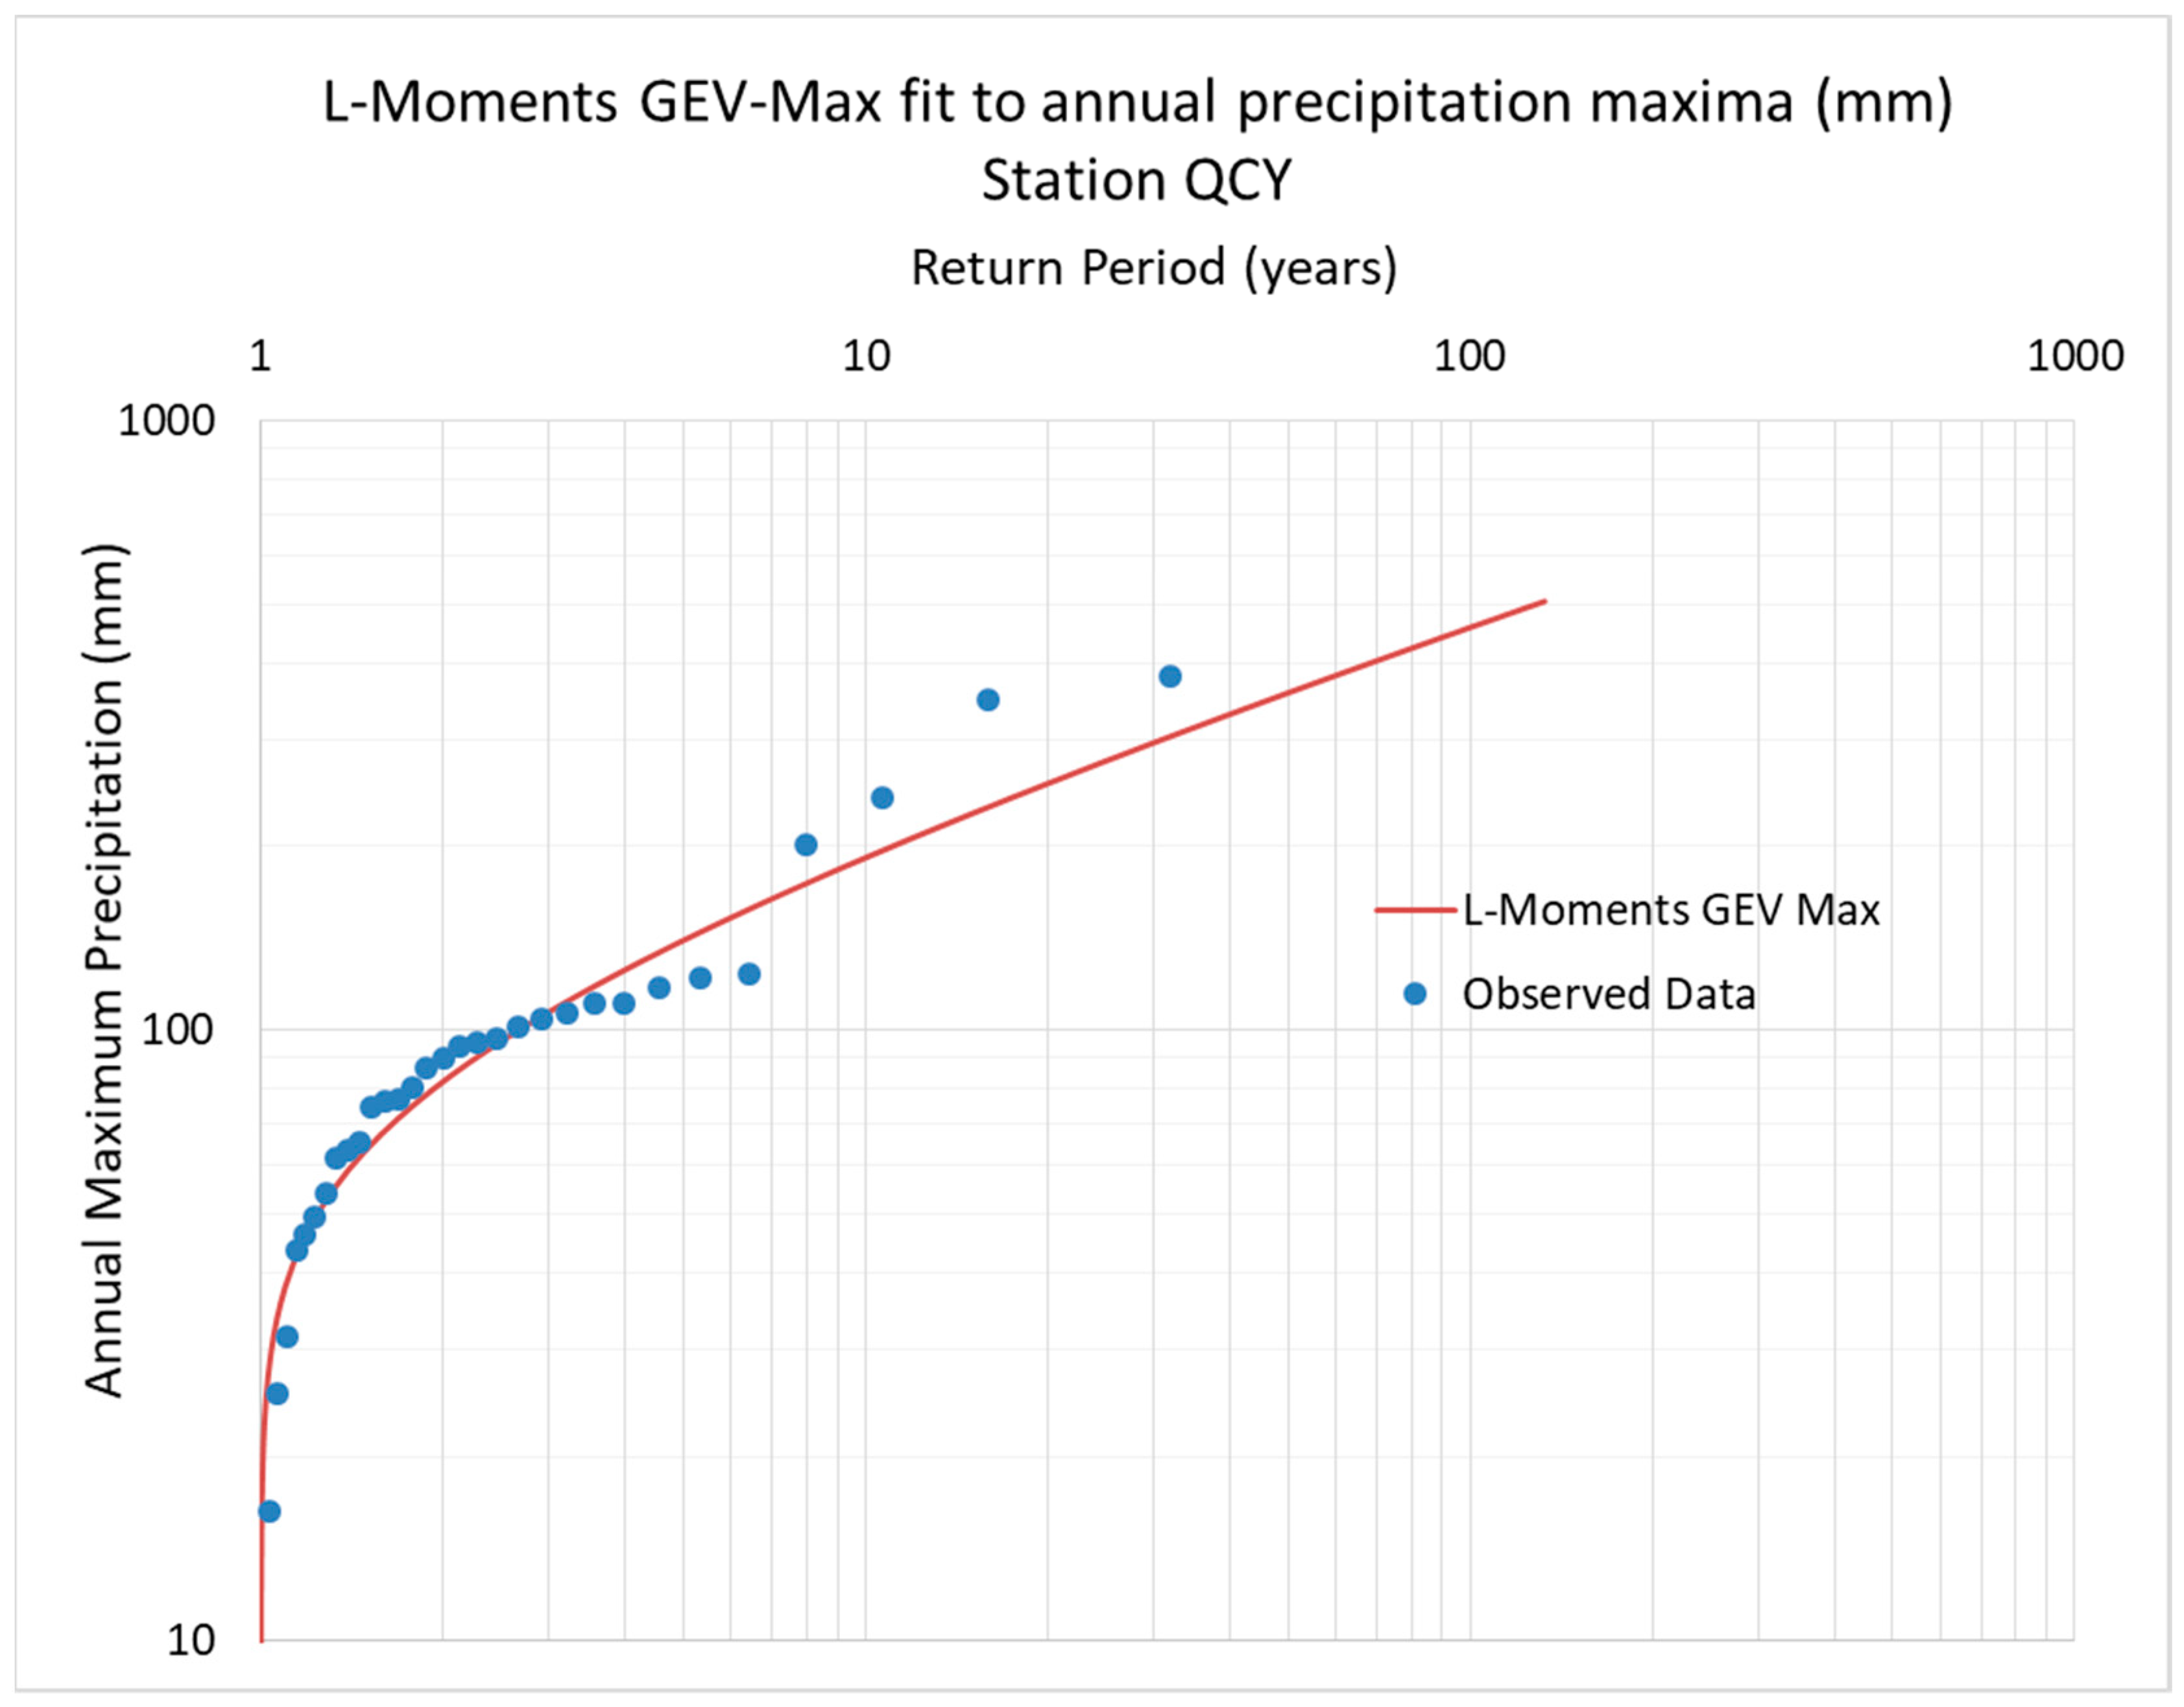
The 24-h index PMP depth essentially describes a daily maximum precipitation value. If the distribution of daily rainfall for a given area is known, one can assume that the annual maxima of daily rainfall would resemble one of two limiting types: type I, known as Gumbel distribution or type II, known as Fréchet distribution. The Generalized Extreme Value (GEV) distribution, which comprises these types by way of its shape parameter (as well as type III, known as reversed Weibull, which however is not recommended for rainfall maxima [
31]) can be fitted to a series of annual maxima of daily rainfall.
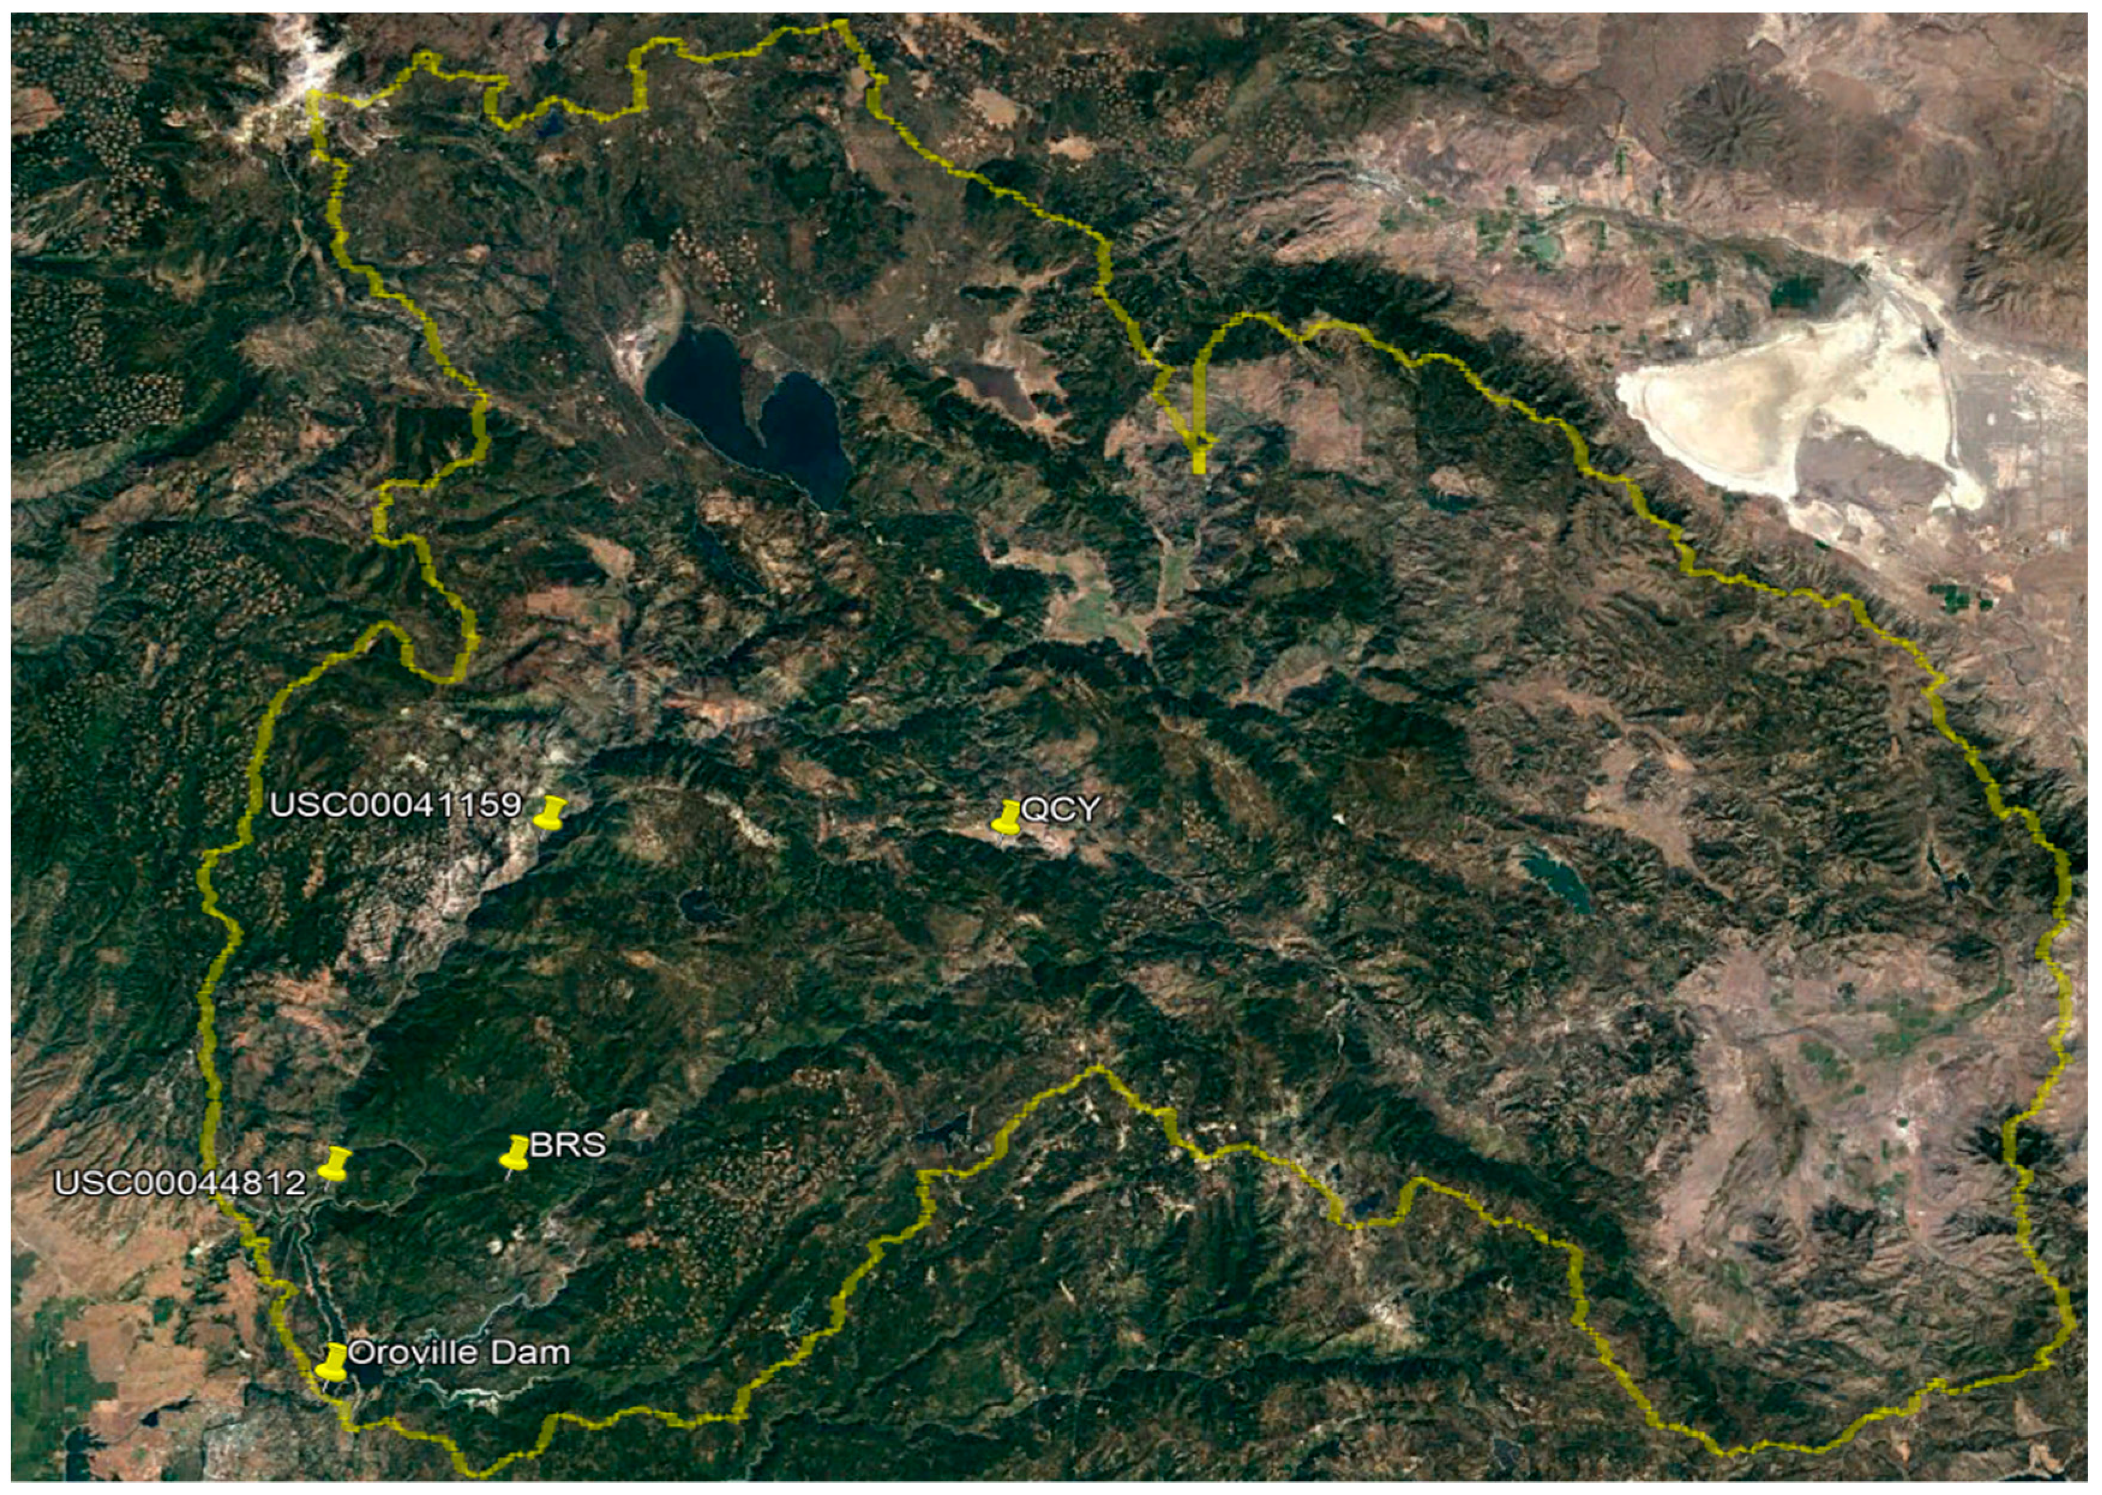
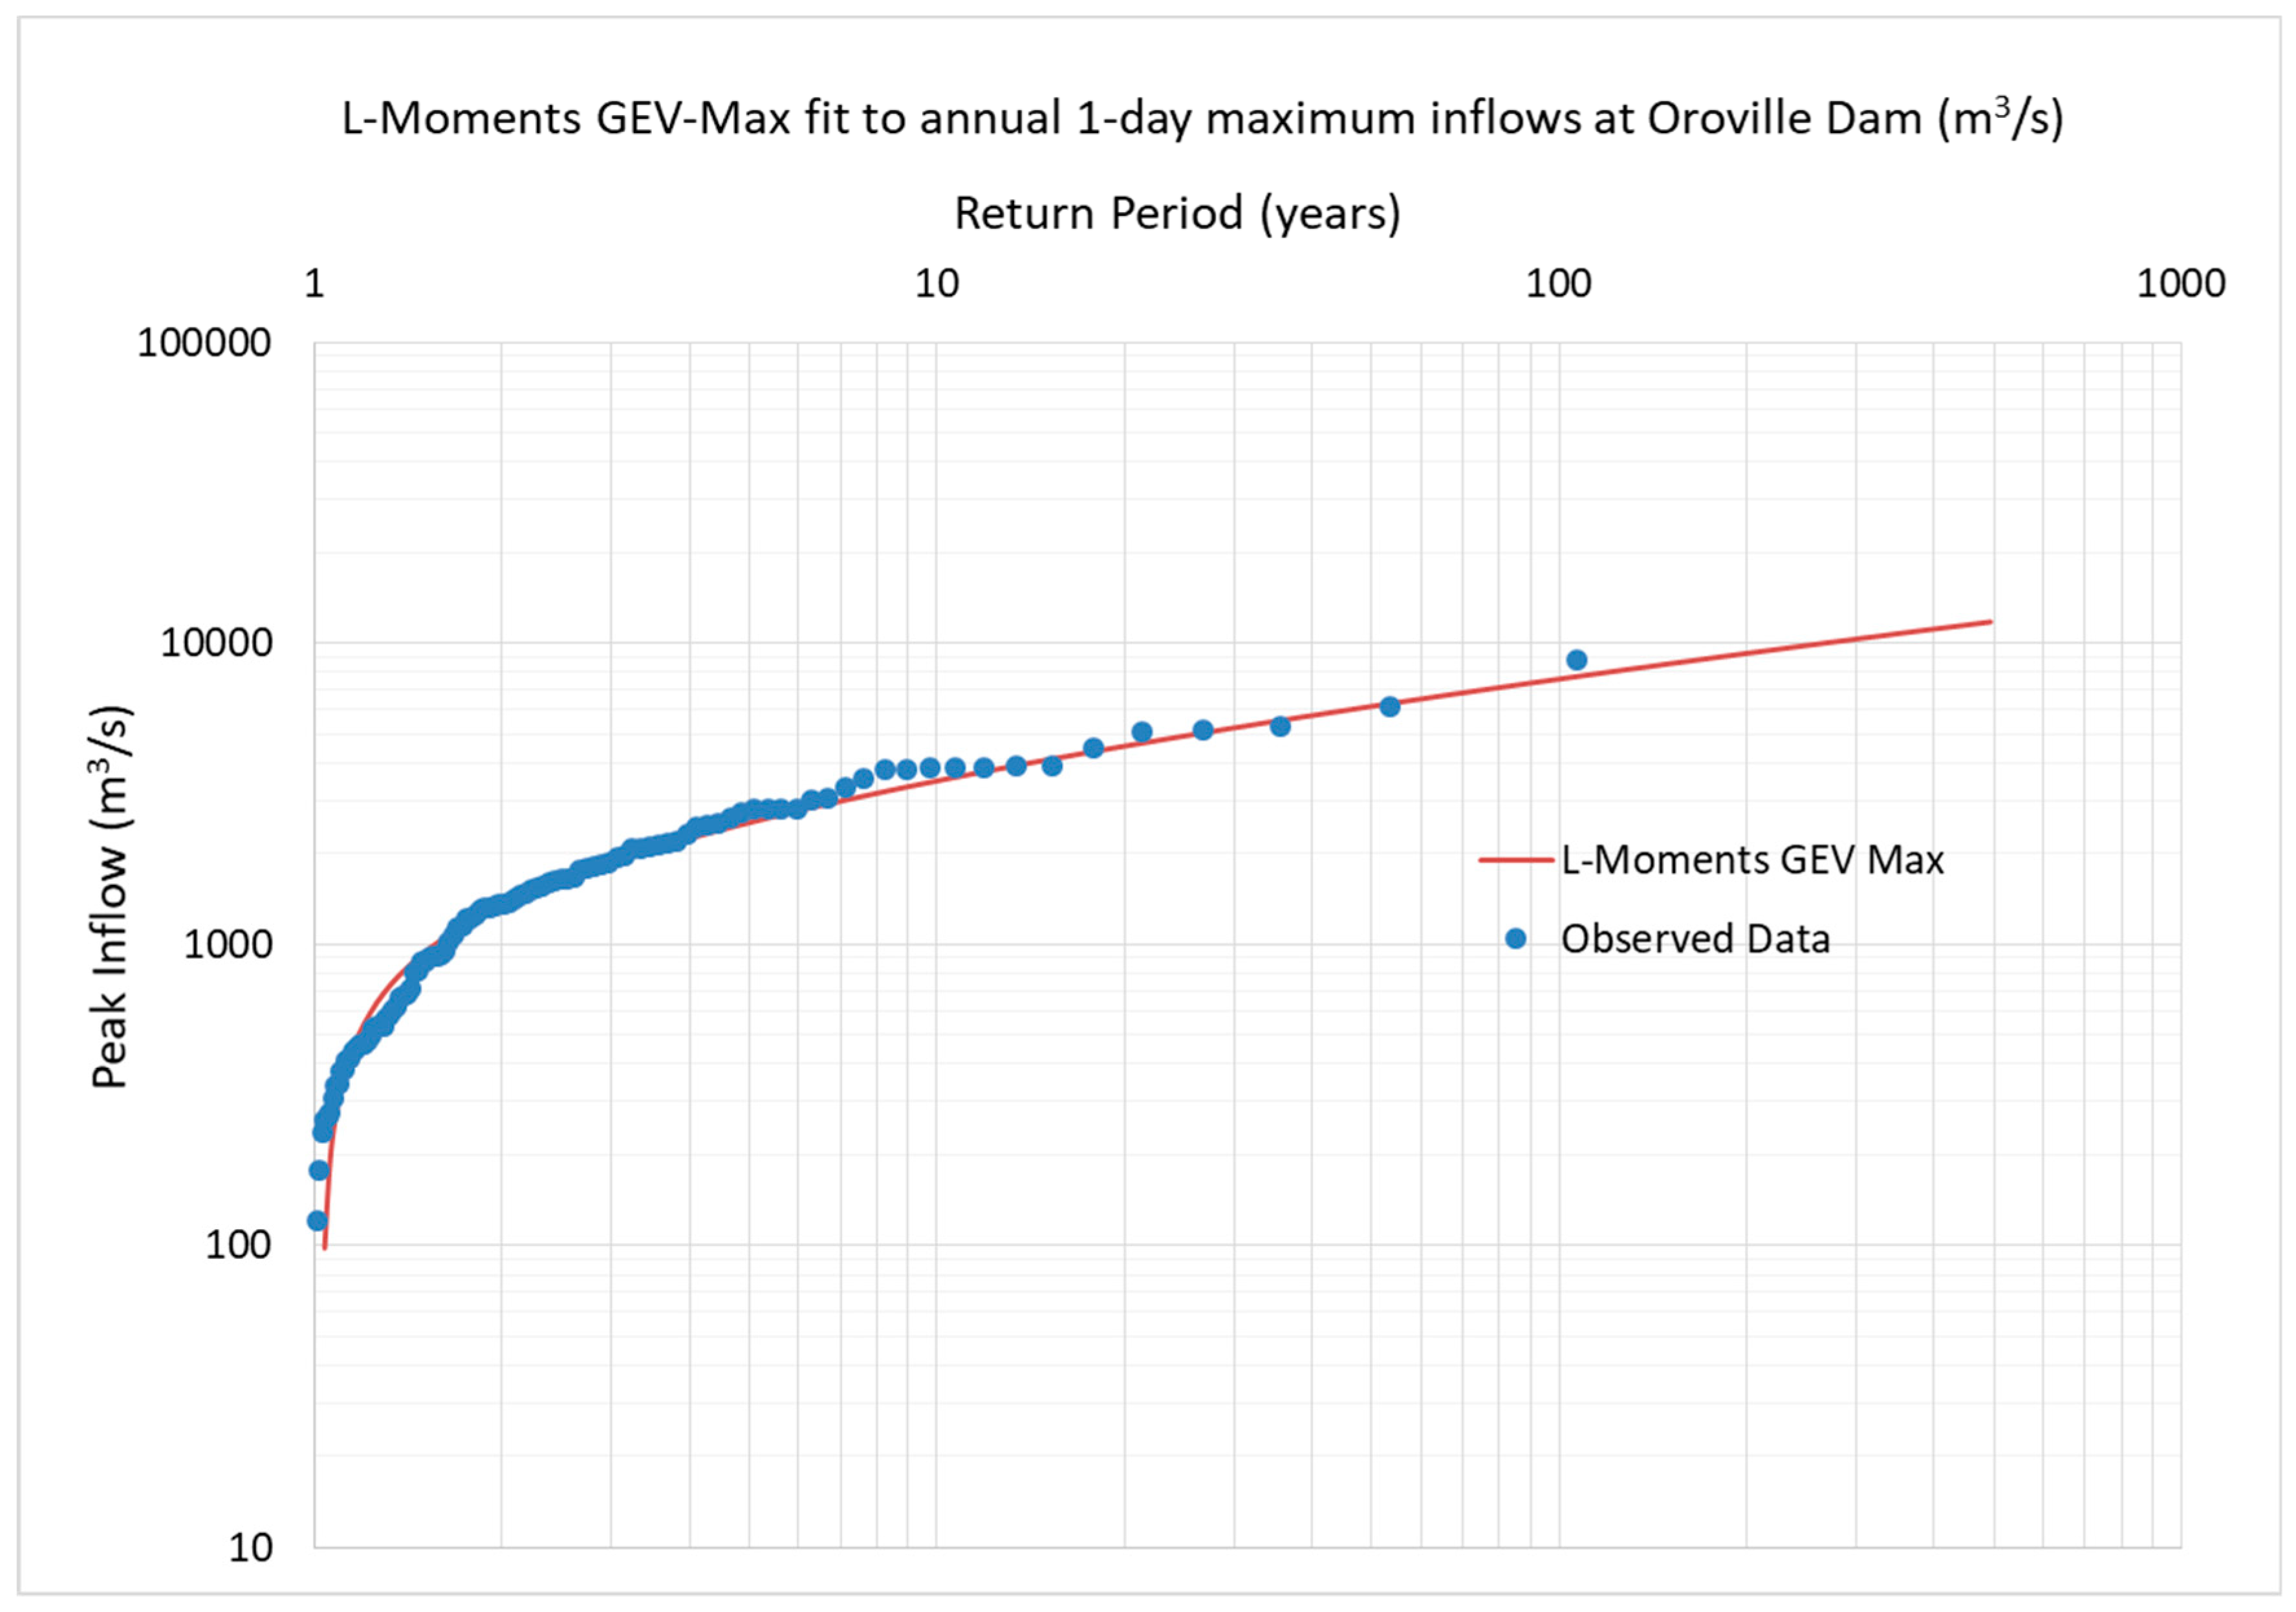
In accordance with References [
13,
32,
33], the GEV distribution using the method of L-moments is fitted to various precipitation data gathered from the Feather Basin [
34,
35]. A map of the basin with the measurement stations used in this analysis can be found in
Appendix A [
34,
35,
36].
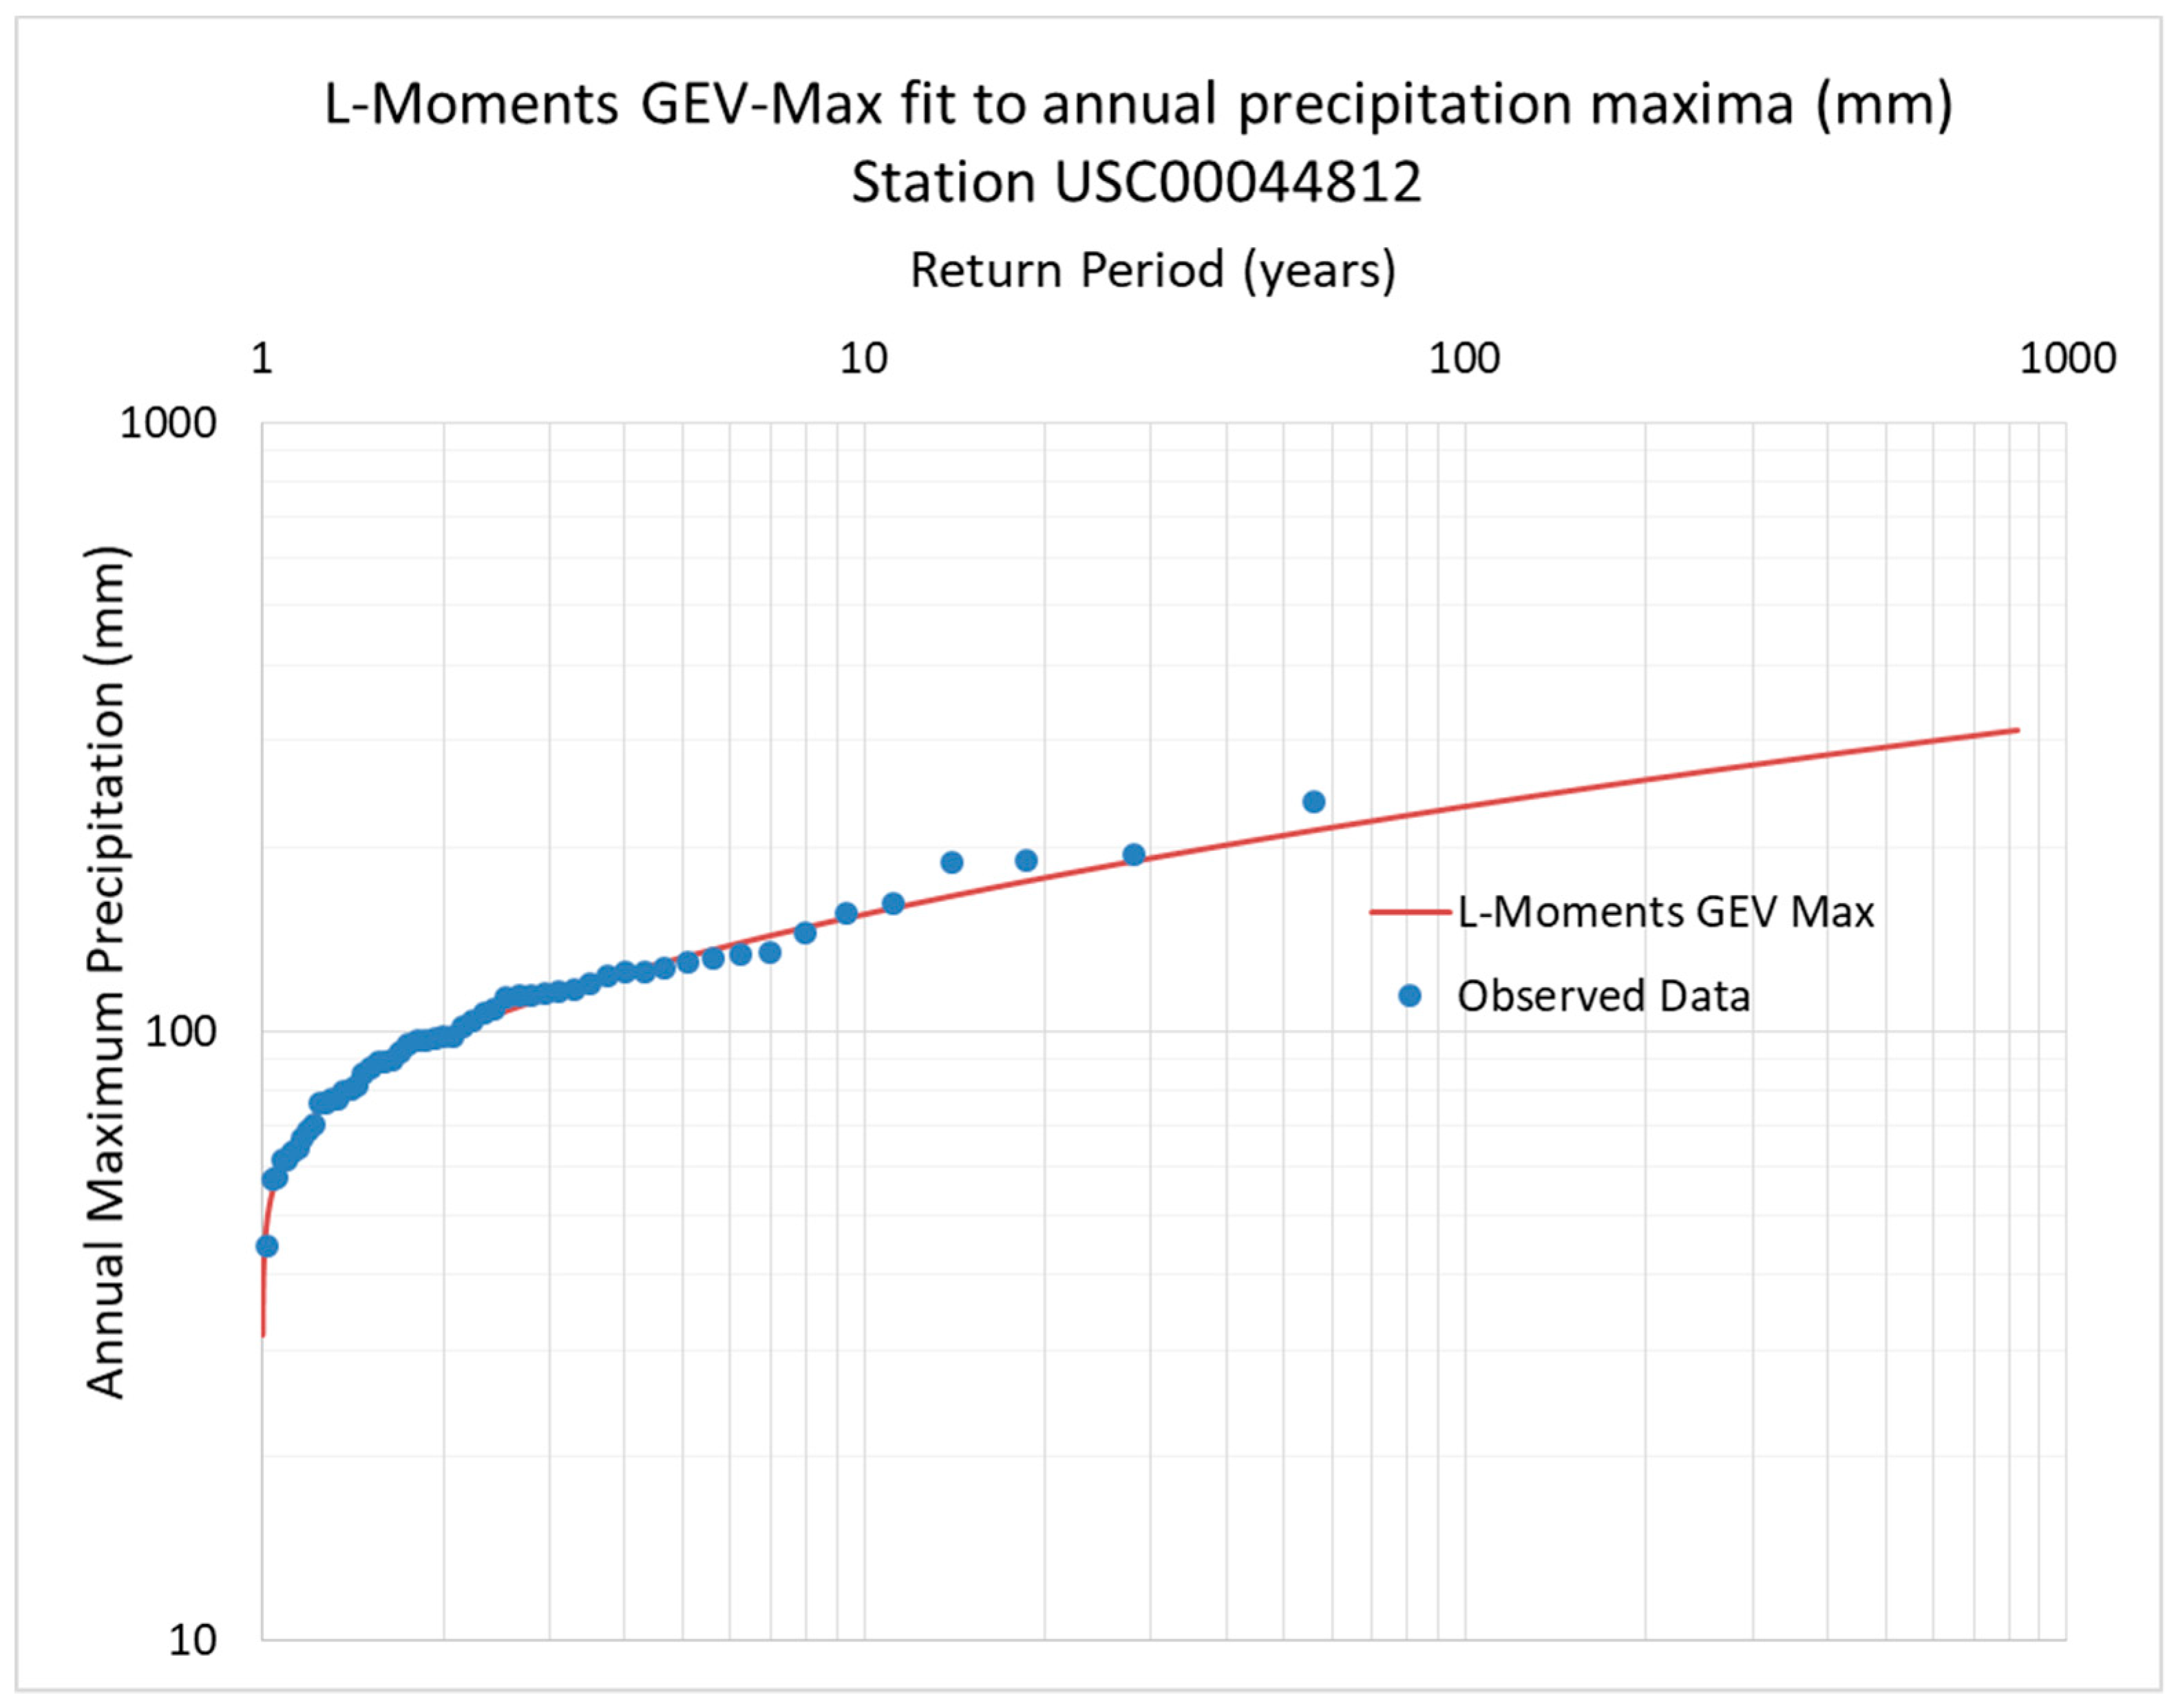
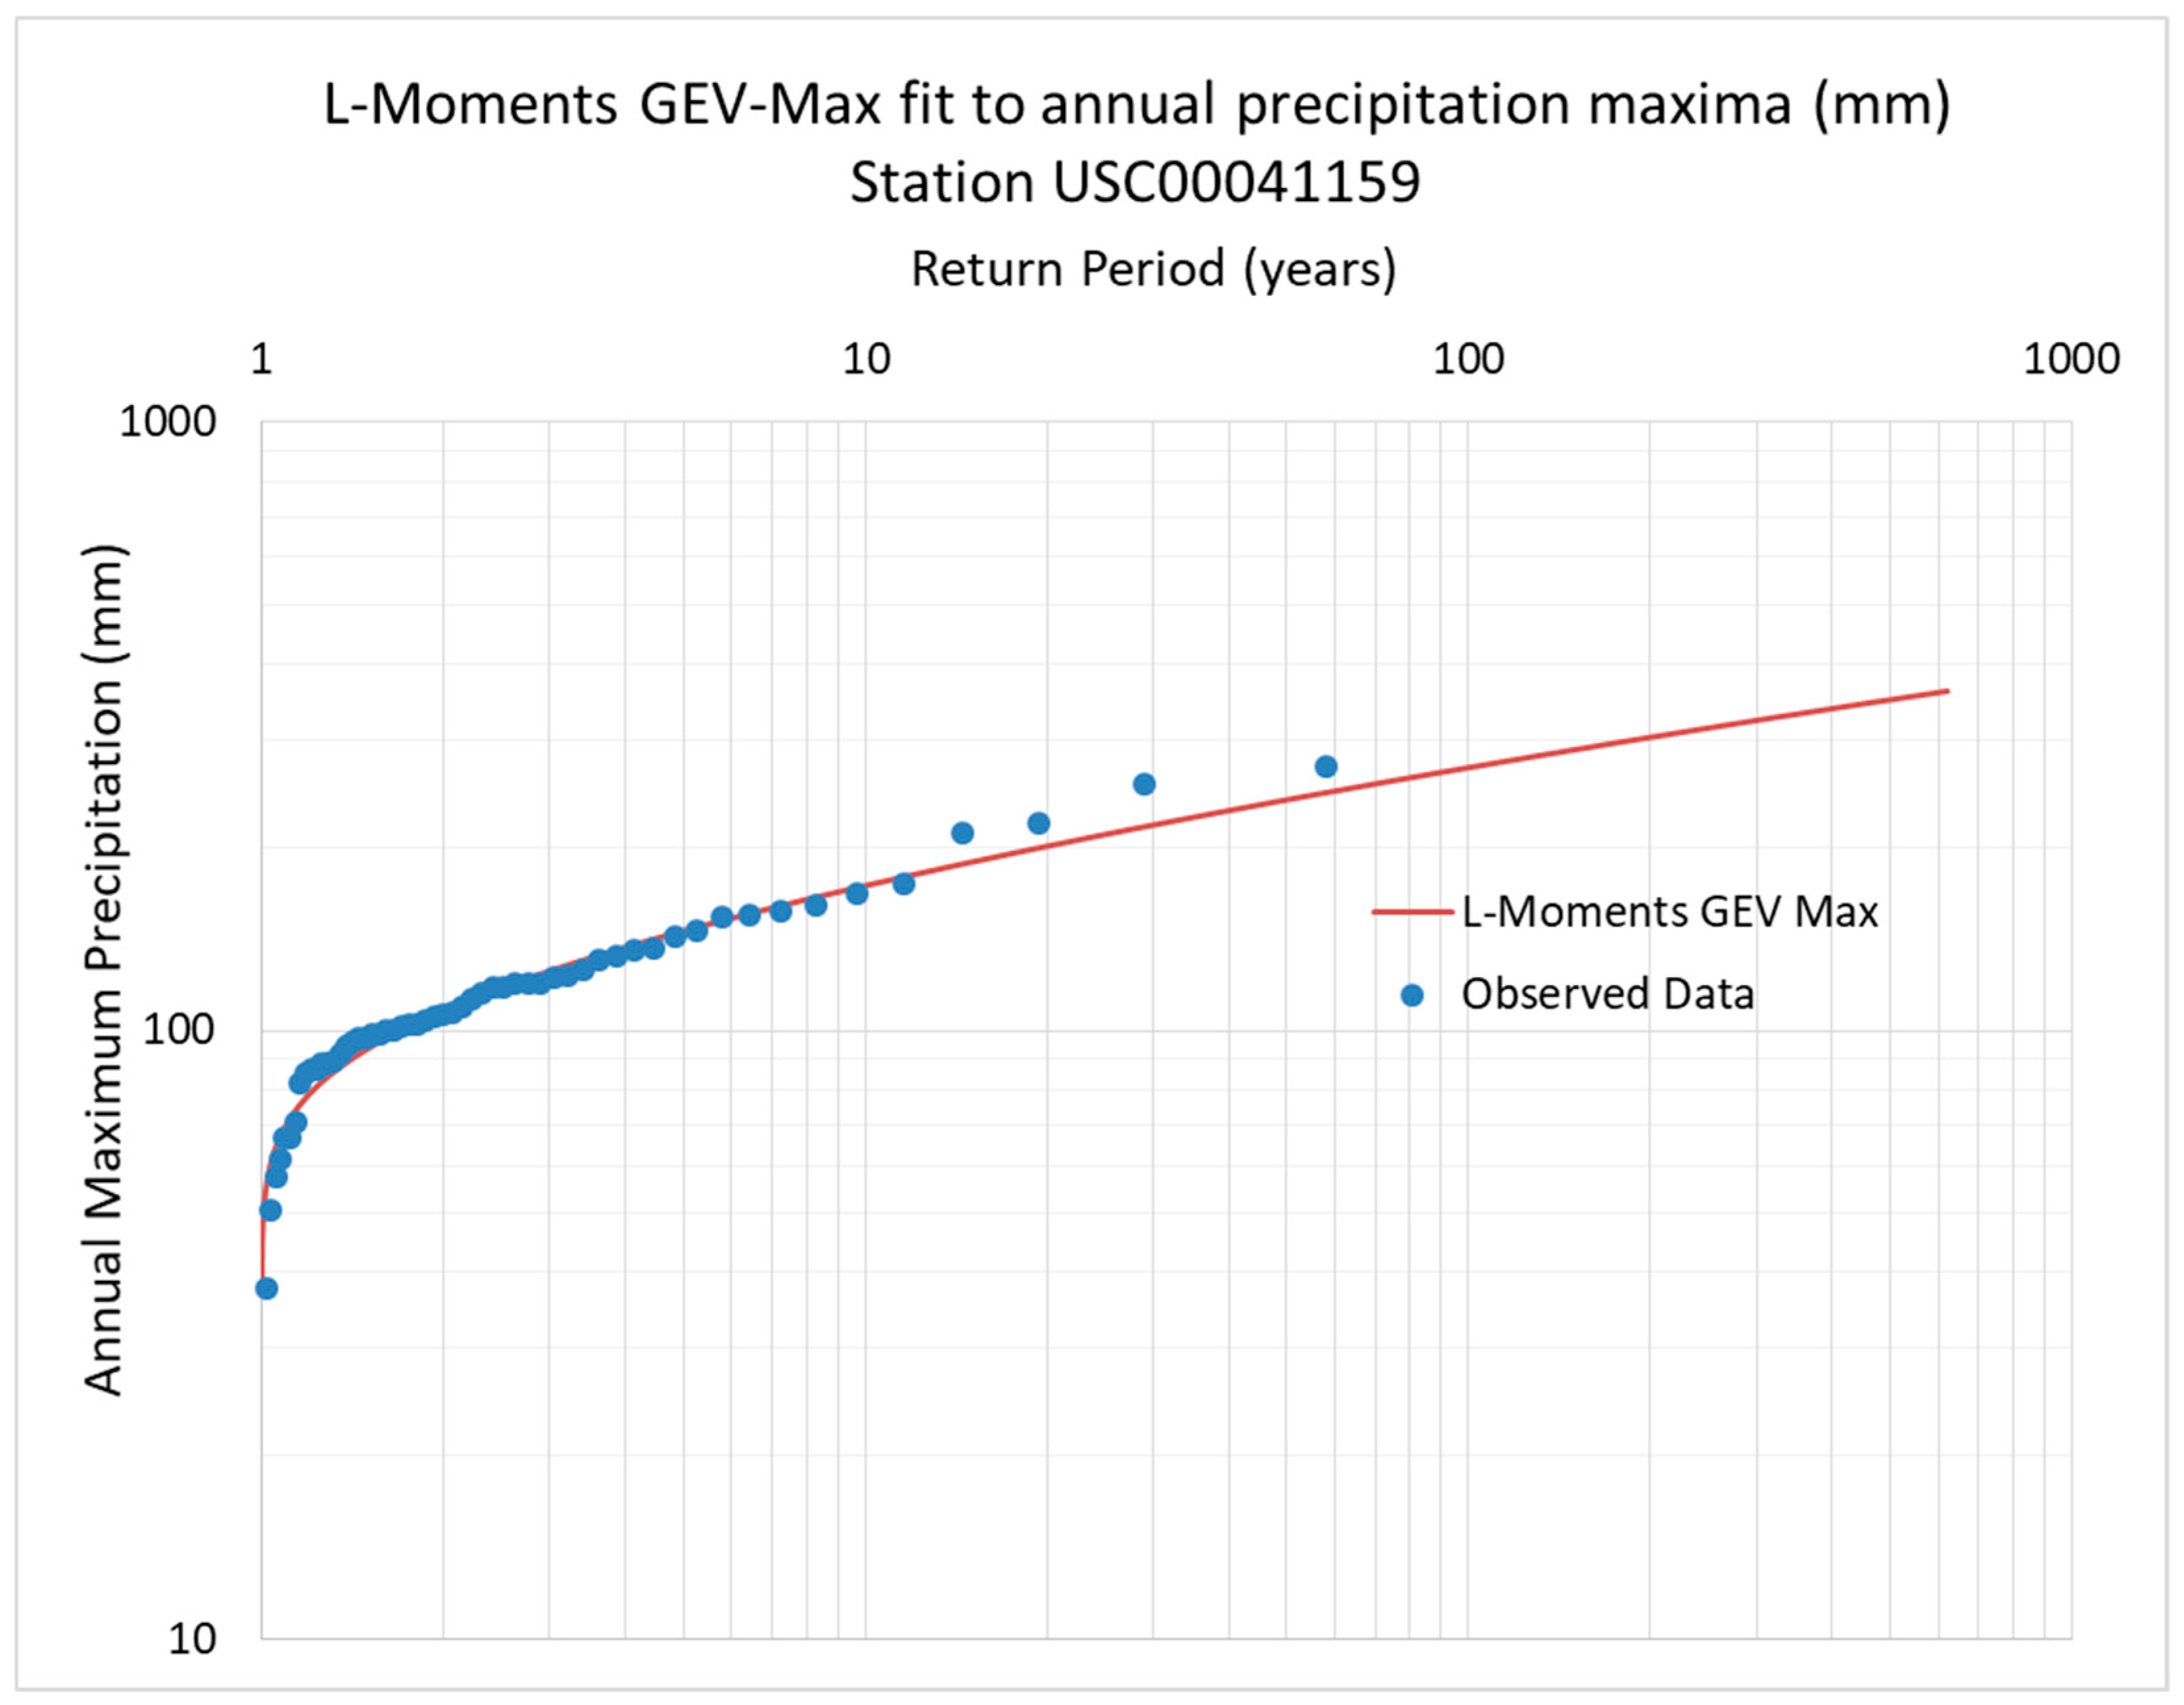
To improve accuracy, a filter is applied to the data, i.e., only years with 300 or more daily measurements are taken into account, roughly equivalent to at least 25 days with measurements per month. After discarding stations with data suspected of containing erroneous measurements that could not be cross-referenced with floods around the same time period, four significant precipitation measurement stations were selected for this analysis. Then, annual daily maxima time series are created. The process is simple: First, select the maximum daily precipitation value of every year, then rank them in descending order. Obviously, the highest value is the most important one, so it is imperative that it is cross-referenced with multiple sources to confirm its validity. Finally, the GEV-max distribution with the method of L-moments is fitted using the “Pythia” statistical tool of the HYDROGNOMON open software, which follows the exact principles stated in the related literature [
13,
32,
33].
2.4. The 2017 Event
During the first few days of January 2017, two small rain storms occurred just over Oroville Dam’s reservoir [
34,
37]. The first rain storm was short, lasting only 4 days, peaking at 90 mm on January 3, and the second was a stronger 6-day event, peaking at 136 mm on January 10. These rain storms quickly led into a large increase of inflows into Lake Oroville. Two inflow peaks occurred: The primary one was 4839 m
3/s on January 8 at 21:00 p.m., and a secondary peak of 3079 m
3/s, occurring on January 10 at 22:00 p.m. These inflows are definitely significant, yet expected during a typical wet season. However, outflows from Lake Oroville at the same time were very low, almost zero, as there was a sharp water storage increase in Lake Oroville, as well as a significant rise in its surface elevation. Lake Oroville’s surface elevation initially exceeded the flood control minimum on January 12, 2017 at 17:00 p.m. Around that time, outflows from Oroville Dam’s main spillway were increased to compensate for this fact and return the surface elevation to below the minimum. Overall, the Oroville Dam operator was able to return the surface level to below the flood control limit on February 3, 2017 at 17:00 p.m, just in time for an upcoming February rain storm.
Thereafter, according to CDEC, a rain storm over the Feather Basin began on February 2, 2017, and ended around February 11. The largest flood value occurred on February 9 at 19:00 p.m., and was 5392 m
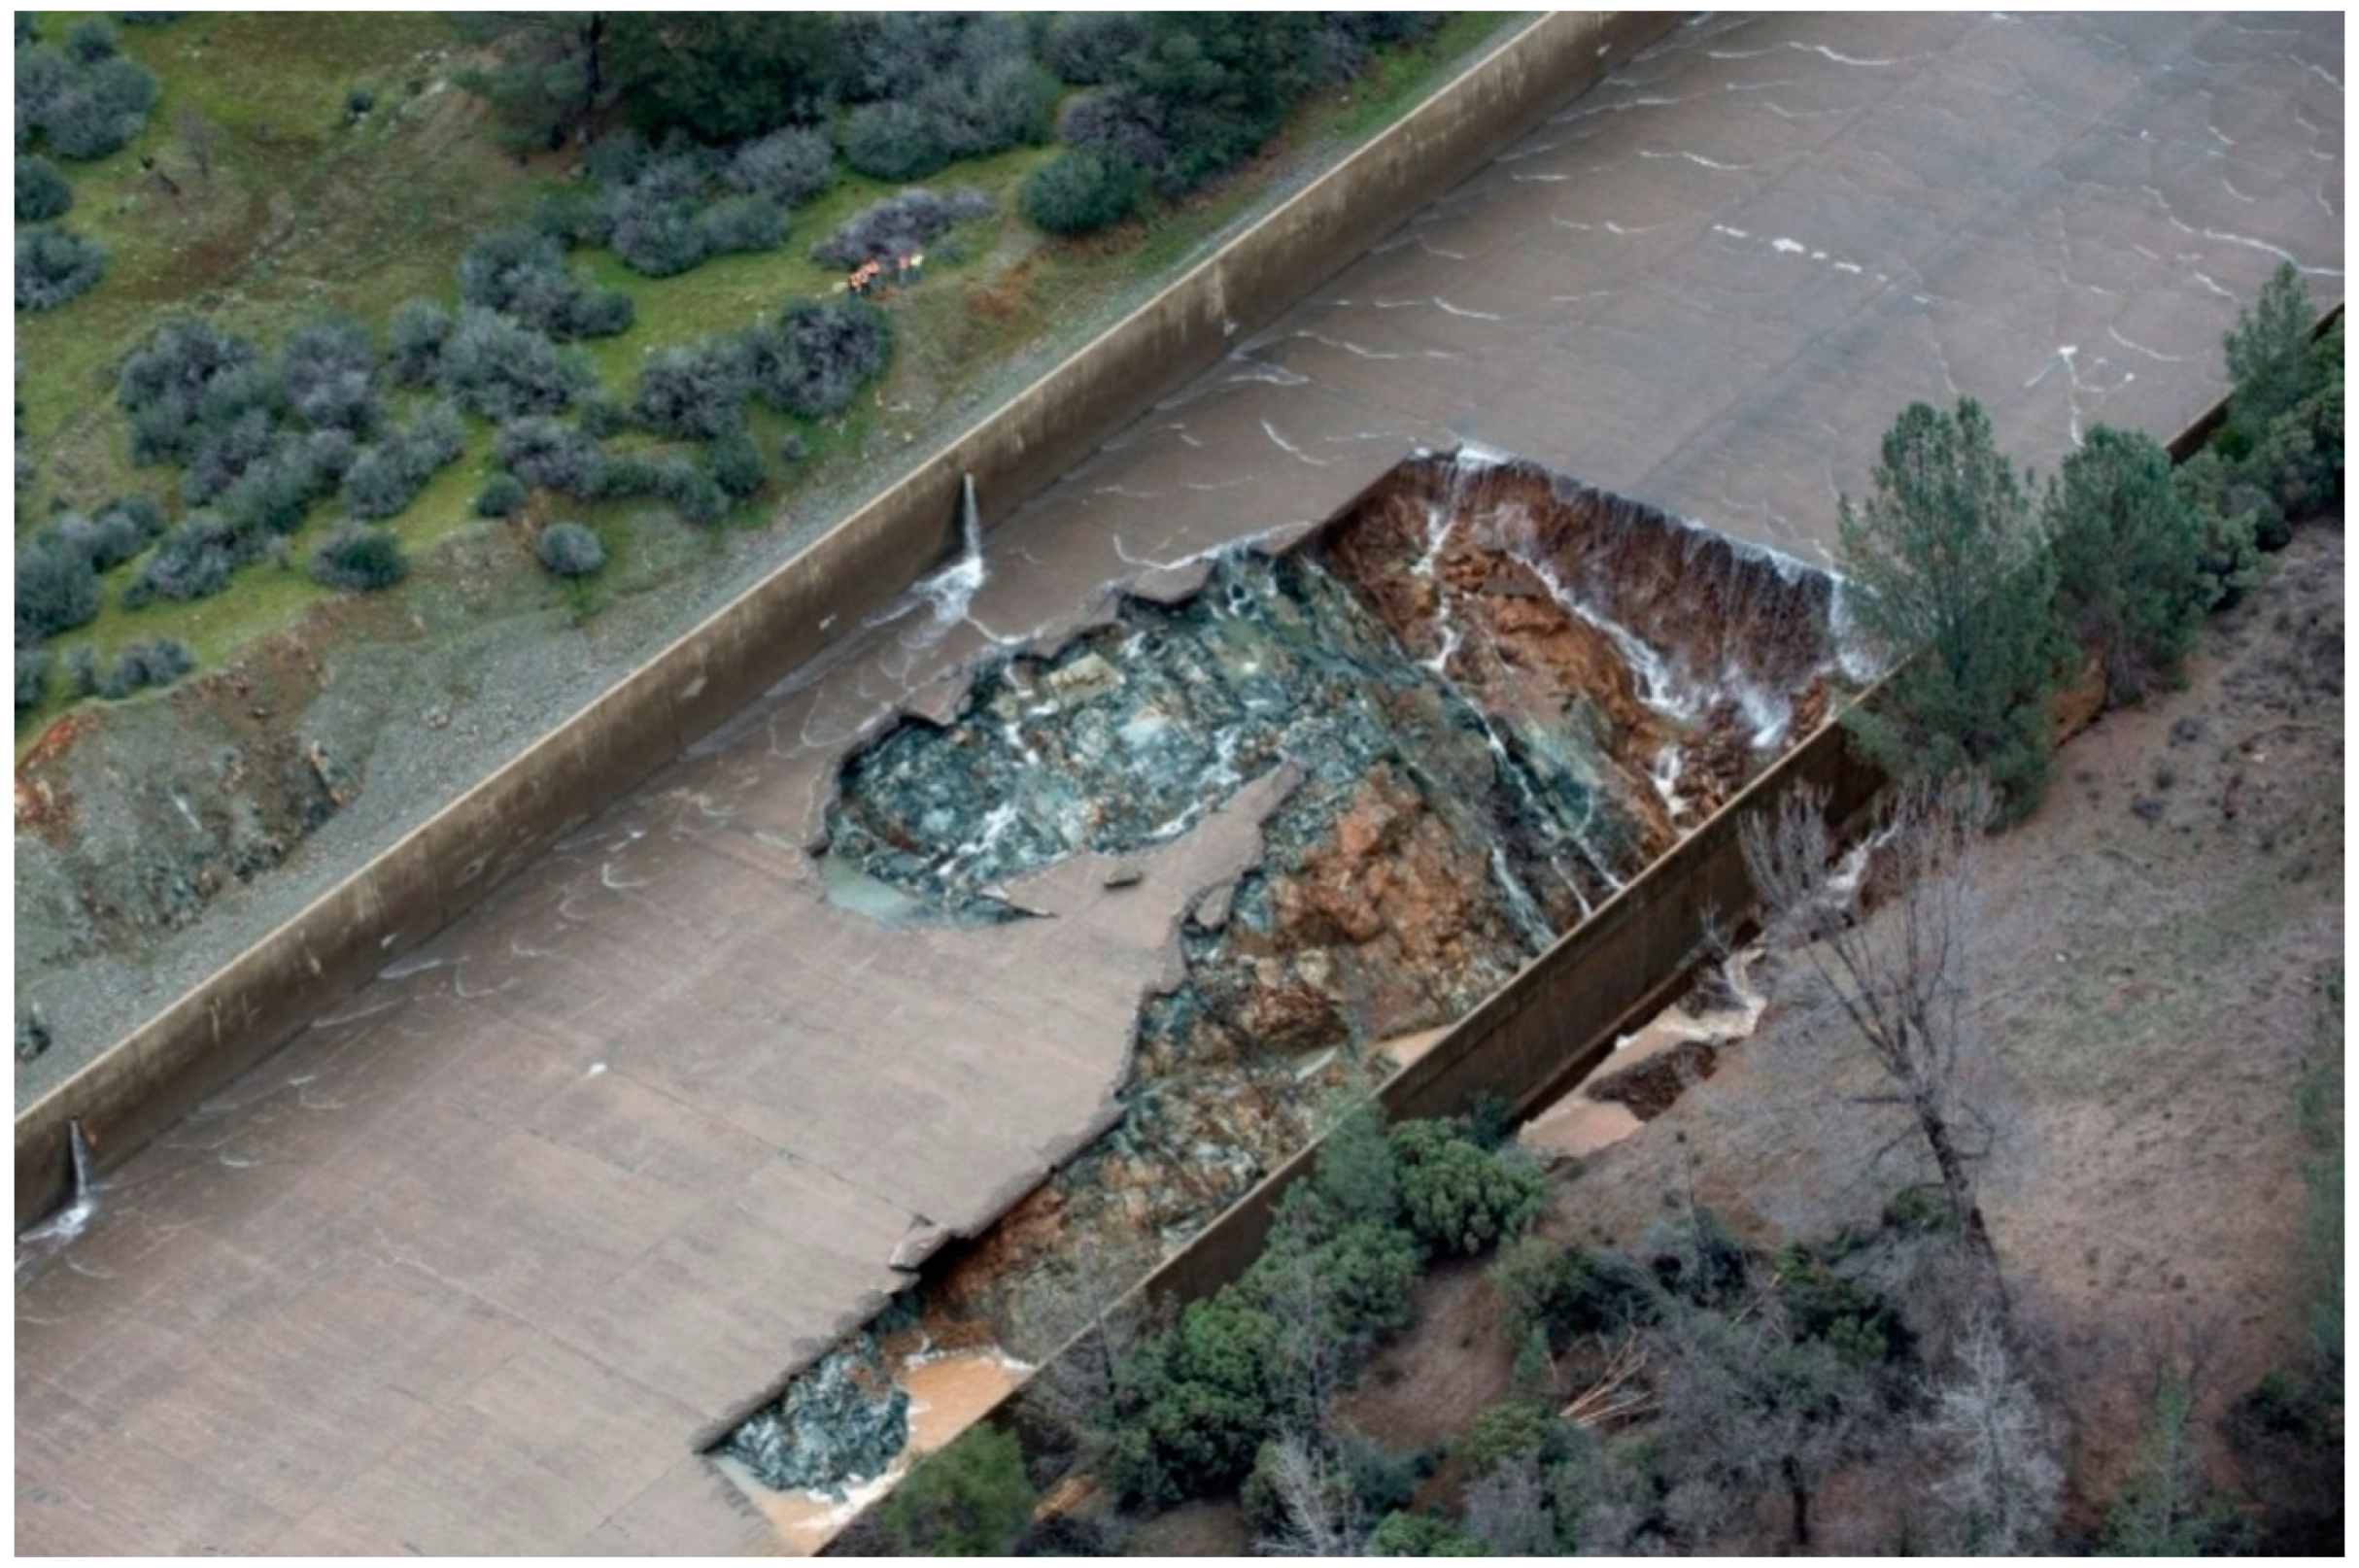
3/s. This value is significantly lower than the highest recorded floods to ever occur in the Feather Basin. Under normal circumstances, Oroville Dam should have been able to deal with this event without trouble. On February 6 at approximately 13:00 p.m., outflows from Lake Oroville were raised in order to prepare for incoming inflows to 1500 m
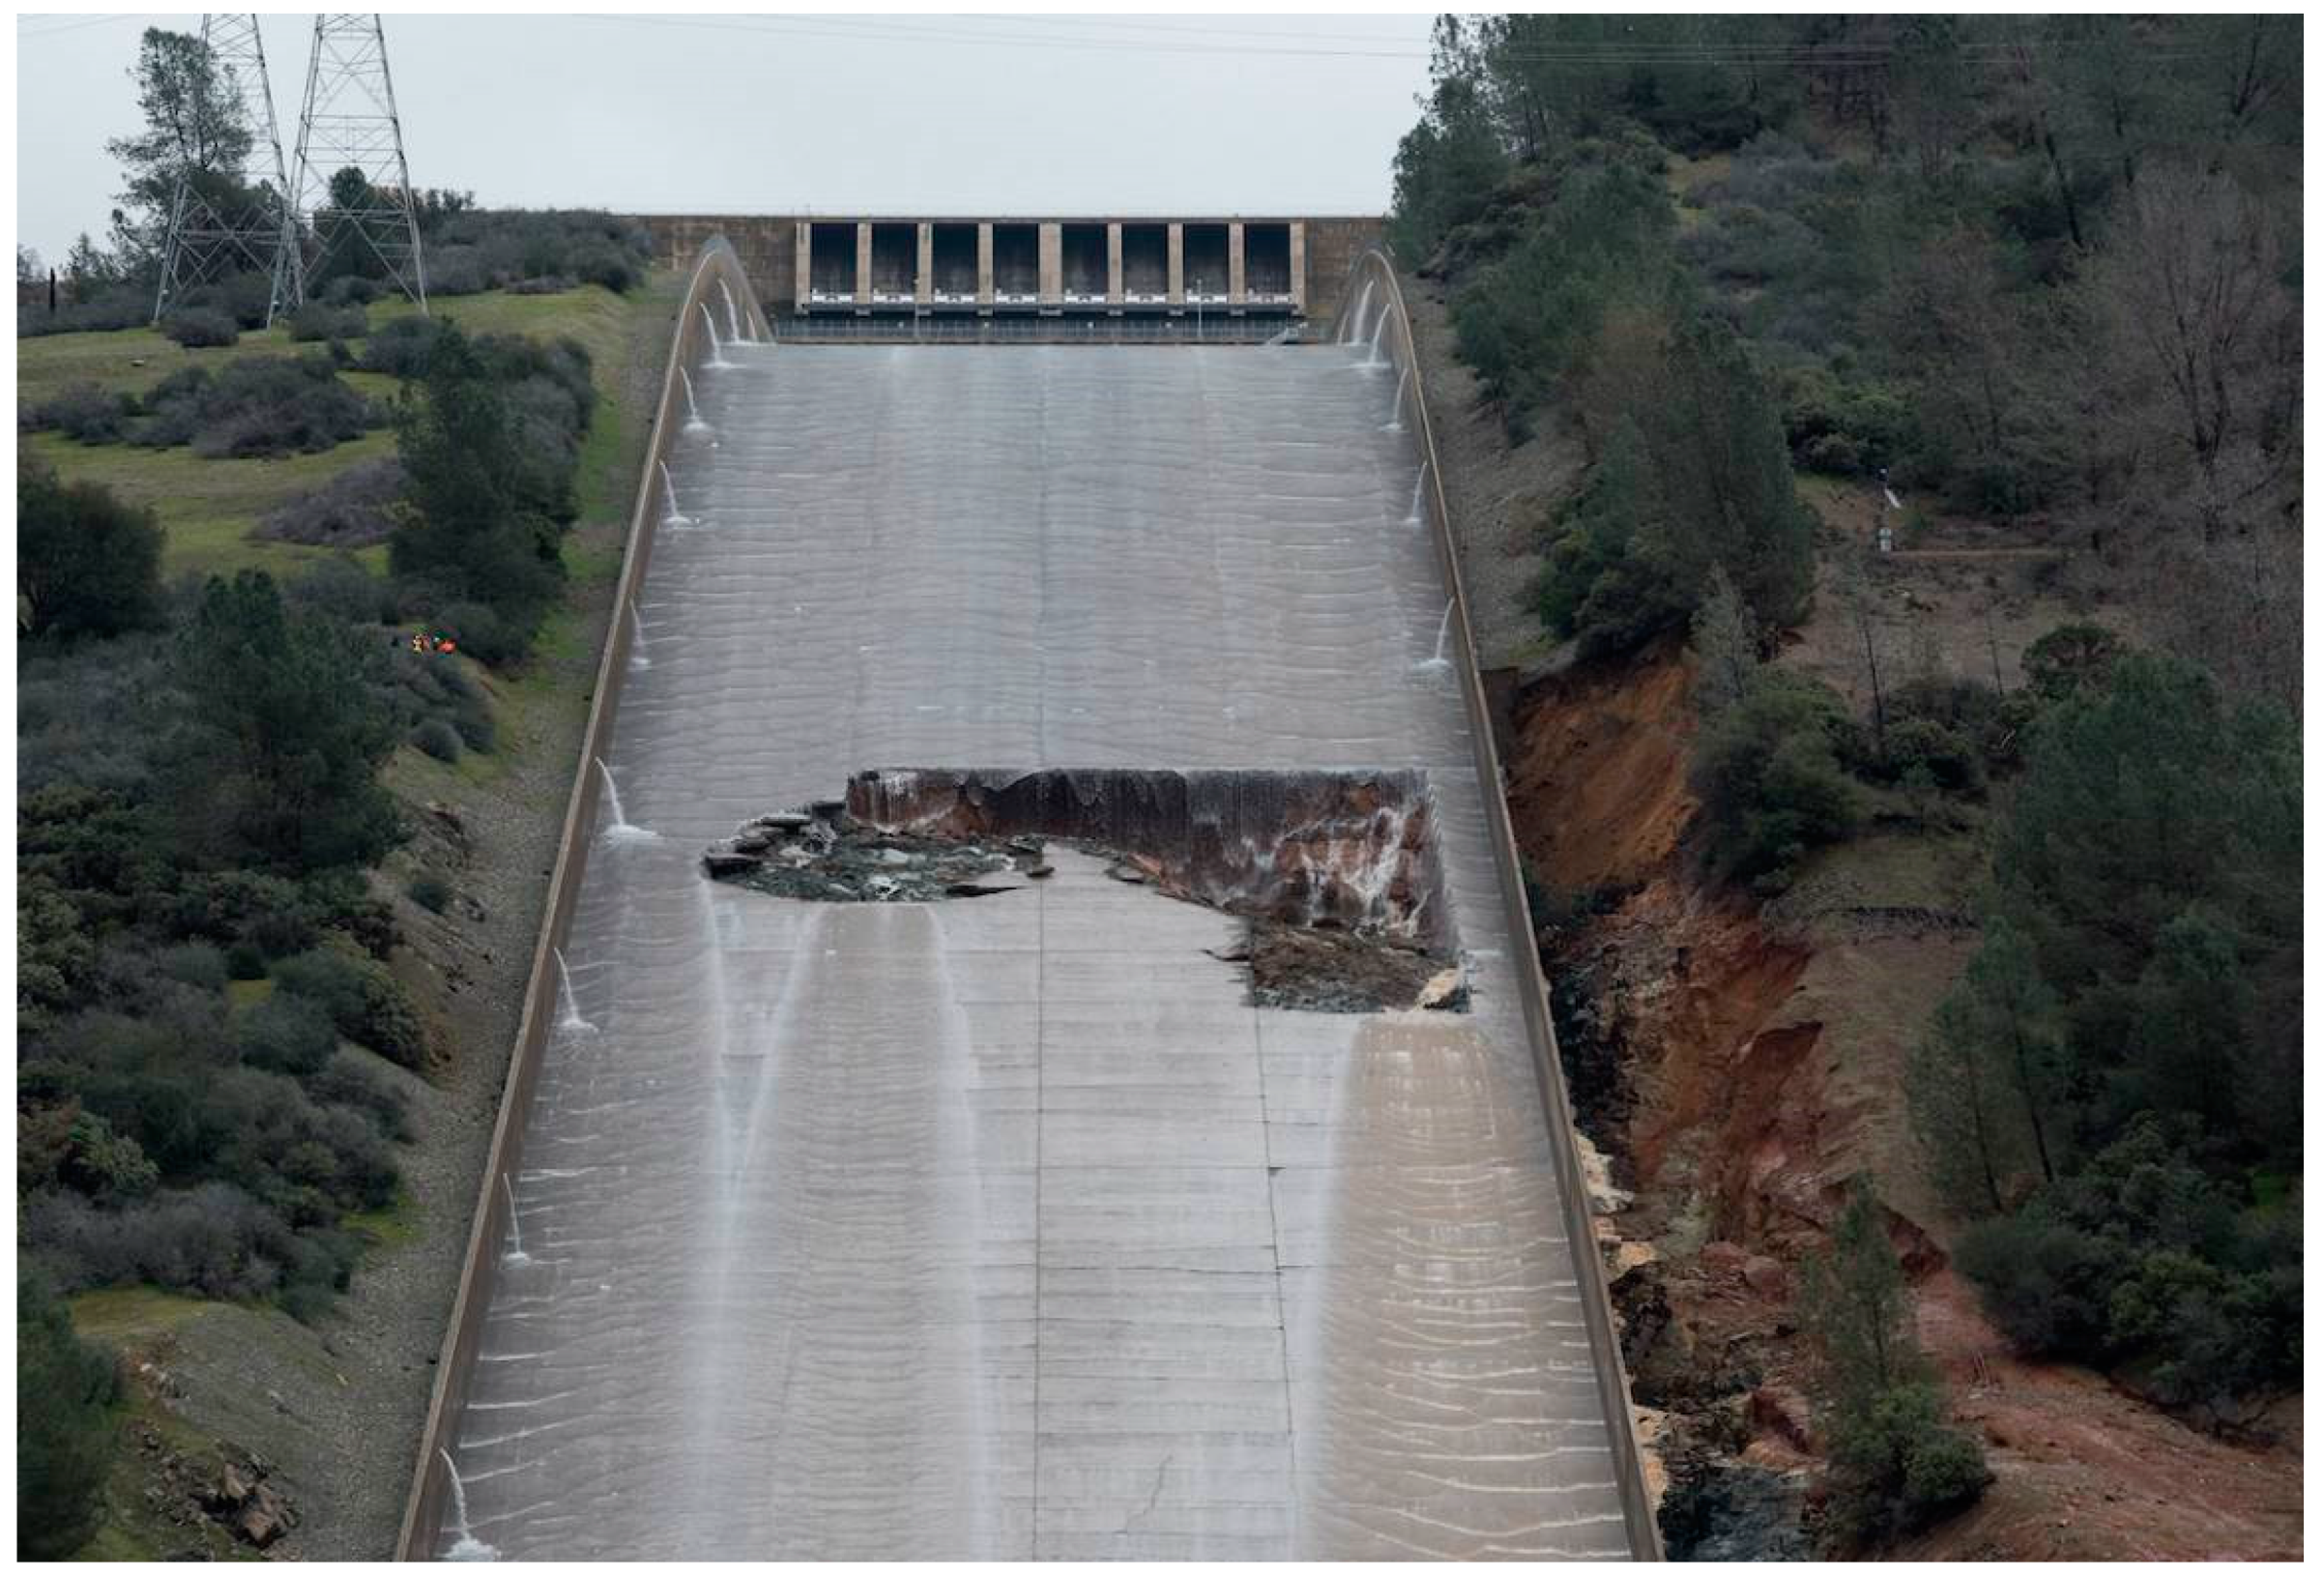
3/s. However, the next day, February 7, at approximately 10:00 a.m., workers at the Oroville Dam site noticed a discoloration in the water flowing through the main spillway. Outflow from the main spillway was immediately halted, in order to detect the source of this discoloration, revealing a large hole in the main spillway chute, seen in
Figure 2.
At this point, the main spillway is already severely damaged, and any discharges at that point would rapidly amplify this erosion and move entire parts of the concrete chute and walls downstream. However, Lake Oroville’s surface elevation is already past the flood control minimum, and inflows from the February rain storm are imminent. After brief consultation with various dam safety agencies, the operators decided to release test flows into the main spillway and monitor the damage. These small flows ranged hourly from around 300 m3/s to 900 m3/s over the course of February 8. On the very next day, February 9, the hole in the main spillway had increased in size.
A worrying aspect of the spillway damage is that it was moving uphill. This is a typical sign of a failure known as headcutting (or undercutting), which is what happens when water flowing across a hard surface falls onto a softer surface below.
With the ever-increasing inflows dangerously raising the reservoir surface level, which is already above the minimum flood control elevation, there was no time to quickly repair the main spillway. At this point, the Oroville Dam operators were facing a tough dilemma; either continue to release flows through the already damaged chute and cause further erosion, or risk using the untested auxiliary spillway. However, as the latter structure is ungated, if unchecked the dam itself would make that choice for them, as water would flow over the emergency spillway as soon as the surface elevation surpassed its crest, at 274.62 m. As such, a plan was formulated to continue letting small flows pass through the main spillway, while also preparing the area around the auxiliary spillway in case it would have to be put to use. To that end, workers began clearing the area downstream of this secondary structure, as well as placing large rocks at its foot to mitigate possible erosion. At this point, the inflows into Lake Oroville increased tremendously, reaching the aforementioned peak of 5392 m3/s. On February 11, at 8:00 a.m., surface elevation at Lake Oroville surpassed that of the emergency spillway crest, meaning that for the first time in the dam’s history, water would pour over it. According to data from CDEC, water poured over this ogee weir for just over 37 h in total, as the surface level dropped below its crest elevation again on February 12 at 21:00 p.m.
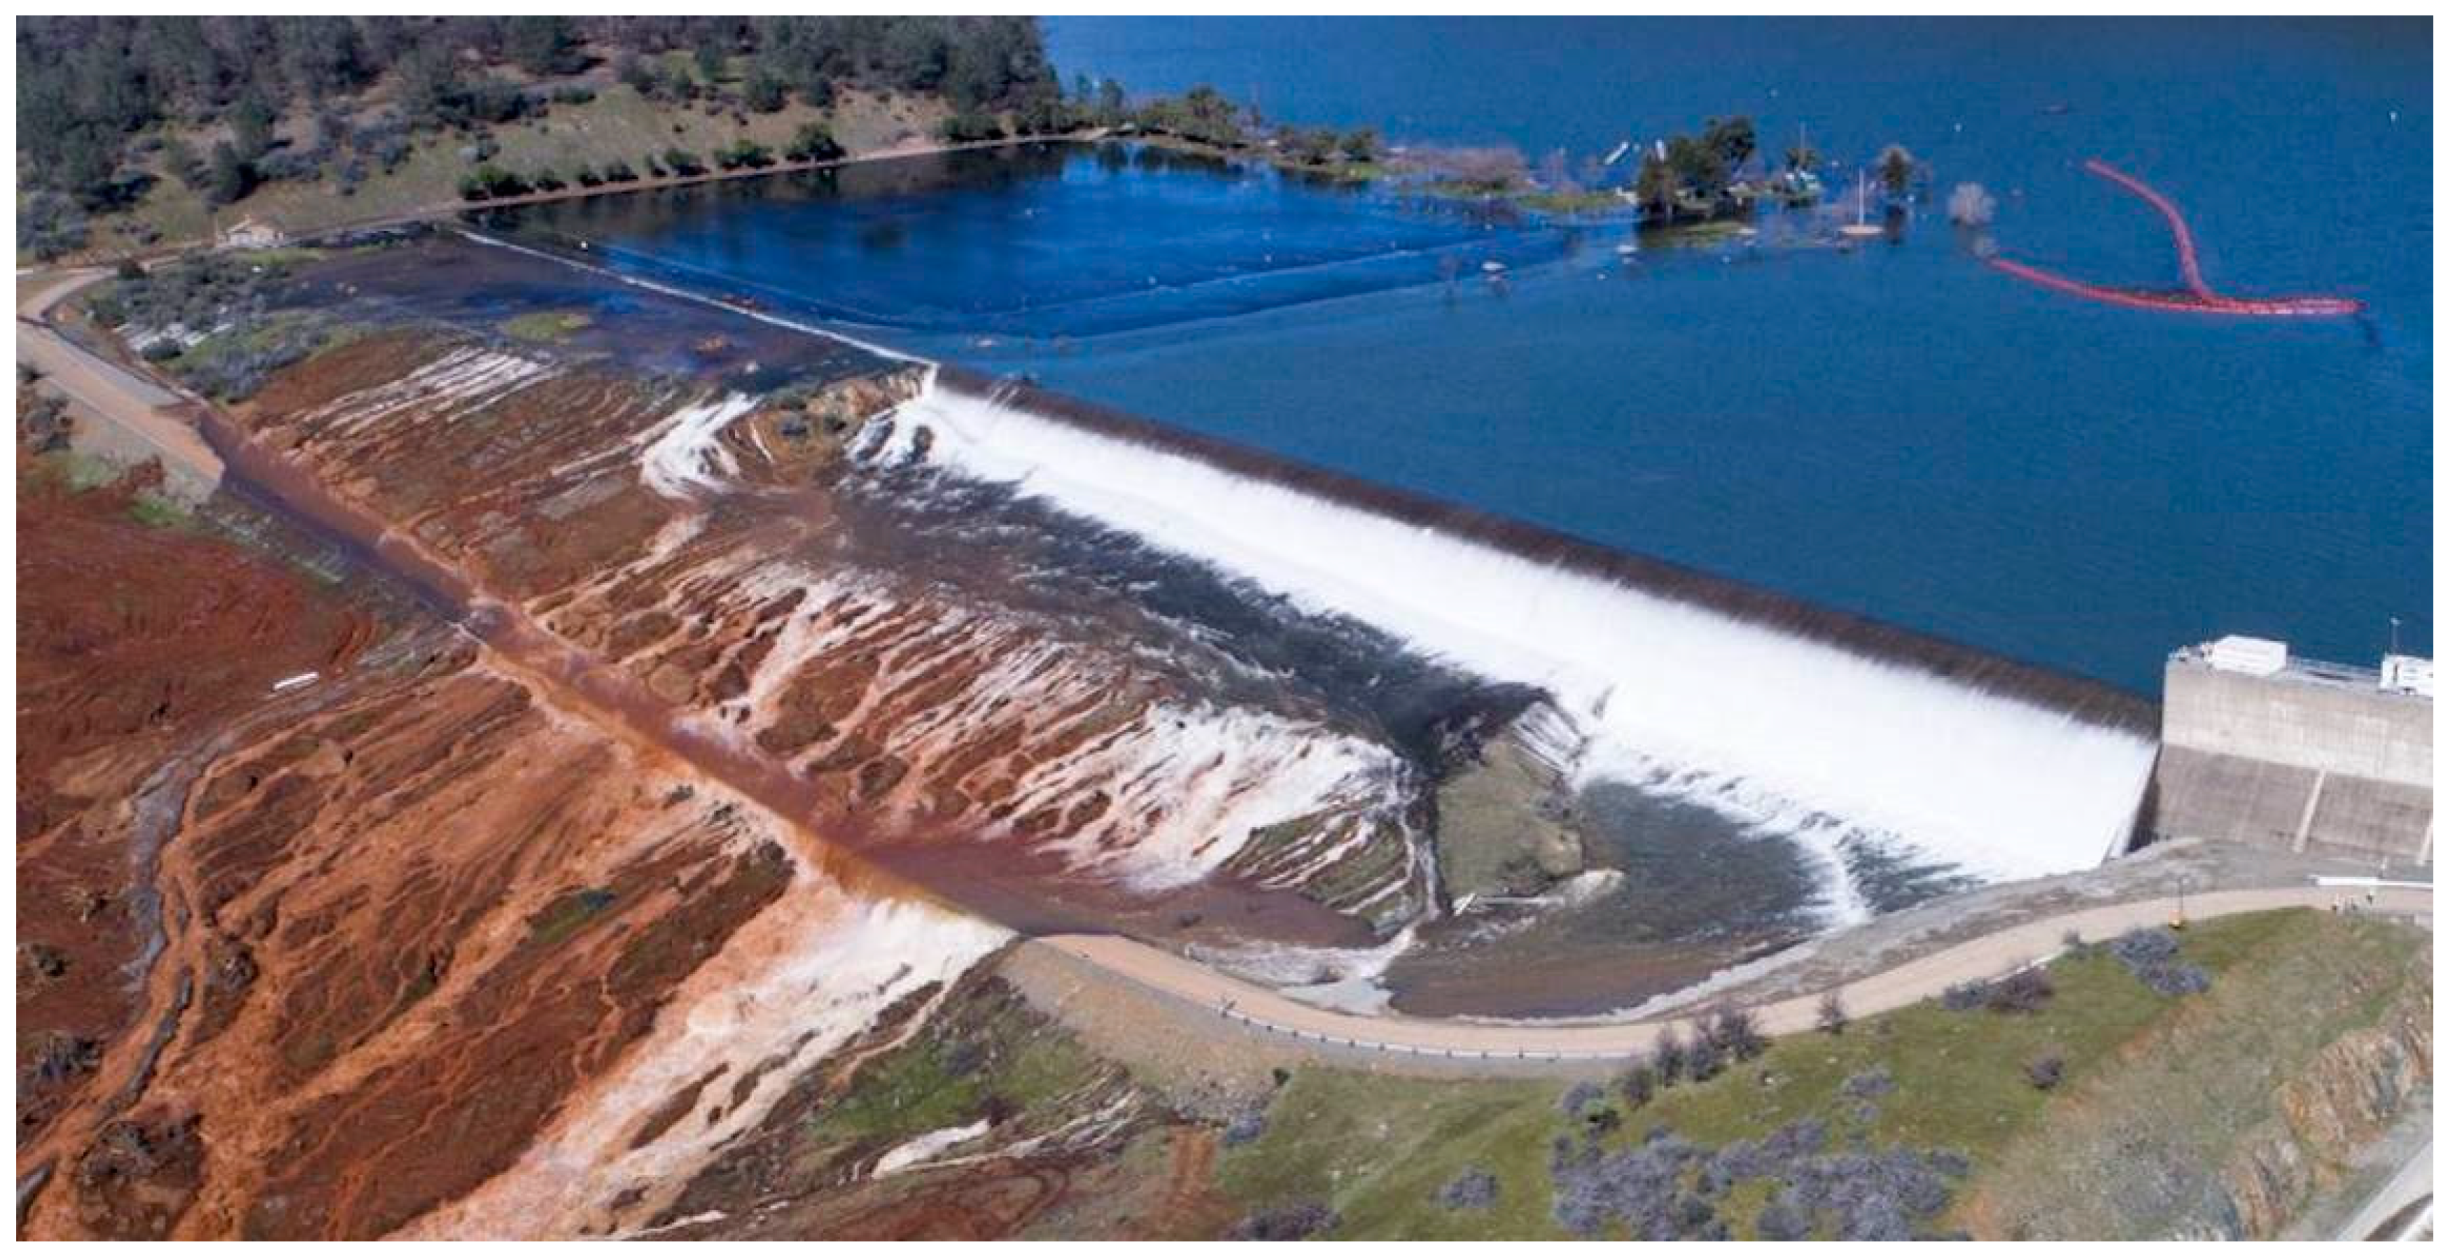
A noticeable fact is that there is a parking lot just next to the emergency spillway, which is at a lower elevation, and thus is flooded by design whenever water pours over the weir. Furthermore, an access road located just below the structure was also subsequently flooded and quickly destroyed, as seen in
Figure 3.
Unfortunately, erosion downstream developed much more rapidly than anticipated. While the emergency spillway was only active for a very brief duration, and peak discharge did not exceed 400 m3/s; large boils occurred downstream, destroying the access road below and threatening to damage the spillway crest itself by failure due to headcutting. The exact extent of the damage was not clearly visible when water was still pouring over the downstream hill on February 12, however, and thus local authorities, fearing the worst outcome, were forced to spring into action and order the evacuation of Oroville and other areas downstream of the dam, including Yuba City and Marysville. The California Department of Water Resources responded to the evacuation order by immediately increasing outflow releases from the main spillway to 2830 m3/s. This would drastically lower the surface elevation and stop flows over the emergency spillway and any resulting erosions there, at the cost of causing irreparable damages to the main spillway. Luckily, despite the conditions, the upper portion of the main spillway was able to release these discharges without causing further upstream erosion. However, the hill downstream of the initial hole would be quickly eroded away from high velocity flows.

 ,
, 


