Frost Resilience of Stabilized Earth Building Materials


1
Department of Earth Sciences, University of Oregon, Eugene, OR 97403, USA
2
Environmental Studies Program, University of Oregon, Eugene, OR 97403, USA
*
Authors to whom correspondence should be addressed.
†
These authors contributed equally to this work.
Geosciences 2019, 9(8), 328; https://0-doi-org.brum.beds.ac.uk/10.3390/geosciences9080328
Submission received: 1 July 2019
/
Revised: 21 July 2019
/
Accepted: 23 July 2019
/
Published: 26 July 2019
(This article belongs to the Special Issue Geoscience of the Built Environment 2019 Edition)
Abstract
:Earth-based building materials are increasingly valued in green design for their low embodied energy, humidity-buffering ability, and thermal stability. These materials perform well in warm dry climates, but greater understanding of long-term durability is needed for successful adoption in colder and/or wetter climates. The presence of stabilizers dramatically improves resistance to surface erosion from wind and rain, compared to unstabilized adobe and cob counterparts, and the influences of soil composition, fiber type, and diverse binders, on rain and wind surface erosion have been investigated in detail. Frost and freeze-thaw resistance, however, have been less well-studied, despite strong interest in stabilized earth materials in northern North America, Europe, and Asia. In particular, recent studies have relied on a widespread misunderstanding of the mechanism by which frost damage occurs in porous materials that will impede efforts to create valid models for material design and improvement. In addition, the influence of radiative thermal stresses on wall surfaces has been overlooked in favor of focus on ambient air temperatures. Here, we apply contemporary understanding of cracking by segregated ice growth to develop a macroscopic damage index that enables comparison between performance of different materials subject to different weather patterns. An examination of predicted damage patterns for two stabilized earth building materials and two conventional materials in twelve cities over two time periods reveals the dominant factors that govern frost vulnerability. We find that the frost resilience of earth building materials is comparable to that of the conventional materials we examined, and that assessments that neglect expected variations in water content by assuming full saturation are likely to yield misleading results. Over recent years, increased winter temperatures in several cities we examined predict reduced material vulnerability to frost damage, but we also find that accompanying increases in humidity levels have made some cities much more vulnerable.
1. Introduction
Earth and fiber mixtures stabilized with lime, slag, or cement create building materials that require considerably less production energy than concrete or kiln-fired bricks. In part, they require less cement (typically 6–8% by weight, compared to 10–15% for concrete [1,2,3]), which nevertheless remains the principal contributor to embodied energy and greenhouse gas emissions associated with these materials [3]. If local subsoils are used, they also require less transportation energy, and none require heat treatment [4,5]. Efforts to reduce cement use further through substitution with fly ash [6,7], ground granulated blast-furnace slag [8], and/or fibers [9], as well as tailoring of cement content to specific soil mixes [10,11], are also yielding progressively more environmentally benign forms. Stabilized earth materials are also desirable for their abilities to buffer indoor relative humidity, maintaining it within ranges consistent with comfort and respiratory health [12,13], and for their thermal inertia, promoting indoor temperature stability [14,15,16].
The prospect of lowering a building’s life-cycle environmental impact gives earth materials great appeal in green design: as energy codes demand greater heating, cooling, and lighting efficiency, e.g., [17], the energy consumed and emissions associated with material production account for larger proportions of the total [18,19,20], especially if the materials are sufficiently durable to provide long building lifetimes [21]. Indoor environmental health is likewise an area of growing interest, e.g., [22]. Development of earth materials for contemporary buildings has therefore become a subject of intense investigation in diverse climates, including cool, rainy areas in which durability is a significant concern, e.g., [23,24,25,26,27,28,29,30]. Northern European countries, in particular, have aggressive greenhouse gas reduction targets that they hope to meet in part by reducing or replacing concrete and fired clay bricks in buildings, e.g., [31,32,33]. Traditional forms such as adobe, cob, pisé, and mud plasters gradually crack and erode with exposure to wind-driven rain and freezing temperatures; however, compromising their structural integrity and necessitating ongoing maintenance [34,35,36], as well as limiting their acceptance in contemporary building codes, e.g., [36,37,38]. As a result, stabilizing binders are viewed as essential in moist climates, despite the desire to avoid them, for their ability to provide long-term compressive and shear strength, e.g., [2,39] as well as durability to internal wicking of moisture and surface erosion, e.g., [40,41].
The resistance of these stabilized earth materials to repeated cycles of freezing and thawing has not yet been widely explored, however. In cold and cool climates, this is of particular interest because the frost-related deterioration of historic earth buildings is well documented, e.g., [42,43,44], and changing climate patterns are expected to increase future freeze-thaw stresses in some locations by increasing the frequency of thawing and/or of winter rain, e.g., [45,46].
As hygroscopic porous media, earth materials contain networks of partly interconnected pores and capillaries into which water can enter either as vapor, from the atmosphere, or as liquid water from a wet surface. If this water freezes, the resulting ice can exert stresses on pore surfaces that are large enough to propagate cracks and cause frost damage. While the expansion accompanying the initial water-to-ice phase change can generate large stresses [47], several lines of evidence suggest that this intuitive mechanism is of limited importance for frost damage. A central limitation concerns the modest magnitude of the volume change on freezing, since this constraint would imply that initial water saturations greater than 90% would be needed to exert substantial stresses against pore walls (rather than simply compressing residual air pockets). However, frost damage to stone is commonly observed at much lower total water contents, e.g., [48,49], and experiments demonstrate expansion of porous media that are saturated by pore liquids that contract upon freezing [50,51]. Further evidence comes from studies that document an absence of activity near the freezing point followed by significant cracking only once the temperature drops substantially, e.g., [52,53], and material expansion that takes place when porous media below the ice melting temperature are warmed toward that melting temperature, e.g., [54]. All of these observations are consistent with a central role for “cryosuction”, or the attraction of liquid water toward freezing centers, to supply water for continued ice growth that propagates cracks ([53,55]). As a result, both the frequency of fluctuation of a material through a temperature range that alternately facilitates the redistribution of water for “segregated” ice growth and promotes freezing, and the supply of water at the surface through rain or condensation, are risk factors of interest.
The phenomenon of cryosuction-supplied crack propagation is familiar in soils as the ground expansion known as “frost heave”. In cohesive media, detailed theoretical analysis of ice formation in individual, isolated flaws has revealed factors controlling the initial elastic phases of deformation, followed by the unrecoverable crack propagation that constitutes frost damage, e.g., [56,57]. At much larger scales, interest in the long-term impact of frost damage on alpine and polar landscapes, e.g., [58,59,60,61,62] has led to the development of macroscopic frost-cracking indices [63,64,65,66,67]. Although the analogy between frost heave in soils and frost damage in cohesive media like stone and concrete has been recognized, theoretically formulated, and experimentally validated [68], the building materials research literature shows only sporadic awareness of this body of work, e.g., [69,70]. Instead, the stated or implied assumption that material pore spaces must be virtually saturated with water before frost damage can occur, and accordingly that entrained air can protect a material from frost damage by providing space into which ice can expand, persists in both theoretical and experimental work, e.g., [71,72,73,74,75], as well as in standard tests of building materials, e.g., [76,77]. To strengthen the bridge between these fields, we apply the understanding of cryosuction-fed frost damage to the question of frost resilience of stabilized earth building materials in cities with cold, wet, and changing winters where people have ambitious goals for building life-cycle energy reduction, revealing excellent potential for long-term durability in comparison to conventional building materials under realistic field conditions.
2. Methods
2.1. Theoretical Development
Our analysis begins with a brief overview of the micro-mechanics of frost damage by segregated ice growth. To assess the susceptibility to damage of different materials under different climate forcings, we use an index that was developed initially to approximate the freezing-induced porosity changes that accompany cracking under saturated (i.e., air free) conditions [67] and adapt it to address the unsaturated conditions that are expected to be more relevant for buildings. Next, we summarize the controlling parameters and properties that are needed to describe the evolution of pore phase distribution in several building materials and characterize their response to ice growth. Finally, we describe our modeling procedures for assigning environmental forcing in several cities and two time periods, as well as for generating time series of material temperature and moisture contents. A summary of nomenclature is provided in Table A1.
2.1.1. Ice Segregation and Frost Damage
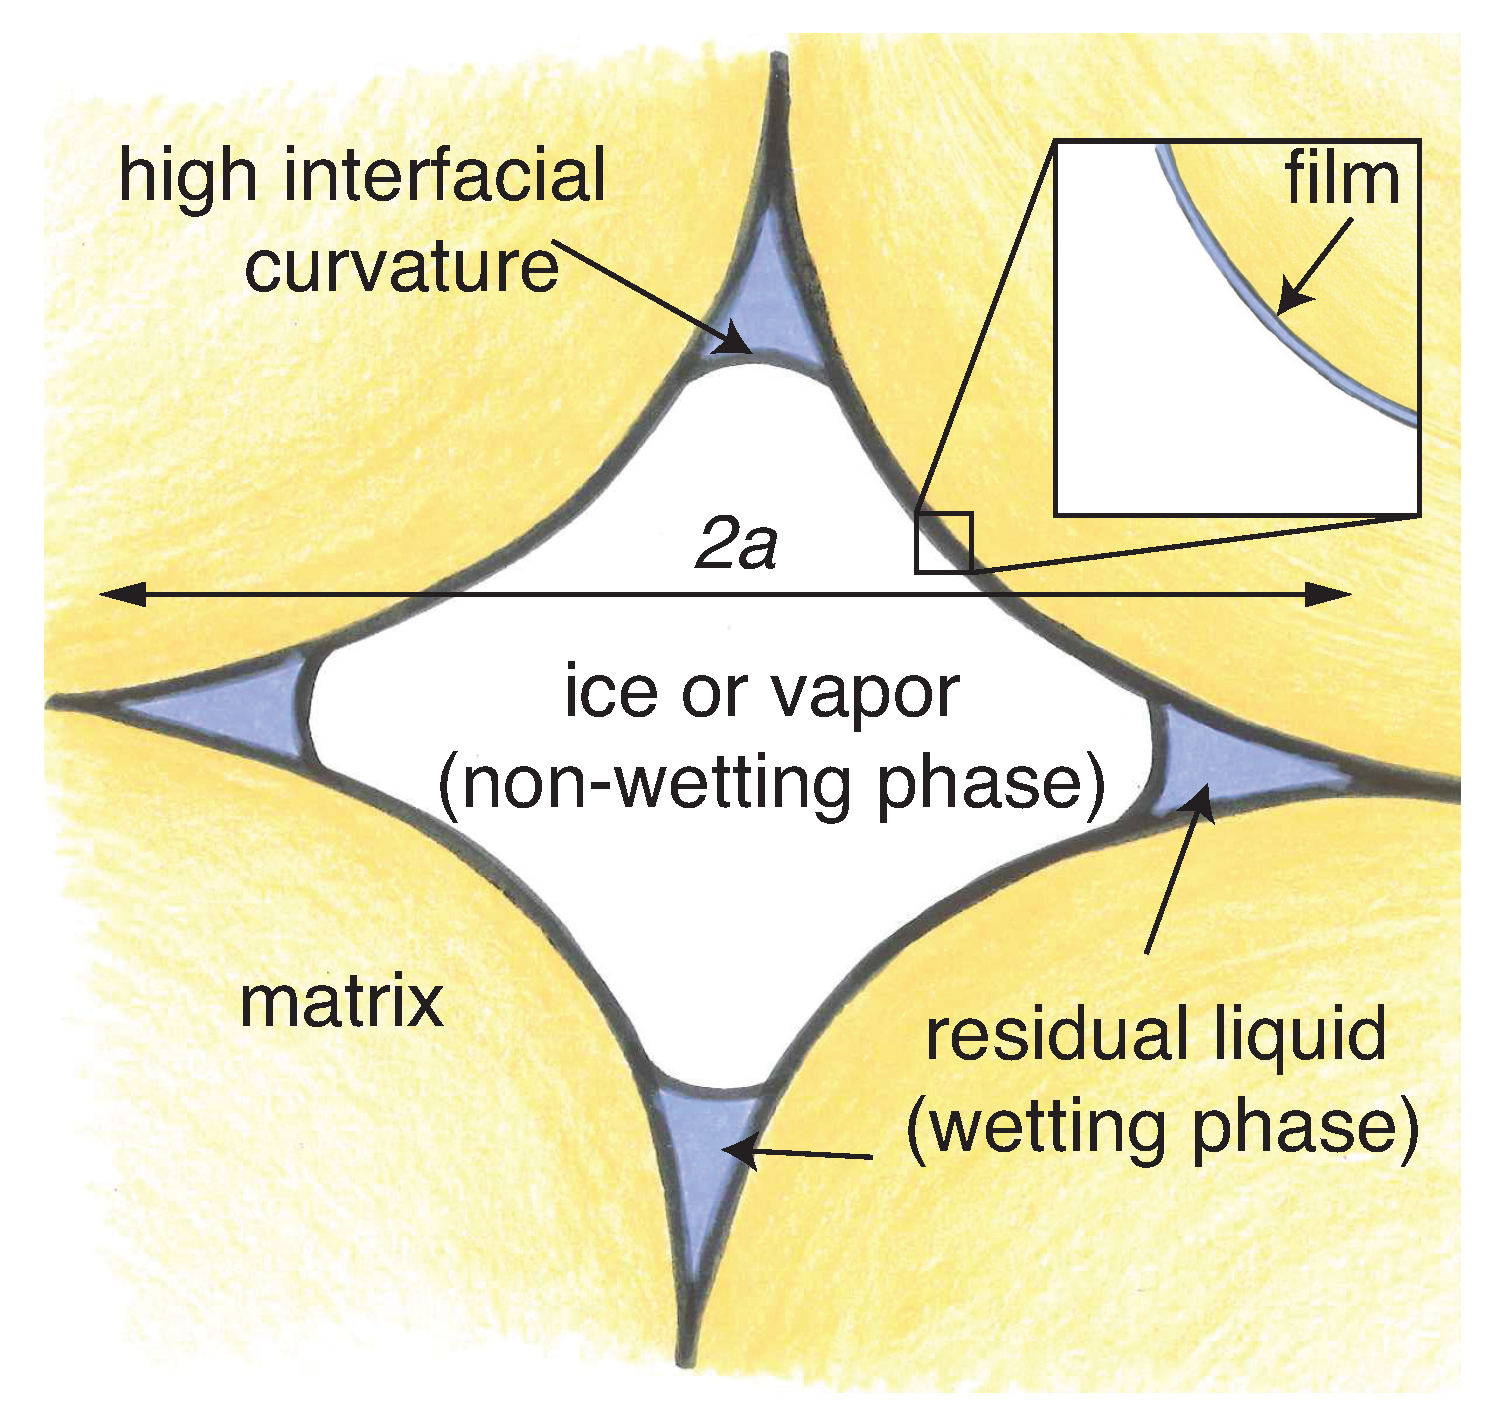
The damage caused by ice formation depends in part upon the influence of pore characteristics on phase equilibria. Figure 1 illustrates the typical pore-scale distribution of phases, with liquid water wetting matrix surfaces and collecting in crevices that are bounded by highly curved interfaces with the non-wetting ice or vapor phase that occupies central pore regions. The surface energy of the phase boundary and the wetting interactions that maintain liquid films give rise to a pressure difference between the ice (or vapor) and the liquid, e.g., [78,79]. This pressure difference increases as the volume of residual liquid is diminished, both by thinning the wetting films, and by further increasing the interfacial curvature bounding crevice reservoirs.
In unsaturated systems, the vapor phase tends to form connections with external air, thereby remaining at atmospheric pressure and resulting in sub-atmospheric liquid pressures (i.e., matric potentials) that cause liquid content to depend on relative humidity, as described by the material’s moisture retention curve, e.g., [80,81,82]. In contrast, when pores are occupied solely by water and ice, fluid connections typically maintain the more mobile liquid phase at a pressure that is reduced only slightly below exterior levels, so that the pressure transmitted by the ice against pore walls must increase dramatically as the liquid saturation is diminished. The generalized Clapeyron equation, e.g.,Wettlaufer, J. et al. [83] describes how the difference between the ice and liquid pressures grows as the temperature T drops further below the normal melting point , promoting ongoing freezing at the expense of the shrinking liquid content. In analogy with the moisture retention curve, the partitioning between liquid water and ice can be described by a temperature-dependent freezing curve, e.g., [84,85,86].
Building upon these pore-scale thermodynamic constraints, a central remaining ingredient of frost damage micro-physics can be framed in terms of linear elastic fracture mechanics: the stress intensity factor increases with the ice-matrix pressure and crack growth takes place as a critical value is approached that depends on the strength of mineral bonds. The incipient crack geometry enters the problem, notably with the stress intensity factor increasing roughly with the square root of the longest dimension (labeled in Figure 1), e.g., [87]. Finally, hydrogeology also plays a role since significant frost damage requires that crack extension be supplied by liquid transport; this can be described using Darcy’s law with a temperature-dependent permeability that drops monotonically as the temperature is reduced and solid ice clogs an increasing fraction of the pore space, e.g., [56,57,68].
The pore scale behavior just described produces appreciable frost damage on macroscopic scales only when the temperature is cold enough for the ice pressure to wedge open cracks while the permeability to liquid flow remains high enough to supply ice growth. These considerations give rise to the “frost-cracking window” of temperatures (typically in rocks [63]) under which most frost damage is observed to take place. Several practical indices have been designed to predict frost damage severity based on weighted integrals of the time spent within such a predefined temperature range [63,64,65,66]. For the present application, an understanding of the controls that material properties exert on how frost damage accumulates requires an assessment that is more closely tied to the micro-mechanics of frost driven crack growth and rooted explicitly in physical parameters that can be measured or inferred. To gauge relative severity under air-free conditions, Rempel et al. [67] reasoned that the degree of frost damage should scale approximately with the predicted change in porosity that accompanies changes in water supply with depth z (necessitated by gradients in the temperature-dependent permeability) while the temperature remains below a threshold that is sufficiently cold for ice pressures to propagate cracks that contribute to the additional pore volume. Mechanical considerations imply that should be colder for host materials with higher fracture toughness, and become closer to with increases in the size of the largest ice-occupied pores. Since the hydrodynamic pressure gradients that drive liquid flow are proportional to the temperature gradient, while the ice-bound permeability is a monotonic function of temperature that can be approximated by a power law, the net porosity change over a sequence of time periods with can be written as [67]
Here, in addition to the permeability exponent , and the temperature threshold for crack extension , the controlling water transport parameter
is defined in terms of the water density kg/m, the latent heat of fusion J/kg, the liquid-saturated permeability , the absolute melting temperature K (i.e., C), the temperature at which ice first reaches equilibrium in the pore space and begins to restrict liquid flow , and the liquid viscosity Pa s. The dependence of on the squared temperature gradient in Equation (1) suggests the likely mechanism behind northern hemisphere observations that frost damage to the built environment is often concentrated near the exterior surfaces of south-facing walls, which are typically subject to the largest magnitude heat fluxes (and hence temperature gradients) as a result of enhanced radiative forcing [42,88]. The inverse dependence on a greater-than-linear power of the temperature offset below melting arises from changes in the permeability to liquid supply, and reflects the observed tendency for frost damage to diminish at very cold temperatures. These restrictions on liquid supply set the effective lower temperature limit of the frost-cracking window.
In the Results and Discussion section below, we interpret the predictions of Equation (1) in terms of the patterns of frost damage that are expected in different building materials and climates. It is important to recognize, however, that the assumption of complete initial water saturation that underlies the derivation of Equation (1) [67] can cause this approach to produce overly pessimistic assessments of frost resistance. When the entire pore space is water filled (a condition that is approximated by many common freeze-thaw testing procedures, e.g., [48,89,90,91]) the cracking threshold marks conditions where the stress intensity factor in the largest pores approaches a critical value. However, in the common case where only limited moisture infiltration takes place, the largest pores tend to contain residual air and fill with water last, so that ice can only grow and exert high pressures on the walls of smaller pores. This reduces the effective cracking threshold to temperatures lower than that enable the higher ice pressures needed to propagate smaller cracks, raising the potential for the frost damage index under unsaturated conditions to fall well below .
Previous efforts to assess the propensity for frost damage in the built environment have met with qualitative success by integrating the time spent within the frost cracking window while giving preferential weight to the periods following recent precipitation events, e.g., [92]. A similar approach towards investigating frost damage to alpine rock walls was followed by Rode et al. [93], who tracked near-surface moisture content and evaluated a frost cracking index that was also based on the integrated time spent within the frost cracking window, while including only those periods during which the moisture content exceeded a threshold. The physical balances that determine an approximate moisture content threshold for frost damage must depend on material properties. Here, we model water exchange with exterior surfaces following [94,95] and account for the expected sensitivity to water content of the effective threshold temperature for unsaturated cracking , basing our treatment on changes in the sizes of the largest water-filled pores anticipated from the form of the moisture retention curve, as outlined next. The time dependence that changes in moisture content introduce to , and hence the integration bounds on Equation (1), constitutes the adaptation to the saturated frost damage index needed to define an analogous frost damage index that is appropriate for unsaturated conditions. To our knowledge, this is the only macroscopic index of unsaturated frost damage that has been developed and expressed solely in terms of physical properties and environmental controls that can be measured or inferred through independent means. It is worth mentioning that in unsaturated subfreezing conditions the relative permeability to liquid flow may be reduced even more drastically than accounted for by the power-law treatment incorporated in Equation (1), thereby further lowering (i.e., this effect might be approximated in a more elaborate model by increasing the exponent or decreasing the reference permeability ); lacking firm empirical constraints, we neglect this complication, effectively producing a conservative assessment of improvements to frost resilience as the water content is reduced.
2.1.2. Frost Cracking Thresholds during Unsaturated Conditions
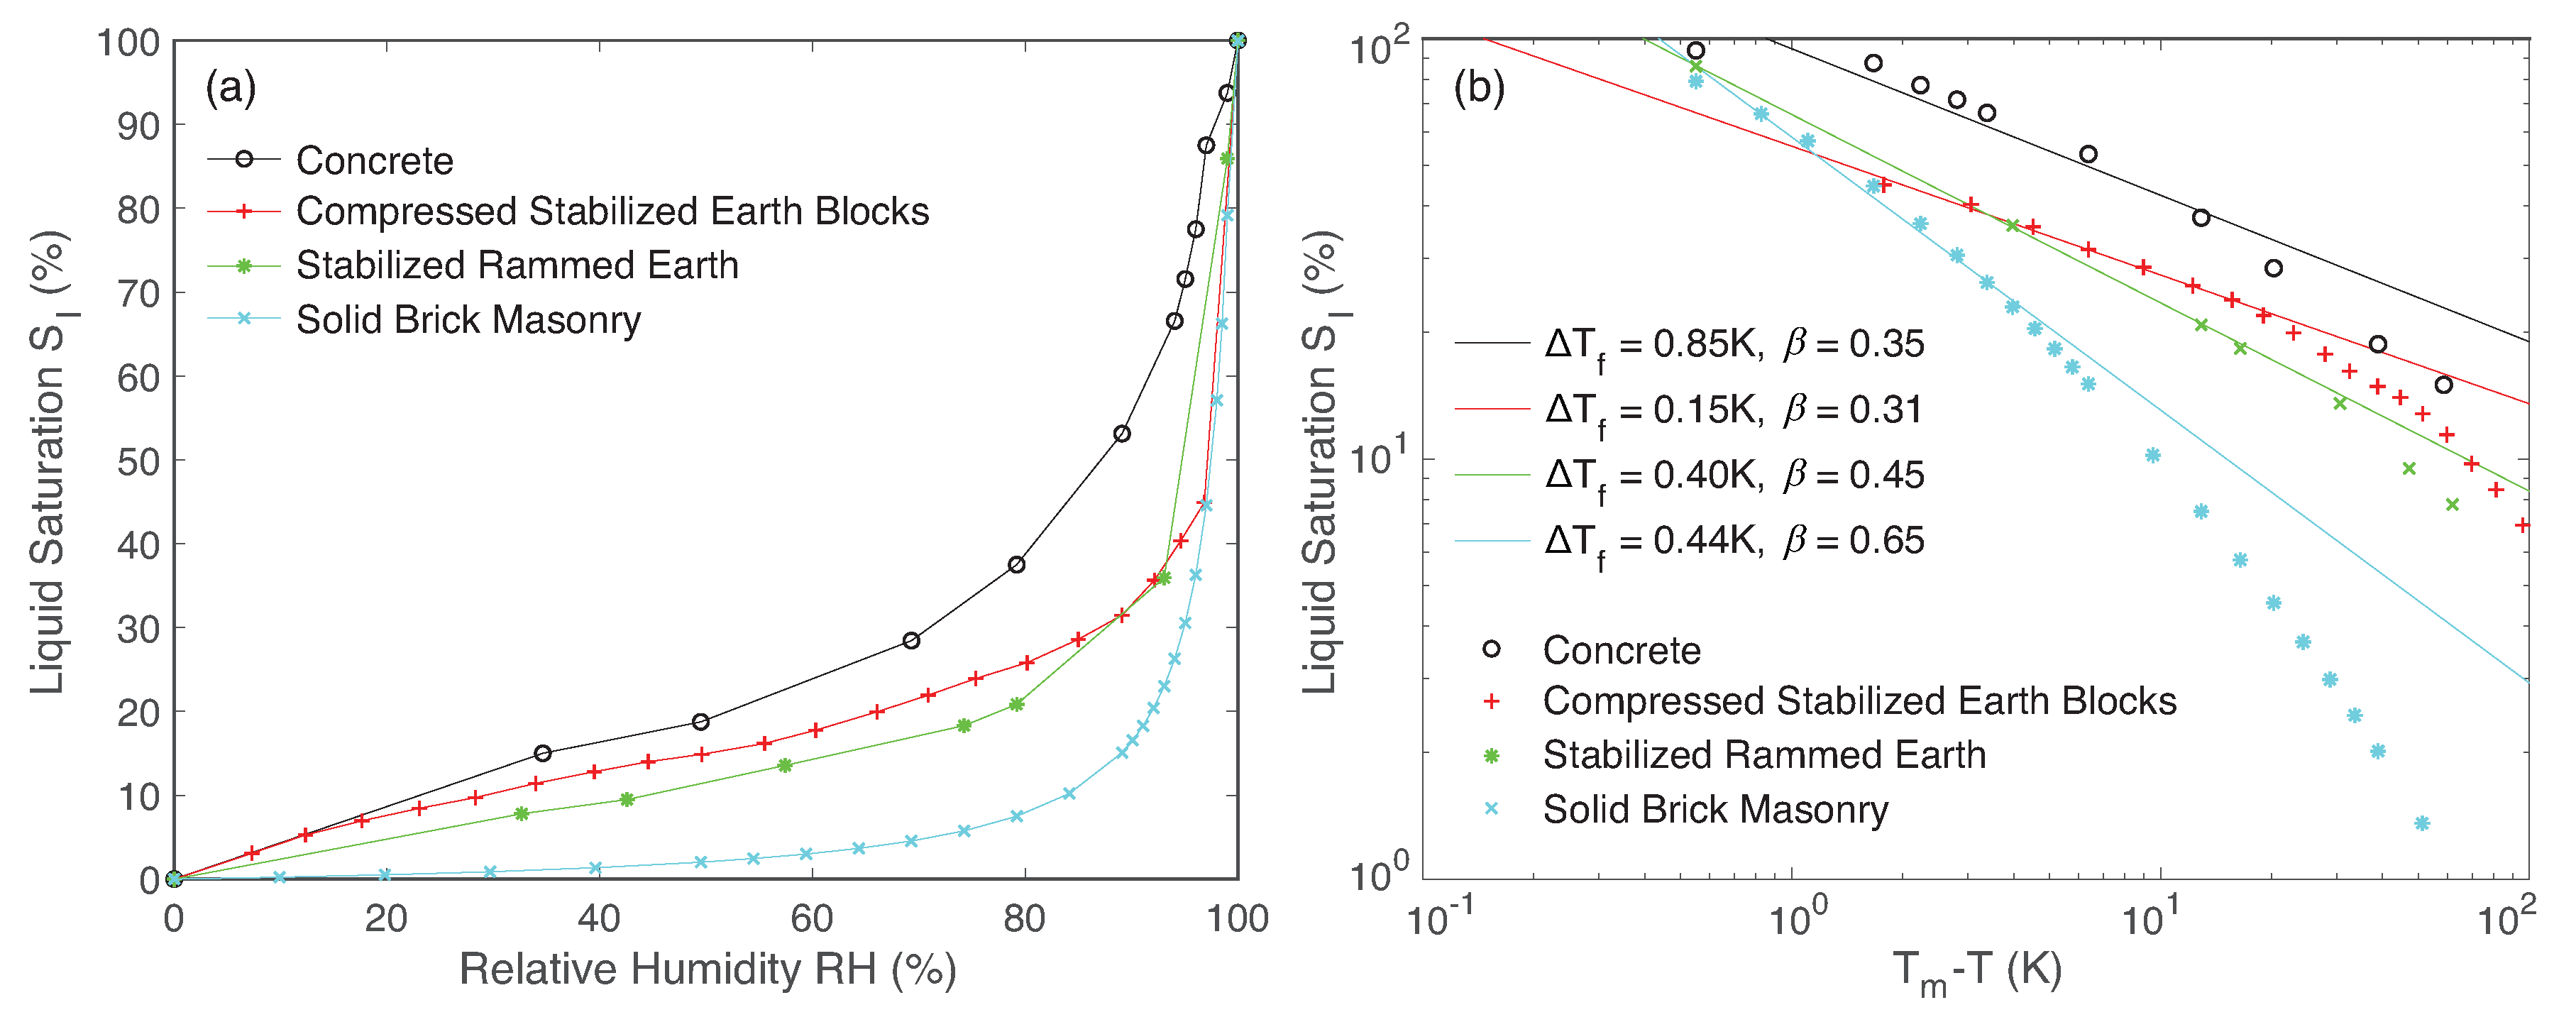
Figure 2a shows sample moisture retention curves measured for stabilized rammed earth [96], stabilized compressed earth blocks [13], solid brick masonry from the Fraunhofer database [97], and concrete from the Lund LTH database [97] (further material description follows in Section 2.2). Data of this general type are commonly used for studies of moisture uptake by building materials, e.g., [94,95], which can have important implications for modulating energy exchange, e.g., [81,98,99] and interior humidity variations, e.g., [13,100]. The exact form of the moisture retention curve depends on details of the pore size distribution, geometry, and surface chemistry; the data presented here derive from measurements on well-characterized sample materials under experimental conditions that are described in the source references. At low saturations, most liquid is adsorbed to matrix surfaces in films, whereas capillary condensation causes the crevice reservoirs depicted in Figure 1 to dominate the liquid volume at higher saturations. Hysteretic behavior is common, with the saturation at a particular relative humidity generally higher during drying than during liquid uptake. We neglect this complication here and report saturation values derived from measured liquid weights normalized to the weight of water that would saturate the pore space of each material (i.e., the product of water density with the total porosity ). Because experimental data acquired during liquid uptake is often affected by trapped air bubbles and does not achieve complete saturation once reaches unity, a common approximation in models of moisture suction and redistribution involves interpolation between experimental points and complete liquid saturation at , e.g., [95,97]. Though values of relative humidity greater than unity are fictitious, these moisture transport models have been shown to perform well during validation tests. As outlined below, however, for our purposes it is important that cannot exceed unity. Accordingly, to construct the moisture retention curves displayed in Figure 2a (from which we approximate total water content S as a function of modeled relative humidity ), we normalized reported experimental water mass values by and effective relative humidities by 1.01.
Measurements made on building materials to quantify changes in liquid saturation at equilibrium with ice under subfreezing conditions are not well represented in the literature, but moisture retention curves can be used to approximate the expected behavior, as follows. We first note the thermodynamic relationship between the relative humidity and the matric potential , which involves the gas constant J/(mol K), the absolute temperature under the measured conditions K, and the partial molar volume of water m/mol, so that
This gives the magnitude of the pressure difference across vapor-liquid surfaces, such as those illustrated in Figure 1. We expect most frost cracking to take place at relatively high liquid saturations so that liquid mobility remains sufficient to supply ice growth. The liquid content in this regime is dominated volumetrically by crevice reservoirs [78,101], suggesting that the difference between the ice and liquid pressures at a particular can be approximated by scaling the matric potential with the ratio of the ice-liquid surface energy to the vapor-liquid surface energy (see [85], for further discussion), leading to
The generalized Clapeyron equation is used next to convert this pressure difference to an equivalent offset from the bulk melting temperature, yielding
where the final approximation on the right comes from substitution of Equations (3) and (4). Please note that the condition must be enforced to ensure that . We used this expression together with the moisture retention curves from Figure 2a to generate the synthetic freezing curve data shown in Figure 2b. As a final step, to estimate the temperature at which ice can first nucleate, to extract further information on the changes in saturation with temperature for assistance with estimating the permeability exponent , and to provide a basis for estimating changes in with variations in total water content, we fit the high liquid-content data fraction (i.e., with %) to power laws of the form
which are illustrated with the straight lines in Figure 2b using the values of and given in the legend. Observed correlations between measured permeability and in ice-bound porous media suggest that the permeability exponent can be approximated as [85], with reflecting details of the residual liquid morphology; we adopt this correlation while assigning as a nominal value for the calculations that follow.
To derive a plausible relationship between the unsaturated cracking threshold and the saturated value , we first recall that moisture uptake tends to fill the smallest pores first and that the stress intensity factor increases with the square root of the incipient crack size. This suggests that should be sensitive to the dimensions of the largest pores in which liquid water can freeze. The constraints imposed by surface energy imply that the characteristic size of the largest pores in a given medium is inversely proportional to , so with the stress intensity factor approaching a threshold at the onset of cracking we anticipate that . When air fills the largest pores so that the total water content is less than unity, the onset of frost cracking is expected to involve smaller water-filled pores that first freeze at some temperature , suggesting that . The ratio of these expressions is an inverse power of the liquid saturation from Equation (6). Recalling the similarity between the geometry of the residual liquid phase during drying and freezing, depicted schematically in Figure 1, this suggests that the unsaturated cracking threshold temperature should scale as
Accordingly, to assess frost susceptibility in unsaturated conditions, we track changes in total water content S and revise , following Equation (7), as the time-varying lower integration limit for calculating , following Equation (1).
Clearly, it would be preferable to have direct measurements for each building material of the temperature at which frost cracking first begins in the unsaturated regime at several different initial water contents. To our knowledge, no such controlled experiments have been reported upon in the literature. Nevertheless, tying the estimate for in Equation (7) to parameters that are controlled by material microstructure gives some insight into the manner in which differing degrees of partial saturation are likely to affect frost resilience. For example, at a given total water content S, Equation (7) suggests that the reduction in experienced by different materials is likely to be proportionately greater for those with pore size distributions that produce smaller saturation exponents , as shown in Figure 3a, whereas the reduced water transport implied by the correlation between and the permeability exponent is likely a greater factor in limiting damage to unsaturated materials with higher values of . Recall that the power-law dependence on the temperature depression in the integrand of Equation (1) suggests that frost-driven porosity changes are most sensitive to conditions very near the onset of cracking. Accordingly, an approximate assessment of the relative sensitivity of , with air saturating all but fraction S of the pore space, in comparison to the fully saturated case , can be obtained from the scaling
where Equation (7) has been substituted to make the final approximation. The plot of the right hand side of Equation (8) in Figure 3b suggests that an order of magnitude reduction in the frost susceptibility of each of our chosen test materials takes place when the initial water content is reduced to the vicinity of 60–65%, in broad agreement with observational reports of a minimum threshold in water content for frost damage, e.g., [48,49]. We emphasize that the scaling in Equation (8) is approximate and that a more thorough assessment of must still rely on the history of temperatures and their gradients embodied in Equation (1). However, the similarity between predictions for the reduction in frost susceptibility with reduced water content in different materials could be interpreted as a mechanistic justification for simpler time-since-precipitation and moisture-threshold approaches, e.g., [92,93].
Extensive published reports on the results of mechanical tests provide guidance for assigning the saturated cracking threshold temperature for each building material that we consider. It is important to note that as with conventional masonry and concrete, the performance of different earth building materials will be affected by details concerning the particular constituents they incorporate and the preparation methods followed. Accordingly, while the property values adopted here are chosen to be representative, we anticipate considerable variation among similar materials of interest. Absent detailed measurements of incipient crack size populations and fracture toughness, we concentrate on the results of macroscopic tests. Direct measurements of the unconfined compressive strength of stabilized rammed earth tend to cluster around 1–3 MPa [27,102,103,104] though values ranging as high as 15 MPa or greater are also sometimes obtained [8,105]. Reported values for the unconfined compressive strengths of stabilized earth blocks tend to be somewhat higher, around 4–8 MPa [27,106,107,108], and again sometimes exceeding 10 MPa [108,109]. The micro-mechanics of frost cracking are consistent with a tensile failure mechanism, and bulk tensile strengths of these earth building materials are typically measured as approximately 10–20% of unconfined compressive strengths [27,103,110]. However, whereas in bulk testing configurations loads are applied over the entire material cross section, the fractional area over which stresses are applied to the most unfavorably oriented ice-bound cracks are expected to be considerably smaller. This suggests that values somewhat larger than measured bulk tensile failure stresses are likely to be most representative of the ice pressures exerted on pore walls during cracking. Given these considerations, for the calculations that follow we adopt values of based on estimated threshold ice pressures that reach 40% of measured unconfined compressive strengths. Applying the proportionality of MPa/K from the generalized Clapeyron Equation (5) to these strength estimates, for stabilized rammed earth we take C, and for stabilized earth blocks we adopt a nominal value of C. We view these relatively warm temperature thresholds, combined with the modest values of assigned following the arguments given above, as conservative estimates in that they should tend to promote assessments for that are larger than would be predicted by lower and higher values. For comparison, experiments provide support for a threshold cracking temperature in the quartz-cemented Berea Sandstone [53] of C, which has comparable mechanical properties to many concretes, e.g., [111]. Pakkala et al. [42] suggest that frost cracking in Finish concrete requires temperatures colder than C, but this should probably be interpreted as an unsaturated value. We adopt a more conservative estimate of C for concrete, which should facilitate direct comparison with previous work in geomorphology that has adopted this as the upper temperature limit to the frost cracking window, e.g., [63,64,65,66,67,112]. We take C for solid brick masonry, to better highlight the role of other controlling parameters in comparisons against the modeled behavior of earth blocks.
With and other relevant material properties and physical parameters defined, given a time series of wall temperatures and temperature gradients, calculation of the frost damage index relevant for saturated conditions using Equation (1) is straightforward. For unsaturated conditions, a time series of total water content S is needed as well in order to evaluate from Equation (7); this is then used as the time-varying upper temperature limit on the integral in Equation (1) to obtain the frost damage index that is relevant for unsaturated conditions. In the Results and Discussion section below, all reported values of and represent integrals over the time during each day when the temperature is lower than and , respectively.
2.2. Materials
Two well-characterized stabilized earth materials and two conventional materials were chosen to explore the implications of the model described above. The stabilized rammed earth of Allinson and Hall [96] was comprised of well-graded crushed ironstone quarry waste (0–40 mm) combined with more uniform grit sand (2–5 mm), as well as 7% by weight Portland cement. This cement incorporated a non-pore-blocking compound to retain the majority of the desirable vapor permeability while significantly reducing the capillary potential, i.e., the ability to absorb liquid from the surface. Compressed stabilized earth blocks, in turn, consisted of Wealden Clay mixed 1:1 with fine sand to yield a final clay particle content of 10–20%; the final particle-size distribution is shown in McGregor et al. [13]. The moisture retention curve shown in Figure 1 is based on measured values in earth blocks stabilized with 4% lime, which were nearly identical to measured values in earth blocks stabilized with 4% cement [113]. Earth block thermal conductivity was estimated from [114], which showed a close correspondence between bulk density and thermal conductivity, nearly independent of other factors. For comparison, a reference concrete from the LTH Lund database in WUFI Pro 6.3, “Concrete w/c 0,7” (indicating an initial water-to-cement ratio of 0.7) was chosen for its detailed moisture storage function; liquid suction and redistribution functions were then approximated as those of the similar Fraunhofer concrete, “C12/15” [97]. Reference values for solid brick masonry from the Fraunhofer database were used as well [97]. The liquid suction function reported for the solid brick masonry was also adopted for the earth blocks. In all cases, reference permeabilities at compete liquid saturation correspond with peak values extracted from the liquid distribution functions. The hygroscopic properties of these materials, as well as parameters assigned above, are summarized in Table 1.
2.3. Temperature and Moisture Time Series
EnergyPlus v8.7, an open-source building energy simulation engine incorporating heat and moisture transfer algorithms [115], was used to estimate pore-space relative humidity and temperature across walls of each material under realistic climate conditions. From these, frost vulnerability estimates were then derived. Supporting thermal zones consisted of 4 m × 4 m × 3 m structures defined with Euclid 0.9.3 [118], an extension for SketchUp Make [119], such that walls faced solar north, east, south, and west. All other objects (e.g., materials, constructions, simulation parameters) were specified directly in the IDF editor. Wall conditions were simulated with the Combined Heat and Moisture Transfer (HAMT) algorithm, based on the work of Kunzel and Kiessl that underlies WUFI Pro [95,97], creating twelve nodes spanning the 30 cm thickness of each wall at which values were reported. We note that the HAMT algorithm was developed initially to describe vapor and liquid transport above the freezing temperature, where it has been validated extensively; performance at subzero temperatures has been less thoroughly examined. In our analysis we focus on conditions nearest the exterior wall surface, where we anticipate that pore saturation predictions should be least vulnerable to any deficiency in the description of interior transport. Roofs and floors were simulated with the Conduction Finite Difference (CFD) algorithm, eliminating consideration of their hygroscopic behavior. Interior air temperatures were held constant at 20 C; outside air was introduced at 10 ACH to facilitate realistic representation of indoor relative humidity; and Site:Precipitation objects were used to simulate constant light rain or snow, causing surfaces to be wet at all times. To ensure that moisture equilibration was achieved before simulations began, a minimum of 100 warm-up days were used.
Weather files were chosen to represent climates in which earth buildings are of current interest and in which frost damage is a concern; while many of these have cold, moist winters (, ), drier () and milder () climates are also represented. Rain indicators were removed, where present, to preserve the precipitation uniformity provided by Site:Precipitation objects. Weather files, the years of data represented by each file, and the corresponding Köppen climate types as of 2006 [120], are shown in Table 2.
Below, we first present results based on earlier weather files, beginning as early as 1961 and extending as late as 2005, but often terminating in the 1990s (Table 2). To highlight potential consequences of climate change, we then show results obtained with later weather files, beginning in 2003 (Table 2). Where time series data for only a single month are shown, January was chosen because it was either the coldest or second-coldest month in all former and near-present weather files. Where data for three months are shown, the January-March interval was chosen because it included the coldest month (February) for Helsinki and Stockholm as well as a greater range of temperatures for all cities than was found in the interval of December-February.
3. Results and Discussion
3.1. Environmental Conditions, Material Properties, and Saturated Damage
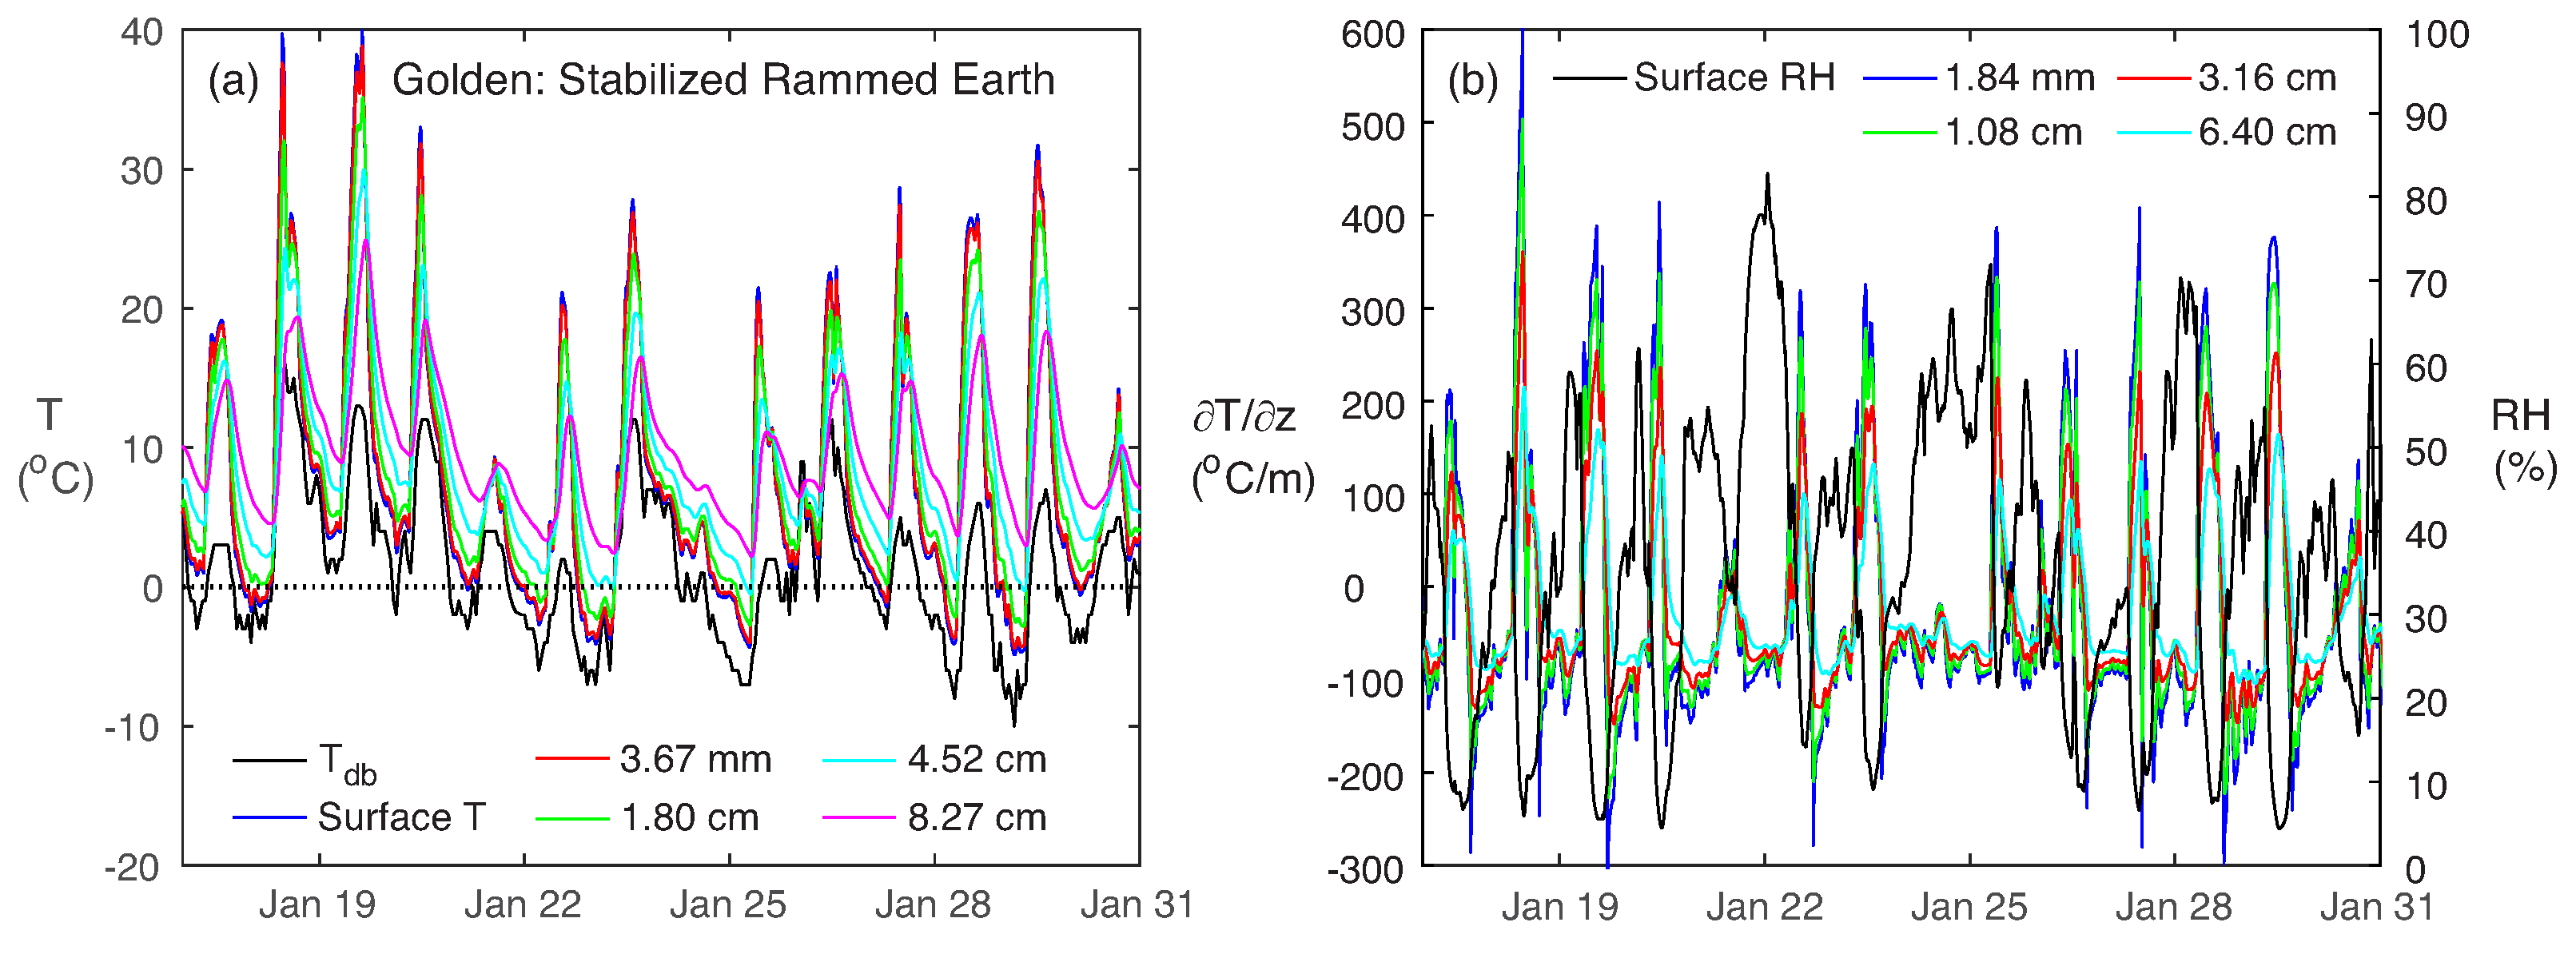
Figure 4a shows a two week interval of outdoor air dry-bulb temperature , surface temperature, and south-facing wall temperatures for a stabilized rammed earth construction in Golden, Colorado, USA at the labeled cell depths; corresponding temperature gradients (left axis) are displayed in Figure 4b, alongside surface relative humidity values (right axis). The effects of radiative heat transfer produce substantial offsets (i.e., often >20 C) between wall surface and outside air temperatures, particularly during sunny daytime periods, leading to large wall temperature gradients that reach a peak magnitude near the exterior surface exceeding C/cm on 18 January. With the stabilized rammed earth threshold cracking temperature set to C, under water-saturated conditions these modeled time series predict substantial periods during which frost damage would be expected to accumulate. However, as shown in Figure 4b, during this interval the relative humidity at the wall surface reaches a maximum of just over 80%. The moisture retention curve from Figure 2a indicates that liquid saturations peak at around 20% under these conditions, so Figure 3a suggests an estimate for the unsaturated threshold cracking temperature that is never warmer than about C. The combination of high humidity and low temperatures that is necessary for unsaturated frost damage is not met during the displayed time window.
These results, together with similar time series for the other wall constructions, were used to calculate daily integrals for the frost damage index from Equation (1). Recognizing that the maximum temperature gradients, minimum temperatures, and highest total water contents are achieved close to exterior wall surfaces, we focus our attention on this region to generate index predictions that are indicative of the most severe frost damage encountered. Referring to the data presented in Figure 4 as an example, we use only the surface T in Figure 4a along with the surface and at 1.84 mm (obtained as the difference between T at the surface and at 3.67 mm depth into the wall divided by that distance) in Figure 4b as inputs to our calculations. As anticipated, Figure 5a reveals that appreciable damage (interpreted from high values of ) accumulates during numerous days over this three month time span, with a maximum of for concrete on 1 February. Under saturated conditions, Equation (1) predicts a finite damage index on any day that , with higher magnitude promoting greater , and the inverse power-law weighting on limiting damage accumulation under very cold conditions, reflecting dramatic restrictions to the liquid transport needed for ice growth to propagate cracks.
The four materials behave differently, with concrete tending to exhibit the largest values of on days during which each material accumulates some damage, but stabilized rammed earth and compressed stabilized earth blocks each undergo damage on several days during which it does not become cold enough to damage concrete The solid brick masonry appears to perform best under these saturated conditions, with a maximum value during this time span of . Further comparison between the damage accumulation in earth blocks and the conventional brick masonry is instructive, as each are modeled with the same cracking threshold of C. Table 1 indicates that the water transport parameter C that is defined by Equation (2) is a factor of 3 lower for the earth blocks than the brick masonry, yet Figure 5a indicates that the latter material consistently exhibits a lower damage index. The cause of this behavior can be traced to the permeability exponent , with the higher value for brick masonry reflecting an enhanced temperature dependence of the permeability, which regulates the liquid supply needed for crack growth. Hence, although the upper temperature limits to the frost-cracking window for brick masonry and earth blocks are the same (C), the temperature range over which the damage index can grow effectively is much narrower for the masonry. A similar picture emerges upon examining the contrast between the saturated damage of concrete, with C, and stabilized rammed earth, with C. As noted above, there are several days during which the surface temperature is cold enough to cause frost damage to rammed earth, but remains too warm for cracking in concrete. On most days where the temperature is cold enough for cracking in both materials; however, for concrete is higher than for rammed earth. Once again, the difference reflects the greater permeability exponent for rammed earth, which restricts the lower limit to the temperature range over which significant damage accumulates. In contrast, the higher values predicted in rammed earth than in earth blocks can be traced to the factor of 5 difference between their respective C values (see Equation (2)), with the lower value for earth blocks caused primarily by the smaller temperature offset at which the first pore ice forms and begins to restrict liquid transport (see Table 1).
To summarize these findings, susceptibility to saturated frost damage is more severe for a material with: (a) a warmer cracking threshold (e.g., due to weaker matrix bonding or larger incipient crack sizes); (b) a smaller permeability exponent (e.g., due to more widely distributed pore sizes that enable more conductive residual liquid pathways to persist over a broader temperature range); and (c) a higher water transport parameter C (e.g., due to a higher liquid-saturated permeability or a larger temperature depression for initial ice formation ; note, however that materials with larger pore sizes tend to be characterized by both higher and warmer ). In a given material, damage is expected to be most severe at temperatures just below before liquid transport becomes too restricted. High temperature gradients also promote damage, both because they drive liquid transport and because they cause larger gradients in permeability that are accommodated in part by freezing. The most effective environmental conditions for producing damage involve prolonged time periods at temperatures near while the material is subjected to high temperature gradients; such behavior is characteristic of cyclic variations near the melting transition, including freeze-thaw.
3.2. Environmental Conditions, Material Properties, and Unsaturated Damage
The unsaturated damage index obtained over the same three-month time period is displayed in Figure 5b; note the order of magnitude reduction in the axis scale. As anticipated from the discussion surrounding the two week interval highlighted in Figure 4, damage under unsaturated conditions is rare in Golden. Even when it is damp and cold enough to produce some damage, is always at least an order of magnitude smaller than , which suggests a remarkable decrease in the damage severity. The peak for this time series takes place on 16 February in concrete, with earth blocks at , rammed earth at , and brick masonry at . Whereas in this climate, saturated damage to earth blocks is generally lower than to rammed earth, the moisture retention curves from Figure 2a indicate that earth blocks have a higher total water content than rammed earth at a given relative humidity. In addition, the lower vapor diffusion resistance factor and higher (obtained from the saturated limit of the liquid suction function) listed in Table 1 for earth blocks both reflect somewhat enhanced moisture transport. Combined, these effects cause the earth blocks to be somewhat more susceptible to unsaturated damage than the rammed earth on the days in which the largest values of are obtained. However, days with noticeable at this scale are rare and tend to be isolated by long intervals in which it is either too warm or too dry for cracks to grow. In fact, recognizing that some degree of volume change can be accommodated elastically, e.g., [56,57], it is conceivable that the few brief positive excursions of shown in Figure 5b might relax and produce no lasting damage at all.
It would be reasonable to expect that the same factors that enhance damage in saturated conditions should also tend to enhance damage in unsaturated conditions. However, the sensitivity to water content S that Equation (7) predicts for is notably much greater for materials with lower saturation exponents (see Figure 3a), which tend to reflect more broadly distributed pore sizes. For a given time series of temperature variations, this can cause a reversal of the damage susceptibility under saturated vs. unsaturated conditions for two different materials. The 16 February values shown in Figure 5 for and of compressed stabilized earth blocks and stabilized rammed earth are an example of such behavior (i.e., is greater for the stabilized rammed earth under the same temperature forcing for which is greater for the compressed stabilized earth blocks). In terms of environmental conditions, it is important to emphasize that the susceptibility of a given material to unsaturated frost damage does not depend only on the temperature and its gradient, but also on the pore space relative humidity, which must approach values near unity for the threshold to be reached.
3.3. Damage Variations between Different Cities
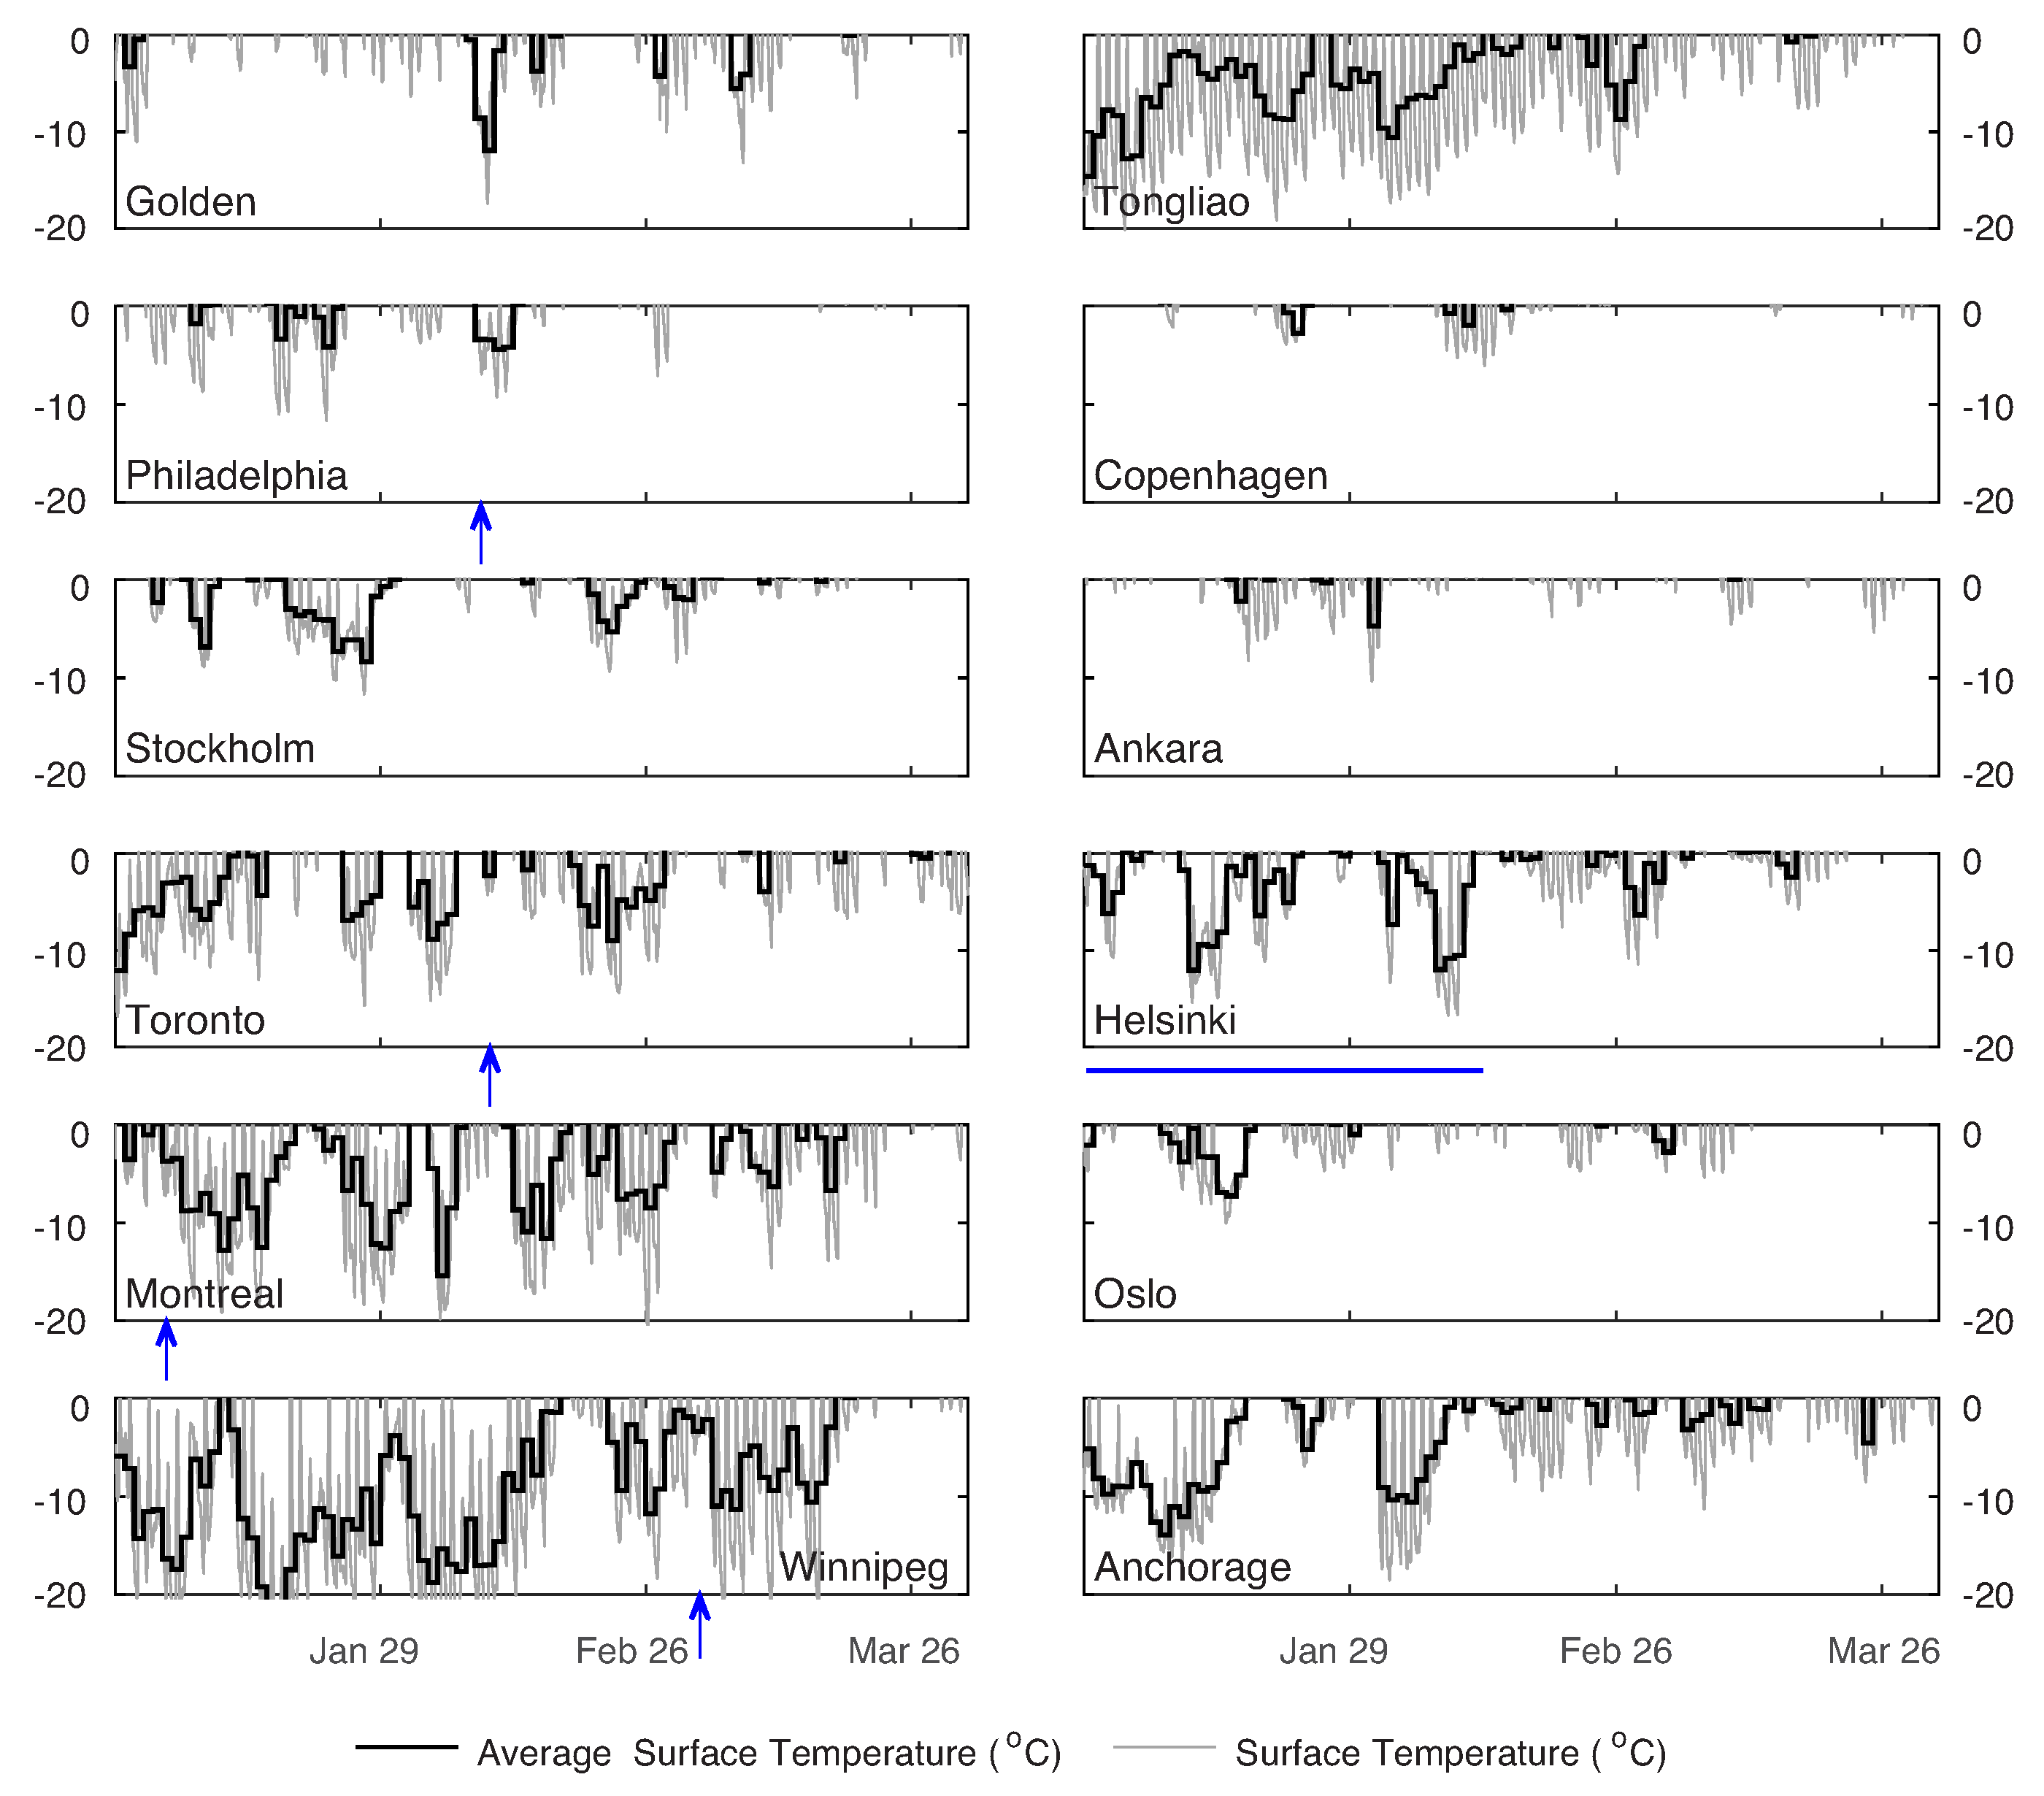
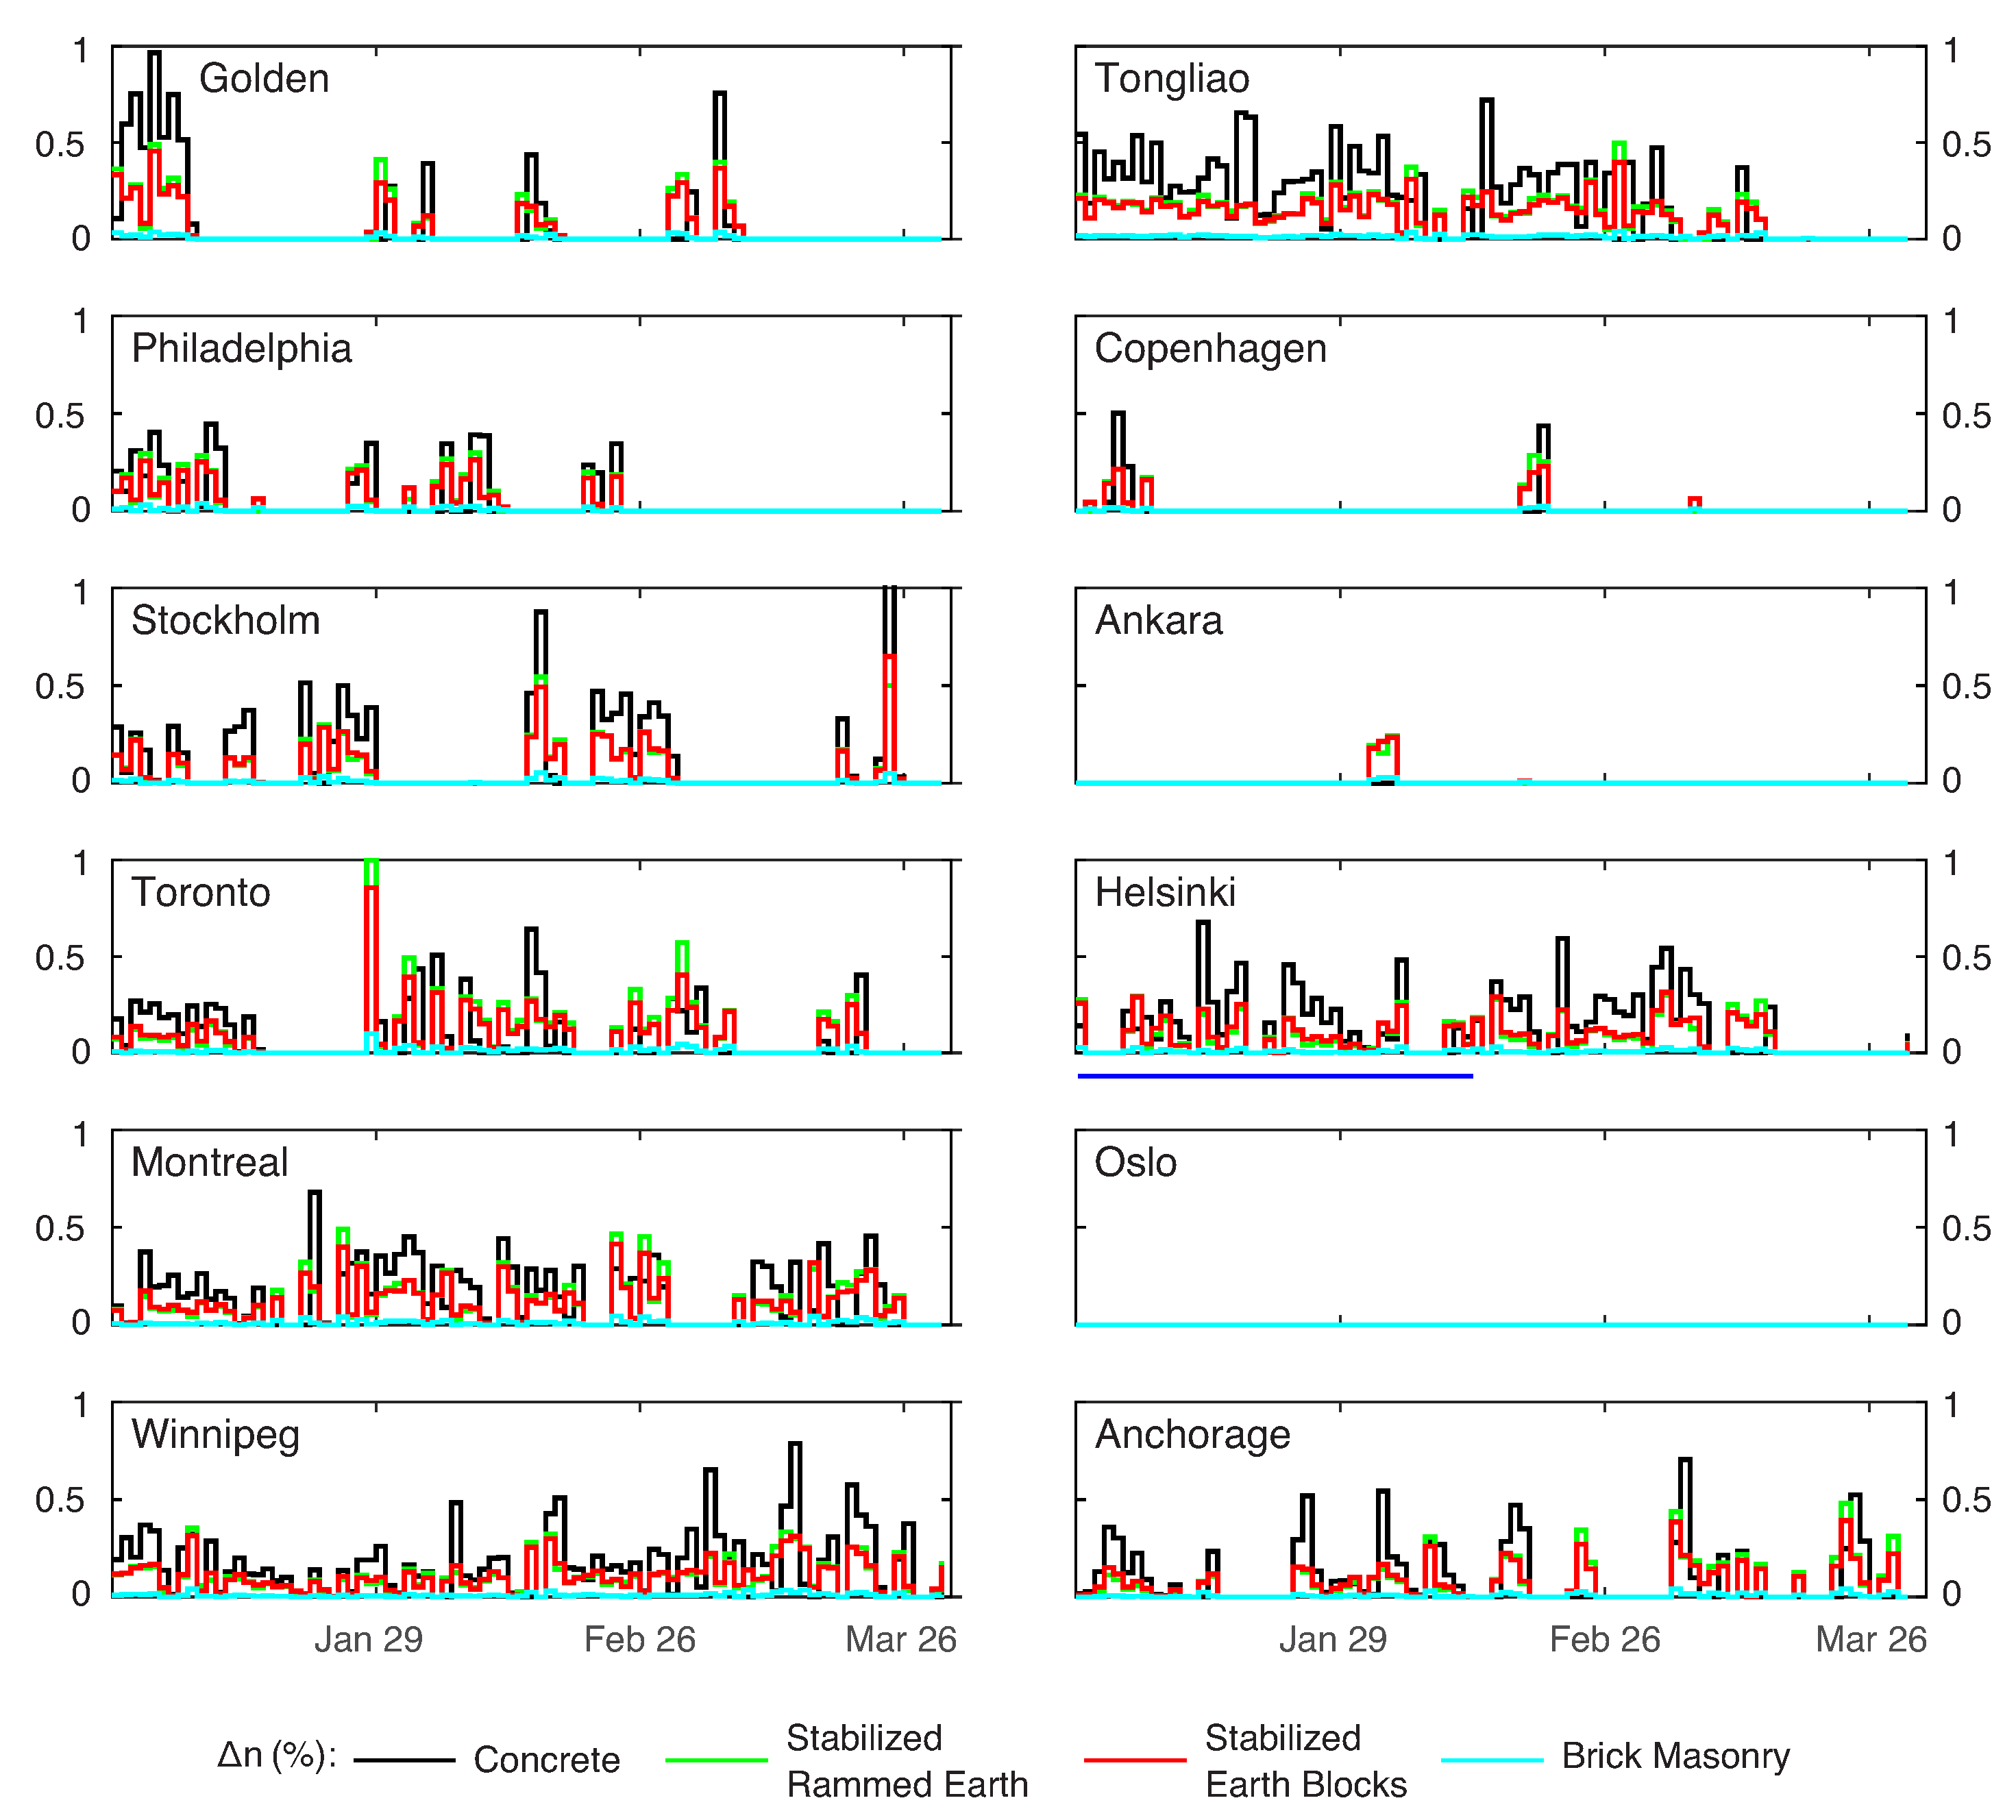
Figure 6 shows predicted by Equation (1) assuming saturated conditions in each of the cities listed in Table 2 during the earlier range of years; a summary of average daily frost damage indices is given in Table A2. As shown in Figure 7, the general patterns of predicted damage accumulation correspond with episodes of low subzero surface temperatures. However, as anticipated from modeled restrictions to liquid transport at very low temperatures, close examination reveals that the days on which the greatest changes in take place are not the coldest. Over the entire three month period, for example, Figure 7 indicates that Winnipeg is most frigid, whereas Figure 6 shows that Tongliao has larger average daily , as do Montreal and Anchorage (see Table A2). Examining particular dates, the largest in Montreal takes place in early January when the temperature stays above C. In Anchorage, much more damage is predicted during the relatively mild weather of late February and early March than in the coldest stretches of January.
Comparing the different material behaviors displayed in Figure 6, consistent with the results already discussed for Golden (shown enlarged in Figure 5), concrete exhibits the largest overall in most of these cities. In the milder climates of Copenhagen, Ankara, and Oslo, however, temperatures become sufficiently cold to crack concrete on only a few days over this three month period, whereas stabilized rammed earth is damaged more frequently, followed by compressed stabilized earth blocks, with the solid brick masonry consistently accumulating the smallest values (see Table A2). Once again, these differences in material performance reflect differences in the temperature dependence of liquid supply, gauged by , the minimum ice pressure needed for cracking to begin, gauged by , and the background pore liquid transport rate, gauged by the water transport parameter C (see Table 1).
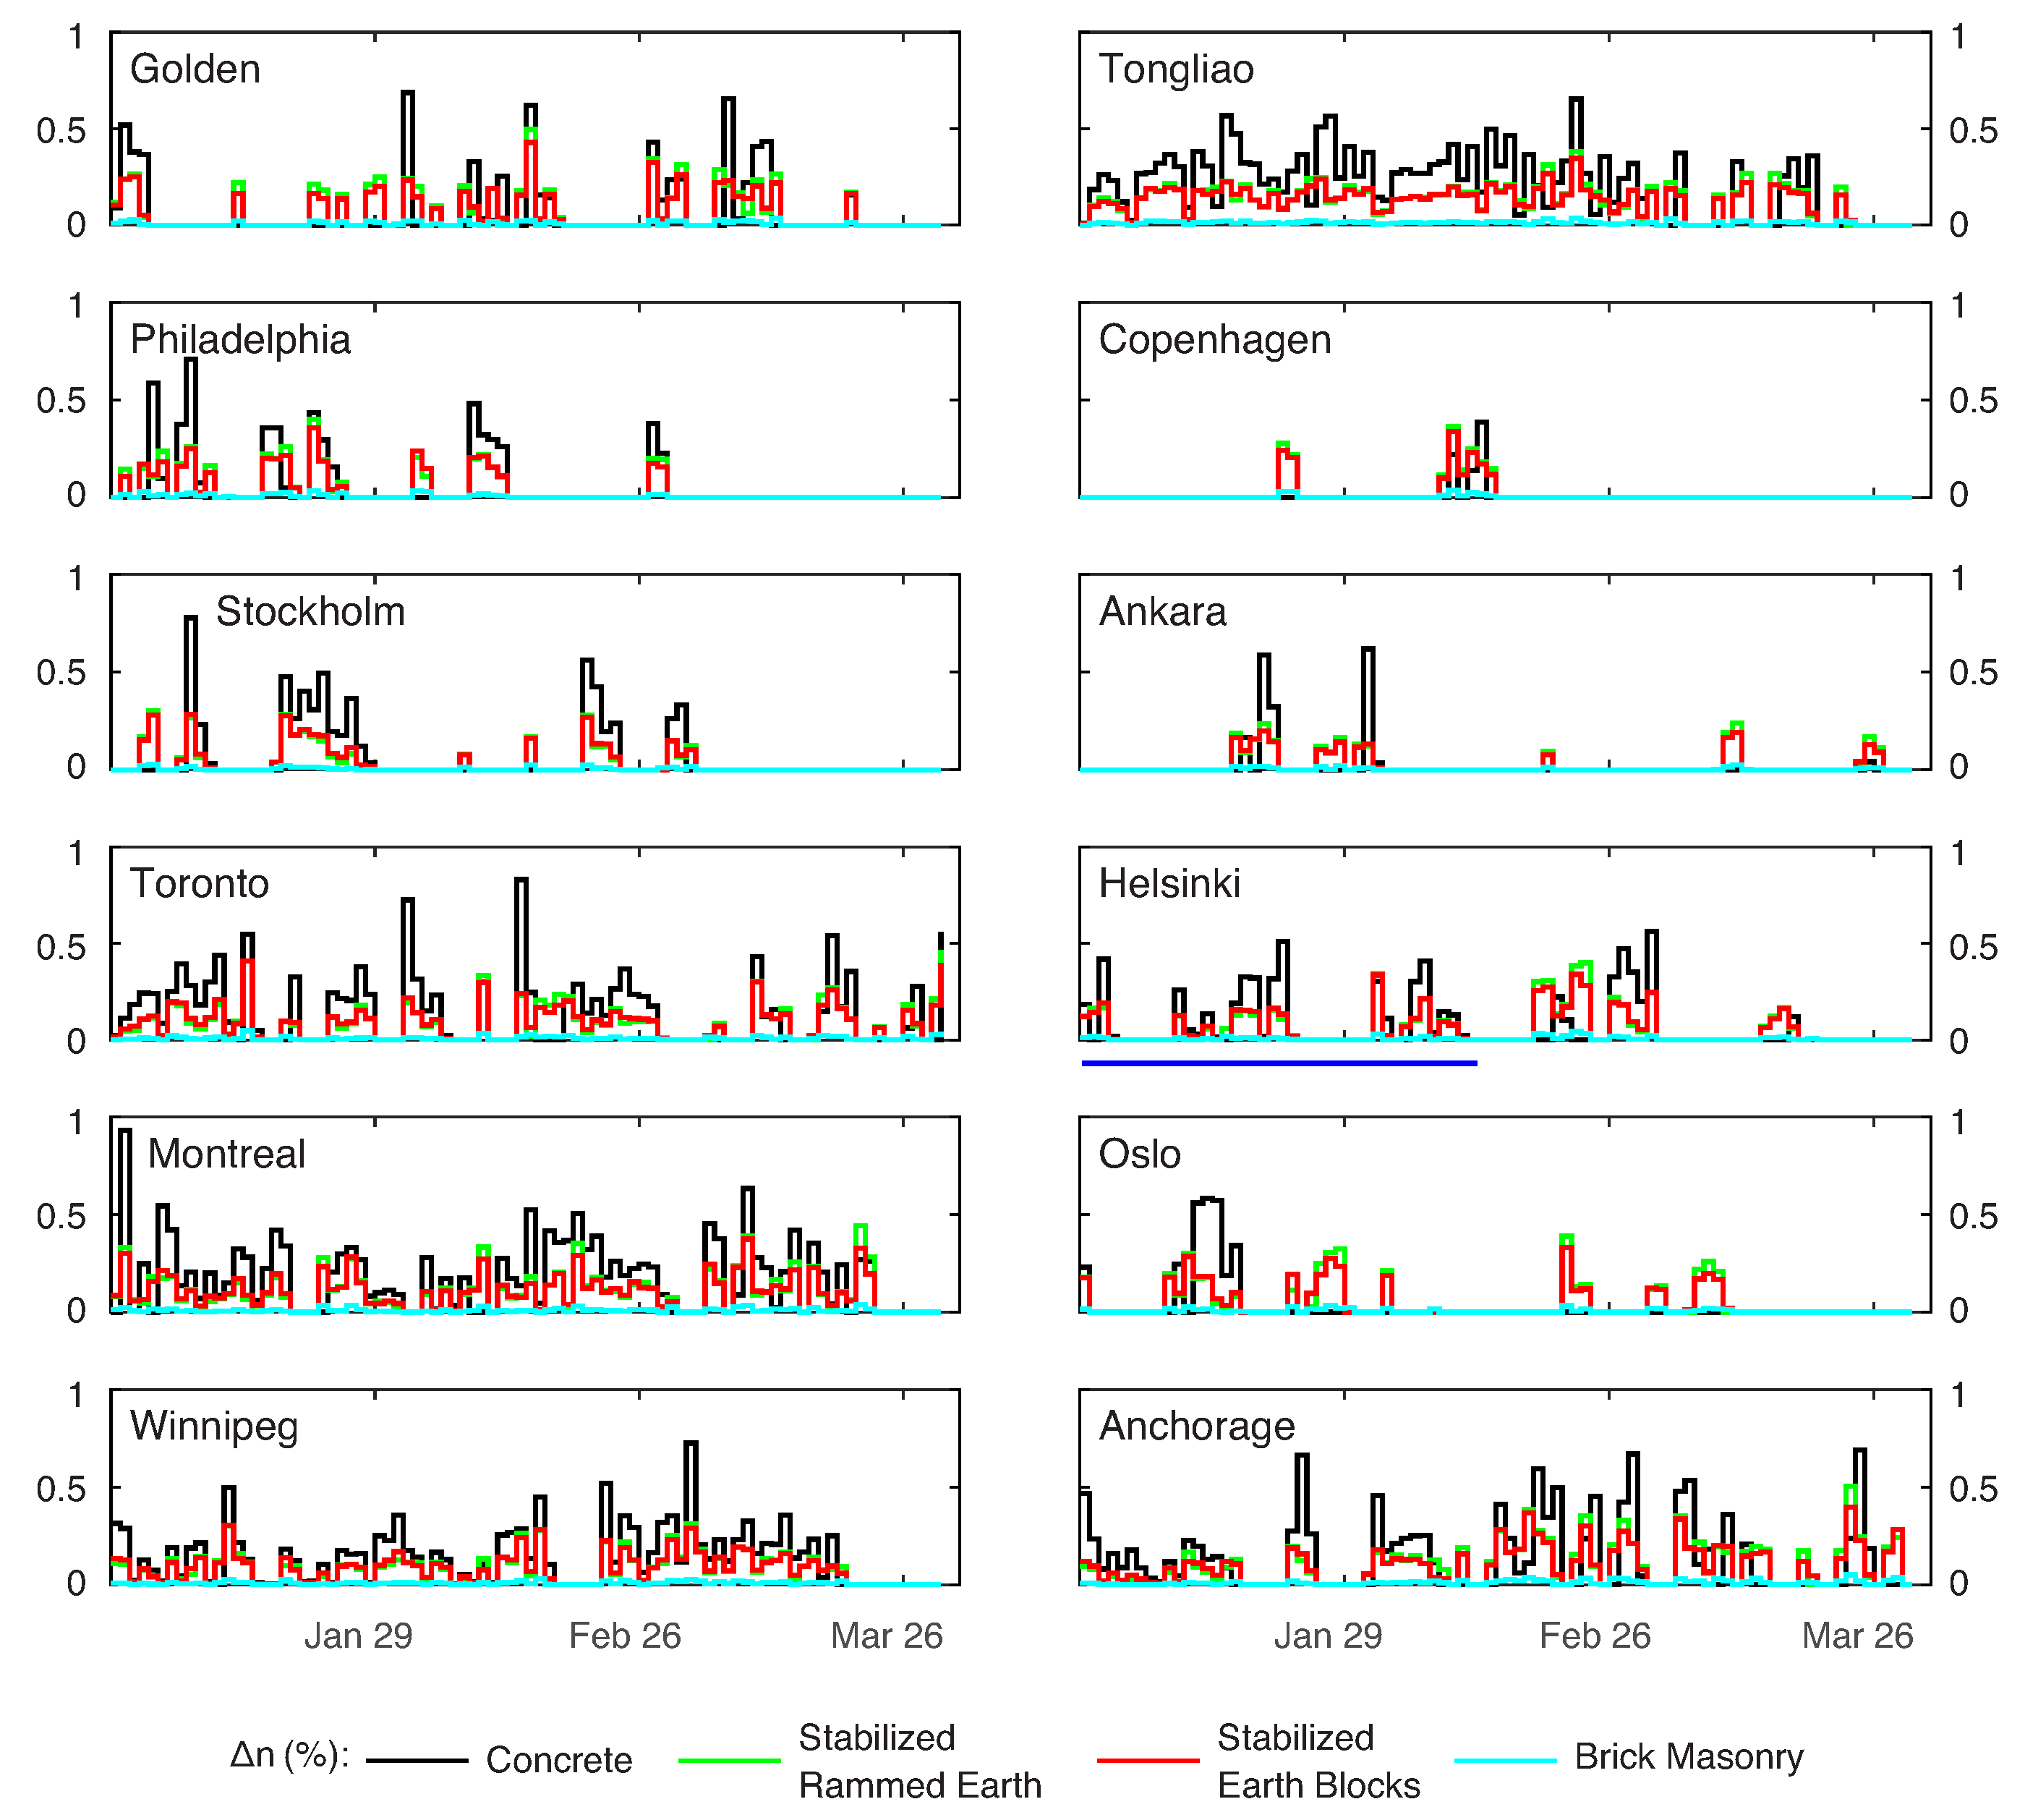
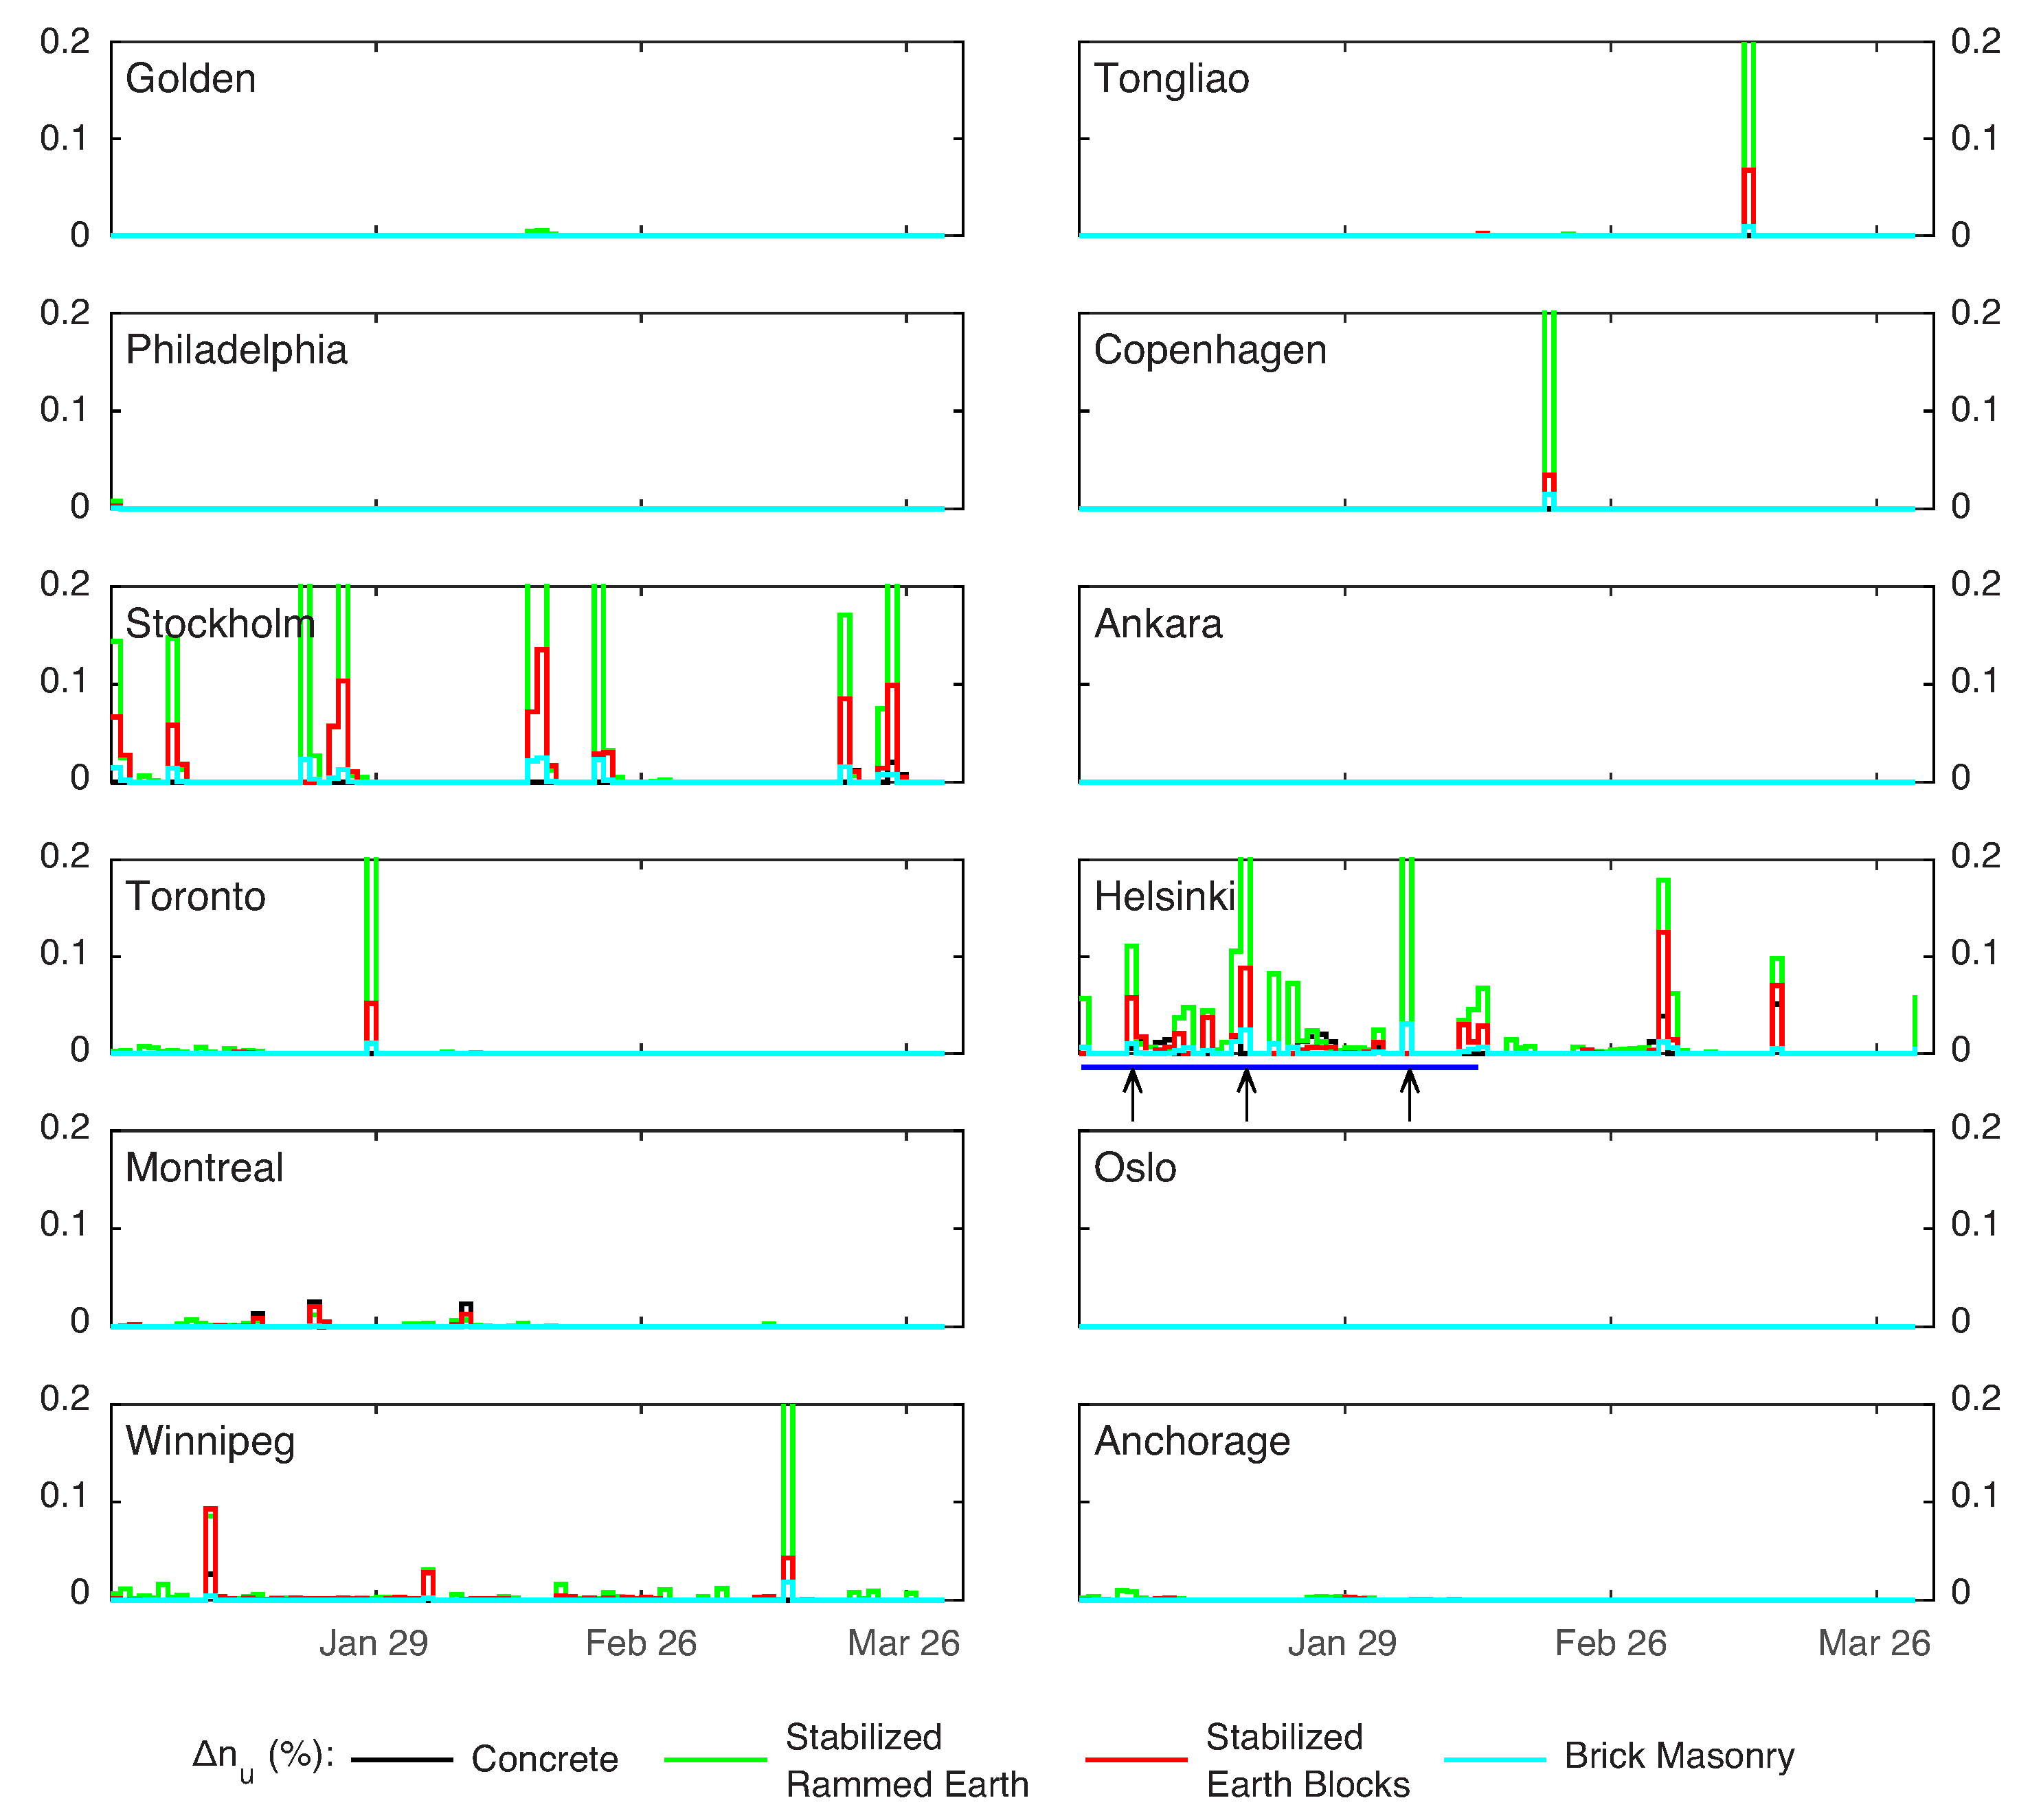
Figure 8 shows predicted time series obtained with adjusted following Equation (7) to reflect the more realistic case of frost damage during unsaturated conditions (note the order of magnitude reduction in scale compared to Figure 6). Because of moisture limitations, the correlation between and the temperature time series in Figure 7 appears weak. The milder climates, including Ankara and Copenhagen, register no frost damage at all, but much colder locations like Tongliao and Anchorage also accumulate negligible . These findings are consistent with expectations based on the surface relative humidity time series shown in Figure 9. During this entire three month time period, the relative humidity on a south-facing stabilized rammed earth wall in Tongliao never reaches 80%, implying low surface water contents (see Figure 2) and correspondingly reduced values of (see Figure 3). Philadelphia, Toronto, Montreal, and Winnipeg each experience brief episodes where spikes above the maximum scale displayed (reaching peaks of on 8 February in Philadelphia; on 8 February in Toronto; on 6 January in Montreal; and on 3 March in Winnipeg, highlighted with arrows in Figure 7, Figure 8 and Figure 9); the surface relative humidity during each of these episodes approaches 100%. More modest periods of vulnerability in Golden, Stockholm, Helsinki and Oslo also correlate with periods of high surface relative humidity.
3.4. Changing Damage Patterns over Time
To gauge potential temporal changes in the patterns and severity of damage as climate changes, we repeated the index calculations using weather files that represent the later time periods listed for each city in italics in Table 2. Figure 10 (see also Table A2) reveals that weather patterns representative of the period from 2003–2017 in Oslo have warmed sufficiently that the saturated damage index has become negligible over the first three months of the year, whereas Figure 8 indicates significant damage during these months in the earlier 1983–1998 interval (see Table 2). Total frost damage in Ankara is also reduced under more recent weather conditions, and significant decreases take place in Toronto, Montreal, Anchorage, and to a lesser extent, Golden. Under both sets of weather files, similar saturated damage indices were predicted for Tongliao and Philadelphia. In Copenhagen, damage is generally reduced on average during the later climate interval (see Table A2), but while the peak for concrete is slightly lower, the peak damage to both stabilized rammed earth and compressed stabilized earth blocks are slightly higher. Helsinki and Stockholm both experience more damage under the more recent 2003–2017 interval than they do during the earlier interval. The damage index for Winnipeg is also slightly higher using weather for 2016 than it was for the weather patterns representative of 1961–1990.
The frost damage index for unsaturated conditions under more recent weather conditions is shown in Figure 11. A reduction to negligible damage takes place in Golden, Philadelphia, and Oslo, while Ankara remains too warm and dry for unsaturated cracking and Anchorage experiences a slight increase compared to predictions for earlier years, shown in Figure 8. A substantial reduction in the damage index is also predicted for Montreal, but the index values rise in Tongliao, Copenhagen, Toronto and Winnipeg, predicting significantly greater damage to rammed earth and slightly greater damage to compressed stabilized earth blocks in these climates.
Strikingly, simulations with the most recent weather files available (Table 2) indicate that frost vulnerability is currently increasing in Helsinki and Stockholm (Figure 11). This finding is consistent with recent reports expressing concerns about increasing vulnerability to frost damage in these areas as climate change progresses [45,46]. The underlying causes appear to be closely related in the two cities. In both climates, the combination of warmer winter outdoor air with greater cloudiness, i.e., less direct solar radiation, causes near-freezing (∼−3–C) outdoor air to coexist with high (90–100%) relative humidity much more frequently in more recent weather. As a result, near-surface pore spaces more often have high relative humidities at temperatures slightly above freezing, especially during daytimes when solar radiation warms south-facing wall surfaces to temperatures above those of ambient air. When a wall surface at such conditions cools rapidly due to increasing cloudiness or sunset, or from an increase in convective heat loss due to a change in wind speed or direction, pore space relative humidities are then likely to reach 100% as the wall surface drops into freezing temperatures, entering the frost-cracking window.
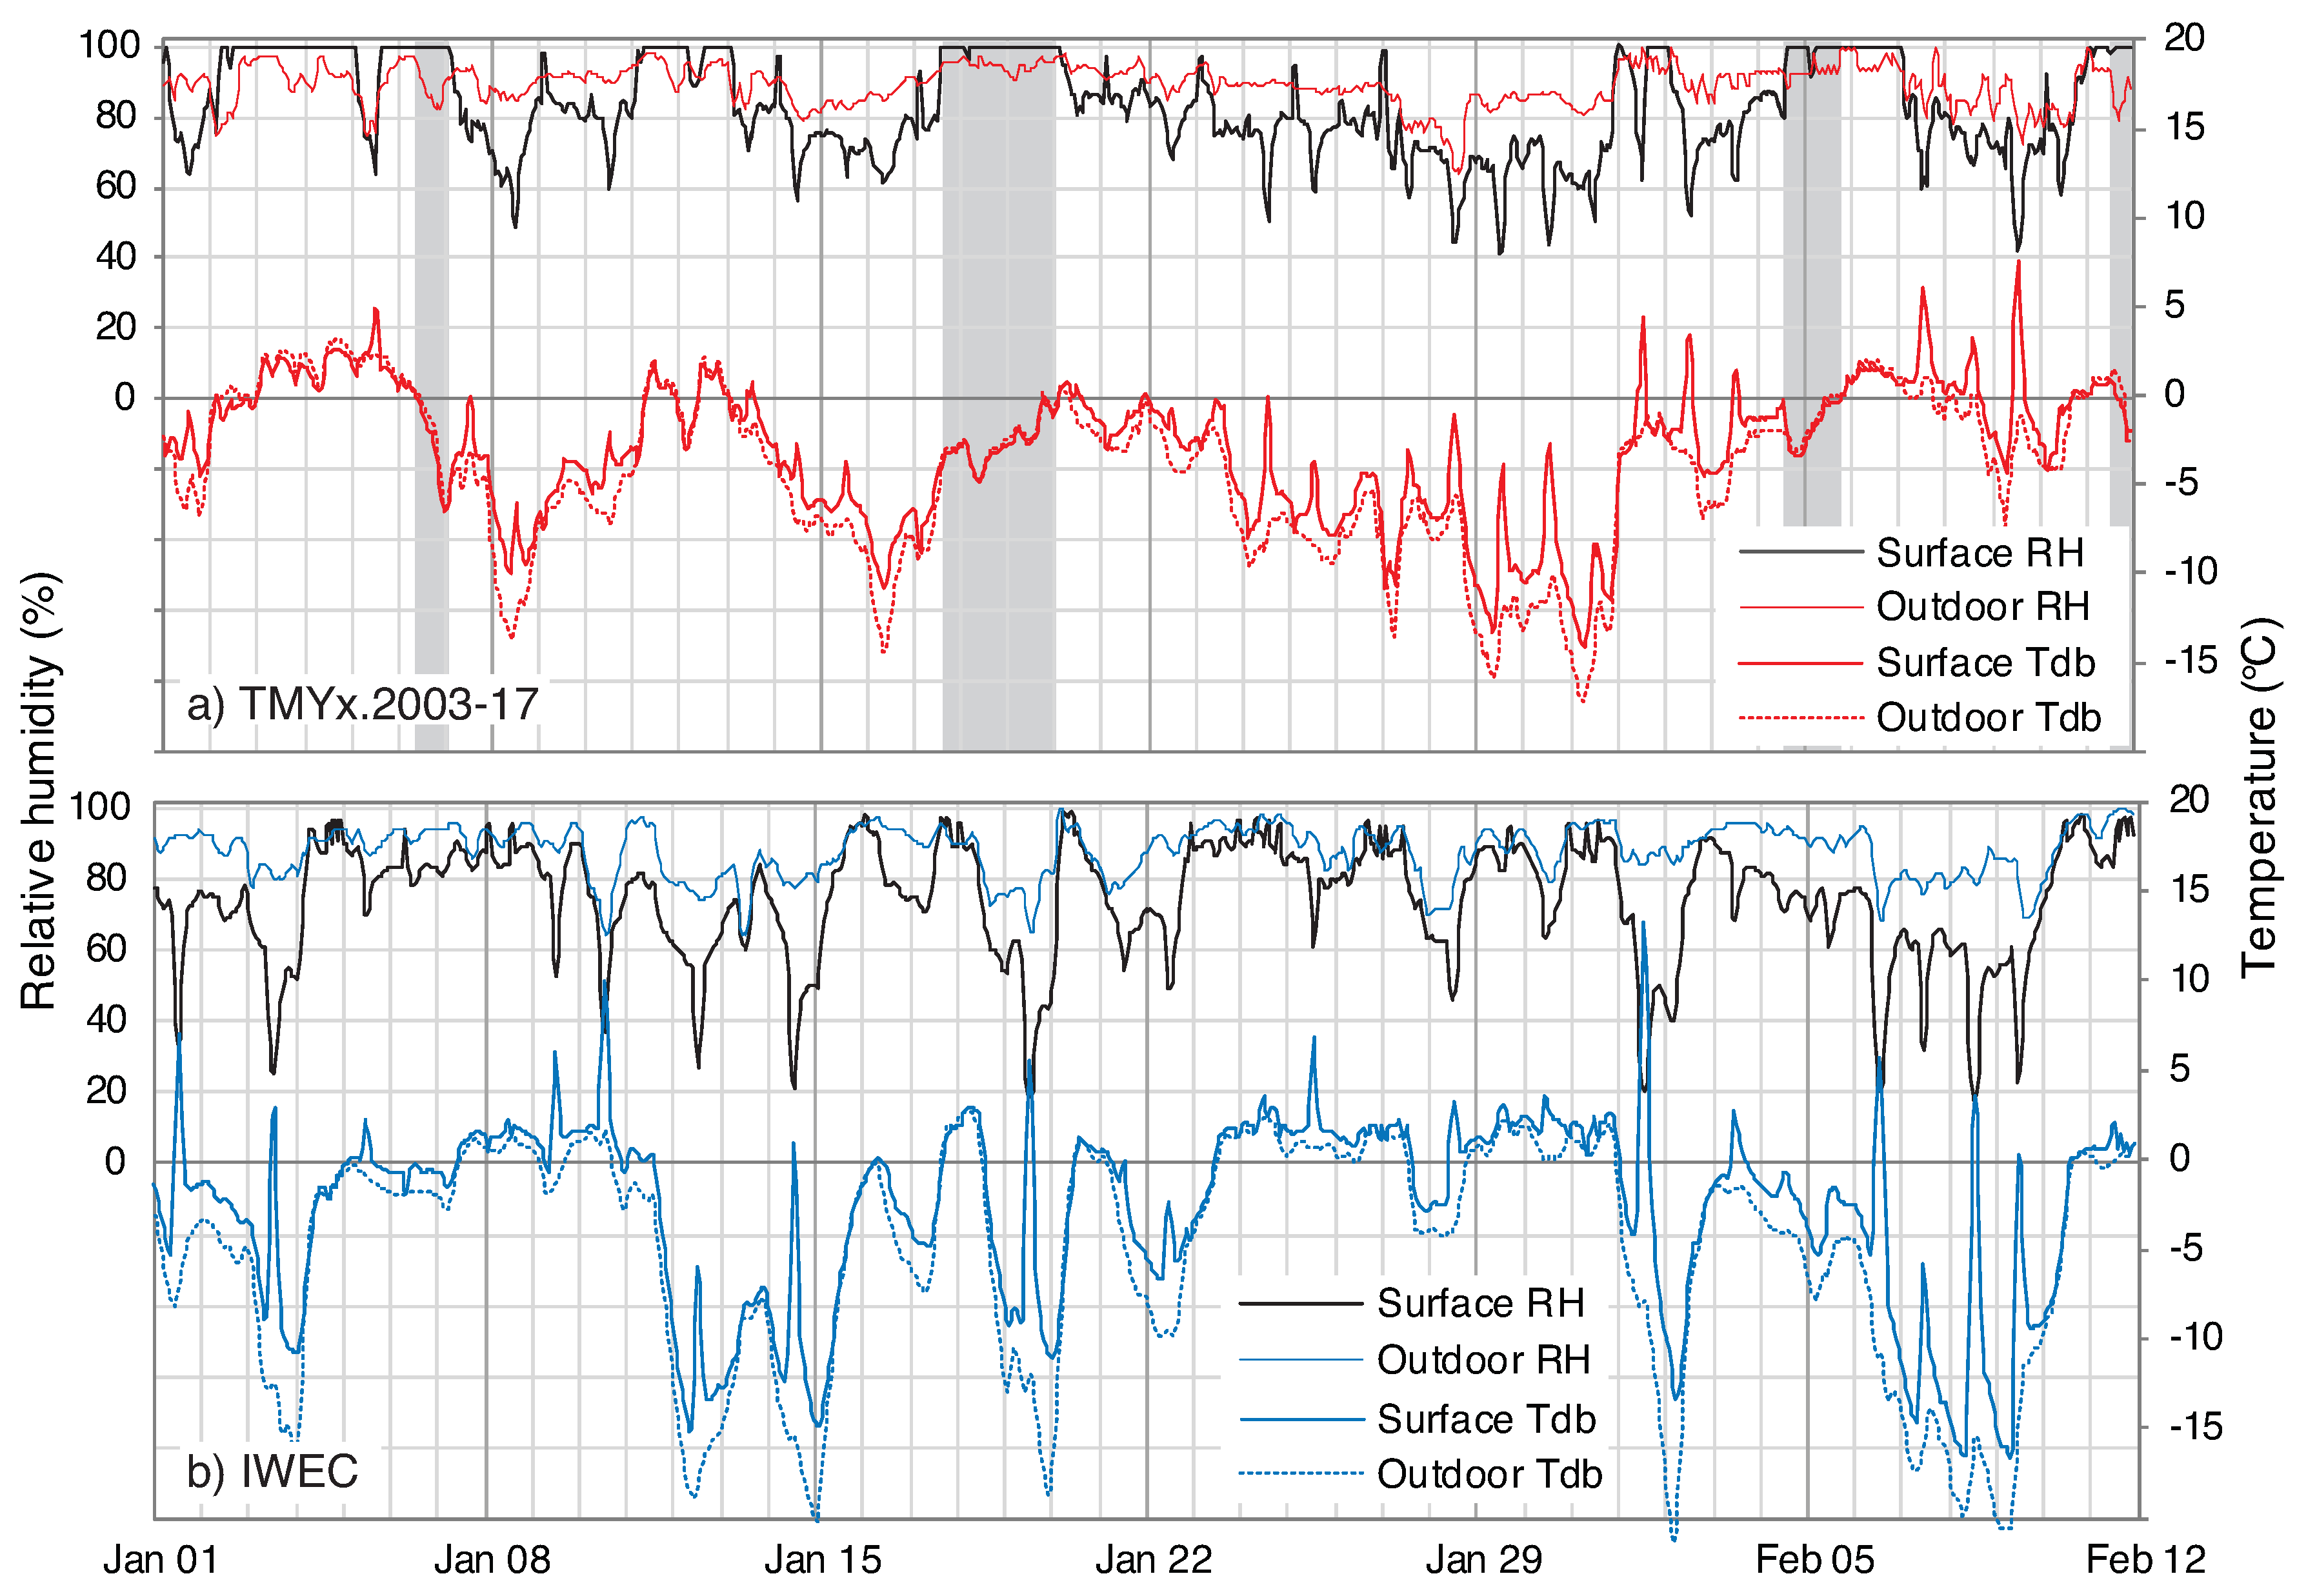
For Helsinki, the contrast between conditions of the recent past represented by the TMYx.2003-2017 file (Table 2), and those of thirty years ago represented by the IWEC file, is shown in Figure 12, using rammed earth as the material and focusing on the first six weeks of the year (this interval is highlighted with horizontal blue lines beneath the Helsinki panels in Figure 6, Figure 7, Figure 8, Figure 9, Figure 10 and Figure 11). Hours during which the surface relative humidity (“Surface RH”) reaches 100% are found within the frost-cracking window during this interval (shaded areas). In particular, high humidities and low surface temperatures coincide over much of 6 January, 18 January and 5 February; these are the three days marked by arrows in Figure 11 that exhibit dramatic peaks in . As the graphs in Figure 12 show, this combination of environmental conditions is predicted to occur much more frequently under more recent conditions (upper panel). In addition, the wall maintains much higher pore space relative humidity overall under the more recent conditions because the frequency of rapid, extensive solar surface heating is much lower; this is visible in the correspondence between peaks in wall surface temperatures (“Surface T”) and dips in pore space relative humidity. This surface heating, which warms the wall well above outdoor air temperatures on numerous occasions in the earlier weather file (lower panel), diminishes the relative humidity in wall surface pores significantly. With far fewer sunny hours, however, this periodic warming and dehumidification cannot occur, causing the wall surface to enter the frost-vulnerable region much more frequently and for more hours each time.
3.5. Interpreting the Damage Index
Our analysis of frost cracking vulnerability makes extensive use of modeled values of the damage index defined by Equation (1). Following the hypothesis of McGreevy and Whalley [59] that “the degree of frost damage (to porous materials) can be equated with the amount of ice (that) forms in them during freezing”, for saturated conditions was originally developed to represent the increase in porosity and ice content that occurs when the temperature is sufficiently cold for the stresses exerted by ice on pore walls to propagate cracks [67]. Nevertheless, the process of crack propagation and the partitioning between recoverable (i.e., elastic) and unrecoverable deformation is not directly assessed and, as with other proposed macroscopic indices [63,64,65,66], further efforts are needed to connect calculated values of with observed damage severity. The choice to evaluate Equation (1) over daily time periods was made to facilitate comparisons between the predicted accumulation of damage between different materials and weather conditions. In many cases, the surface temperature crosses the threshold on a daily basis, so that melting can take place and allow the stresses on pore walls to relax before the next freezing episode occurs. However, many of the climates we investigated also include conditions during which the material surface was held at for several days and hence the daily values that we report may be considered to accumulate on top of each other. By this reasoning, a given sequence of daily values would be expected to cause more severe damage if the temperature never rose above than if there were mitigating warmer excursions that allowed matrix stresses to relax. The strong dependence of on the magnitude of the temperature gradient complicates matters somewhat, since the rapid warming and cooling that is often associated with excursions above and below also tend to produce larger temperature gradients and hence larger values of during individual freezing episodes.
For the unsaturated conditions that are expected to apply most frequently in building walls, cannot strictly be interpreted in terms of absolute increases to the entire pore space volume, but instead as a measure of water redistribution by cryosuction that supplies crack growth in the most damage-prone air-free pores. The large reductions we demonstrate for in comparison with are consistent with the expected reduced frost vulnerability when insufficient moisture is available to freeze and cause damage. The degree to which a given material can accommodate the volume changes implied by particular values of or must depend on matrix mechanical properties and pore characteristics. Further assessment of frost resilience awaits quantitative comparison with field and laboratory observations. In particular, detailed monitoring studies on specific well-characterized materials with measured environmental and in situ variables are needed for improved model validation of both the damage index and the phase distribution predictions that underlie its determination.
4. Conclusions
The low embodied energy of earth building materials, as well as their humidity-buffering properties and thermal stability, are increasing their attractiveness in green building design in climates where frost damage is a concern. Our assessment of a physically-based frost damage index [67] in several of these climates suggests that frost resilience properties of stabilized rammed earth and compressed stabilized earth blocks compare favorably with those of conventional concrete and brick masonry constructions. A key finding is that in most climates, from cold semi-arid Tongliao to subarctic Anchorage, the frequency of winter days that are sufficiently cold for frost cracking under saturated conditions show little consequence for realistic conditions because wall moisture levels remain too low. This highlights the importance in future research of developing laboratory tests that evaluate material performance under the unsaturated conditions most likely to prevail, rather than the saturated conditions approached in many freeze-thaw testing procedures [89,90,91]. In particular, time spent in the frost-cracking window is expected to be more relevant to understanding a material’s freeze-thaw resilience than the frequency of cycling through temperature extremes. A second central prediction is that climate change will affect frost vulnerability of earth materials in northern climates differently depending on coincident changes in temperature, cloud cover, and humidity. In cool coastal cities such as Helsinki and Stockholm, where increasing winter cloud cover is diminishing the solar radiation that tends to maintain drier walls, frost vulnerability is predicted to increase substantially. In those where temperature rise is the dominant effect; however, such as Montreal and Philadelphia, frost damage potential is expected to be reduced or virtually eliminated.
Author Contributions
Conceptualization, A.W.R. and A.R.R.; Formal analysis, A.W.R. and A.R.R.; Investigation, A.W.R. and A.R.R.; Methodology, A.W.R. and A.R.R.; Writing—original draft, A.W.R. and A.R.R.
Funding
This research was funded by the National Science Foundation under grant numbers NSF-1603907 to AWR and CBET-1804218 to ARR.
Conflicts of Interest
The authors declare no conflict of interest. The funders had no role in the design of the study; in the collection, analyses, or interpretation of data; in the writing of the manuscript, or in the decision to publish the results.
Appendix A

Table A1.
Nomenclature.
| Symbol | Description |
|---|---|
| c | heat capacity—see Table 1 |
| C | water transport parameter—see Table 1 & Equation (2) |
| permeability under liquid saturated conditions—see Table 1 | |
| dry thermal conductivity—see Table 1 | |
| L | latent heat of fusion (≈3.3 × 10 J/kg) |
| n | porosity—see Table 1 |
| damage index for saturated conditions—see Equation (1) | |
| damage index for unsaturated conditions—from Equation (1) with in place of | |
| pressure difference between ice and liquid—see Equation (4) | |
| gas constant ( J/(mol K)) | |
| relative humidity | |
| S | total water content |
| liquid saturation level | |
| t | time |
| T | temperature |
| maximum temperature for saturated frost damage—see Table 1 | |
| maximum temperature for unsaturated frost damage—see Equation (7) | |
| dry bulb temperature | |
| bulk melting temperature (≈273 K) | |
| temperature of first pore ice formation—see Table 1 | |
| partial molar volume of water ( m/mol) | |
| z | depth into wall—measured from exterior surface |
| exponent in permeability relation—see Table 1 | |
| exponent in freezing curve—see Table 1 & Equation (6) | |
| surface energy of ice-liquid interface (≈0.033 J/m) | |
| surface energy of vapor-liquid interface (≈0.074 J/m) | |
| ratio of —adopted nominal value: 8 | |
| vapor diffusion resistance factor—see Table 1 | |
| water density (≈10 kg/m) | |
| dry material density—see Table 1 | |
| matric potential—see Equation (3) | |
| water viscosity (≈1.8 × 10 Pa s) |
Table A2.
Average daily damage indices from January–March (note that values are in %, whereas values are in units of ). Regular text values represent the earlier range of years listed in Table 2, displayed as time series in Figure 6 and Figure 8. In parentheses, values for the later range of years listed in Table 2 are given, these data correspond to the time series displayed in Figure 10 and Figure 11.
| City | Concrete | Compressed Stabilized Earth Blocks | Stabilized Rammed Earth | Solid Brick Masonry |
|---|---|---|---|---|
| Golden (%) | 0.074 (0.080) | 0.063 (0.051) | 0.069 (0.056) | 0.0064 (0.0049) |
| () | 1.1 (0) | 0.80 (0) | 0.64 (0.13) | 0.016 (0) |
| Tongliao (%) | 0.21 (0.21) | 0.12 (0.12) | 0.13 (0.13) | 0.011 (0.012) |
| () | 0 (0) | 0.10 (0.78) | 0.45 (2.6) | 0 (0.11) |
| Philadelphia (%) | 0.061 (0.056) | 0.043 (0.040) | 0.046 (0.042) | 0.0049 (0.0046) |
| () | 0.92 (0.080) | 1.3 (0.035) | 3.0 (0.088) | 0.15 (0.0093) |
| Copenhagen (%) | 0.0084 (0.014) | 0.017 (0.014) | 0.019 (0.014) | 0.0019 (0.0015) |
| () | 0 (0) | 0 (0.39) | 0.029 (2.8) | 0 (0.17) |
| Stockholm (%) | 0.066 (0.12) | 0.038 (0.064) | 0.037 (0.062) | 0.0034 (0.0061) |
| () | 0 (0.46) | 0.046 (9.4) | 0.69 (29) | 0.0012 (2.0) |
| Ankara (%) | 0.020 (0) | 0.023 (0.0072) | 0.026 (0.0066) | 0.0024 (0.00095) |
| () | 0 (0) | 0 (0) | 0 (0) | 0 (0) |
| Toronto (%) | 0.15 (0.097) | 0.087 (0.087) | 0.087 (0.096) | 0.0082 (0.0093) |
| () | 0.13 (0) | 0.26 (0.60) | 3.5 (10) | 0.24 (0.12) |
| Helsinki (%) | 0.074 (0.14) | 0.057 (0.082) | 0.059 (0.077) | 0.0054 (0.0071) |
| () | 0 (2.6) | 0.33 (6.4) | 0.68 (20) | 0.0082 (1.8) |
| Montreal (%) | 0.18 (0.15) | 0.10 (0.10) | 0.10 (0.11) | 0.0094 (0.010) |
| () | 1.6 (0.80) | 2.7 (0.62) | 4.0 (0.87) | 0.0067 (0.013) |
| Oslo (%) | 0.031 (0) | 0.044 (0) | 0.046 (0) | 0.0050 (0) |
| () | 0 (0) | 0.38 (0) | 0.62 (0) | 0.0030 (0) |
| Winnipeg (%) | 0.14 (0.17) | 0.081 (0.10) | 0.079 (0.10) | 0.0072 (0.0095) |
| () | 0.56 (0.30) | 1.5 (2.6) | 4.5 (6.5) | 0.21 (0.28) |
| Anchorage (%) | 0.14 (0.09) | 0.096 (0.067) | 0.10 (0.069) | 0.0098 (0.0065) |
| () | 0 (0) | 0.0018 (0.099) | 0.24 (0.58) | 0 (0) |
References
- Hasanbeigi, A.; Price, L.; Lin, E. Emerging energy-efficiency and CO2 emission-reduction technologies for cement and concrete production: A technical review. Renew. Sustain. Energy Rev. 2012, 16, 6220–6238. [Google Scholar] [CrossRef]
- Kariyawasam, K.; Jayasinghe, C. Cement stabilized rammed earth as a sustainable construction material. Constr. Build. Mater. 2016, 105, 519–527. [Google Scholar] [CrossRef]
- Reddy, B.V.; Kumar, P.P. Embodied energy in cement stabilised rammed earth walls. Energy Build. 2010, 42, 380–385. [Google Scholar] [CrossRef]
- Cabeza, L.F.; Barreneche, C.; Miró, L.; Morera, J.M.; Bartolí, E.; Fernández, A.I. Low carbon and low embodied energy materials in buildings: A review. Renew. Sustain. Energy Rev. 2013, 23, 536–542. [Google Scholar] [CrossRef]
- Reddy, B.V.; Jagadish, K. Embodied energy of common and alternative building materials and technologies. Energy Build. 2003, 35, 129–137. [Google Scholar] [CrossRef]
- Cristelo, N.; Glendinning, S.; Miranda, T.; Oliveira, D.; Silva, R. Soil stabilisation using alkaline activation of fly ash for self compacting rammed earth construction. Constr. Build. Mater. 2012, 36, 727–735. [Google Scholar] [CrossRef] [Green Version]
- Silva, R.A.; Oliveira, D.V.; Miranda, T.; Cristelo, N.; Escobar, M.C.; Soares, E. Rammed earth construction with granitic residual soils: The case study of northern Portugal. Constr. Build. Mater. 2013, 47, 181–191. [Google Scholar] [CrossRef] [Green Version]
- Windstorm, B.; Schmidt, A. A report of contemporary rammed earth construction and research in North America. Sustainability 2013, 5, 400–416. [Google Scholar] [CrossRef]
- Fagone, M.; Loccarini, F.; Ranocchiai, G. Strength evaluation of jute fabric for the reinforcement of rammed earth structures. Compos. Part B Eng. 2017, 113, 1–13. [Google Scholar] [CrossRef]
- da Rocha, C.G.; Consoli, N.C.; Johann, A.D.R. Greening stabilized rammed earth: Devising more sustainable dosages based on strength controlling equations. J. Clean. Prod. 2014, 66, 19–26. [Google Scholar] [CrossRef]
- Hall, M.; Djerbib, Y. Moisture ingress in rammed earth: Part 2—The effect of soil particle-size distribution on the absorption of static pressure-driven water. Constr. Build. Mater. 2006, 20, 374–383. [Google Scholar] [CrossRef]
- Allinson, D.; Hall, M. Humidity buffering using stabilised rammed earth materials. Proc. Inst. Civ. Eng.-Constr. Mater. 2012, 165, 335–344. [Google Scholar] [CrossRef] [Green Version]
- McGregor, F.; Heath, A.; Fodde, E.; Shea, A. Conditions affecting the moisture buffering measurement performed on compressed earth blocks. Build. Environ. 2014, 75, 11–18. [Google Scholar] [CrossRef] [Green Version]
- Brambilla, A.; Jusselme, T. Preventing overheating in offices through thermal inertial properties of compressed earth bricks: A study on a real scale prototype. Energy Build. 2017, 156, 281–292. [Google Scholar] [CrossRef]
- Balaguer, L.; Vegas López-Manzanares, F.; Mileto, C.; García-Soriano, L. Assessment of the thermal behaviour of rammed earth walls in the summer period. Sustainability 2019, 11, 1924. [Google Scholar] [CrossRef]
- Rempel, A.R.; Rempel, A.W. Rocks, clays, water, and salts: Highly durable, infinitely rechargeable, eminently controllable thermal batteries for buildings. Geosci. Spec. Issue Geosci. Built Environ. 2013, 3, 63–101. [Google Scholar] [CrossRef]
- Dixon, R.K.; McGowan, E.; Onysko, G.; Scheer, R.M. US energy conservation and efficiency policies: Challenges and opportunities. Energy Policy 2010, 38, 6398–6408. [Google Scholar] [CrossRef]
- Buyle, M.; Braet, J.; Audenaert, A. Life cycle assessment in the construction sector: A review. Renew. Sustain. Energy Rev. 2013, 26, 379–388. [Google Scholar] [CrossRef]
- Pacheco-Torgal, F.; Faria, J.; Jalali, S. Embodied energy versus operational energy. Showing the shortcomings of the energy performance building directive (EPBD). Mater. Sci. Forum 2013, 730, 587–591. [Google Scholar] [CrossRef]
- Cabeza, L.F.; Rincón, L.; Vilariño, V.; Pérez, G.; Castell, A. Life cycle assessment (LCA) and life cycle energy analysis (LCEA) of buildings and the building sector: A review. Renew. Sustain. Energy Rev. 2014, 29, 394–416. [Google Scholar] [CrossRef]
- Rauf, A.; Crawford, R.H. Building service life and its effect on the life cycle embodied energy of buildings. Energy 2015, 79, 140–148. [Google Scholar] [CrossRef]
- Wolkoff, P. Indoor air humidity, air quality, and health—An overview. Int. J. Hyg. Environ. Health 2018, 221, 376–390. [Google Scholar] [CrossRef] [PubMed]
- Gallipoli, D.; Bruno, A.W.; Perlot, C.; Mendes, J. A geotechnical perspective of raw earth building. Acta Geotech. 2017, 12, 463–478. [Google Scholar] [CrossRef] [Green Version]
- Khadka, B.; Shakya, M. Comparative compressive strength of stabilized and un-stabilized rammed earth. Mater. Struct. 2016, 49, 3945–3955. [Google Scholar] [CrossRef]
- Bernat-Maso, E.; Gil, L.; Escrig, C. Textile-reinforced rammed earth: Experimental characterisation of flexural strength and thoughness. Constr. Build. Mater. 2016, 106, 470–479. [Google Scholar] [CrossRef]
- Jaquin, P.; Augarde, C.; Gallipoli, D.; Toll, D. The strength of unstabilised rammed earth materials. Géotechnique 2009, 59, 487–490. [Google Scholar] [CrossRef] [Green Version]
- Miccoli, L.; Müller, U.; Fontana, P. Mechanical behaviour of earthen materials: A comparison between earth block masonry, rammed earth and cob. Constr. Build. Mater. 2014, 61, 327–339. [Google Scholar] [CrossRef]
- Ciancio, D.; Beckett, C.; Carraro, J. Optimum lime content identification for lime-stabilised rammed earth. Constr. Build. Mater. 2014, 53, 59–65. [Google Scholar] [CrossRef]
- Touré, P.M.; Sambou, V.; Faye, M.; Thiam, A.; Adj, M.; Azilinon, D. Mechanical and hygrothermal properties of compressed stabilized earth bricks (CSEB). J. Build. Eng. 2017, 13, 266–271. [Google Scholar] [CrossRef]
- Sindanne, S.A.; Ntamack, G.E.; Sanga, R.P.L.; Moubeke, C.A.; Sallaboui, E.S.K.; Bouabid, H.; Mansouri, K.; D’ouazzane, S.C. Thermophysical characterization of earth blocks stabilized by cement, sawdust and lime. J. Build. Mater. Struct. 2014, 1, 58–64. [Google Scholar]
- Mandley, S.; Harmsen, R.; Worrell, E. Identifying the potential for resource and embodied energy savings within the UK building sector. Energy Build. 2015, 86, 841–851. [Google Scholar] [CrossRef]
- Malmqvist, T.; Nehasilova, M.; Moncaster, A.; Birgisdottir, H.; Rasmussen, F.N.; Wiberg, A.H.; Potting, J. Design and construction strategies for reducing embodied impacts from buildings—Case study analysis. Energy Build. 2018, 166, 35–47. [Google Scholar] [CrossRef]
- Lützkendorf, T.; Foliente, G.; Balouktsi, M.; Wiberg, A.H. Net-zero buildings: Incorporating embodied impacts. Build. Res. Inf. 2015, 43, 62–81. [Google Scholar] [CrossRef]
- Sharma, V.; Marwaha, B.M.; Vinayak, H.K. Enhancing durability of adobe by natural reinforcement for propagating sustainable mud housing. Int. J. Sustain. Built Environ. 2016, 5, 141–155. [Google Scholar] [CrossRef] [Green Version]
- Illampas, R.; Ioannou, I.; Charmpis, D.C. Overview of the pathology, repair and strengthening of adobe structures. Int. J. Archit. Herit. 2013, 7, 165–188. [Google Scholar] [CrossRef]
- Heathcote, K. Durability of earthwall buildings. Constr. Build. Mater. 1995, 9, 185–189. [Google Scholar] [CrossRef]
- Hall, M.; Djerbib, Y. Moisture ingress in rammed earth: Part 1—The effect of soil particle-size distribution on the rate of capillary suction. Constr. Build. Mater. 2004, 18, 269–280. [Google Scholar] [CrossRef]
- Swan, A.J.; Rteil, A.; Lovegrove, G. Sustainable earthen and straw bale construction in North American buildings: Codes and practice. J. Mater. Civ. Eng. 2011, 23, 866–872. [Google Scholar] [CrossRef]
- Muntohar, A.S. Engineering characteristics of the compressed-stabilized earth brick. Constr. Build. Mater. 2011, 25, 4215–4220. [Google Scholar] [CrossRef]
- Beckett, C.; Ciancio, D. Durability of cement-stabilised rammed earth: A case study in Western Australia. Aust. J. Civ. Eng. 2016, 14, 54–62. [Google Scholar] [CrossRef]
- Obonyo, E.; Exelbirt, J.; Baskaran, M. Durability of compressed earth bricks: Assessing erosion resistance using the modified spray testing. Sustainability 2010, 2, 3639–3649. [Google Scholar] [CrossRef]
- Pakkala, T.A.; Köliö, A.; Lahdensivu, J.; Kiviste, M. Durability demands related to frost attack for Finnish concrete buildings in changing climate. Build. Environ. 2014, 82, 27–41. [Google Scholar] [CrossRef]
- Bonshor, R.B.; Bonshor, L.L.; Sadgrove, R. Cracking in Buildings; Construction Research Communications Limited: London, UK, 1996. [Google Scholar]
- Lourenço, P.B.; van Hees, R.; Fernandes, F.; Lubelli, B. Characterization and damage of brick masonry. In Structural Rehabilitation of Old Buildings; Springer: Berlin/Heidelberg, Germany, 2014; pp. 109–130. [Google Scholar]
- Brimblecombe, P.; Grossi, C.M. Damage to buildings from future climate and pollution. APT Bull. J. Preserv. Technol. 2007, 38, 13–18. [Google Scholar]
- Grossi, C.M.; Brimblecombe, P.; Harris, I. Predicting long term freeze–thaw risks on Europe built heritage and archaeological sites in a changing climate. Sci. Total Environ. 2007, 377, 273–281. [Google Scholar] [CrossRef] [PubMed]
- Davidson, G.; Nye, J. A photoelastic study of ice pressure in rock cracks. Cold Reg. Sci. Technol. 1985, 11, 141–153. [Google Scholar] [CrossRef]
- McGreevy, J.; Whalley, W. Rock moisture content and frost weathering under natural and experimental conditions: A comparative discussion. Arct. Alp. Res. 1985, 17, 337–346. [Google Scholar] [CrossRef]
- Murton, J.B.; Peterson, R.; Ozouf, J.C. Bedrock fracture by ice segregation in cold regions. Science 2006, 314, 1127–1129. [Google Scholar] [CrossRef]
- Taber, S. The mechanics of frost heaving. J. Geol. 1930, 38, 303–317. [Google Scholar] [CrossRef]
- Zhu, D.; Vilches, O.; Dash, J.; Sing, B.; Wettlaufer, J. Frost heave in argon. Phys. Rev. Lett. 2000, 85, 4908. [Google Scholar] [CrossRef]
- Akagawa, S.; Fukuda, M. Frost heave mechanism in welded tuff. Permafr. Periglac. Process. 1991, 2, 301–309. [Google Scholar] [CrossRef]
- Hallet, B.; Walder, J.; Stubbs, C. Weathering by segregation ice growth in microcracks at sustained subzero temperatures: Verification from an experimental study using acoustic emissions. Permafr. Periglac. Process. 1991, 2, 283–300. [Google Scholar] [CrossRef]
- Matsuoka, N.; Murton, J. Frost weathering: Recent advances and future directions. Permafr. Periglac. Process. 2008, 19, 195–210. [Google Scholar] [CrossRef]
- Hallet, B. Why do freezing rocks break? Science 2006, 314, 1092–1093. [Google Scholar] [CrossRef] [PubMed]
- Vlahou, I.; Worster, M.G. Ice growth in a spherical cavity of a porous medium. J. Glaciol. 2010, 56, 271–277. [Google Scholar] [CrossRef] [Green Version]
- Vlahou, I.; Worster, M. Freeze fracturing of elastic porous media: A mathematical model. Proc. R. Soc. A 2015, 471. [Google Scholar] [CrossRef] [PubMed]
- Marshall, J.A.; Roering, J.J.; Bartlein, P.J.; Gavin, D.G.; Granger, D.E.; Rempel, A.W.; Praskievicz, S.J.; Hales, T.C. Frost for the trees: Did climate increase erosion in unglaciated landscapes during the late Pleistocene? Sci. Adv. 2015, 1, e1500715. [Google Scholar] [CrossRef] [PubMed] [Green Version]
- McGreevy, J.; Whalley, W. The geomorphic significance of rock temperature variations in cold environments: A discussion. Arct. Alp. Res. 1982, 14, 157–162. [Google Scholar] [CrossRef]
- Sanders, J.W.; Cuffey, K.M.; Moore, J.R.; MacGregor, K.R.; Kavanaugh, J.L. Periglacial weathering and headwall erosion in cirque glacier bergschrunds. Geology 2012, 40, 779–782. [Google Scholar] [CrossRef]
- Savi, S.; Delunel, R.; Schlunegger, F. Efficiency of frost-cracking processes through space and time: An example from the eastern Italian Alps. Geomorphology 2015, 232, 248–260. [Google Scholar] [CrossRef]
- Scherer, G.W. Crystallization in pores. Cem. Concr. Res. 1999, 29, 1347–1358. [Google Scholar] [CrossRef]
- Anderson, R.S. Near-surface thermal profiles in alpine bedrock: Implications for the frost weathering of rock. Arct. Alp. Res. 1998, 30, 362–372. [Google Scholar] [CrossRef]
- Anderson, R.S.; Anderson, S.P.; Tucker, G.E. Rock damage and regolith transport by frost: An example of climate modulation of the geomorphology of the critical zone. Earth Surf. Process. Landf. 2013, 38, 299–316. [Google Scholar] [CrossRef]
- Andersen, J.; Egholm, D.; Knudsen, M.; Jansen, J.; Nielsen, S. The periglacial engine of mountain erosion—Part 1: Rates of frost cracking and frost creep. Earth Surf. Dyn. Discuss. 2015, 3, 285–326. [Google Scholar] [CrossRef]
- Hales, T.; Roering, J.J. Climate-controlled variations in scree production, Southern Alps, New Zealand. Geology 2005, 33, 701–704. [Google Scholar] [CrossRef]
- Rempel, A.W.; Marshall, J.A.; Roering, J.J. Modeling relative frost weathering rates at geomorphic scales. Earth Planet. Sci. Lett. 2016, 453, 87–95. [Google Scholar] [CrossRef] [Green Version]
- Walder, J.; Hallet, B. A theoretical model of the fracture of rock during freezing. Geol. Soc. Am. Bull. 1985, 96, 336–346. [Google Scholar] [CrossRef]
- Setzer, M.J. Micro-ice-lens formation in porous solid. J. Colloid Interface Sci. 2001, 243, 193–201. [Google Scholar] [CrossRef]
- Qu, J.J.; Cheng, G.D.; Zhang, K.C.; Wang, J.C.; Zu, R.P.; Fang, H.Y. An experimental study of the mechanisms of freeze/thaw and wind erosion of ancient adobe buildings in northwest China. Bull. Eng. Geol. Environ. 2007, 66, 153–159. [Google Scholar] [CrossRef]
- Yavuz, H.; Altindag, R.; Sarac, S.; Ugur, I.; Sengun, N. Estimating the index properties of deteriorated carbonate rocks due to freeze–thaw and thermal shock weathering. Int. J. Rock Mech. Min. Sci. 2006, 43, 767–775. [Google Scholar] [CrossRef]
- Koniorczyk, M.; Gawin, D.; Schrefler, B.A. Modeling evolution of frost damage in fully saturated porous materials exposed to variable hygro-thermal conditions. Comput. Methods Appl. Mech. Eng. 2015, 297, 38–61. [Google Scholar] [CrossRef]
- Mayercsik, N.P.; Vandamme, M.; Kurtis, K.E. Assessing the efficiency of entrained air voids for freeze-thaw durability through modeling. Cem. Concr. Res. 2016, 88, 43–59. [Google Scholar] [CrossRef]
- Miqueleiz, L.; Ramírez, F.; Seco, A.; Nidzam, R.; Kinuthia, J.; Tair, A.A.; Garcia, R. The use of stabilised Spanish clay soil for sustainable construction materials. Eng. Geol. 2012, 133, 9–15. [Google Scholar] [CrossRef]
- Ahmed, A.; Ugai, K. Environmental effects on durability of soil stabilized with recycled gypsum. Cold Reg. Sci. Technol. 2011, 66, 84–92. [Google Scholar] [CrossRef]
- Standard Test Methods for Sampling and Testing Brick and Structural Clay Tile; ASTM International: West Conshohocken, PA, USA, 2018.
- Standard Test Method for Resistance of Concrete to Rapid Freezing and Thawing; ASTM International: West Conshohocken, PA, USA, 2015.
- Dash, J.G.; Rempel, A.W.; Wettlaufer, J.S. The physics of premelted ice and its geophysical consequences. Rev. Mod. Phys. 2006, 78, 695–741. [Google Scholar] [CrossRef] [Green Version]
- Rempel, A.W.; Wettlaufer, J.S.; Worster, M.G. Interfacial premelting and the thermomolecular force: Thermodynamic buoyancy. Phys. Rev. Lett. 2001, 87, 088501. [Google Scholar] [CrossRef] [PubMed]
- Or, D.; Lehmann, P.; Shahraeeni, E.; Shokri, N. Advances in soil evaporation physics—A review. Vadose Zone J. 2013, 12, 2011–2022. [Google Scholar] [CrossRef]
- Rempel, A.; Rempel, A. Intrinsic evaporative cooling by hygroscopic earth materials. Geosciences 2016, 6, 38. [Google Scholar] [CrossRef]
- Schneider, M.; Goss, K.U. Prediction of the water sorption isotherm in air dry soils. Geoderma 2012, 170, 64–69. [Google Scholar] [CrossRef]
- Wettlaufer, J.; Worster, M.G. Premelting dynamics. Annu. Rev. Fluid Mech. 2006, 38, 427–452. [Google Scholar] [CrossRef]
- Andersland, O.B.; Ladanyi, B. Frozen Ground Engineering; John Wiley & Sons: Hoboken, NJ, USA, 2004. [Google Scholar]
- O’Neill, K.; Miller, R.D. Exploration of a rigid ice model of frost heave. Water Resour. Res. 1985, 21, 281–296. [Google Scholar] [CrossRef]
- Rempel, A.W. A theory for ice-till interactions and sediment entrainment beneath glaciers. J. Geophys. Res. Earth Surf. 2008, 113. [Google Scholar] [CrossRef] [Green Version]
- Atkinson, B.K. Subcritical crack growth in geological materials. J. Geophys. Res. Solid Earth 1984, 89, 4077–4114. [Google Scholar] [CrossRef]
- Al-Omari, A.; Brunetaud, X.; Beck, K.; Al-Mukhtar, M. Effect of thermal stress, condensation and freezing–thawing action on the degradation of stones on the Castle of Chambord, France. Environ. Earth Sci. 2014, 71, 3977–3989. [Google Scholar] [CrossRef]
- Freire-Lista, D.M.; Fort, R.; Varas-Muriel, M.J. Freeze–thaw fracturing in building granites. Cold Reg. Sci. Technol. 2015, 113, 40–51. [Google Scholar] [CrossRef]
- Ingham, J. Predicting the frost resistance of building stone. Q. J. Eng. Geol. Hydrogeol. 2005, 38, 387–399. [Google Scholar] [CrossRef]
- Powers, T. Resistance to Weathering—Freezing and Thawing; American Society for Testing and Materials: West Conshohocken, PA, USA, 1956; Volume 169, pp. 182–187. [Google Scholar]
- Lisø, K.R.; Kvande, T.; Hygen, H.O.; Thue, J.V.; Harstveit, K. A frost decay exposure index for porous, mineral building materials. Build. Environ. 2007, 42, 3547–3555. [Google Scholar] [CrossRef]
- Rode, M.; Schnepfleitner, H.; Sass, O. Simulation of moisture content in alpine rockwalls during freeze-thaw events. Earth Surf. Process. Landf. 2016, 41, 1937–1950. [Google Scholar] [CrossRef]
- Kunzel, H.M. Simultaneous Heat and Moisture Transport in Building Components. Ph.D. Thesis, Fraunhofer Institute for Building Physics, Stuttgart, Germany, 1995. [Google Scholar]
- Künzel, H.M.; Kiessl, K. Calculation of heat and moisture transfer in exposed building components. Int. J. Heat Mass Transf. 1996, 40, 159–167. [Google Scholar] [CrossRef]
- Allinson, D.; Hall, M. Hygrothermal analysis of a stabilised rammed earth test building in the UK. Energy Build. 2010, 42, 845–852. [Google Scholar] [CrossRef]
- Fraunhofer Institute for Building Physics, WUFI Pro 6.3. 2019. Available online: https://wufi.de/en/software/wufi-pro (accessed on 30 June 2019).
- Morony, J.J. Adobe and latent heat: A critical connection. In Proceedings of the Second Annual Conference of the Adobe Association of the Southwest, El Rito, NM, USA, 18–21 May 2005. [Google Scholar]
- Morony, J.J. Adobe as phase-change material (PCM): Concerning a proper classification for an earthen building material. In Proceedings of the Fourth Annual Conference, El Rito, NM, USA, 18–20 May 2007. [Google Scholar]
- Padfield, T. The Role of Absorbent Building Materials in Moderating Changes of Relative Humidity. Ph.D. Thesis, Technical University of Denmark, Lyngby, Denmark, 1998. [Google Scholar]
- Cahn, J.; Dash, J.; Fu, H. Theory of ice premelting in monosized powders. J. Cryst. Growth 1992, 123, 101–108. [Google Scholar] [CrossRef]
- Beckett, C.; Ciancio, D. Effect of compaction water content on the strength of cement-stabilized rammed earth materials. Can. Geotech. J. 2014, 51, 583–590. [Google Scholar] [CrossRef]
- Bui, T.T.; Bui, Q.B.; Limam, A.; Maximilien, S. Failure of rammed earth walls: From observations to quantifications. Constr. Build. Mater. 2014, 51, 295–302. [Google Scholar] [CrossRef] [Green Version]
- Corbin, A.; Augarde, C. Fracture energy of stabilised rammed earth. Procedia Mater. Sci. 2014, 3, 1675–1680. [Google Scholar] [CrossRef]
- Maniatidis, V.; Walker, P. A Review of Rammed Earth Construction for DTi Partners in Innovation Project; Natural Building Technology Group, University of Bath: Bath, UK, 2003. [Google Scholar]
- Oti, J.; Kinuthia, J.; Bai, J. Engineering properties of unfired clay masonry bricks. Eng. Geol. 2009, 107, 130–139. [Google Scholar] [CrossRef]
- Oti, J.E.; Kinuthia, J.M.; Bai, J. Freeze-thaw of stabilised clay brick. Waste Resour. Manag. 2010, 163, 129–135. [Google Scholar] [CrossRef]
- Seco, A.; Urmeneta, P.; Prieto, E.; Marcelino, S.; García, B.; Miqueleiz, L. Estimated and real durability of unfired clay bricks: Determining factors and representativeness of the laboratory tests. Constr. Build. Mater. 2017, 131, 600–605. [Google Scholar] [CrossRef] [Green Version]
- Guettala, A.; Abibsi, A.; Houari, H. Durability study of stabilized earth concrete under both laboratory and climatic conditions exposure. Constr. Build. Mater. 2006, 20, 119–127. [Google Scholar] [CrossRef]
- Araki, H.; Koseki, J.; Sato, T. Tensile strength of compacted rammed earth materials. Soils Found. 2016, 56, 189–204. [Google Scholar] [CrossRef]
- Cargill, J.S.; Shakoor, A. Evaluation of empirical methods for measuring the uniaxial compressive strength of rock. Int. J. Rock Mech. Min. Sci. Geomech. Abstr. 1990, 27, 495–503. [Google Scholar] [CrossRef]
- Hales, T.; Roering, J.J. Climatic controls on frost cracking and implications for the evolution of bedrock landscapes. J. Geophys. Res. Earth Surf. 2007, 112. [Google Scholar] [CrossRef]
- McGregor, F.; Heath, A.; Shea, A.; Lawrence, M. The moisture buffering capacity of unfired clay masonry. Build. Environ. 2014, 82, 599–607. [Google Scholar] [CrossRef] [Green Version]
- Zhang, L.; Gustavsen, A.; Jelle, B.P.; Yang, L.; Gao, T.; Wang, Y. Thermal conductivity of cement stabilized earth blocks. Constr. Build. Mater. 2017, 151, 504–511. [Google Scholar] [CrossRef]
- EnergyPlus 8.7. U.S. Department of Energy. 2016. Available online: http://energyplus.net (accessed on 30 June 2019).
- Walker, P.; Stace, T. Properties of some cement stabilised compressed earth blocks and mortars. Mater. Struct. 1997, 30, 545–551. [Google Scholar] [CrossRef]
- Adam, E.; Jones, P. Thermophysical properties of stabilised soil building blocks. Build. Environ. 1995, 30, 245–253. [Google Scholar] [CrossRef]
- Euclid 0.9.3. Big Ladder Software 2017. Available online: https://bigladdersoftware.com/projects/euclid/ (accessed on 30 June 2019).
- Sketchup Make 2017. Trimble Inc. 2017. Available online: https://www.sketchup.com (accessed on 30 June 2019).
- Kottek, M.; Grieser, J.; Beck, C.; Rudolf, B.; Rubel, F. World map of the Köppen–Geiger climate classification updated. Meteorol. Z. 2006, 15, 259–263. [Google Scholar] [CrossRef]
Figure 1.
Schematic diagram showing residual liquid wetting matrix surfaces and collecting in crevice reservoirs, with ice or vapor occupying central pore regions.
Figure 1.
Schematic diagram showing residual liquid wetting matrix surfaces and collecting in crevice reservoirs, with ice or vapor occupying central pore regions.

Figure 2.
Material properties: (a) Moisture retention curves derived from measurements made during liquid infiltration; here, the liquid saturation can be equated with the total water content S. (b) Approximated freezing curves, with power-law fits to the high saturation range (note the log scale, temperatures T decrease to the right with increased deviation from ).

Figure 3.
Unsaturated cracking behavior: (a) Increase to the temperature offset from bulk melting required for frost cracking as a function of total water content in unsaturated conditions, calculated from Equation (7). (b) Approximate scaling for expected reductions in the susceptibility to frost damage as a function of total water content in unsaturated conditions from Equation (8), calculated with so that the exponent .

Figure 4.
Winter environmental forcing during two weeks in Golden obtained with inputs representative of weather during 1991–2005: (a) Outdoor dry-bulb and corresponding wall temperatures calculated for stabilized rammed earth at the near-surface depths noted in the legend. (b) Temperature gradients calculated at the midpoints between the outermost cells from the temperatures in (a); positive values represent daytime heat flow into the wall. Surface relative humidity is plotted against the right axis.

Figure 5.
Daily frost damage porosity change from Equation (1) (obtained with inputs from the first weather file listed in Table 2): (a) Water saturated conditions with the values of listed in Table 1. (b) Unsaturated conditions with based on surface relative humidity conditions to obtain . Note the change in axis scale. The horizontal blue lines span the date range of the time series shown in Figure 4.
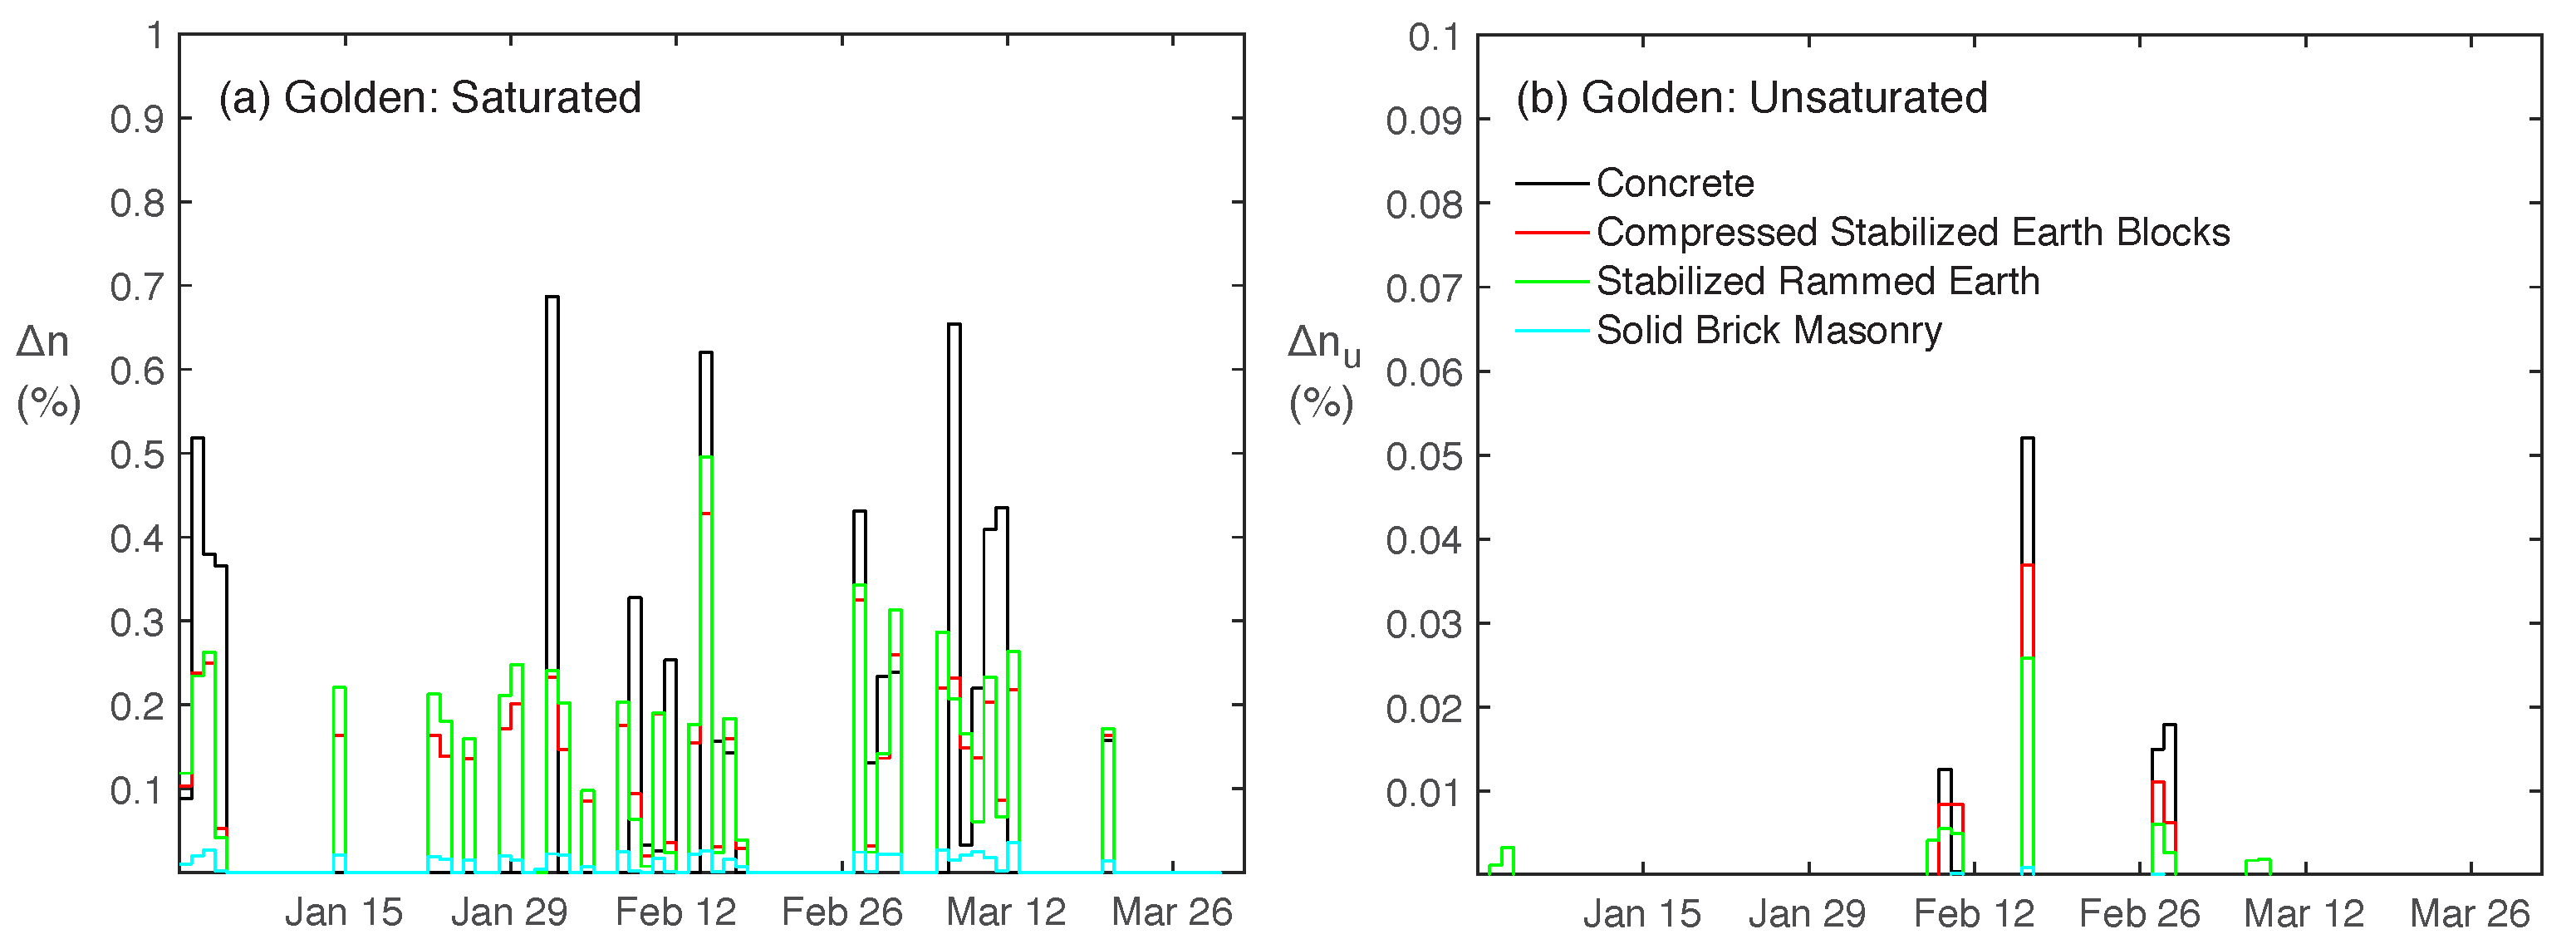
Figure 6.
Daily frost damage index (in %) from Equation (1) assuming saturated conditions. Colors represent different wall materials following the legend at the bottom. Blue line beneath Helsinki panel highlights a time interval discussed further in the text.
Figure 6.
Daily frost damage index (in %) from Equation (1) assuming saturated conditions. Colors represent different wall materials following the legend at the bottom. Blue line beneath Helsinki panel highlights a time interval discussed further in the text.

Figure 7.
Surface temperature time series (in C) on stabilized rammed earth walls. Results for other wall constructions are similar. Blue arrows and line highlight particular dates discussed in the text.
Figure 7.
Surface temperature time series (in C) on stabilized rammed earth walls. Results for other wall constructions are similar. Blue arrows and line highlight particular dates discussed in the text.

Figure 8.
Daily frost damage porosity change (in %) from Equation (1) in unsaturated conditions. Blue arrows and line highlight particular dates discussed in the text.
Figure 8.
Daily frost damage porosity change (in %) from Equation (1) in unsaturated conditions. Blue arrows and line highlight particular dates discussed in the text.

Figure 9.
Time series of relative humidity (in %) on the surface of stabilized rammed earth walls. Results for other wall constructions are similar. Blue arrows and line highlight particular dates discussed in the text.
Figure 9.
Time series of relative humidity (in %) on the surface of stabilized rammed earth walls. Results for other wall constructions are similar. Blue arrows and line highlight particular dates discussed in the text.

Figure 10.
Daily frost damage porosity change from Equation (1) assuming saturated conditions using the more recent weather files listed in Table 2. The date range spanned by the blue line beneath the Helsinki panel is discussed further in the text.

Figure 11.
Daily frost damage porosity change from Equation (1) in unsaturated conditions using the more recent weather files listed in Table 2. Arrows beneath the Helsinki panel within the date range marked in blue point to three prominent peaks that are highlighted in the discussion.

Figure 12.
Factors underlying the increased frost vulnerability of stabilized rammed earth in Helsinki, Finland, comparing recent climate conditions with those of 30 years ago: (a) South-facing wall surface porespace relative humidity RH, outdoor air relative humidity, surface porespace temperature T, and outdoor air dry-bulb temperature reported by an EnergyPlus simulation using the TMYx.2003-2017 weather file, compared in panel (b) to the same parameters reported by a simulation using the IWEC weather file representing years from 1982–1993. Gray shaded areas indicate hours at high relative humidity in the frost-cracking window.

Table 1.
Material properties used to model frost cracking. Note: the porosity n, dry density , thermal conductivity , heat capacity c, and vapor diffusion resistance factor are all inputs to the EnergyPlus [115] calculations used to obtain temperature and moisture time series, as outlined in Section 2.3; a complete list of nomenclature is provided in Table A1.
| Property | Stabilized Rammed Earth | Compressed Stabilized Earth Blocks | Solid Brick Masonry | Concrete |
|---|---|---|---|---|
| n | 0.295 | 0.14 | 0.24 | 0.16 |
| (kg m) | 1900 | 1735 | 1900 | 2275 |
| (W m K) | 0.643 | 0.7 e | 0.6 | 1.7 |
| c (J kg K) | 868 | 836 | 850 | 850 |
| 7.6 | 5.9 | 10 | 147 | |
| (K) | 0.40 | 0.15 | 0.44 | 0.85 |
| 0.45 | 0.31 | 0.65 | 0.35 | |
| 3.6 | 2.5 | 5.2 | 2.8 | |
| (C) | ||||
| (m) | ||||
| C (m K day) |
Table 2.
Climates and weather files used to model environmental forcing.
| City | Köppen Climate | Description | Weather File | Years |
|---|---|---|---|---|
| Golden | Cold semi-arid | USA_CO_Golden-NREL.724666_TMY3 | 1991–2005 | |
| grassland | USA_CO_Boulder_HadCM3-A2-2020 | 2020 | ||
| Tongliao | Cold semi-arid | CHN_Nei.Mongol.Tongliao.541350_SWERA | 1975–1999 | |
| grassland | CHN_NM_Tongliao.541350_TMYx.2003-2017 | 2003–2017 | ||
| Philadelphia | Humid | USA_PA_Philadelphia.Intl.AP.724080_TMY3 | 1976–2005 | |
| subtropical | USA_PA_Philadelphia_HadCM3-A2-2020 | 2020 | ||
| Copenhagen | Oceanic | DNK_Copenhagen.061800_IWEC | 1983–1999 | |
| DNK_HS_Copenhagen-Kastrup.AP.061800_TMYx.2003-2017 | 2003–2017 | |||
| Stockholm | Oceanic | SWE_Stockholm.Arlanda.024600_IWEC | 1984–1993 | |
| SWE_ST_Stockholm.Arlanda.AP.024600_TMYx.2003-2017 | 2003–2017 | |||
| Ankara | Mediterranean | TUR_Ankara.171280_IWEC | 1982–1994 | |
| TUR_AN_Ankara.Central.171300_TMYx.2003-2017 | 2003–2017 | |||
| Toronto | Humid | CAN_ON_Toronto.716240_CWEC | 1961–1990 | |
| continental | CAN_ON_Toronto.Pearson.Intl.AP.716240_CWEC2016 | 2016 | ||
| Helsinki | Hemiboreal | FIN_Helsinki.029740_IWEC | 1982–1998 | |
| FIN_US_Helsinki-Vantaa.AP.029740_TMYx.2003-2017 | 2003–2017 | |||
| Montreal | Hemiboreal | CAN_PQ_Montreal.Intl.AP.716270_CWEC | 1961–1990 | |
| CAN_QC_Montreal-Mirabel.Intl.AP.719050_CWEC2016 | 2016 | |||
| Oslo | Hemiboreal | NOR_Oslo.Fornebu.014880_IWEC | 1983–1998 | |
| NOR_OS_Oslo-Fornebu.AP.014881_TMYx.2003-2017 | 2003–2017 | |||
| Winnipeg | Hemiboreal | CAN_MB_Winnipeg.718520_CWEC | 1961–1990 | |
| CAN_MB_Winnipeg-Richardson.Intl.AP.718520_CWEC2016 | 2016 | |||
| Anchorage | Subarctic | USA_AK_Anchorage.Intl.AP.702730_TMY3 | 1975–1999 | |
| USA_AK_ANCHORAGE_HadCM3-A2-2020 | 2020 |
[120]; TMY3, IWEC, CWEC, and SWERA files for time periods of 1991–2005 and earlier were obtained in EPW format from the EnergyPlus weather file database (energyplus.net/weather). TMYx.2003-2017 and CWEC2016 files were obtained from the Climate.OneBuilding.org database (climate.onebuilding.org/default.html), and HadCM3-A2-2020 files were obtained by processing the respective TMY2 files (energyplus.net/weather) with the Climate Change World Weather Generator (www.energy.soton.ac.uk/ccworldweathergen/).
© 2019 by the authors. Licensee MDPI, Basel, Switzerland. This article is an open access article distributed under the terms and conditions of the Creative Commons Attribution (CC BY) license (http://creativecommons.org/licenses/by/4.0/).
Share and Cite
MDPI and ACS Style
Rempel, A.W.; Rempel, A.R. Frost Resilience of Stabilized Earth Building Materials. Geosciences 2019, 9, 328. https://0-doi-org.brum.beds.ac.uk/10.3390/geosciences9080328
AMA Style
Rempel AW, Rempel AR. Frost Resilience of Stabilized Earth Building Materials. Geosciences. 2019; 9(8):328. https://0-doi-org.brum.beds.ac.uk/10.3390/geosciences9080328
Chicago/Turabian StyleRempel, Alan W., and Alexandra R. Rempel. 2019. "Frost Resilience of Stabilized Earth Building Materials" Geosciences 9, no. 8: 328. https://0-doi-org.brum.beds.ac.uk/10.3390/geosciences9080328
Note that from the first issue of 2016, this journal uses article numbers instead of page numbers. See further details here.