1. Introduction
As a large and densely-populated city, Beijing occupies an area of approximately 1400 km
2 and has a population of over 20 million, approximately 86% of which was living in the urban area as of 2012 [
1]. Since 2000, the average annual increase in municipal solid waste (MSW) generation has been approximately 6.7% [
2]. The most remarkable change is that related to the percentage of food waste, which increased from 44.2% in 2000 to 69.3% in 2009 [
3,
4]. In the last decade, over 80% of total collected waste was taken to landfill sites for disposal, with only a small proportion subject to compost and incineration [
5]. For example, total MSW collected in 2009 was 6.56 million tons, of which 83.5% ended up in landfill; less than 4% was composted, and the remaining 12% was incinerated [
6]. This long-term predominance of landfill has not only led to the loss of a great deal of valuable land resources and caused waste disposal-related pollution, but has also resulted in extensive misallocation of resources [
3,
7,
8]. Beijing has launched waste separation campaigns since 2010 to reuse and recycle more waste resources and make the landfill-based waste management system more integrated.
1.1. Program Progress
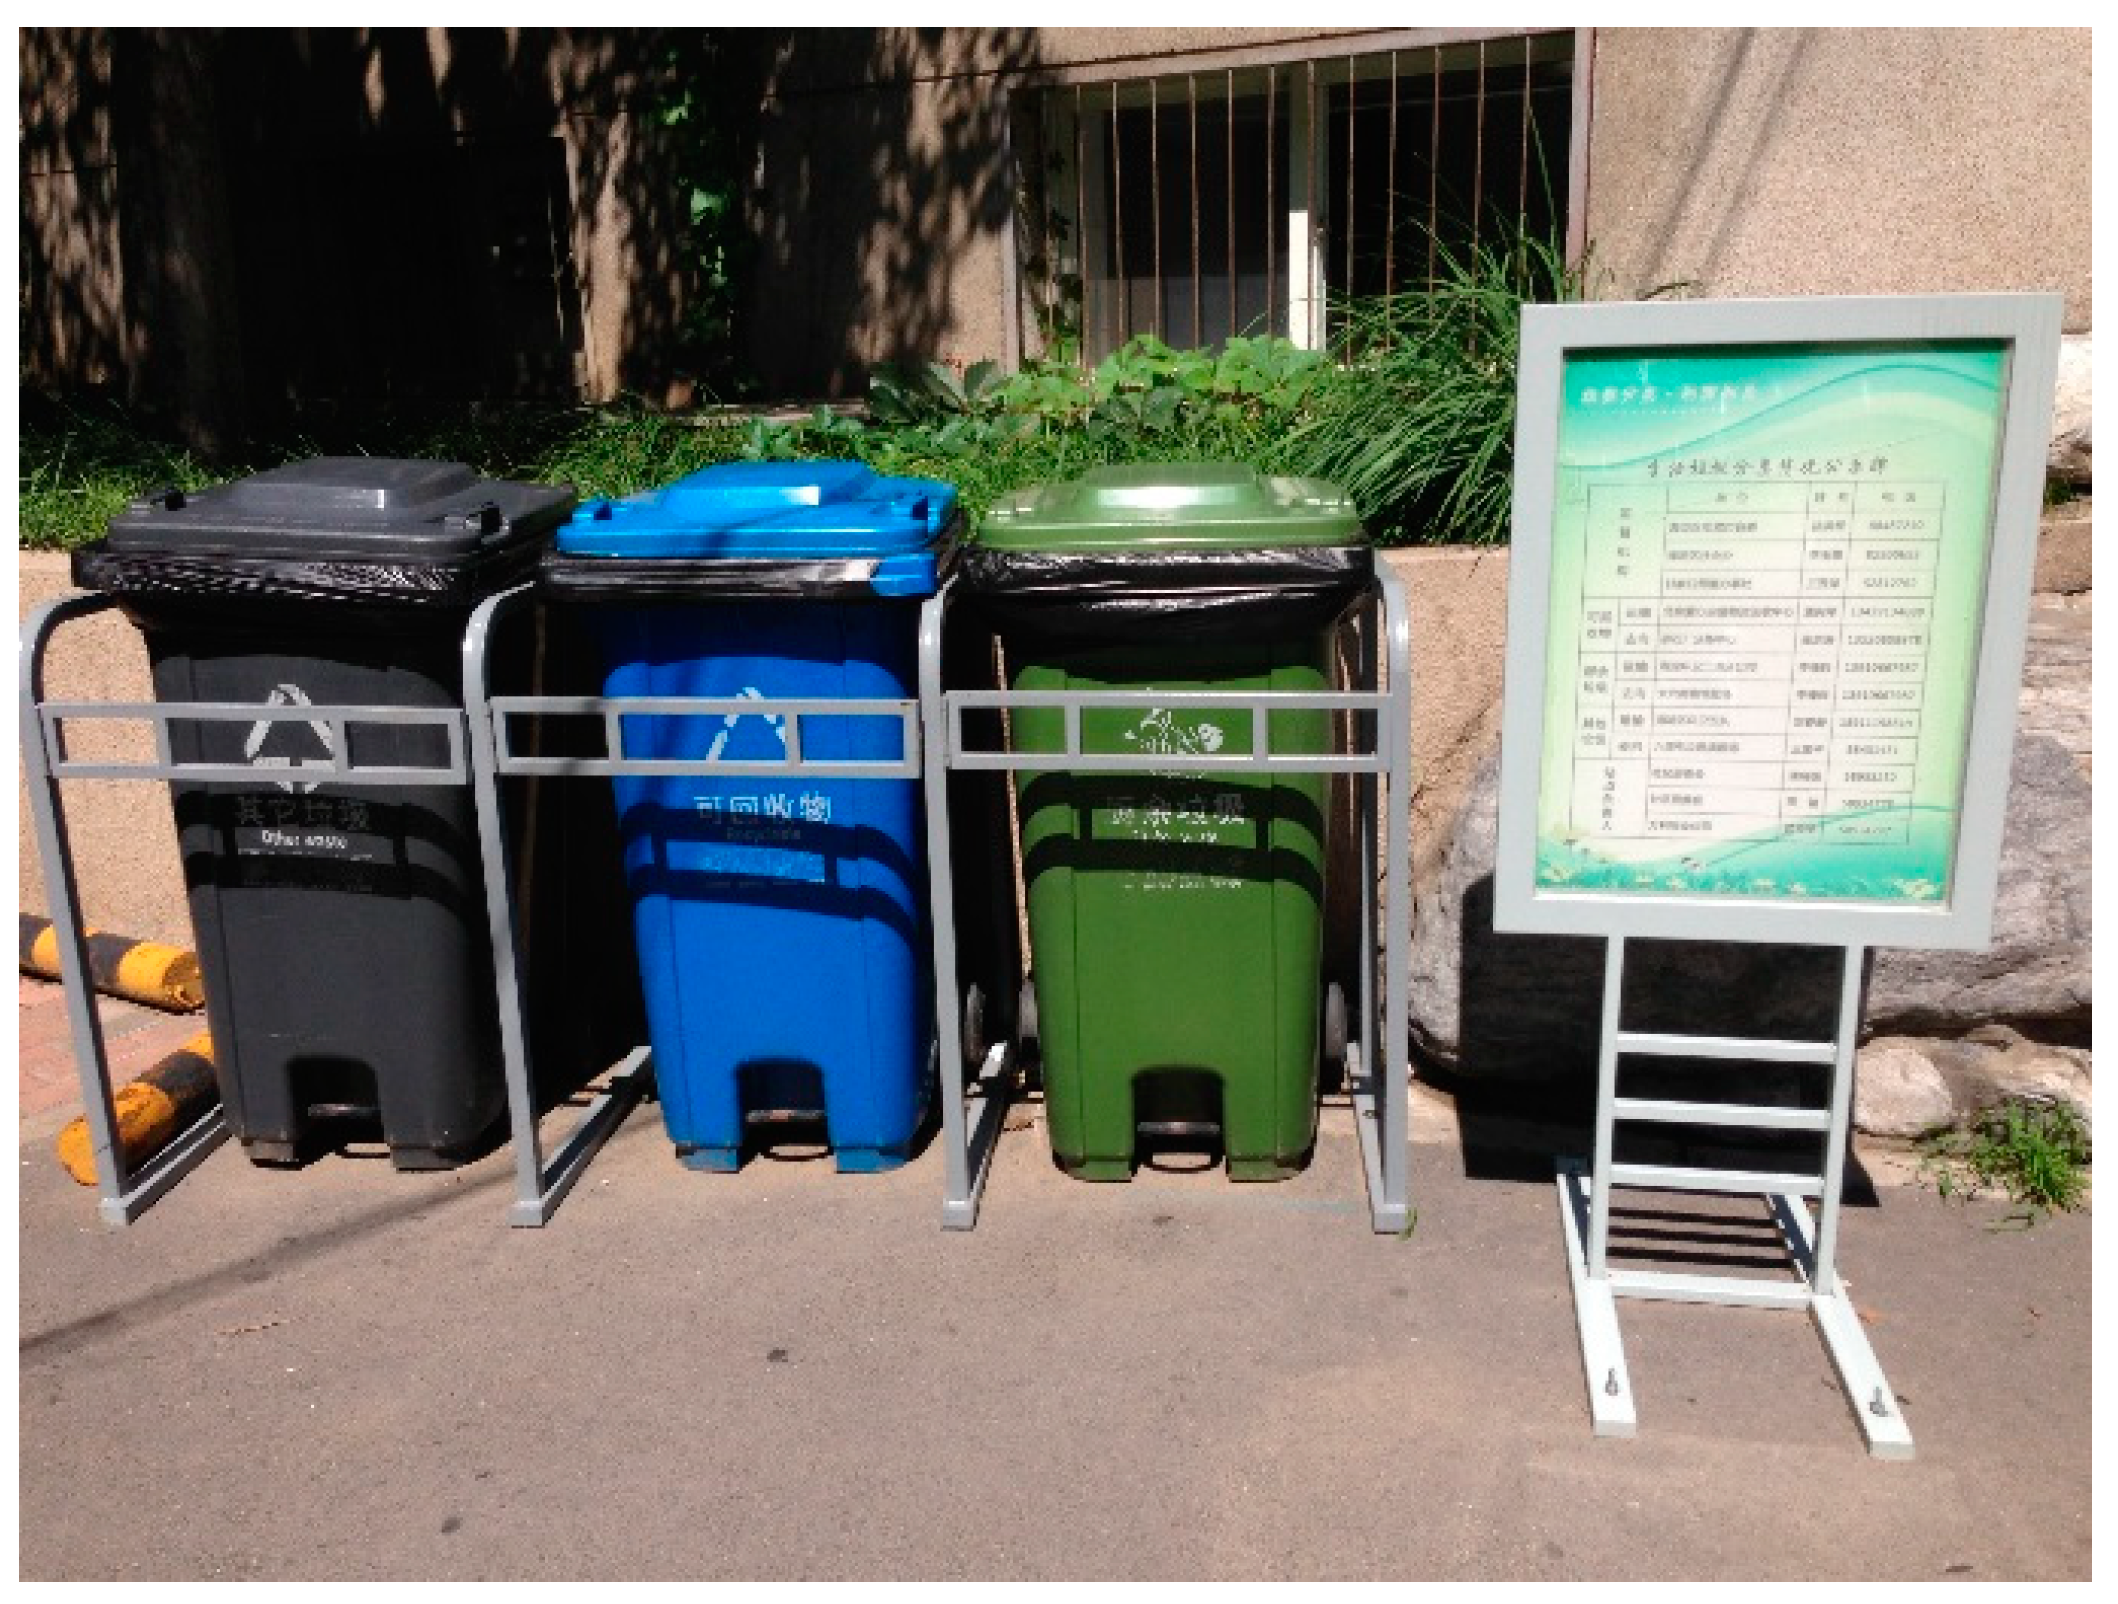
Every year, hundreds of pilot communities are selected from throughout the Beijing area. Households in these communities are encouraged to separate their waste into kitchen, recyclable and other, with each type put into a corresponding community container (
Figure 1). Sets of these containers, each clearly labeled and bearing detailed usage instructions, are placed in front of each residential building. The containers are also color-coded to help residents correctly dispose of their separated waste; for instance, the green bin is for kitchen waste. To encourage households to actively separate their waste as required, the local government has invested considerable funds in publicity, such as issuing households with handbooks that detail the separation system and free provision to each household of two types of waste containers (barrels and a half-year supply of biodegradable plastic bags). Meanwhile, the local government has hired garbage classification instructors (each overseeing 80–120 households) for every pilot community to provide guidance, especially with regard to kitchen waste. Respondents can also put their waste in community garbage bins in front of their residential building without time limitations or extra fees. As of the end of 2012, the program covered 2412 communities, more than half of all communities in Beijing. The local government hopes to continue expanding the program to more communities.
Figure 1.
A set of community garbage bins: other waste, recyclable waste and kitchen waste (from left to right).
Figure 1.
A set of community garbage bins: other waste, recyclable waste and kitchen waste (from left to right).
Although considerable money and effort have been invested in these pilot communities, the latest research shows source separation of household kitchen waste remains at the beginning stage. An October 2012, survey by the Beijing-based environmental organization, Friends of Nature, examined 60 pilot communities involved in the separation campaign since its introduction in 2010 [
9]. It found that the program had made little progress, and only 1% of a sample of 240 kitchen waste bins contained correctly separated waste. This was the same finding as in a survey conducted by Deng
et al. [
10]. Residents’ failure to properly separate kitchen waste forced local government to establish special teams to perform resorting.
1.2. Literature Review
Economically-based measures have been widely adopted, especially in Europe, to encourage households to engage in sorting to contribute to sustainable development. However, the results have differed case-by-case. For example, there were several failures, such as in Liechtenstein and Norway, and inconspicuous success in Ireland, while in the Netherlands, Belgium, Italy, Luxemburg, Sweden and especially in Denmark and Ireland, economic measures have been highly successful [
11,
12].
Studies [
13,
14] showed that apartment residents are willing to pay for others to sort their waste, because the task has a cost in that it takes up already limited space and can be seen as an added burden due to this restriction. Sorting waste is also time consuming [
13,
15]. There is an opportunity cost of time in terms of foregone leisure for households that take the time to sort [
16]. Czajkowski
et al. [
17] and Halvorsen [
18] respectively indicated Polish and Norwegian households had willingness to pay (WTP) to let others handle the task. Sterner and Bartelings [
19], Bruvoll
et al. [
15] and Berglund [
13] employed contingent valuation (CV) methods and estimated the respective annual average WTP of Swedish, Norwegian and Swedish households to avoid waste sorting.
In contrast to these earlier studies, we seek to analyze Chinese household kitchen waste separation (HKWS) in greater detail. Although HKWS services have thus far been studied through means, such as cost-benefit analysis [
20], comparative analysis [
21], household waste separation method analysis [
2,
22],
status quo analysis [
10] and factor analysis [
23], there is a lack of understanding of economic analysis on residents’ attitudes toward these services.
1.3. Purpose of This Study
Based on the current situation of HKWS in Beijing and earlier studies, our hypothesis is that some people who might be environmentally conscious, but who, for instance, consider the activities involved to be too time consuming to fit into their daily life. If this supposition is correct, we expect households’ WTP to support kitchen waste sorting services. This study applied the CV method to analyze how much the sample urban households living in Beijing apartments were willing to pay to let someone else do the sorting. The WTP estimate would help indicate to what extent sorting waste at the source is perceived as a household expense. This study also seeks to elicit the determinants of residents’ WTP.
This paper is structured as follows.
Section 2 briefly introduces the CV method.
Section 3 introduces the questionnaire design and data collection.
Section 4 presents the estimation results and discussion. Finally, a brief conclusion is given in
Section 5.
2. Methodology
As a method to elicit consumer valuations of nonmarket resources, the CV method has been widely used by researchers and policy-makers for several decades [
24]. The CV method includes various questionnaire versions and approaches, such as open- or close-ended, and the payment card, while the dichotomous choice (DC) method proposed by Hanemann [
25] is most commonly applied, because it reduces the cognitive burden placed on the respondent and mimics a real market transaction [
26]. The DC format, however, suffers from a major limitation [
26] despite its ability to measure total economic value. That is, respondents may not answer WTP questions accurately, and therefore, it does not reveal the “true” WTP, but may still give better results when the data are well analyzed [
27]. The CV method was also approved as a reliable method by members of the NOAA Blue Ribbon Panel, including two Nobel Prize winners [
28].
The basic theory of the dichotomous CV method was proposed by Hanemann [
25]. Suppose a respondent is asked to consider the change from the
status quo
to
, where
describes environmental quality. Presumably, the latter choice is preferable to the former. Denote the indirect utility of respondents as
, where
P is a vector of prices,
I is respondent household income and
Z is a vector of respondent characteristics. Then, if the respondent is asked whether he would be willing to pay amount
M to obtain
, his answer would be “yes” if the following condition appears (where
denotes the probability):
where
and
are unobservable components of the utility and the identically and independently distributed random variable with zero mean. If we define
and
, Equation (1) can be rewritten as:
where
represents the cumulative density function of the respondent’s true maximum WTP.
The probit and logit model are commonly applied to analyze the DC format of the CV method. In this study, we used the logistic function, which is as follows:
where
α is a constant term,
BID is the price variable that respondents were asked to pay,
βBID is the coefficient for
BID,
S is the total number of other variables, such as respondent demographic information and their responses to the attitudinal questions, and
βi is the coefficient of variable
xi. This logistic function could be estimated with maximum likelihood. Let
be an indicator variable for the
k-th observation, with:
Therefore, the log-likelihood function is formed as:
where
N is the total number of observations. In this case, the mean WTP could be estimated by the following estimator:
where
is the estimated constant term,
is the estimated coefficient of
BID,
represents the estimated coefficient for the
i-th variable and
is the mean value of variable
.
3. Questionnaire Design and Data Collection
To identify local residents’ attitudes about HKWS services and their WTP for the proposed services, we followed Arrow
et al. [
29], who reiterated that CV questionnaires should be designed to get respondents to think seriously about the topic of interest, to provide the necessary information for them to be able to make informed decisions and to encourage them to identify and reveal their monetary valuations. The questionnaire of this study included five sections. Questions in the first section covered questions relating to households’ knowledge and awareness towards the environment and towards food waste management in general. The second section focused on respondents’ current situation regarding household kitchen waste generation and separation. Residents were then asked attitudinal questions related to household kitchen waste source separation. The fourth section proposed an HKWS scheme and used a DC question to elicit respondents’ WTP for HKWS services. The fifth section collected information on the households’ socioeconomic characteristics.
In the fourth part of the questionnaire, respondents can vote for or against the labeling program or can select the third choice, the “not sure” response [
30]. Moreover, respondents who vote against or are not sure are asked to summarize the reason for their decision. The Appendix shows how the HKWS services and its associated price were presented to respondents.
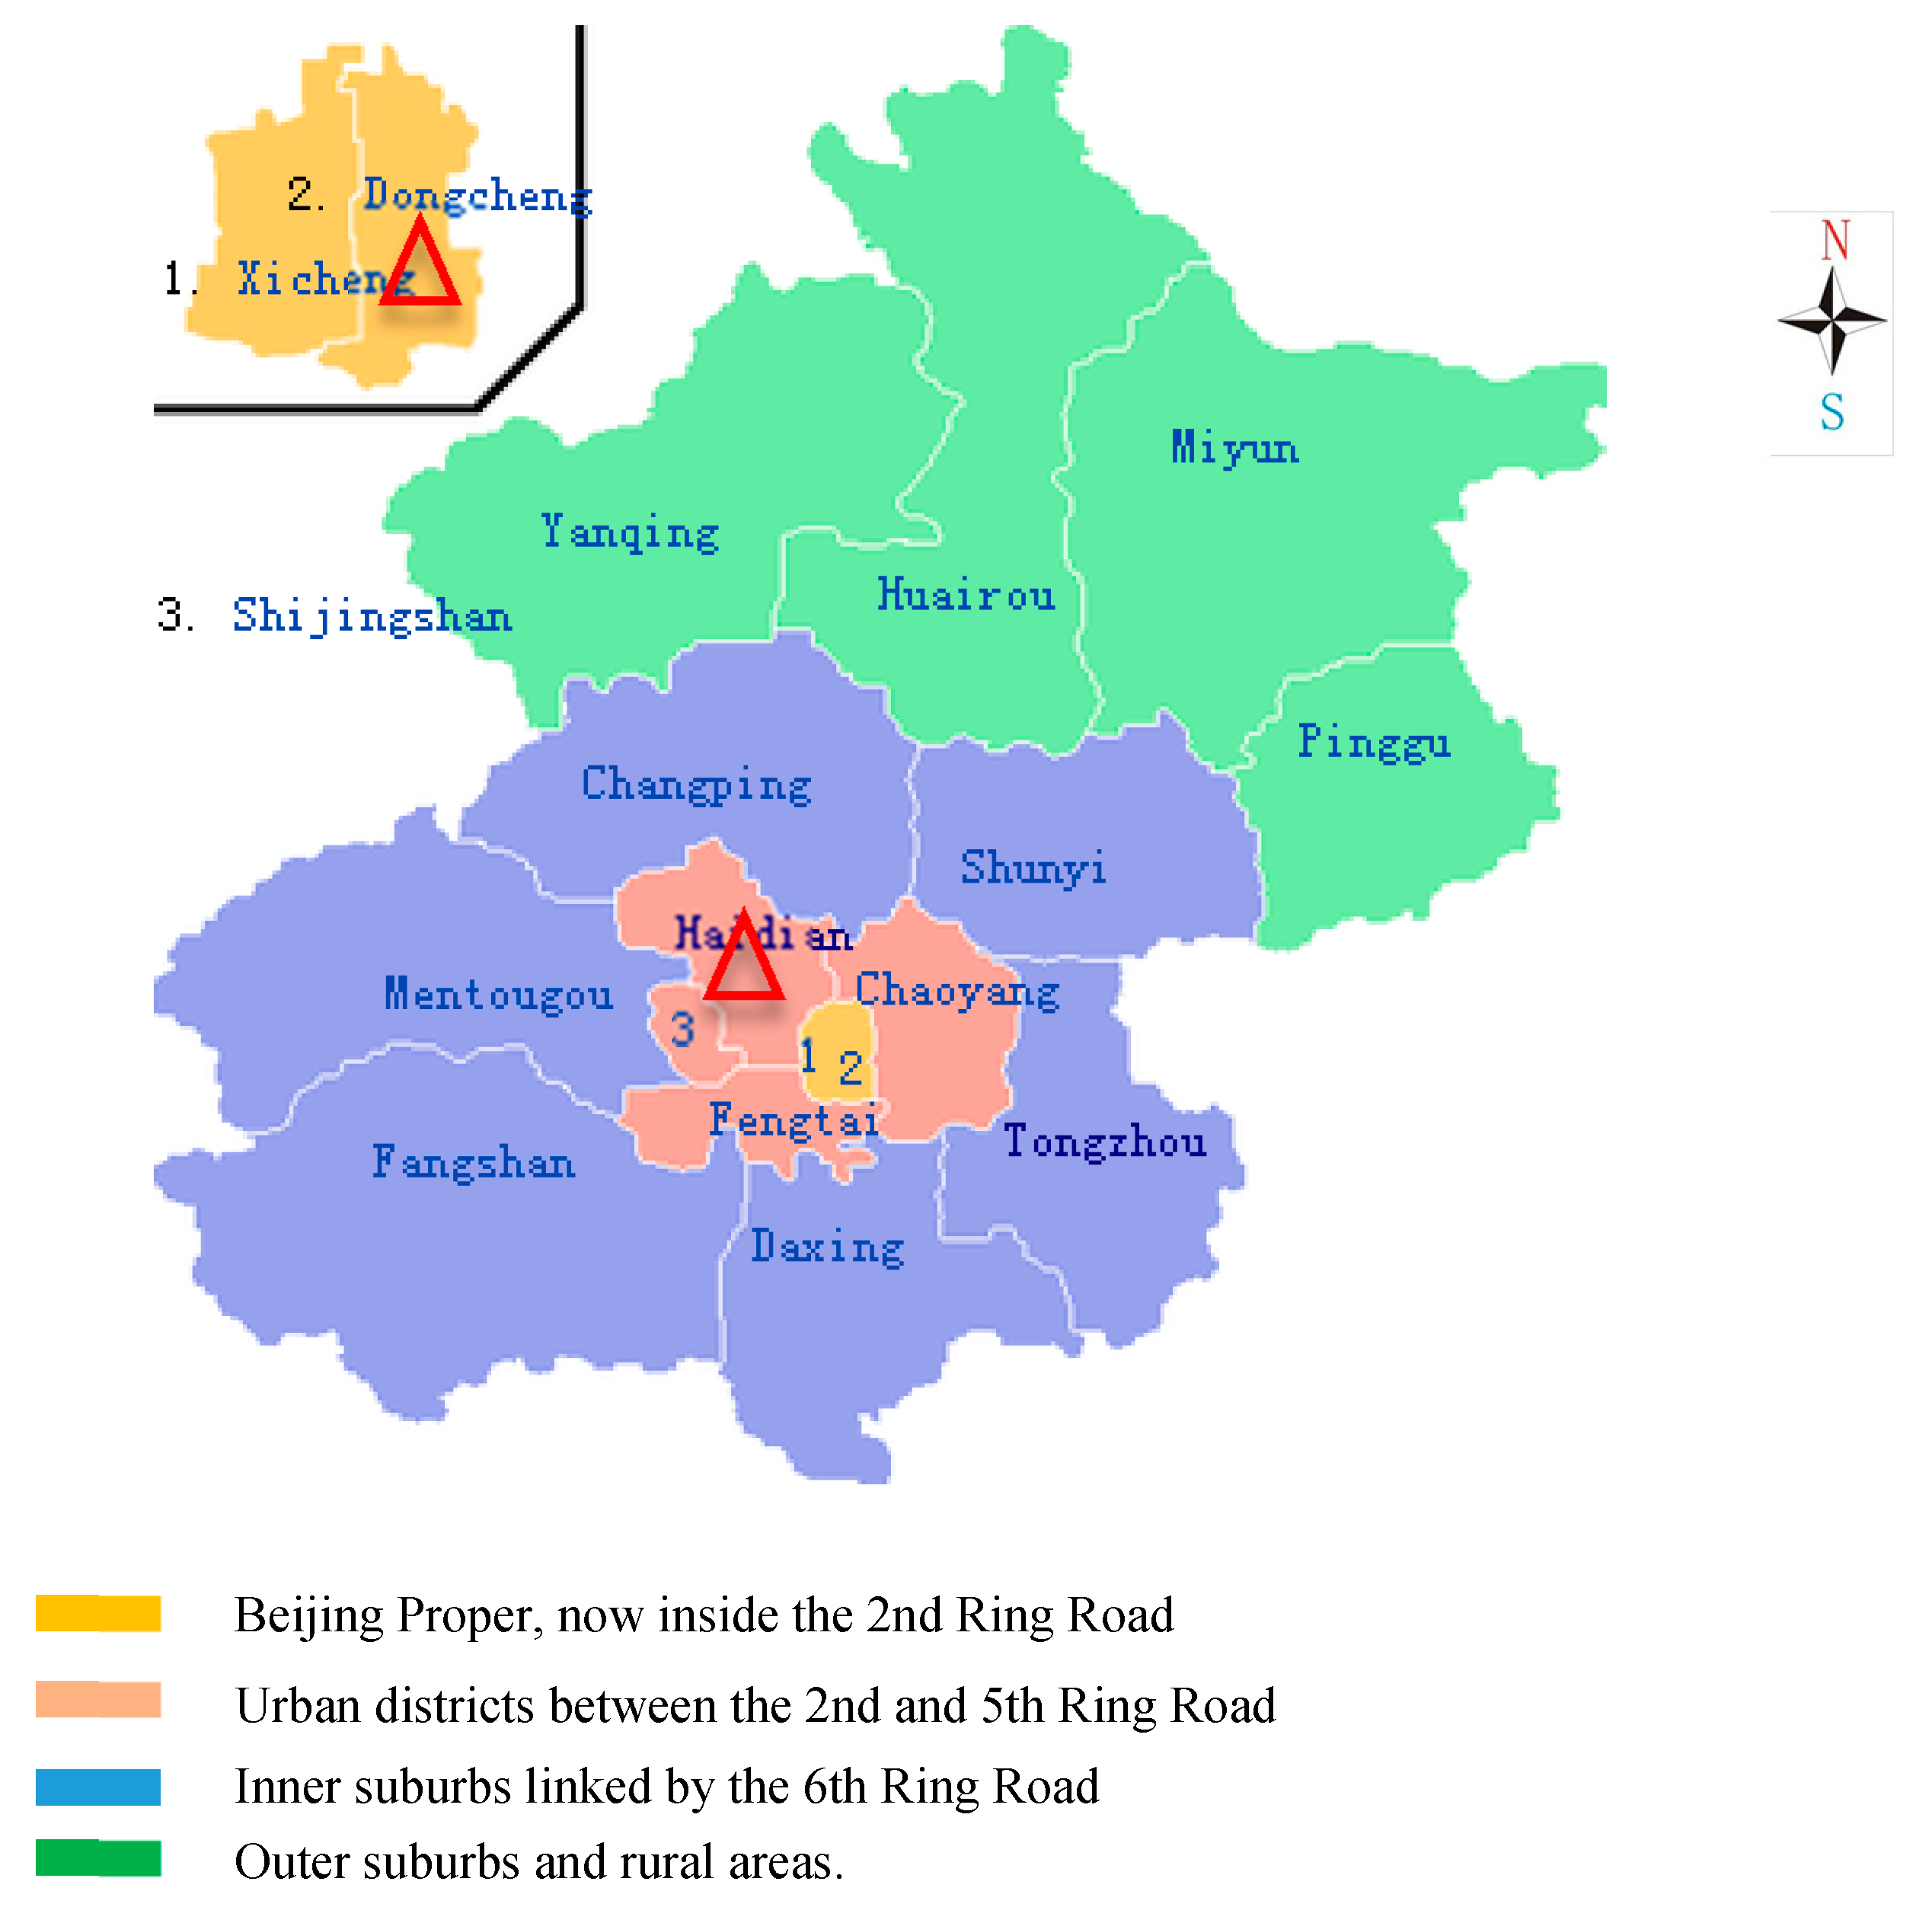
This study focused on the main area of Beijing city, namely the red and yellow parts as
Figure 2 shows, which includes six districts: Dongcheng, Xicheng, Haidian, Chaoyang, Fengtai and Shijingshan. During this survey, a three-stage sampling technique was employed. The first stage involved the use of purposive sampling techniques, whereby two districts, Haidian and Dongcheng, were selected. Because of time and budget constraints, 12 communities (8 from Haidian and 4 from Dongcheng) were randomly selected from all of the 651 pilot communities of Dongcheng and Haidian districts (511 from Haidian and 140 from Dongcheng). During the third stage, respondents were collected randomly and interviewed face-to-face in each selected community. We realized that each target community had a different number of residential buildings with a different number of households (600–3000). To acquire the necessary information and to ensure that the selected households cover all parts of the community, we visited the community service center of each target community before conducting the survey. The interviewers visited the communities at different times of the day to avoid interviewing only a particular group of respondents, such as the unemployed, seniors or retirees.
Figure 2.
Map of Beijing and survey area (source: Google maps).
Figure 2.
Map of Beijing and survey area (source: Google maps).
The survey took place from 20 June to 1 August 2013. The pretested survey conducted in the first seven days involved 30 households in three pilot communities. Based on the results of the pilot survey, five bid values were used for the service price: US$0.48, 0.81, 1.29, 1.94 and 3.07 (3, 5, 8, 12 and 19 Chinese Yuan (CNY), respectively) per household per month. Therefore, we separated respondents into five groups, with each equally likely to be among the randomly-selected households. At the end of the survey, we approached 401 households.
4. Results and Discussion
After eliminating responses with missing or inconsistent answers to the valuation questions, 391 (97.5%) were valid.
Table 1 gives descriptive statistics of the main socioeconomic characteristics of the respondents and statistical results from the Beijing Statistic Yearbook [
1].
Table 1.
Demographic characteristics of the sample and statistics.
Table 1.
Demographic characteristics of the sample and statistics.
| Item | Level | Frequency | % | %S | | Item | Level | Frequency | % | %S |
|---|
| Gender | Female | 225 | 57.54 | 50 | | Economic level | Low income | 126 | 32.23 | -- |
| Male | 166 | 42.46 | 50 | | Middle income | 196 | 50.13 |
| Age (in years) | ≤29 | 66 | 16.88 | 38 | | High income | 69 | 17.65 |
| 30~59 | 225 | 57.54 | 48 | | Household size (in person) | 1 | 26 | 6.65 | 22 |
| ≥60 | 100 | 25.58 | 14 | | 2 | 69 | 17.65 | 31 |
| Education | No high school | 123 | 31.46 | 44 | | 3 | 135 | 34.53 | 31 |
| High school or equivalent | 102 | 26.09 | 22 | | 4 | 75 | 19.18 | 9 |
| College or above | 166 | 42.46 | 32 | | ≥5 | 86 | 21.99 | 7 |
| Local | No | 153 | 39.13 | 37 | | District | Haidian | 262 | 67.01 | 79 |
| Yes | 238 | 60.87 | 63 | | Dongcheng | 129 | 32.99 | 21 |
| House ownership | Own house | 275 | 70.33 | -- | | Total | 391 | 100 | 100 |
| Otherwise | 116 | 29.67 |
The gender distribution in the samples was ~58% female; higher than the average level. This high percentage may be because the survey was mainly conducted in the daytime, making it more difficult to interview working male respondents. About 58% of the respondents were aged 30–59. The highest percentage of respondents had attained a four-year university degree or higher level of education (42.46%). This is higher than the average Beijing statistical level of ~32%, but is reasonable, because central urban areas typically have more highly-educated residents than suburban areas. In this study, 60.87% of the respondents were local people. The highest percentage of respondents were living in their own apartment (70.33%). To estimate respondents’ satisfaction with their household income, we asked them do a self-assessment of their household’s economic level among Beijing city households based on three levels: low, medium and high. These were respectively around 32%, 50% and 18%. The highest percentage of households had three residents. The bias of the sample distribution to the statistics in Haidian and Dongcheng districts is probably because the target communities were randomly selected from all pilot communities in the two districts, as mentioned in the section on questionnaire design and data collection. The irreconcilable sample distribution is therefore understandable. Because the yearbook is limited in that it does not provide exact attribute distribution of the urban areas of the Dongcheng and Haidian districts of Beijing, the values from the yearbook results cannot be seen as a precise reference for the survey. Besides, the main purpose of this study is to derive useful policy implications, so those differences between our sample and statistics appear acceptable.
4.1. The Dependent Variable
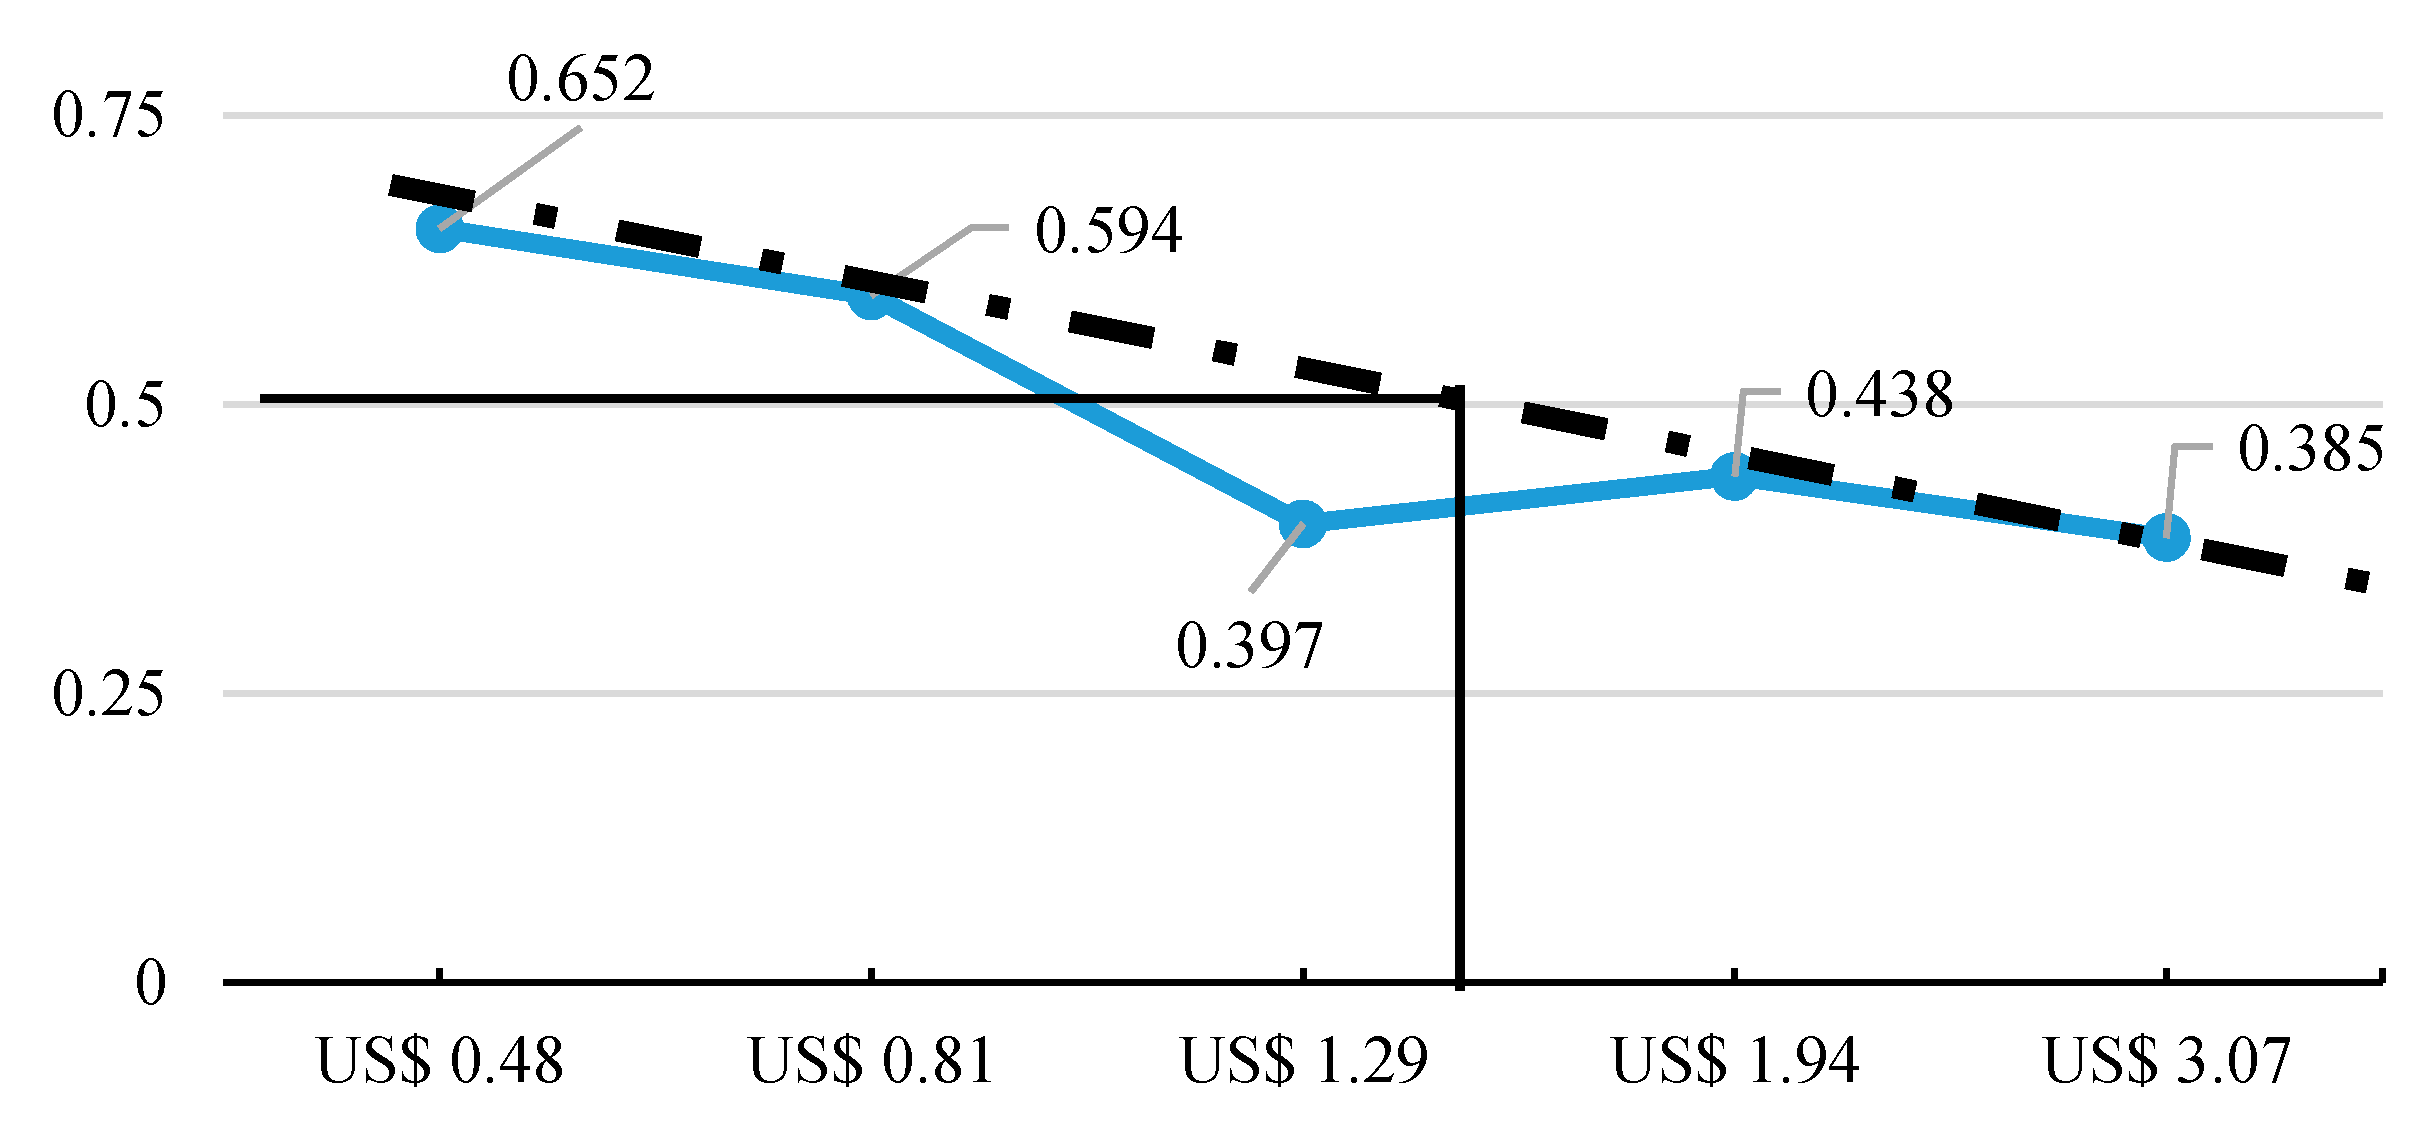
Table 2 lists the distribution of respondents’ acceptance of the price bid for the HKWS services. Among 391 samples, there were about 41% that agreed to pay the given discrete choice amount. For 229 non-yes respondents, 200 answered “no” and 29 indicated that they were “not sure”, which account for about 51% and 8% of 391 respondents, respectively. Besides, the acceptance gradually decreases with increasing bid price. For instance, among five offered bids, US$0.48 per household per month had the highest acceptance percentage at about 54%, while US$3.07 per household per month showed the lowest acceptance of about 32%.
Table 2.
Respondent acceptance of different household kitchen waste separation (HKWS) fees.
Table 2.
Respondent acceptance of different household kitchen waste separation (HKWS) fees.
Bid Value
(US$ per Household per Month) | Yes | | No | | Not sure | | Total |
|---|
| Frequency | % | | Frequency | % | | Frequency | % | | Frequency | % |
|---|
| 0.48 | 43 | 54.43 | | 32 | 40.51 | | 4 | 5.06 | | 79 | 100 |
| 0.81 | 41 | 51.25 | | 33 | 41.25 | | 5 | 7.50 | | 79 | 100 |
| 1.29 | 25 | 32.47 | | 46 | 61.04 | | 5 | 6.49 | | 76 | 100 |
| 1.94 | 28 | 35.00 | | 42 | 53.75 | | 8 | 11.25 | | 78 | 100 |
| 3.07 | 25 | 31.65 | | 47 | 59.49 | | 7 | 8.86 | | 79 | 100 |
| Total | 162 | 41.01 | | 200 | 51.14 | | 29 | 7.85 | | 391 | 100 |
Table 3 reveals reasons for the 229 respondents’ non-yes excuse to pay the given discrete sum. The highest percentage of respondents who reported unwillingness to pay (about 52.84% of the non-positive responses) referred to Reason 1: “I would like to separate kitchen waste by myself.” Additionally, 33 respondents (about 14.41% of the non-positive responses) indicated “It’s not my responsibility to pay for this kind of waste separation services,” making this the second most frequently cited reason for refusing to contribute financially to support the HKWS services. These non-positive respondents are divided into two types according to their reasons for being unwilling to pay, as in Haab and McConnell [
30], Pearce [
31], Thuy [
32], Khai and Yabe [
33] and Kontoleon
et al. [
34]. Type I, named “valid 0 bid”, comprises respondents who indicated that they were not willing to pay the offered price, yet had a positive attitude to the proposed program, which includes the first four reasons with 165 respondents listed in
Table 2; for example, they do not want to pay, but nevertheless support the program through their behavior (Reason 1) or may be willing to pay a lower price than the offered bid price (Reason 2). Type II, named “protest bid”, comprises respondents opposed to the program in an absolute sense and who would not provide any positive support to it, which includes 64 respondents with reasons from 5 to 8.
As
Table 4 shows, compared with the other two group respondents, young and highly-educated respondents tend to belong to the “yes” group, while female and male respondents tend to be in the “non-protest” and “protest” respondents, respectively. Meanwhile, respondents with self-reported low household income were more likely to belong to the “protest” group. There are no significant differences in attitude concerning the proposed HKWS services between households with different sizes.
Table 3.
Frequency of reasons for responses who would not pay or were not sure about paying for the HKWS services.
Table 3.
Frequency of reasons for responses who would not pay or were not sure about paying for the HKWS services.
| Type | Reasons | Frequency | % |
|---|
| Type I (Valid 0 bid) | 1. I would like to separate my kitchen waste by myself. | 121 | 52.84 |
| 2. The price is too high, otherwise I would buy. | 26 | 11.35 |
| 3. I have no extra income, otherwise I would contribute. | 14 | 6.11 |
| 4. The quantity of kitchen waste in my home is too few to separate. | 4 | 1.75 |
| Type II (Protest bid) | 5. I do not believe that this program would bring any change to the environment. | 9 | 3.93 |
| 6. It is not my responsibility to pay. | 33 | 14.41 |
| 7. I do not believe in this program. | 14 | 6.11 |
| 8. Others | 8 | 3.49 |
| Total | 229 | 100 |
Table 4.
Demographic characteristics of the yes, non-protest and protest bidders.
Table 4.
Demographic characteristics of the yes, non-protest and protest bidders.
| Item | Level | Yes | | Non-Protest | | Protest |
|---|
| Frequency | % | | Frequency | % | | Frequency | % |
|---|
| Gender | Female | 87 | 53.70 | | 115 | 69.70 | | 23 | 35.94 |
| Male | 75 | 46.30 | | 50 | 30.30 | | 41 | 64.06 |
Age
(in years) | ≤29 | 39 | 24.07 | | 19 | 11.52 | | 8 | 12.50 |
| 30~59 | 96 | 59.26 | | 95 | 57.58 | | 34 | 53.13 |
| ≥60 | 27 | 16.67 | | 51 | 30.91 | | 22 | 34.38 |
| Education | No high school | 40 | 24.69 | | 58 | 35.15 | | 25 | 39.06 |
| High school or equivalent | 34 | 20.99 | | 49 | 29.70 | | 19 | 29.69 |
| College or above | 88 | 54.32 | | 58 | 35.15 | | 20 | 31.25 |
| Economic level | Low income | 46 | 28.40 | | 60 | 36.36 | | 20 | 31.25 |
| Middle income | 88 | 54.32 | | 75 | 45.45 | | 33 | 51.56 |
| High income | 28 | 17.28 | | 30 | 18.18 | | 11 | 17.19 |
| Household size | 1 | 9 | 5.56 | | 12 | 7.27 | | 5 | 7.81 |
| 2 | 20 | 12.35 | | 34 | 20.60 | | 15 | 23.44 |
| 3 | 59 | 36.42 | | 58 | 35.15 | | 18 | 28.13 |
| 4 | 33 | 20.37 | | 32 | 19.39 | | 10 | 15.63 |
| ≥5 | 41 | 25.31 | | 29 | 17.58 | | 16 | 25.00 |
| Total | | 162 | 100 | | 165 | 100 | | 64 | 100 |
No protest respondents are involved in the following regression (327 samples were used for an 83.6% rate of the total valid sample) as in earlier research [
30,
31,
32,
33,
34]. Since the dependent variable, residents’ WTP for HKWS services, is a binary variable, it takes the value of one if a household is willing to pay the bid value presented and takes the value of zero otherwise.
Figure 3 roughly estimates the mean price (50% acceptance) of households’ WTP for the proposed HKWS services, as around US$1.45 per household per month.
Figure 3.
Respondents’ 50% acceptance of the proposed HKWS services (n = 327).
Figure 3.
Respondents’ 50% acceptance of the proposed HKWS services (n = 327).
4.2. The Independent Variable
For the independent variables, the offered bid price variable was involved in the regression model, which was always considered to significantly and negatively impact respondent WTP decisions. Socio-economic attributes, such as respondent gender, age and education experience, are also included.
Besides, the independent variables covered the variables of respondents’ attitude towards source separation of household kitchen waste, which were elicited by 28 five-level Likert scale statements [
18,
35,
36,
37] varying from strongly agree to strongly disagree.
Factor analysis with principal component analysis was conducted to group these attitude variables into a small number of interpretable underlying factors. The varimax rotation method [
38] was used and variables with loadings greater than 0.4 were considered highly loaded. As
Table 5 shows, Variables 1 to 5 load highly on Factor 1. This factor is labeled “attitudes” and can be best described as respondent attitudes toward HKWS. Variables 6 to 13 have high loadings on Factor 2; this factor is labeled “ability” and refers to respondents’ perceptions of their ability to perform HKWS. In detail, Variable 10 presents respondent social pressure and separation ability, while the results show it belongs to “ability” in this study. Factor 3 was labeled “social pressure”, because the variables with high loadings on this factor (Variables 14 to 17) concern respondents’ perceptions of the social pressure to separate kitchen waste. The variables that load highly on Factor 4 are numbered 18 to 22, and this factor is labeled “environmental consciousness”. The fifth factor was labeled “pro-environmental behavior”, for which Variables 23 to 25 loaded highly. The sixth factor, for which the remaining variables loaded highly, was named “self-centered perceptions”, and its meaning is easy to understand.
Table 5.
Rotated component matrix of 28 five-level Likert scale statements (n = 327).
Table 5.
Rotated component matrix of 28 five-level Likert scale statements (n = 327).
| Survey Statement | F1 | F2 | F3 | F4 | F5 | F6 |
|---|
| 1. HKWS is good for the environment. | 0.88 | 0.13 | −0.01 | 0.15 | 0.10 | −0.09 |
| 2. HKWS is a good activity. | 0.87 | 0.23 | 0.08 | 0.06 | 0.03 | −0.07 |
| 3. HKWS should be further promoted. | 0.83 | 0.21 | 0.01 | 0.11 | 0.16 | 0.04 |
| 4. HKWS helps save space in landfills. | 0.79 | 0.09 | 0.14 | 0.15 | −0.01 | −0.04 |
| 5. Kitchen waste in my home needs to be separated. | 0.77 | 0.27 | 0.13 | 0.12 | 0.03 | −0.09 |
| 6. Many opportunities to separate kitchen waste in my daily life. | 0.26 | 0.73 | 0.24 | −0.09 | 0.02 | −0.03 |
| 7. If I wanted to, I could separate kitchen waste at home. | 0.24 | 0.69 | 0.24 | 0.08 | 0.12 | −0.09 |
| 8. Separating kitchen waste at home would be an easy task. | 0.09 | 0.62 | 0.15 | 0.24 | 0.00 | −0.13 |
| 9. HKWS at home depends on me. | 0.13 | 0.62 | 0.22 | 0.15 | −0.01 | −0.24 |
| 10. If my neighbors separate their kitchen waste, I will, too. | 0.20 | 0.61 | −0.03 | −0.25 | 0.20 | −0.07 |
| 11. I am willing to go far in my habits to separate kitchen waste. | 0.15 | 0.60 | 0.01 | 0.50 | 0.11 | −0.05 |
| 12. Everybody could separate kitchen waste. | 0.24 | 0.49 | −0.11 | 0.41 | 0.18 | 0.03 |
| 13. My household has enough space to store kitchen waste. | 0.08 | 0.44 | 0.04 | 0.17 | 0.09 | −0.21 |
| 14. My neighbors think I should participate in HKWS. | 0.06 | 0.19 | 0.89 | −0.02 | 0.02 | −0.01 |
| 15. My friends think I should participate in HKWS. | 0.10 | 0.17 | 0.86 | 0.02 | 0.03 | 0.01 |
| 16. My community thinks I should separate my kitchen waste. | 0.03 | 0.04 | 0.65 | 0.32 | 0.07 | −0.03 |
| 17. My family thinks I should separate my kitchen waste. | 0.17 | 0.27 | 0.56 | 0.36 | −0.08 | −0.06 |
| 18. I feel guilty if I don’t separate my kitchen waste as required. | 0.18 | 0.16 | 0.07 | 0.65 | 0.13 | −0.17 |
| 19. I like to be thought of as being environmentally friendly. | 0.32 | 0.22 | 0.01 | 0.62 | 0.00 | 0.00 |
| 20. I have proper knowledge of how to separate kitchen waste. | −0.04 | 0.04 | 0.32 | 0.59 | 0.00 | 0.18 |
| 21. I feel guilty if I don’t put recyclables inside the right bins. | 0.18 | 0.01 | 0.19 | 0.46 | 0.31 | −0.13 |
| 22. I feel guilty if I buy daily items without environmentally-friendly labelling. | 0.03 | −0.23 | 0.29 | 0.41 | 0.35 | −0.02 |
| 23. Buying goods with reused or recycled packaging. | 0.16 | −0.04 | 0.00 | 0.02 | 0.82 | −0.19 |
| 24. Buying goods with little packaging. | 0.07 | 0.24 | 0.05 | 0.10 | 0.67 | −0.01 |
| 25. Selling recyclables to the recyclable waste collectors. | −0.04 | 0.23 | −0.05 | 0.16 | 0.55 | 0.23 |
| 26. Voluntary policy makes me less motivated to separate. | −0.07 | −0.13 | −0.10 | −0.01 | 0.10 | 0.76 |
| 27. No cooperation from family makes it very difficult to separate. | −0.01 | −0.18 | 0.11 | 0.16 | −0.12 | 0.75 |
| 28. I don’t want to separate kitchen waste. | −0.07 | −0.16 | −0.02 | −0.25 | −0.03 | 0.58 |
Table 6 lists the dependent and independent variables used in the following regression. The summary statistics of the variables indicate that about 38% of the 327 respondents were male, with an average age of approximately 44 years, and more than 40% had a college or higher educational level. Following the discussion above, our
a priori expectations for the signs of the regression coefficients are as follows. First, bid price negatively impacts WTP, which means respondent WTP decreases as bid price increases. Second, this study expects male respondents to be more willing to pay than females, because males typically earn more and are less frugal than females. Third, respondent ages are expected to negatively affect WTP for the services, because older people may have lower incomes and, thus, be less willing to pay. Fourth, the respondent’s level of education was asked to attain his or her level of understanding of the desirability of the proper management of kitchen waste. We expect that the higher the level of education, the more the respondent will understand the consequences of mishandling kitchen waste and the more value the individual will place on avoiding the risks posed by a polluted environment. Fifth, respondents with positive attitudes toward HKWS should have positive WTP, because those with positive attitudes toward understanding the benefits and risks of HKWS show a high WTP. Sixth, people with a higher perception of their own ability to perform separation are expected to have negative WTP, because this perception leads them to feel that it is less burdensome for them to separate kitchen waste by themselves. Seventh, respondents who think they are facing higher social pressure from peers have positive WTP, because greater pressure correlates to better following of rules and greater WTP. Eighth, respondents who appear more environmentally conscious are expected to have positive WTP because this correlates with a greater appreciation of a clean environment. Ninth, pro-environmental behavior is expected to have a positive effect on WTP, because people who take such actions are likely to have a greater sense of responsibility toward keeping the environment clean. Finally, respondents with self-centered views because of a lower sense of social responsibility are expected to be negatively related with WTP.
Table 6.
Descriptive statistics of the variables used in logistic regression (n = 327).
Table 6.
Descriptive statistics of the variables used in logistic regression (n = 327).
| Variables | Description | Mean | S.D. | Expected Sign |
|---|
| 1. Dependent |
| Services acceptance | 1 if the respondent is willing to pay for HKWS services, 0 if not | 0.50 | 0.50 | |
| 2. Independent |
| Bid | Offered bid value: 3, 5, 8, 12, and 19 (in RMB per household per month) | 9.33 | 5.70 | − |
| Socio-economic Attributes |
| Gender | 1 if the respondent is male; 0 if female | 0.38 | 0.49 | + |
| Age | Age of the respondent (in years, ranging from 11 to 83 years old) | 44.25 | 16.28 | − |
| Education | 1 if the education level of the respondent is college or above, 0 if otherwise | 0.45 | 0.50 | + |
| Attitudinal Attributes |
| Attitude | Attitudes towards kitchen waste separation (ranging from −1.93 to 6.01) | −0.04 | 0.96 | + |
| Ability | Perception of the respondent’s ability to perform the behavior of HKWS (ranging from −2.86 to 4.14) | −0.16 | 0.92 | − |
| Social pressure | Perception of the respondent’s social pressure to separate kitchen waste (ranging from −2.38 to 2.78) | −0.02 | 0.99 | + |
| Environmentally conscious | Pro-environment (ranging from −2.58 to 3.46) | −0.07 | 0.95 | + |
| Pro-environmental behavior | Daily pro-environmental behavior (ranging from −2.39 to 3.09) | 0.02 | 0.99 | + |
| Self-centered perception | Excuse for kitchen waste source separation (ranging from −3.84 to 2.37) | 0.01 | 1.00 | − |
4.3. Results and Discussion of the WTP Model
Stata is used to estimate the initial runs of the binary logit model.
Table 7 lists the results of logistic regression models predicting resident WTP for HKWS services. The analysis includes two models. Model 1 is the basic model that uses offered bid and demographic variables as the dependent variables, while Model 2 is the extended model that includes all six Likert scale variables. The purpose of the two models is to reveal the effects of these additional variables compared with using demographic variables alone. The results show that both models are statistically significant and share similar likelihood ratio test statistics of approximately −226.645. According to Louviere
et al. [
39], a pseudo R
2 level close to 20% indicates a very good fit for this kind of data. Thus, for this study, the two models have a week pseudo R
2 of around 10%, possibly due to the small range of offered bids. However, the pseudo R
2 result allows us to compare the fit of different models. The larger the pseudo R
2 value, the better the fit of the model to the observed data [
40]. As shown in
Table 7, Model 2 has a larger pseudo R
2 value than Model 1. Therefore, Model 2 with six Likert scale variables is deemed superior, and the results from this is used in the following part.
Table 7.
Results of logistic regression analysis of factors affecting WTP for household kitchen waste separation services (n = 327).
Table 7.
Results of logistic regression analysis of factors affecting WTP for household kitchen waste separation services (n = 327).
| Variables | Model 1 | | Model 2 |
|---|
| Coeff. | S.E. | Exp (Coeff.) | | Coeff. | S.E. | Exp
(Coeff.) |
|---|
| Constant | 1.115 ** | 0.465 | 3.05 | | 0.689 | 0.501 | 1.992 |
| Bid | −0.062 *** | 0.021 | 0.94 | | −0.066 *** | 0.022 | 0.936 |
| Gender | 0.545 ** | 0.243 | 1.725 | | 0.547 ** | 0.259 | 1.728 |
| Age | −0.022 *** | 0.008 | 0.978 | | −0.014 * | 0.008 | 0.986 |
| Education | 0.537 ** | 0.243 | 1.711 | | 0.677 *** | 0.259 | 1.968 |
| Attitude | − | − | − | | 0.019 | 0.124 | 1.019 |
| Ability | − | − | − | | 0.301 ** | 0.13 | 1.351 |
| Social pressure | − | − | − | | 0.059 | 0.122 | 1.061 |
| Environmentally conscious | − | − | − | | 0.166 | 0.134 | 1.181 |
| Pro-environmental behavior | − | − | − | | 0.114 | 0.126 | 1.121 |
| Self-centered perception | − | − | − | | −0.545 *** | 0.134 | 0.58 |
| Sample size | 327 | | 327 |
| Log likelihood | −226.645 | | −226.645 |
| Current prediction (%) | 49.5 | | 49.5 |
| Pseudo R2 | 0.081 | | 0.138 |
| Mean WTP (US$ per household per month) | 1.45 | | 1.44 |
| [95% Confidence interval] (US$ per household per month) | | | [0.61,2.23] | | | | [0.66,2.16] |
The offered bid and demographic coefficients in the two models are statistically significant. An increase in bid price could reduce resident acceptance of HKWS services. In percent terms, odds of chance of respondent’s WTP for the proposed HKWS services increase 72.8% for male. A year increase in age decreases the odds of respondent’s WTP 1.4%. This may suggests that older people have less income to pay the higher fees for HKWS services. Respondents with college or above education experience increase the odds of chance of their WTP by 98.6%. This generally shows that the residents are more wary of the HKWS services if they are lower educated people.
For the six Likert scale variables, the ability with a positive sign and self-centered perceptions with a negative sign are significant at the 5% and 1% levels, respectively. One unit increase of respondent ability of sorting their kitchen waste at the source would increase the odds of their WTP for the services by 35.1%. The probable reason for this unexpected finding could be explained by Halvorsen [
18]. Namely, the opportunity cost of time on conducting kitchen waste separation has a significant negative effect on HKWS efforts or the loss of leisure because of separation is viewed as a cost by the respondents. Moreover, there is pressure for them to conduct kitchen waste separation behavior, because they do not have the habit of separating kitchen waste. Therefore, in order to benefit society, they would like to pay the right amount of money for others to separate their kitchen waste.
The mean WTP for the proposed HKWS program is calculated as US$1.44 (95% confidence interval: US$0.66–2.16) per household per month after excluding 64 protest responses that indicated 0 WTP, which is in accordance with the results estimated in
Figure 3.
5. Conclusions
This study models how social and attitude attributes affect the utility of leaving HKWS to others. It also employed the CV method to derive the value of HKWS services in Beijing city. The results show on average that households are willing to pay a US$1.44 HKWS service fee per month. Although this is low compared with studies in developed countries, which show over US$1.70 per household per month [
13,
19,
42], it is high compared with US$0.48 (3 CNY) per household per month, the current monthly household mixed waste cleaning fee paid in Beijing. Here, the average WTP was calculated after excluding 64 protest responses from 391 samples. This means that respondents are willing to share about 0.11% of their household income (annual per capita disposable income was about US$589.48 (36,500 CNY) in urban areas in 2012, and the average urban family size was about 2.7 persons. [
1]). Meanwhile, for every 80–120 households (the number a single kitchen waste separation instructor handles), this WTP figure represents about US$95.29–143.09 (590–886 CHY) per month (number of households * 82.8% * US$1.44 per household per month) to support the cost of waste separation. This WTP figure is therefore sufficient to cover current wages (US$96.90 (600 CNY) per separator per month) of the required number of kitchen waste separation staff.
The results show that among all of the respondents, about 41.4% agreed to pay the given discrete choice amount, 42.2% refused to pay, but with a positive attitude toward the proposed program, and 16.4% completed refused to pay. The probability of household to buy HKWS services decreases with the increase in the offered bid. The factors that significantly influence the WTP of the households in this study appear to match those of the previous study. For example, those who accept paying for kitchen waste source separation services are predominantly male, in contrast to what Sterner and Bartelings [
19] found, but in line with Berglund [
13]. Young respondents are more likely to be willing to pay to avoid sorting. This corresponds with earlier studies [
13,
19]. Highly-educated respondents also were found as wanting to avoid sorting waste; also in line with Berglund [
13]. These findings imply that this study is somewhat reliable. Respondents who showed more favorable attitudes toward kitchen waste separation behavior being more likely to pay for the proposed services is in accord with Halvorsen [
18]. This implied that both the opportunity cost of time and the pressure of forming a kitchen waste separation habit affect residents HKWS efforts. Moreover, the socio-responsibility of improving the disposing condition of kitchen waste has a positive impact on residents’ attitudes toward HKWS service. The results from this study, however, cannot be generalized. In other words, they may not be applicable to the entire Beijing area, but can be useful in terms of policy implications and may serve as a way toward the next steps in the area regarding WTP for better kitchen waste separation services.
It would be better to increase the number of communities in the municipality, as well as the sample size to make the results of other studies in the area more generalizable. Because we had no a priori expectations about the impact of the variables of the respondents’ attitudes toward HKWS, social pressure on sorting kitchen waste, environmental consciousness and pro-environmental behavior on the residents’ attitudes for the proposed HKWS services, further research should be conducted to verify these results.


