1. Introduction
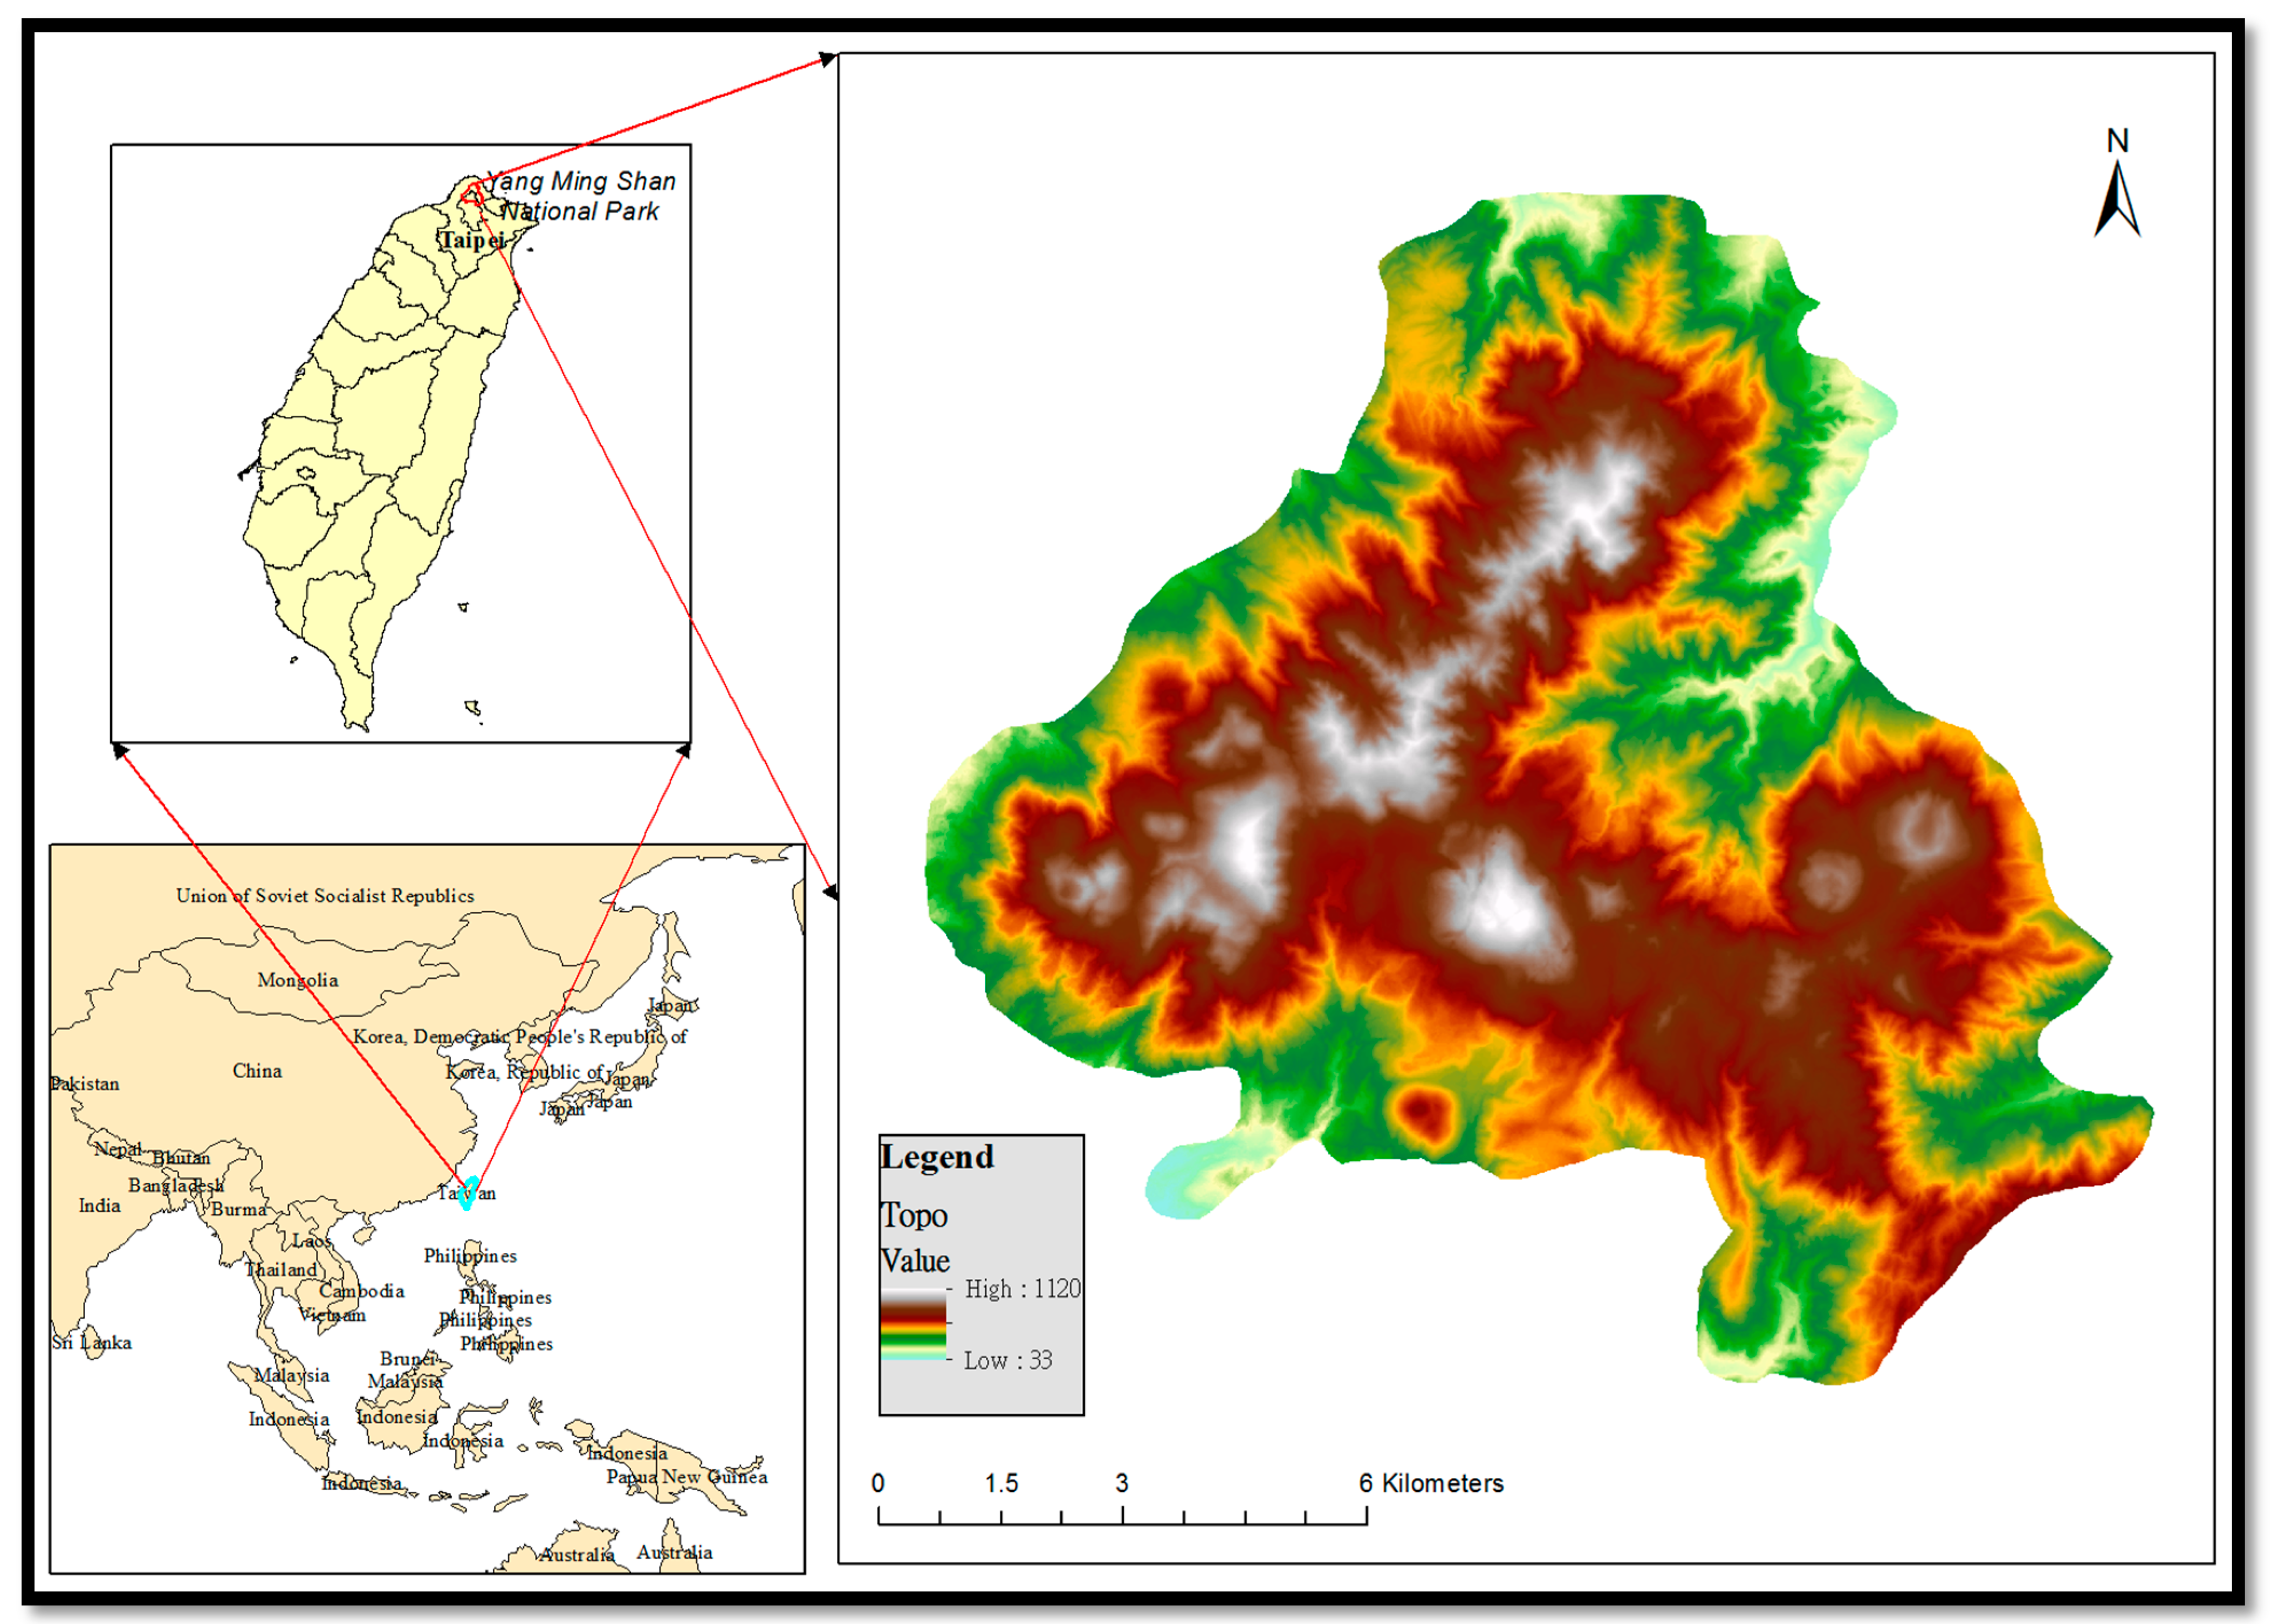
Yang Ming Shan National Park is located in northern edge of the Taipei Basin (
Figure 1). It is an important ecological basket of Northern Taiwan, as well as origin for many important rivers. Since the middle of the Qing Dynasty (from 1683 to 1895), constructed irrigation ditches supply residents domestic and irrigation water needs. Before the establishment of the National Park, residents have developed part of the land and changed the land cover. Land use change in Yang Ming Shan National Park included the conversion of 704 hectares of forest to agricultural land between 1996 and 2007. The impacts of land use change on river basin hydrology are interrelated to climate impacts.
Figure 1.
Location of Yang Ming Shan National Park and its elevation (m) pattern.
Figure 1.
Location of Yang Ming Shan National Park and its elevation (m) pattern.
Evaluation of soil and water losses under changing conditions require models that can simulate flow regimes under different scenarios of change. This study uses high-resolution datasets, such as a 5 m resolution DEM (digital elevation model) from LiDAR, a 1:5000 scale land use map, a soil map, and weather data from National Center for Environmental Prediction (NCEP). The date period covers two years, 1996 and 2007.
The development of separate and sophisticated land dynamic tools was observed over the last two decades. This is because of the large number of variables involved influencing the land use change [
1]. A widely used, highly sophisticated modeling tool, which addresses many aspects of catchment is the Soil and Water Assessment Tool (SWAT). The model has gained international acceptance as a robust interdisciplinary watershed modeling tool as evidenced by international SWAT conferences, hundreds of SWAT‐related papers presented at numerous other scientific meetings, and dozens of articles published in peer‐reviewed journals [
2]. The model is also very flexible. Kim
et al. demonstrates that an integrated SWAT-MODFLOW is capable of simulating a spatio-temporal distribution of groundwater recharge rates, aquifer evapotranspiration and groundwater levels [
3]. It also enables an interaction between the saturated aquifer and channel reaches. This interaction played an important role in the generation of groundwater discharge in the basin, especially during the low flow period. However, in a low mountain region, the calculated contribution of the baseflow to the streamflow is far too high whereas the interflow is strongly underestimated. Alternatively, Eckhardt
et al. developed a modified version SWAT-G that yielded far better results for catchments with predominantly steep slopes and shallow soils over hard rock aquifers [
4].
Unfortunately, nearly all SWAT applications addressing the effect of land use change were performed on scenario-based predictions with static land use only. Many SWAT applications have been focused on the impact of land use and management change, as well as climate change dynamics. With the Arc-SWAT 2012 Version, the input lup.dat file allows HRU (hydrologic response unit) fraction updating during a simulation run. The lup.dat file is particularly useful to initialize mid-simulation conservation measures. After its initialization, the practices remain in effect for the remainder of the simulation. However, the lup.dat file is not widely used yet due to its impractical set-up/use (any update must be made for each HRU one by one).
There are many cases where SWAT models have been used to predict impact of land use change on soil and water losses. The results indicate that even a relatively limited land use change, from forest to arable land or
vice versa, has a significant effect on regional soil erosion rates and sediment supply to rivers [
5]. The quantitative hydrological analysis due to land use change by SWAT model is thought to be a good approach for identifying the impact of land use in Jeju Island, Korea [
6]. The approach used in their study simply determined the contributions of land use change to change in stream flow and sediment yield, providing quantitative information that would allow stakeholders and decision makers to make better choices regarding land and water resource management [
7].
The objectives of this study are: (1) to evaluate the impacts of land use changes on streamflow and sediment yield; and (2) to provide invaluable evidence for future formulation of appropriate government land development policies.
2. Research Methodology
2.1. SWAT Model Description
The SWAT model is a physically based distributed model designed to predict the impact of land management practices on water, sediment, and agricultural chemical yields in large complex watersheds with varying soil, land use, and management conditions over long periods of time [
8]. SWAT subdivides a basin into sub-basins connected by a stream network and further delineates each sub-basin into HRUs consisting of unique combinations of land use and soils. SWAT allows a number of different physical processes to be simulated in a basin. The hydrological routines within SWAT account for snowfall and melt, vadose zone processes (infiltration, evaporation, plant uptake, lateral flows, and percolation), and groundwater flows [
9]. The subdivision of the watershed enables the model to reflect differences in evapotranspiration for various crops and soils. Runoff is predicted separately for each HRU and routed to obtain the total runoff for the watershed. This increases accuracy and gives a much better physical description of the water balance.
The SWAT model simulates the hydrology into land and routing phases. In the land phase, the amount of water, sediment and other non-point loads are calculated from each HRU and summed up to the level of sub-basins. Each sub-basin controls and guides the loads towards the basin outlet. The routing phase defines the flow of water, sediment and other non-point sources of pollution through the channel network to an outlet of the basin. SWAT computes soil erosion at a HRU level using the modified Universal Soil Loss Equation (MUSLE). This process constitutes computing sediment yields from each sub-basin and routing the sediment yields to the basin outlet. The hydrological cycle simulated by SWAT is based on the water balance equation:
where
SWt is the final soil water content,
SW0 is the initial soil water content on day
i,
t is the time (days),
Rday is the amount of precipitation on day
i,
Qsurf is the amount of surface runoff on day
i (mm H
2O),
Ea is the amount of evapotranspiration on day
i,
wseep is the amount of water entering the vadose zone from the soil profile on day
i,
Qlat is the water percolation past bottom of soil profile in the watershed for day
i, and
Qgw is the amount of return flow on day
i. All water units are in mm H
2O.
For more detail about SWAT theory, please reference SWAT2009 Theoretical Documentation [
8], which is available online (
http://swat.tamu.edu/).
2.2. Study Area
Yang Ming Shan National Park is located in northern Taiwan (
Figure 1). Millions of years ago, subterranean movements caused a massive collision between the Philippines oceanic plate and the Eurasian continental plate. The resulting pressure spawned violent volcanic activity and lifted the Eurasian plate. Incandescent magma, as hot as 1000 degrees Celsius, burst from erupting volcanoes and covered tertiary sedimentary rock to form the Tatun Volcano group in the northern Taiwan coastal region. Part of this group consists of the 20 and more volcanoes at the heart of Yang Ming Shan National Park (
http://english.ymsnp.gov.tw/).
The park’s area is about 11,455 ha, elevation ranging from 33 to 1120 m and lies between the latitudes of 25°7' and 25°15'N and the longitudes of 121°29' to 121°39'E. It has a clearly differentiated monsoon climate. In summer, southwesterly monsoons bring clear mornings with afternoon thundershowers. In winter, northeasterly monsoons bring humid, rainy weather.
According to the Taiwan soil classification system, the major soil types include black soils, yellow soils, incipient yellow soils, Lithosols, mixed alluvial soils, residual soils, colluvial soils, which correspond respectively to Andisols, Entisols, Alfisols, Ultisols, and Inceptosols in the USA Soil Taxonomy (Soil Survey and Remediation Laboratory, National Taiwan University). The dominant land use types are forest, villages, small towns, and agricultural land.
2.3. Data Set
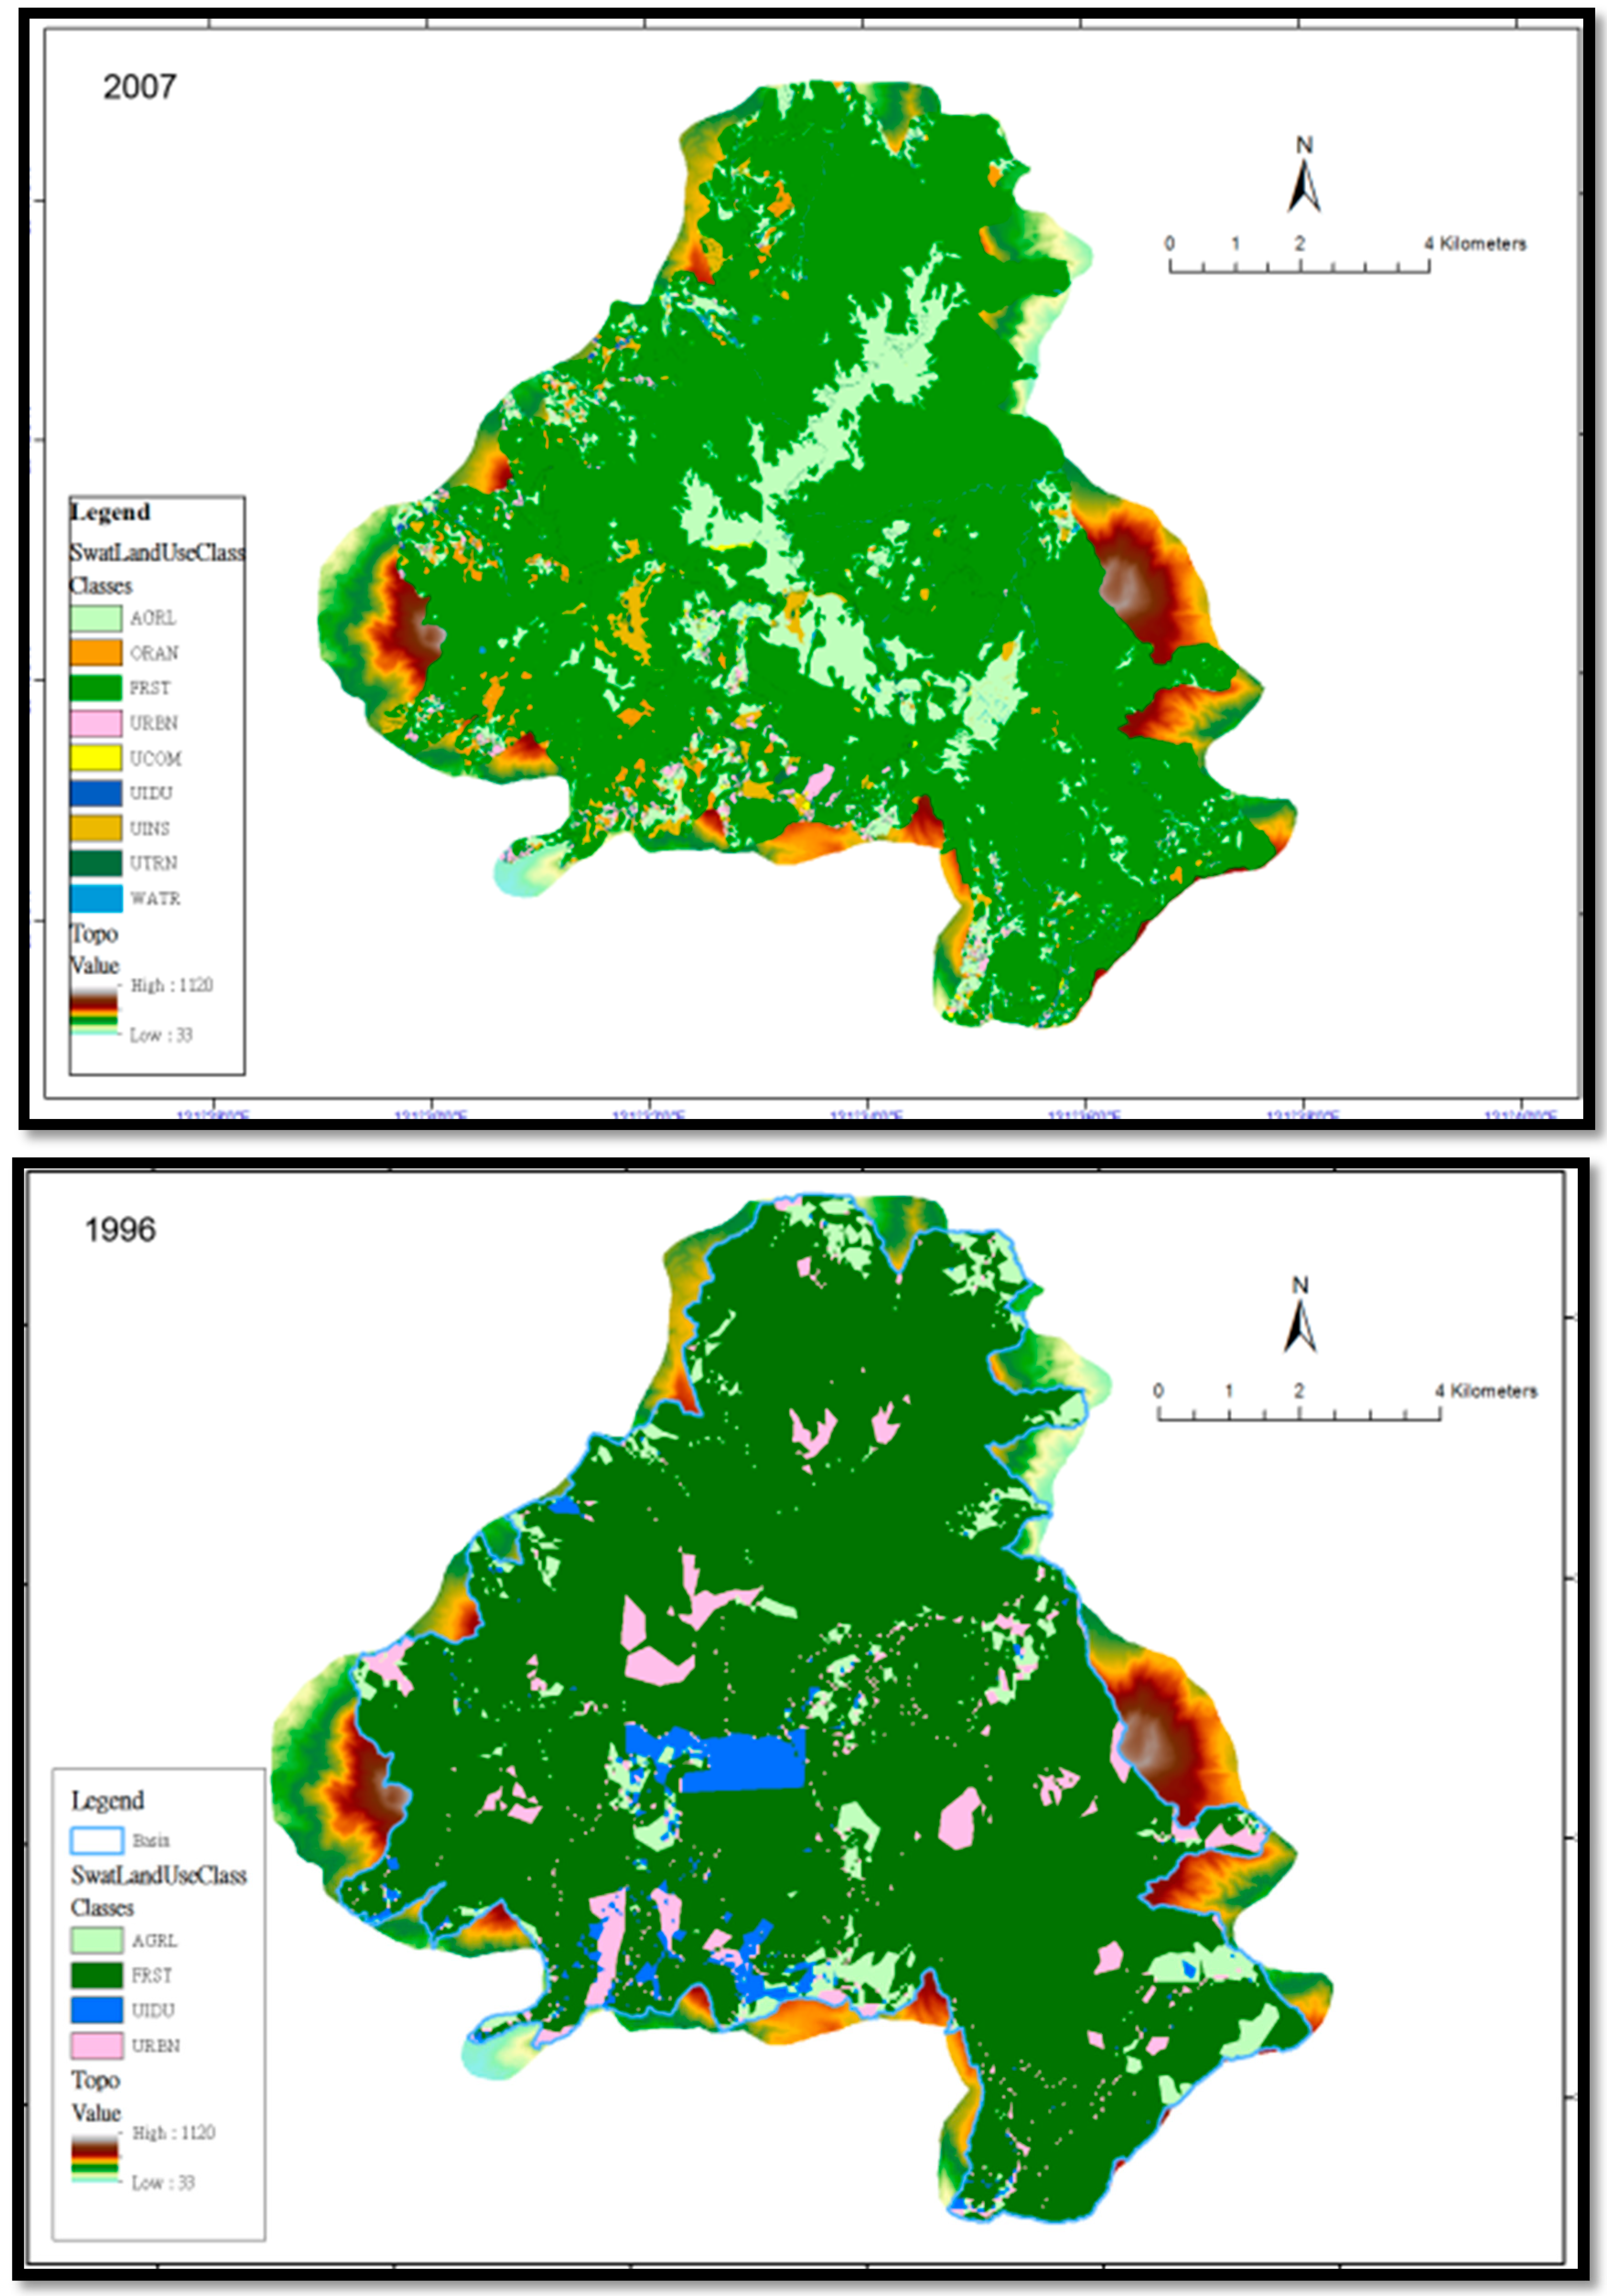
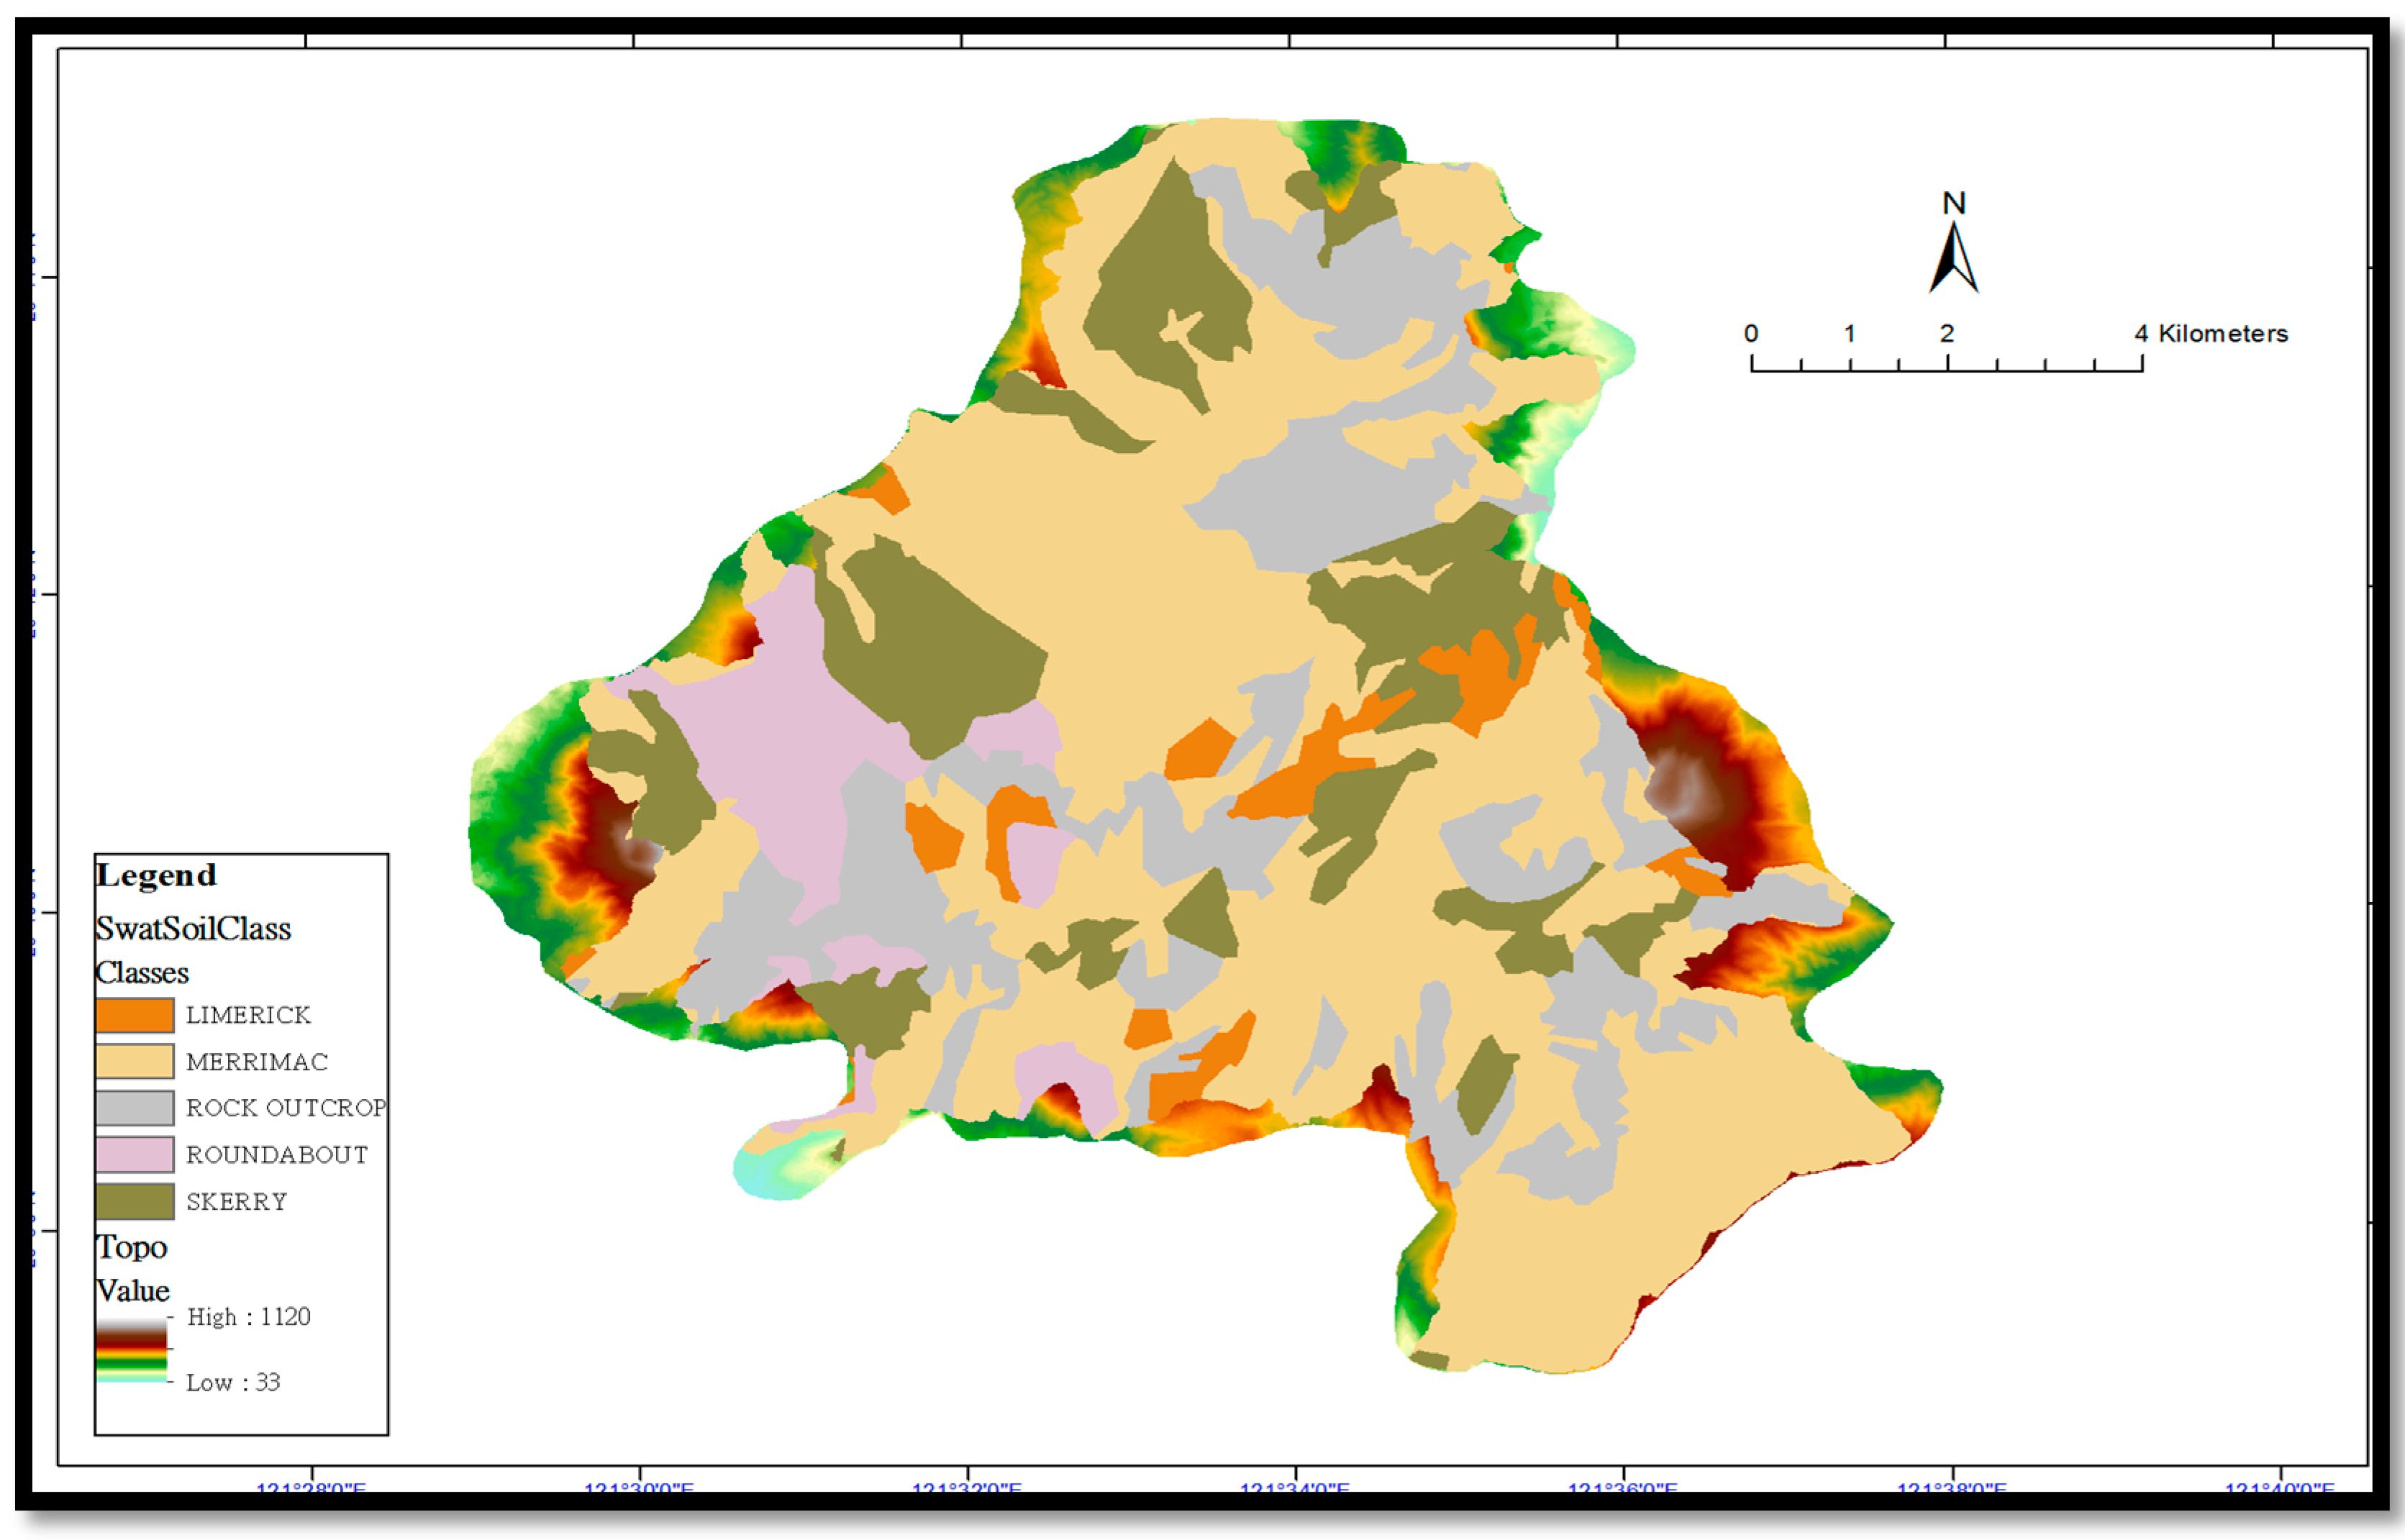
The basic datasets that are required by the hydrological model are topography, climate, streamflow, soil, and land use data (
Table 1). The land cover change detection is based on land use investigation of Taiwan maps from 1996 and 2007.
Table 1.
Spatial model input data for Yang Ming Shan National Park.
Table 1.
Spatial model input data for Yang Ming Shan National Park.
| Data type | Content | Resolution | Source |
|---|
| Topography map | digital elevation model (DEM) | 5 m | Yang Ming Shan National Park |
| Land use map | land use classification | 1:5000 | Ministry of Interior (MOI), Taiwan |
| Soil map | soil type | 1:50,000 | Yang Ming Shan National Park |
| Weather | precipitation, wind, relative humidity, and solar | daily | National Center for Environmental Prediction (NCEP) (http://globalweather.tamu.edu/) |
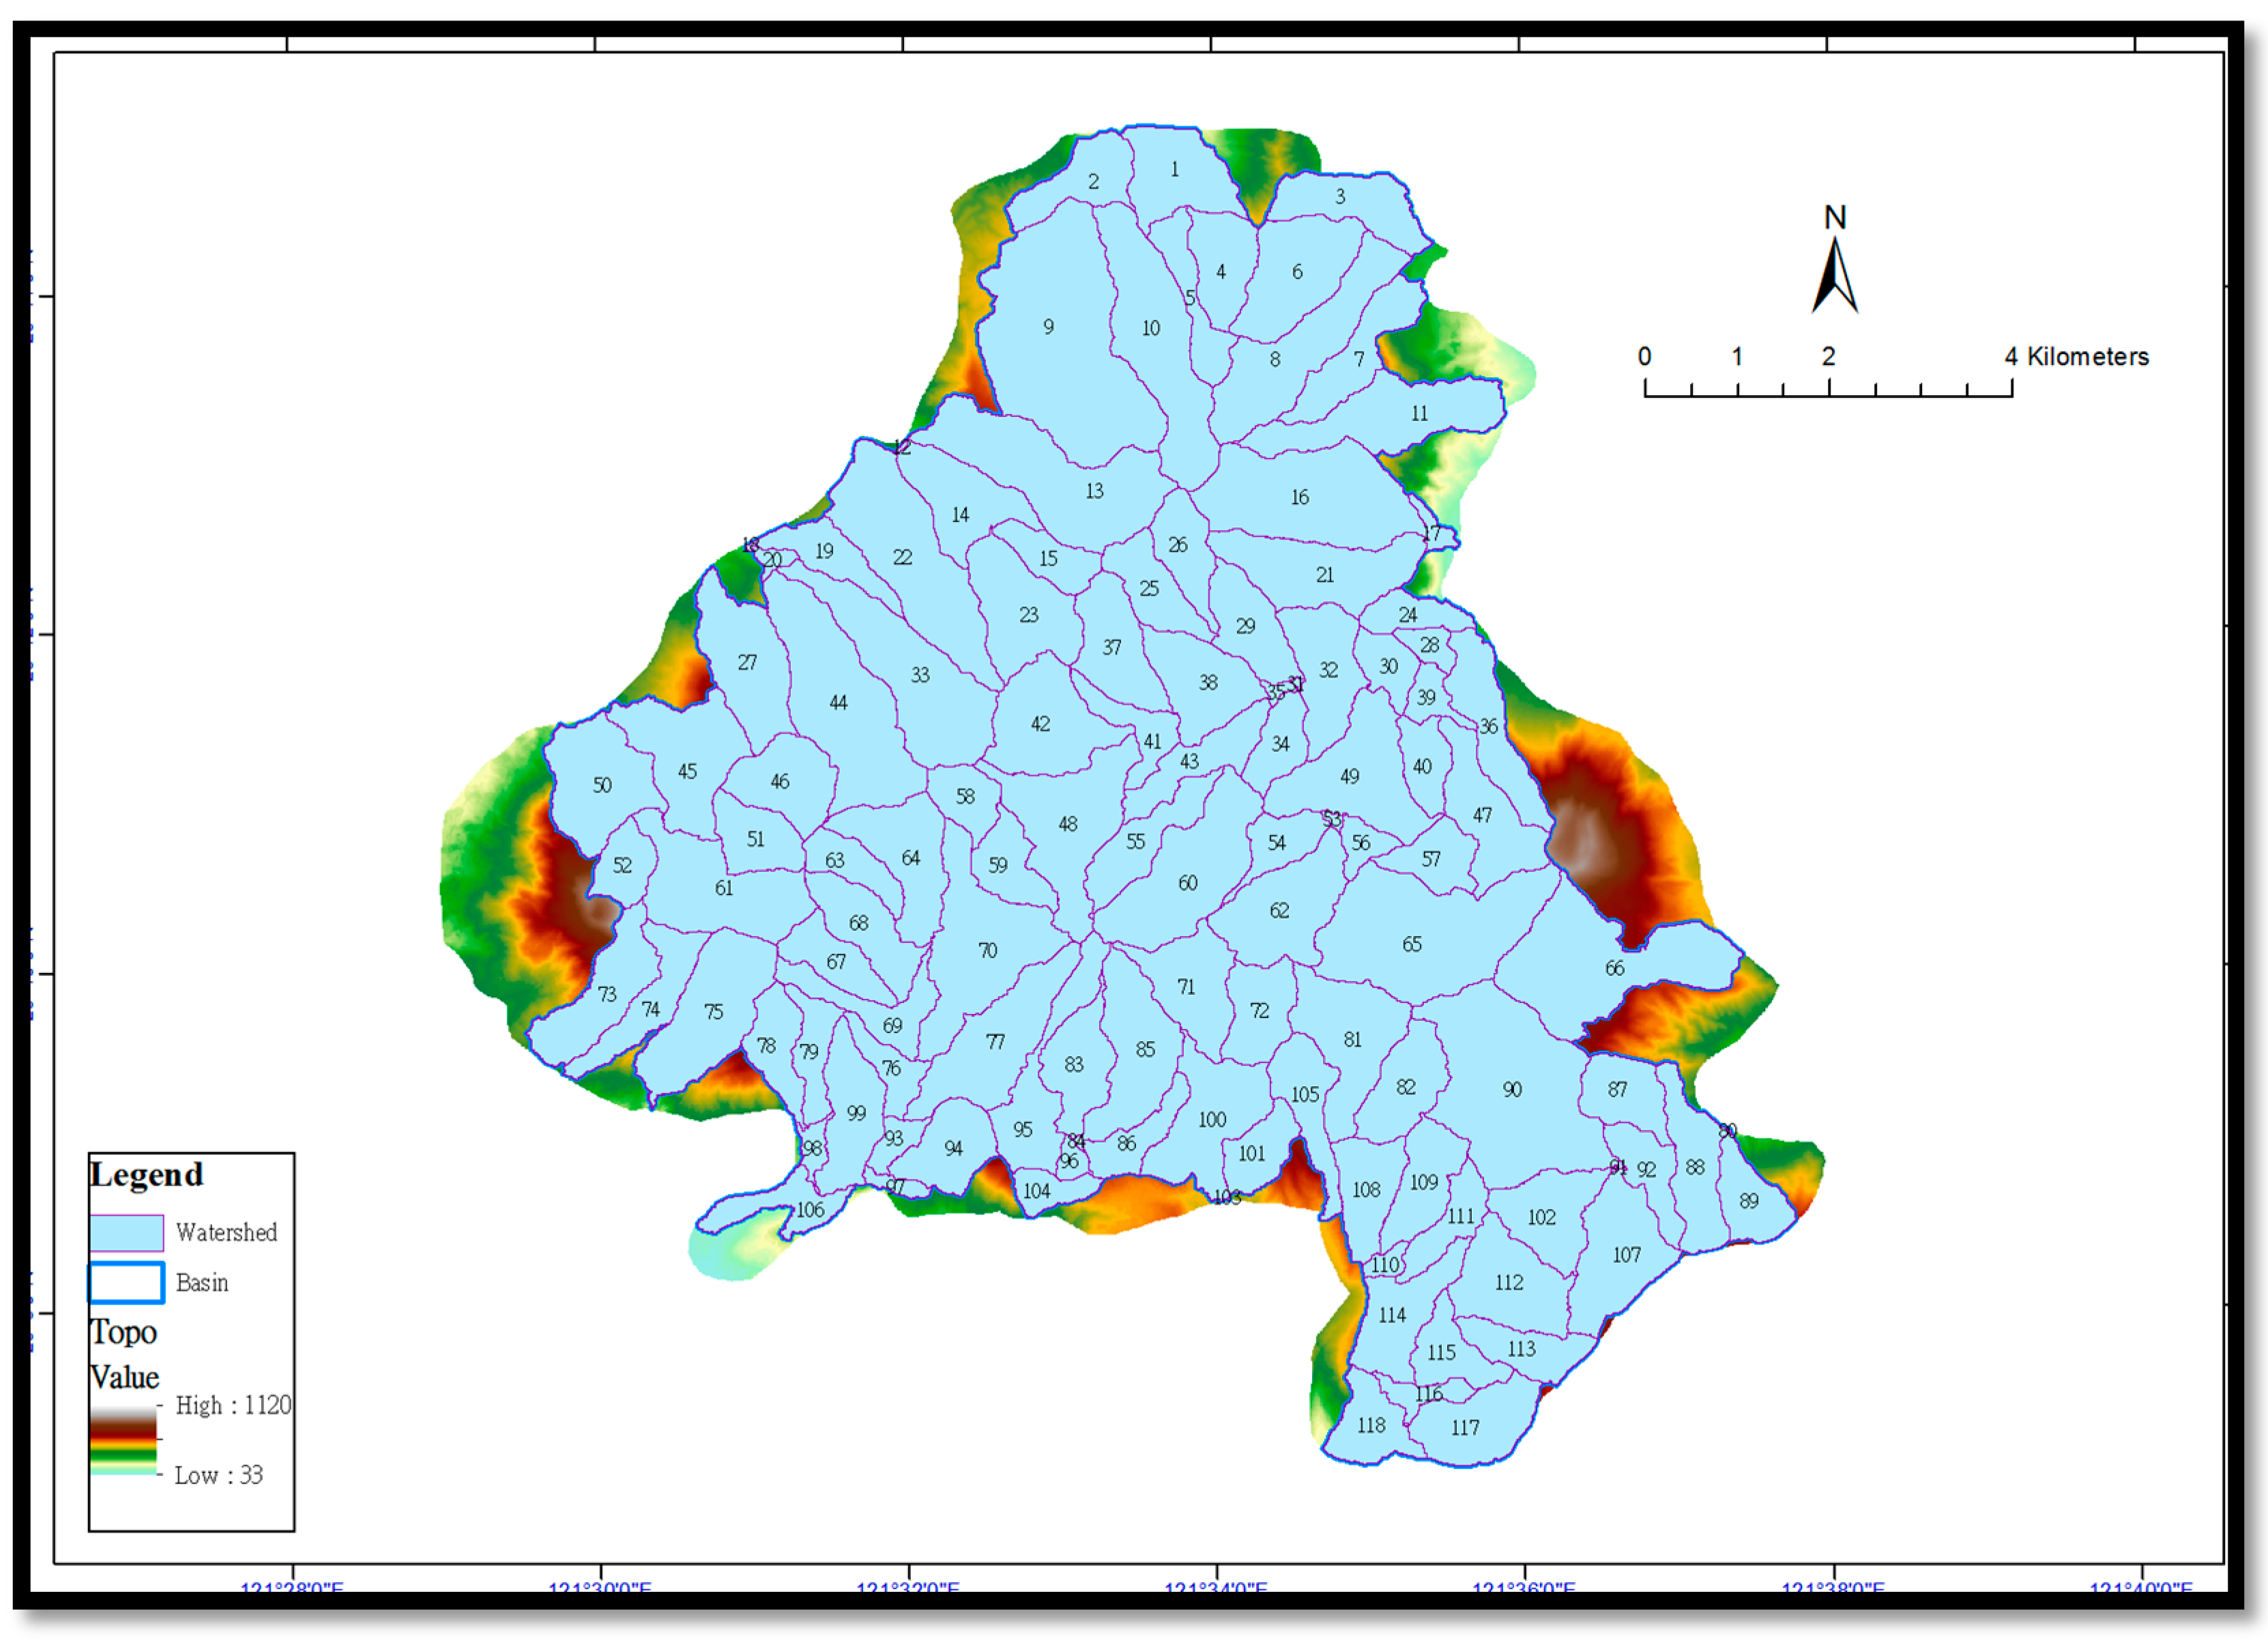
The current version, Arc-SWAT2012, was used to compile the SWAT input files. The National Park is subdivided into smaller sub-basins based on the digital elevation model data, land use and soil type data, conforming to concentrated drainage pattern as well as similar hydrological responses. Based on the DEM, land use, and soil data, the National Park was divided into 118 sub-basins (
Figure 2). The model ignores small basins as well as sub-basins that do not drain directly to the main basin along the boundary of the National Park basin. As such, the study basin area is a bit smaller than the physical boundary of the National Park. Land use data for the 2 years (1996 and 2007) from MOI, and the soil type map are shown in
Figure 3 and
Figure 4, respectively.
Figure 2.
Subbasins from DEM.
Figure 2.
Subbasins from DEM.
Figure 3.
Land use map of 1996 and 2007.
Figure 3.
Land use map of 1996 and 2007.
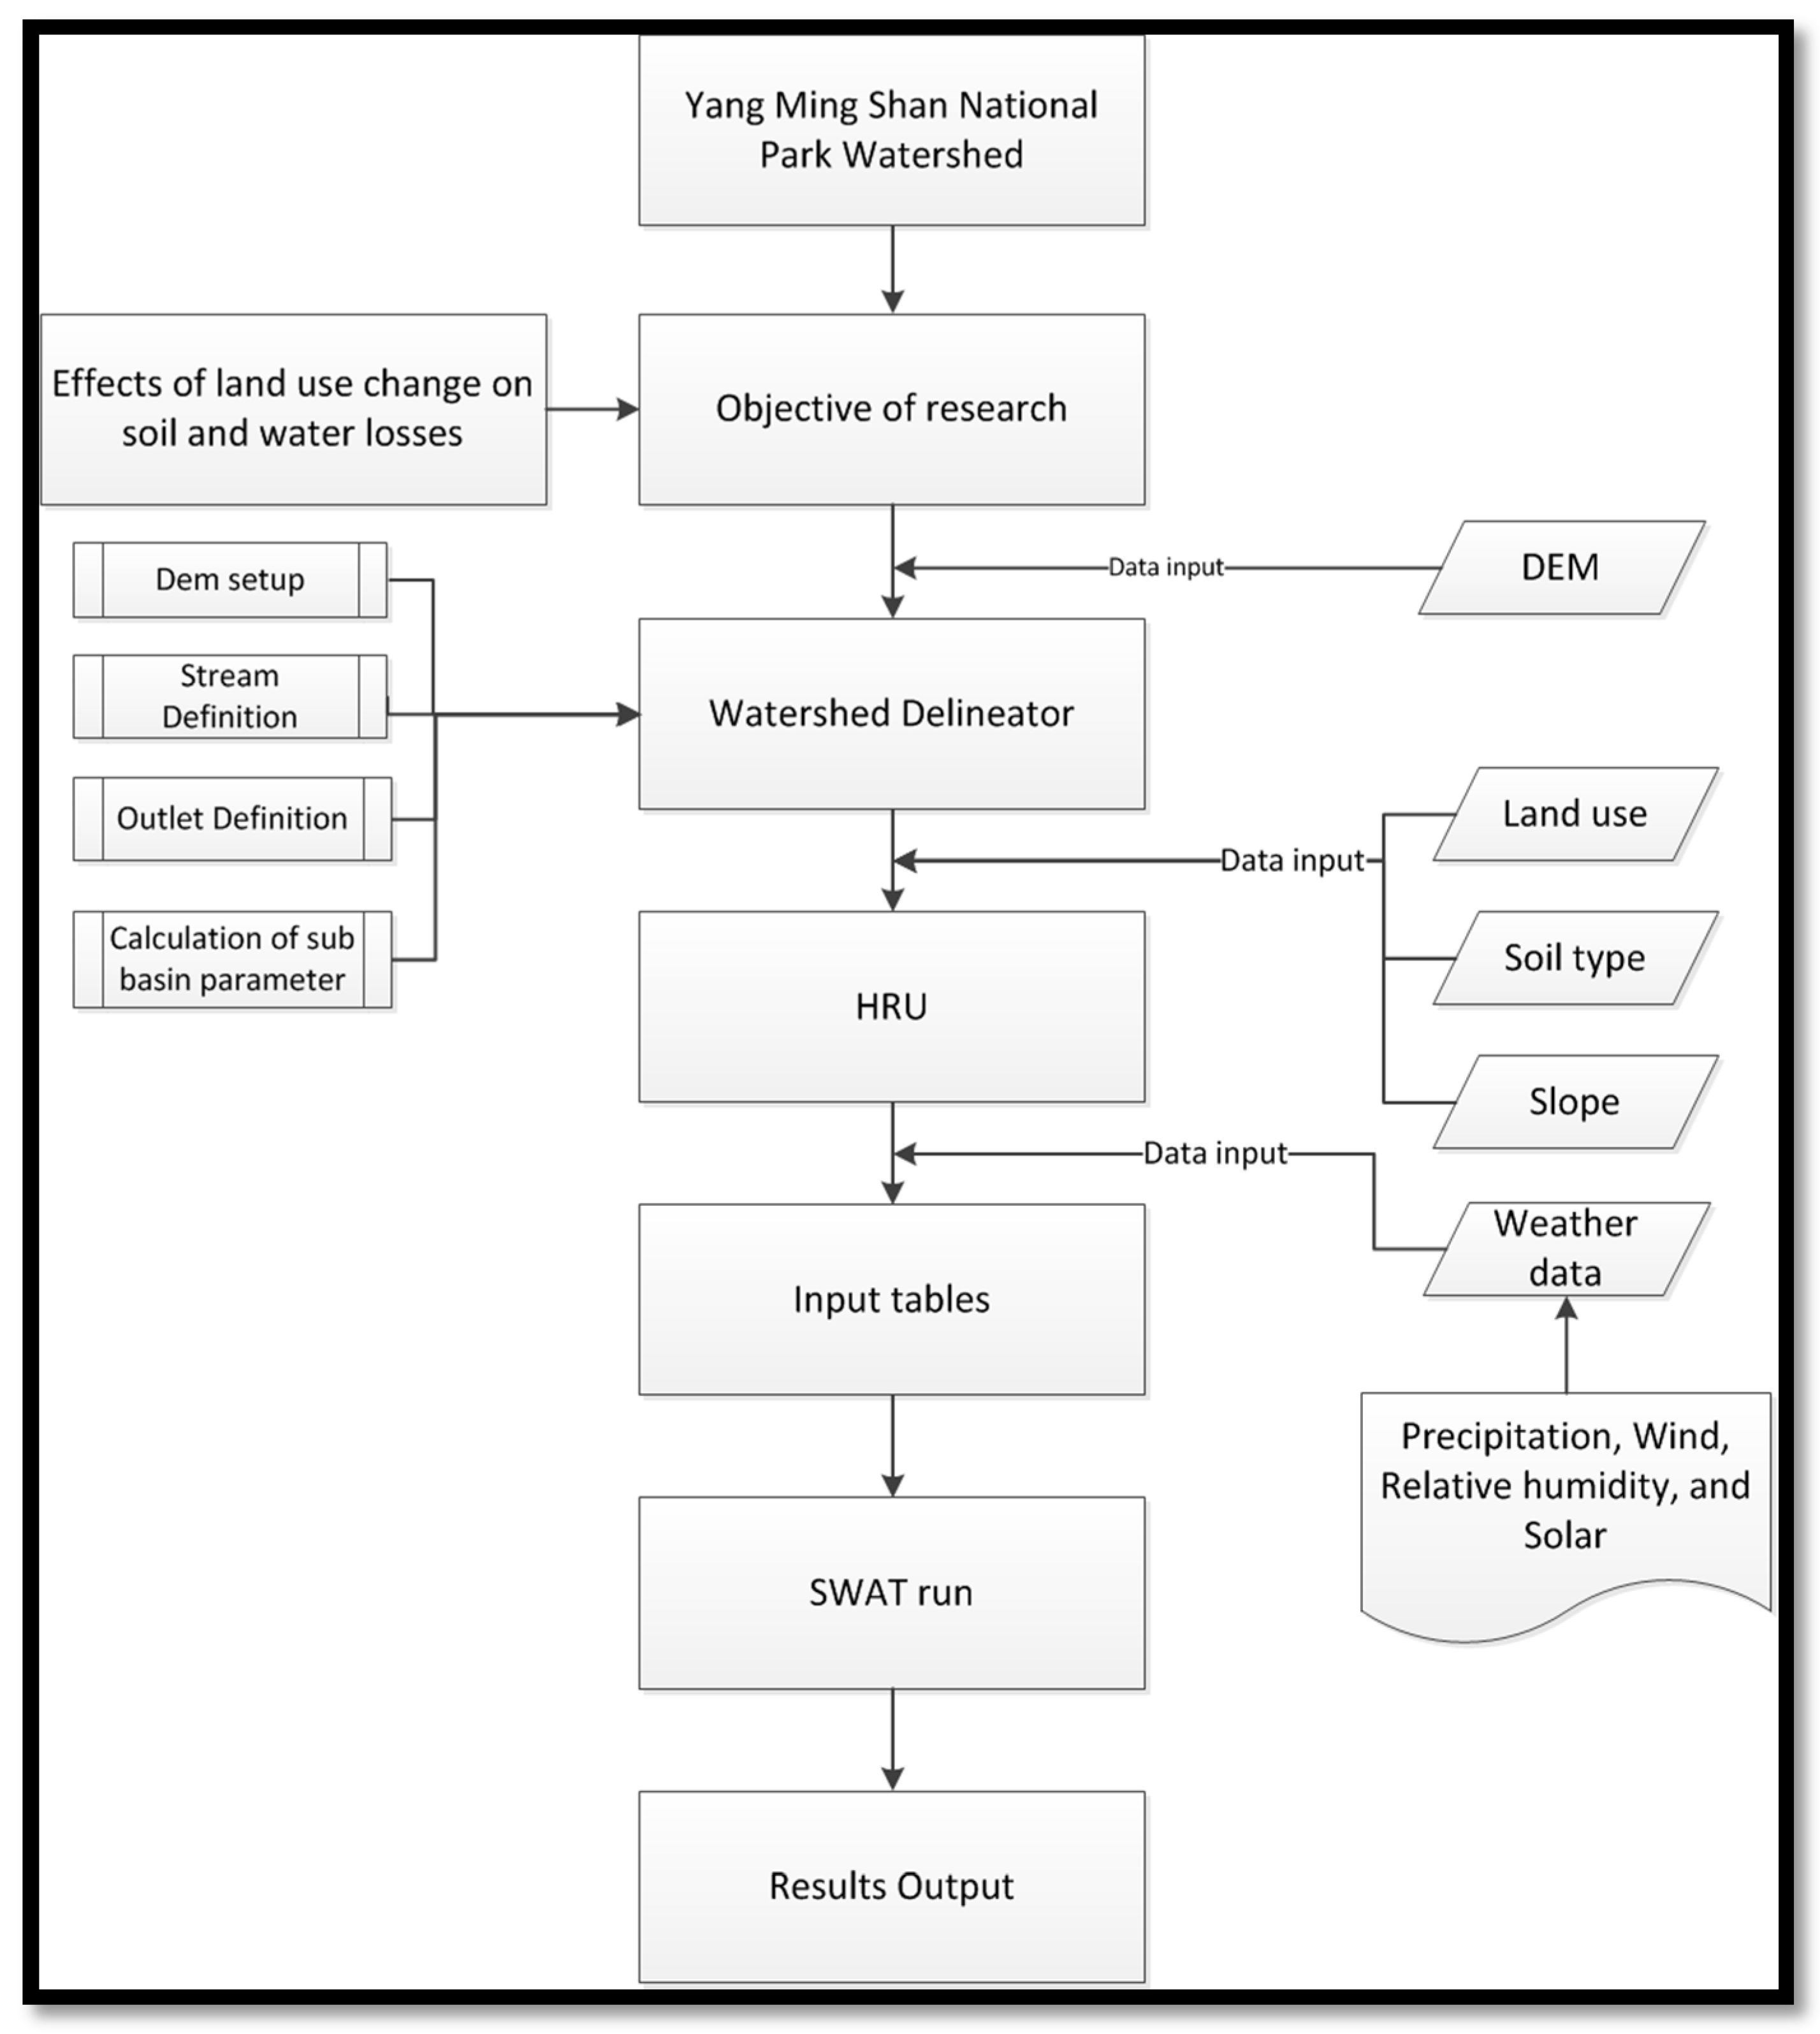
Figure 5.
Flowchart of ArcSWAT processing steps.
Figure 5.
Flowchart of ArcSWAT processing steps.
The Arc-SWAT2012 is an ArcView extension. It provides a graphical user interface that allows for GIS data to be easily formatted for use in SWAT model simulations. ArcSWAT breaks preprocessing into four main steps: watershed delineation, HRU analysis, weather data definition and SWAT simulation. In order to understand how each section works within the modeling process, it is important to understand the conceptual framework of each step, as well as what data are used and how they integrate into ArcSWAT.
Figure 5 shows the flowchart of modeling using ArcSWAT.
4. Conclusions
The model runs for different land use period are performed on similar weather conditions as the annual rainfall is about 2225 mm and 2261 mm for 1996 and 2007, respectively. The results indicate that land use change may cause a great deal of sediment yield increase. This is mainly attributed to land degradation (conversion of forest to agricultural land) due to intense human activities, especially deforestation. The park has increased about 980 ha agricultural land and decreased about 608 ha forest land between 1996 and 2007.
In order to avoid illegal development activities, the government has formulated laws and regulations to limit the development. However, some land use pattern change still exists resulting in increased soil erosion within the National Park.
According to the model results, it is necessary to prescribe appropriate soil and water conservation practices to control the stream flow and sedimentation problems in this National Park. The SWAT model is also capable of identifying areas within the basin with high water and sediment yield. This provides a useful guide for formulating policies and developing plans to counteract erosion effects, to optimize land use, and to achieve sustainable land development. Based on the model output at the HRU level, high erosion areas may be easily identified within the basin. Subsequent land development should avoid such areas because of the need to adequately protect them with appropriate conservation strategies.
Human activities deserve more attention when assessing soil and water losses because of their inevitable impacts. How to avoid residents’ illegal development activities will be the future important task of the Yang Ming Shan National Park. Re-evaluation of the existing laws and regulations, strengthening park inspection, and plans for land use change detection using satellite images that can monitor small land use perturbations to deter violations, should be further enhanced to minimize deterioration of the invaluable environment condition in this National Park.


