Analysis of Urban Heat Island (UHI) in Relation to Normalized Difference Vegetation Index (NDVI): A Comparative Study of Delhi and Mumbai

Abstract
:1. Introduction
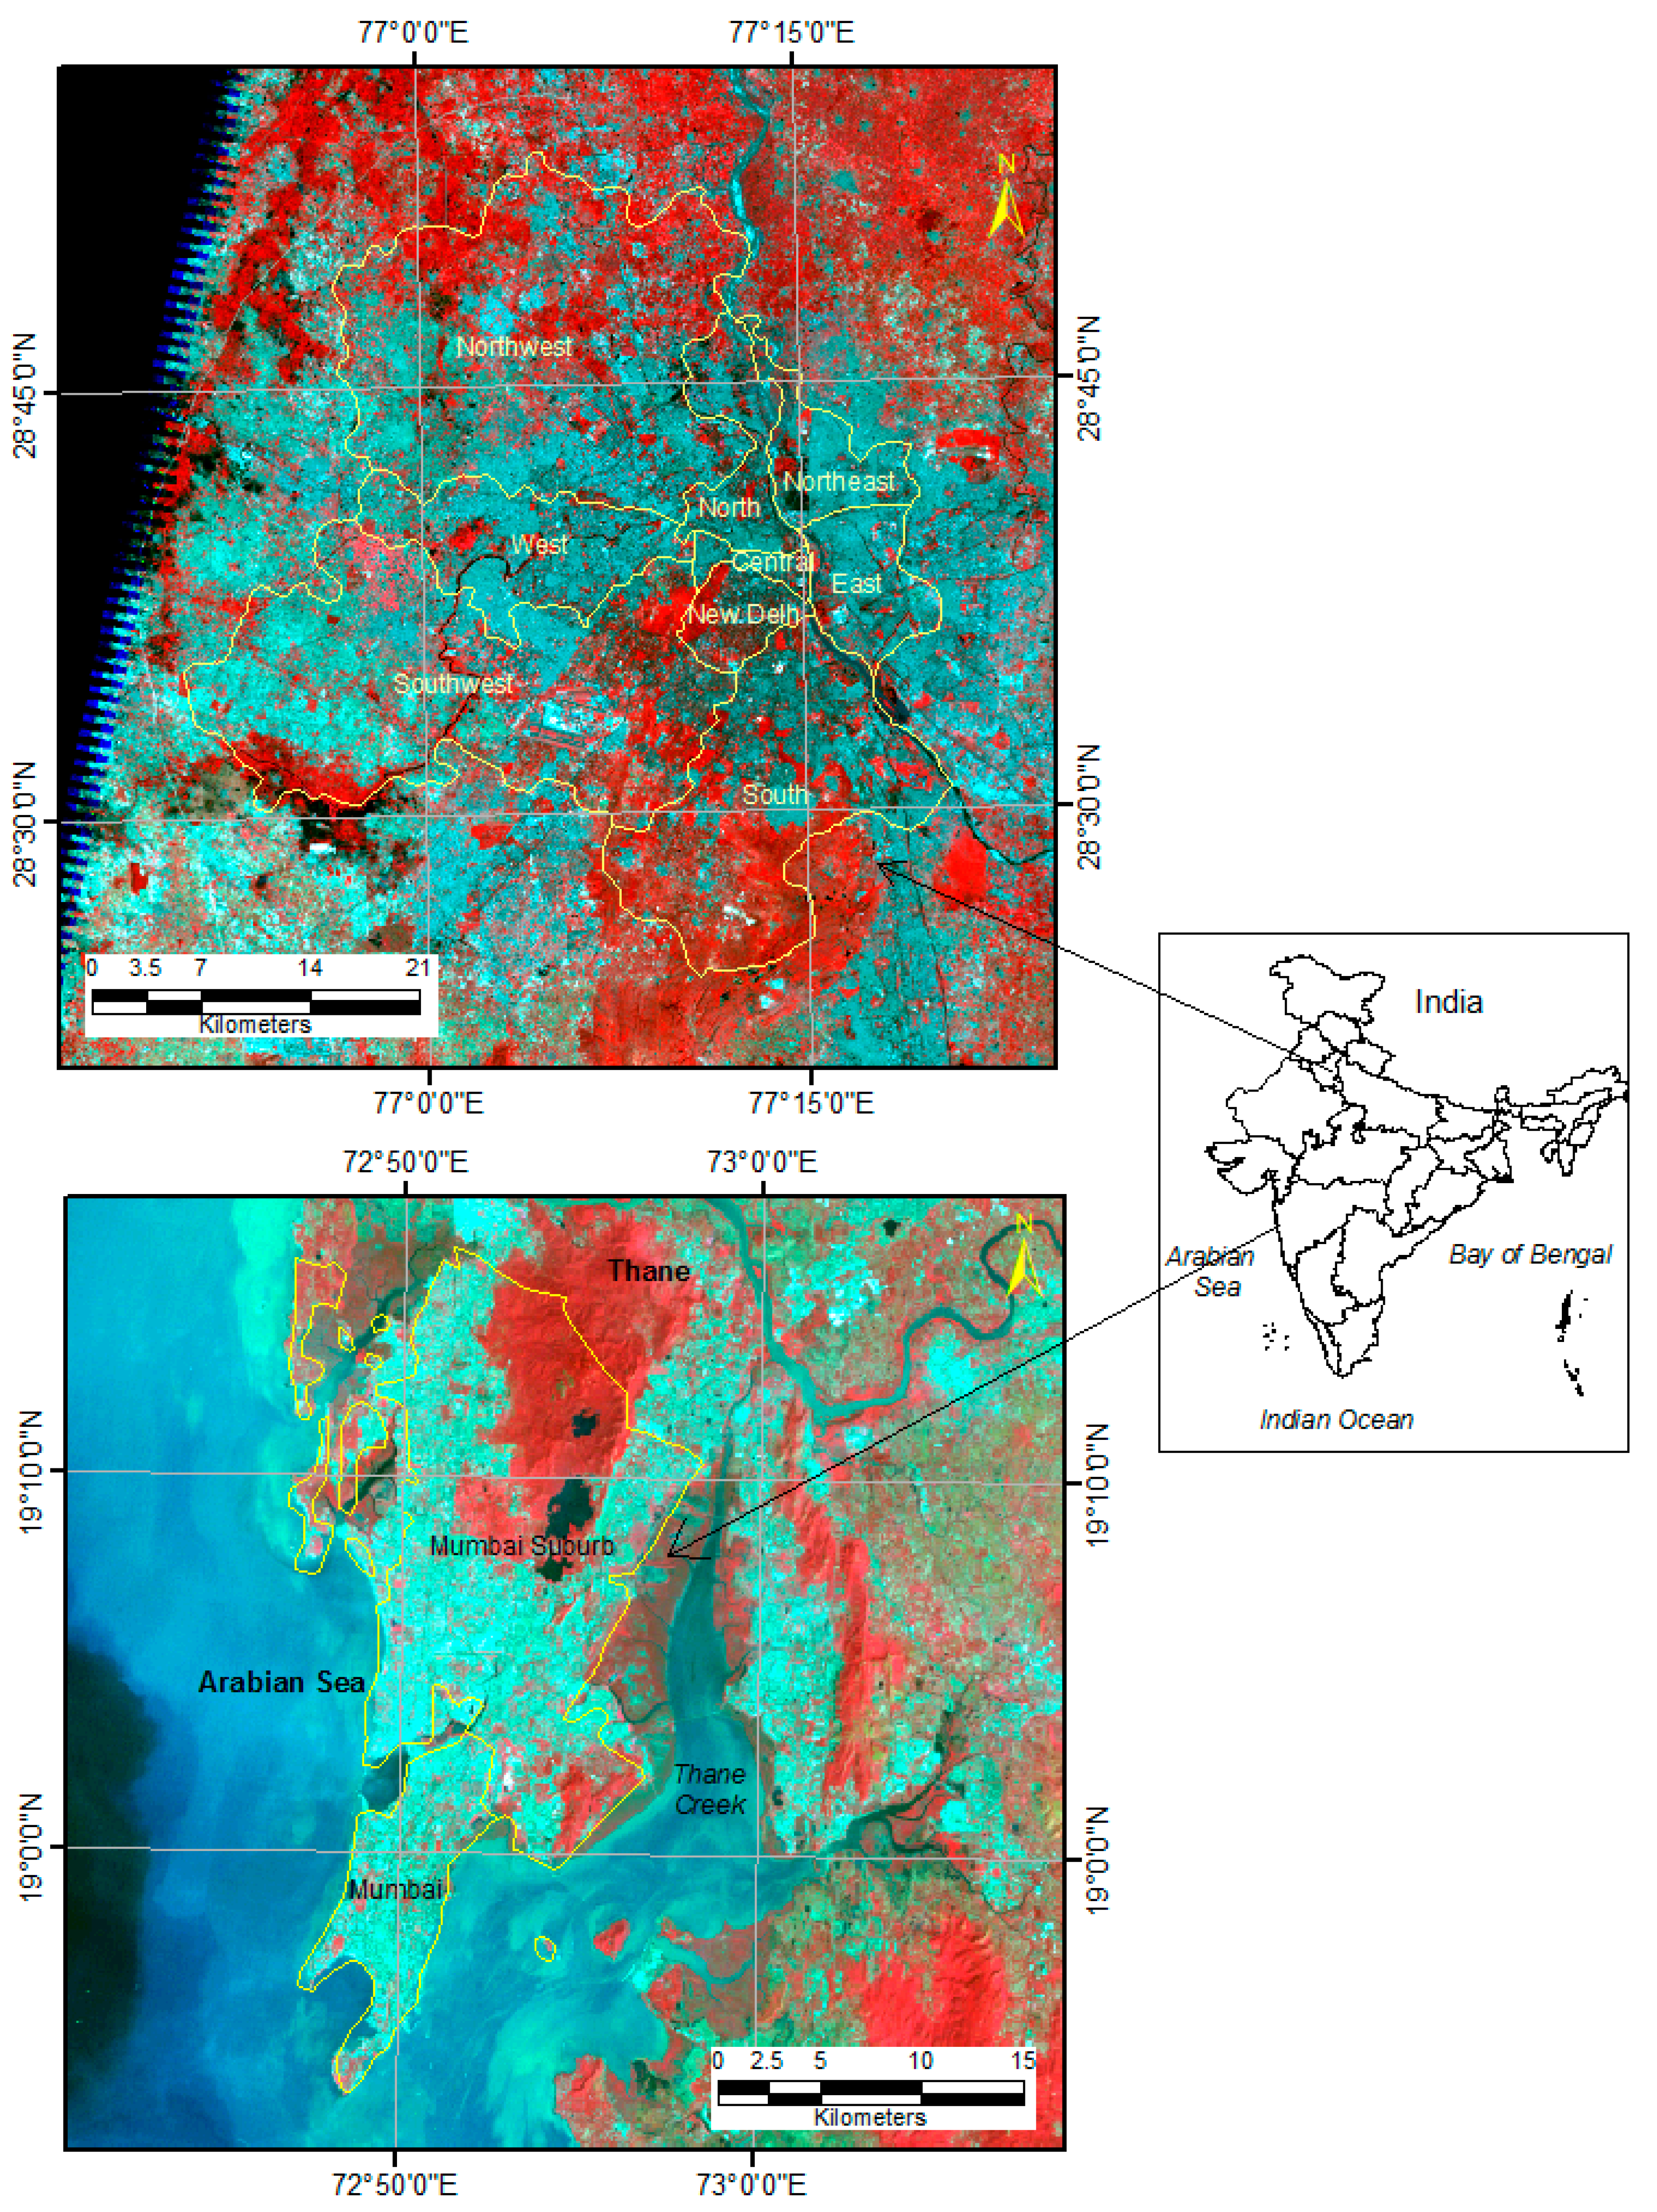
2. Study Area

3. Database and Methods

| Satellite | Sensor | Acquisition date | Path and row | Spatial resolution* | Cloud cover |
|---|---|---|---|---|---|
| Landsat 5 | TM | 5 May 2010 | 146/040 | 120 m | 1% |
| Landsat 5 | TM | 17 April 2010 | 147/047 | 120 m | 0% |
3.1. Mapping of Surface Temperature
3.2. NDVI Estimation
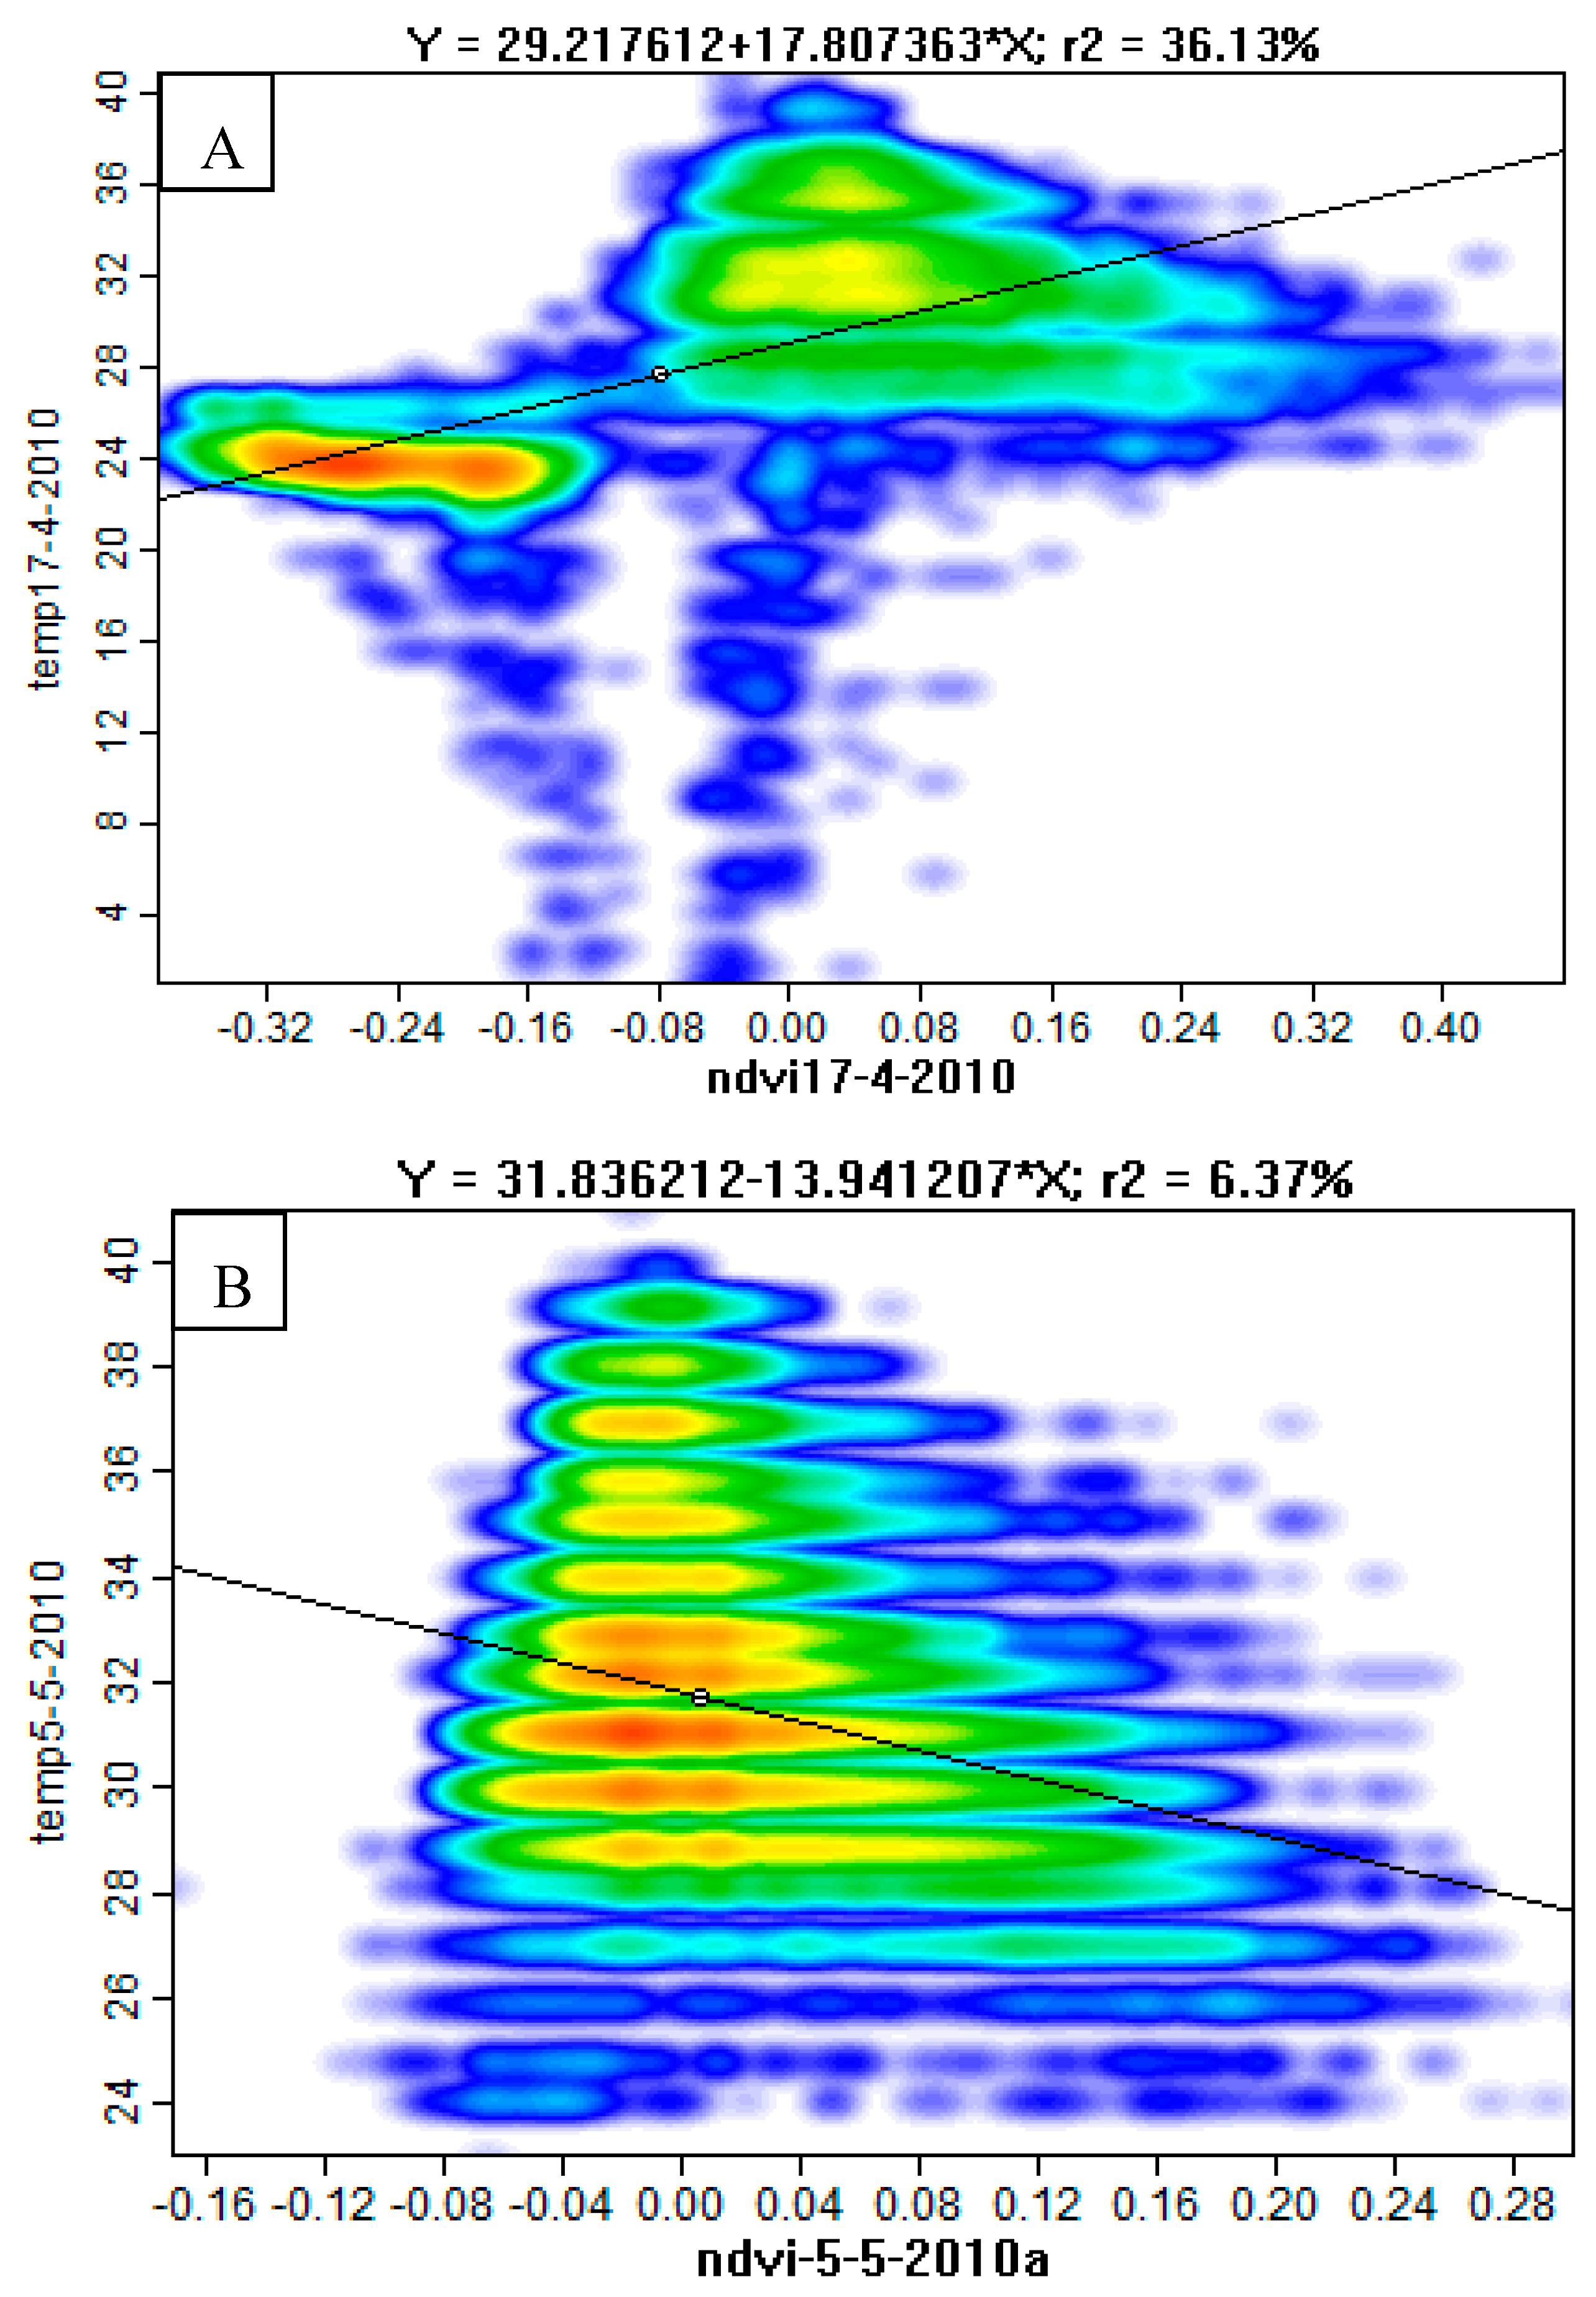
3.3. Regression Analysis
4. Results and Discussion
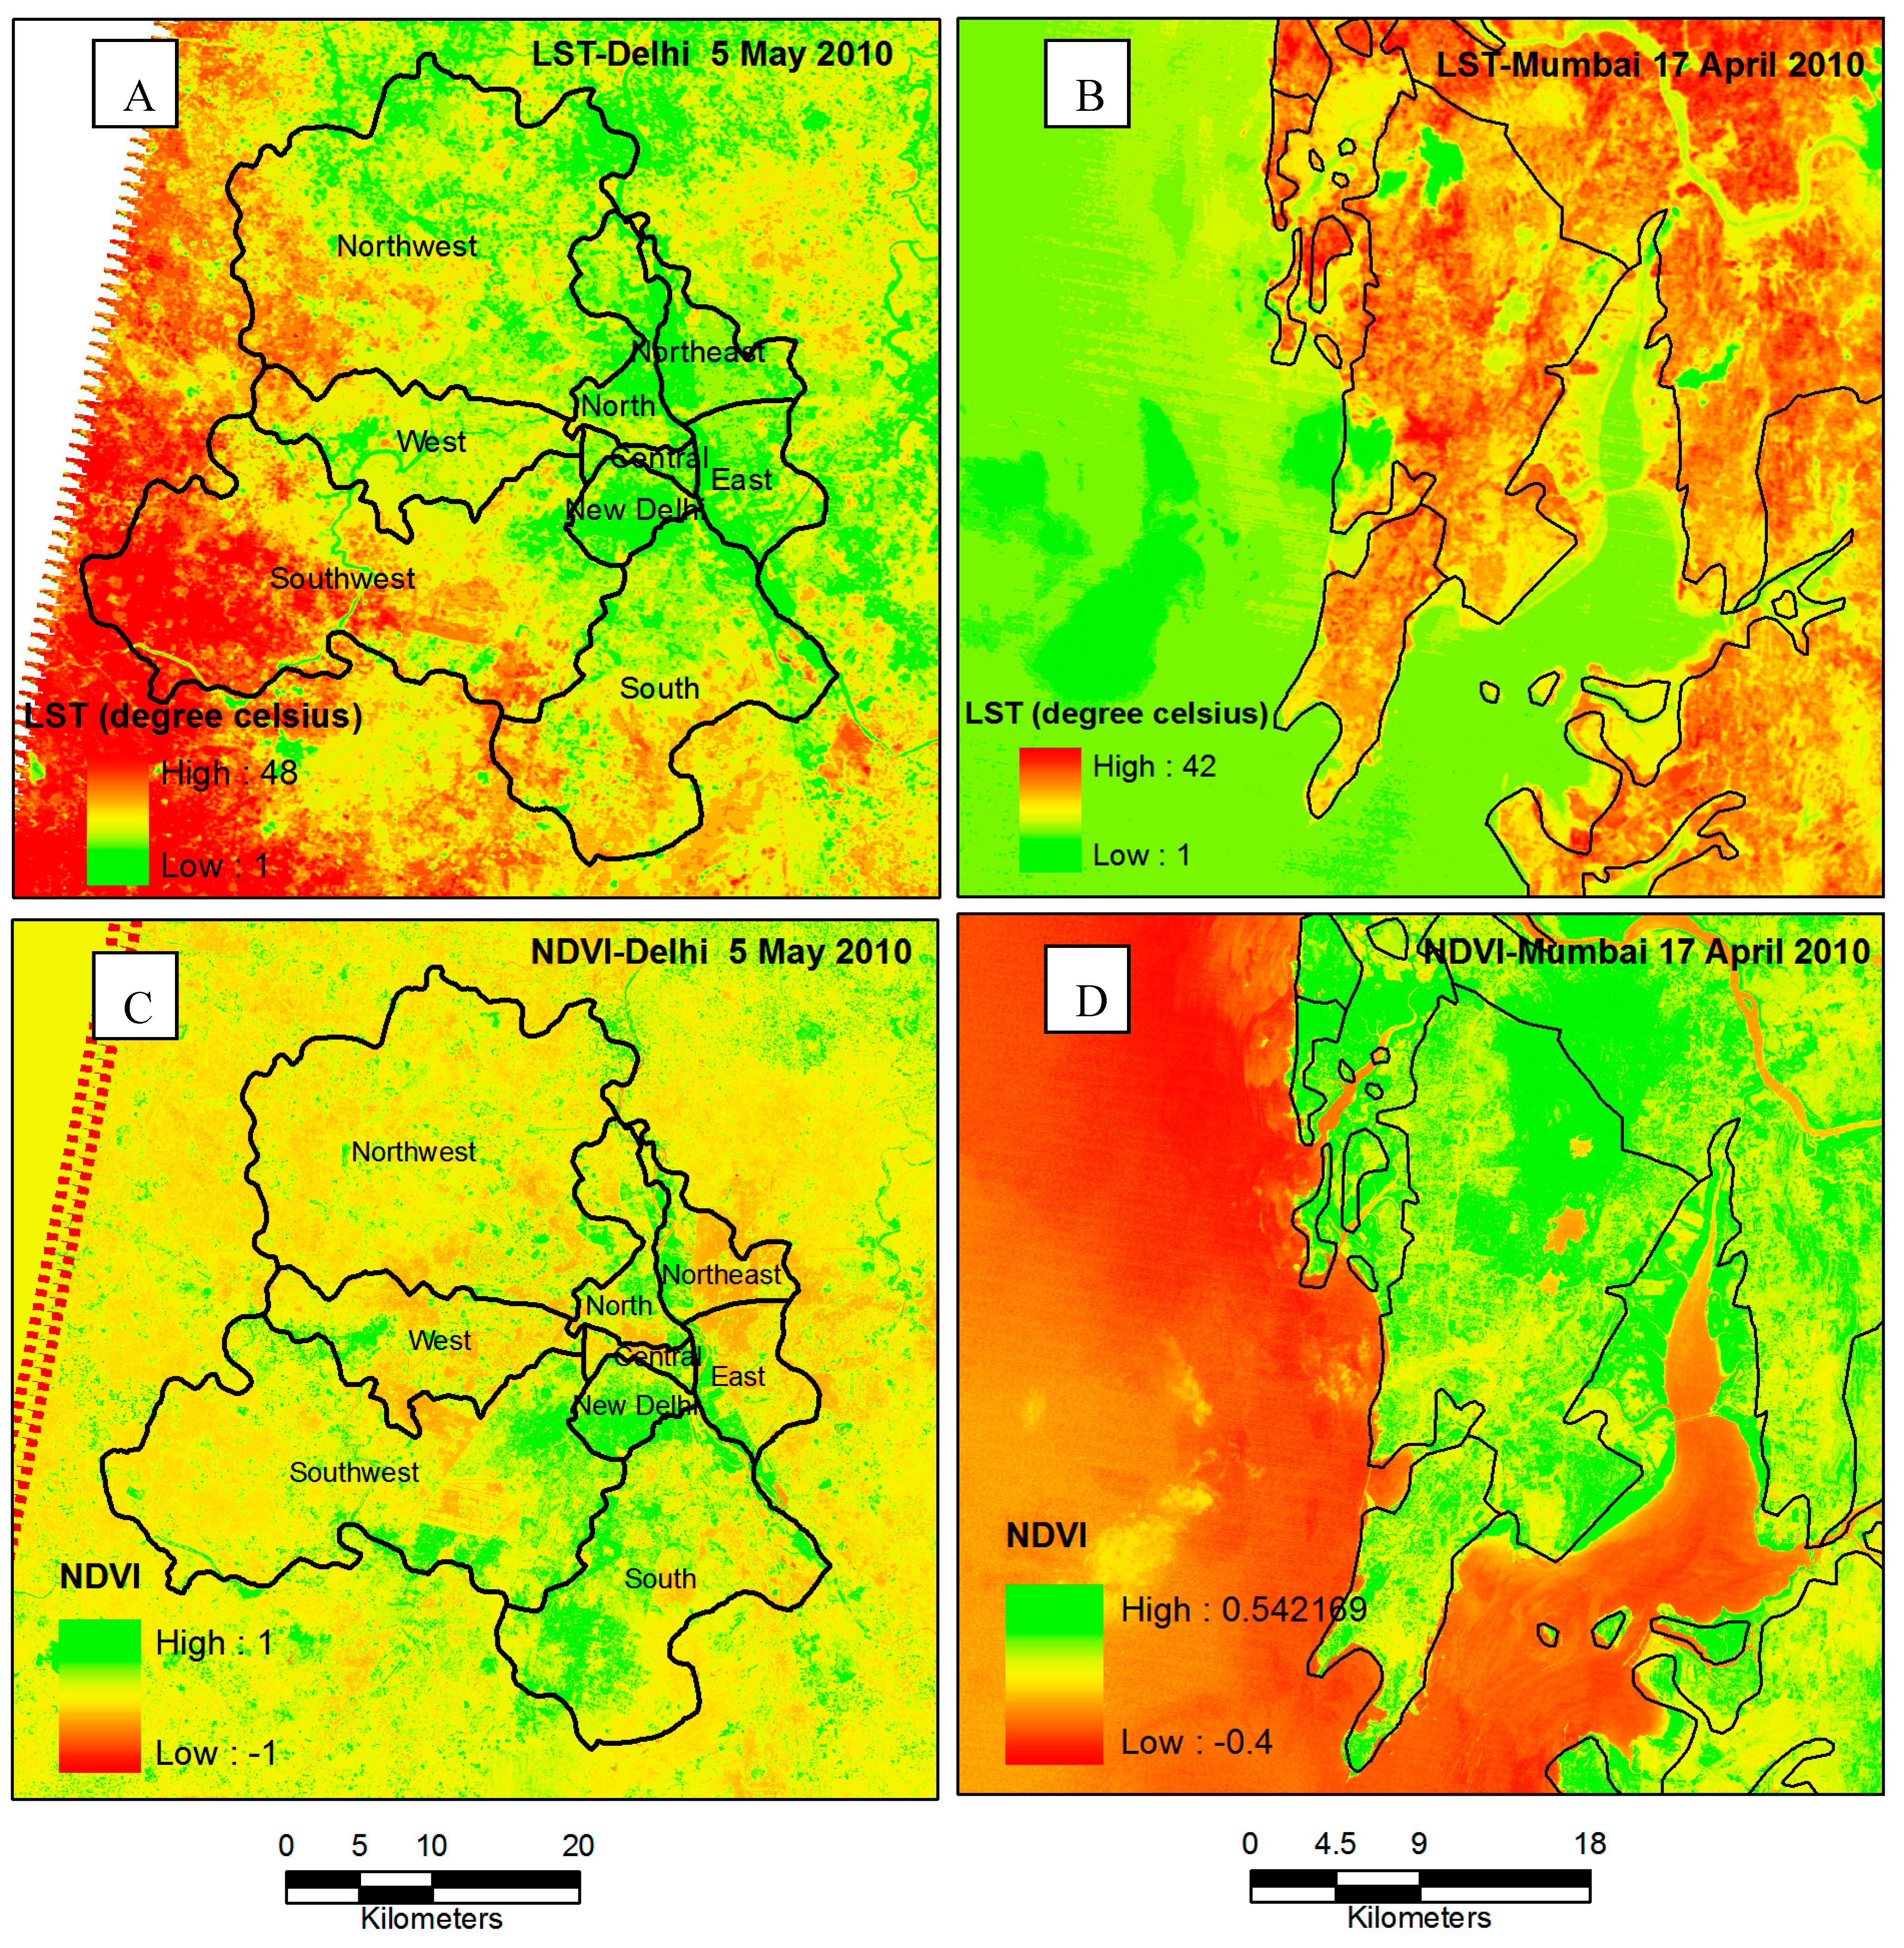
4.1. Analysis of Land Surface Temperature

4.2. Analysis of NDVI
5. Conclusions

Acknowledgments
Author Contributions
Conflicts of Interest
References
- Voogt, J.A.; Oke, T.R. Thermal remote sensing of urban climates. Remote Sens. Environ. 2003, 86, 370–384. [Google Scholar] [CrossRef]
- Valsson, S.; Bharat, A. Urban heat island: Cause for microclimate variations. Architecture-Time Space & People 2009, 21–25. [Google Scholar]
- Singh, R.B.; Grover, A. Remote sensing of urban microclimate with special reference to urban heat island using Landsat thermal data. Geogr. Polonica 2014, 87, 555–568. [Google Scholar] [CrossRef]
- Weng, Q.; Dengshang, L.; Jacquelyn, S. Estimation of land surface temperature—Vegetation abundance relationship for urban heat island studies. Remote Sens. Environ. 2004, 89, 467–483. [Google Scholar] [CrossRef]
- Amiri, R.; Weng, Q.; Alimohammadi, A.; Alavipanah, S.K. Spatial-temporal dynamics of land surface temperature in relation to fractional vegetation cover and land use/cover in the Tabriz urban area, Iran. Remote Sens. Environ. 2009, 113, 2606–2617. [Google Scholar] [CrossRef]
- Le-Xiang, Q.; Hai-Shan, C.; Jie, C. Impacts of land use and cover change on land surface temperature in the Zhujiang Delta. Pedosphere 2006, 16, 681–689. [Google Scholar] [CrossRef]
- Kuang, W.; Chi, W.; Lu, D.; Dou, Y. A comparative analysis of megacity expansions in China and the U.S.: Patterns, rates and driving forces. Landsc. Urban Plan. 2014, 132, 121–135. [Google Scholar] [CrossRef]
- Ding, H.; Shi, W. Land-use/land-cover change and its influence on surface temperature: A case study in Beijing city. Int. J. Remote Sens. 2013, 34, 5503–5517. [Google Scholar] [CrossRef]
- Jusuf, S.K.; Wong, N.H.; Hagen, E.; Anggoro, R.; Hong, Y. The influence of land use on the urban heat island in Singapore. Habitat Int. 2007, 31, 232–242. [Google Scholar] [CrossRef]
- Zhang, H.; Qi, Z.-F.; Ye, X.-Y.; Cai, Y.-B.; Ma, W.-C. Analysis of land use/land cover change, population shift, and their effects on spatiotemporal patterns of urban heat islands in metropolitan Shanghai, China. Appl. Geogr. 2013, 44, 121–133. [Google Scholar] [CrossRef]
- Li, J.; Song, C.; Cao, L.; Zhu, F.; Meng, X.; Wu, J. Impacts of landscape structure on surface urban heat islands: A case study of Shanghai, China. Remote Sens. Environ. 2011, 115, 3249–3263. [Google Scholar] [CrossRef]
- Kuang, W.; Liu, Y.; Dou, Y.; Chi, W.; Chen, G.; Gao, C.; Yang, T.; Liu, J.; Zhang, R. What are hot and what are not in an urban landscape: Quantifying and explaining the land surface temperature pattern in Beijing, China. Landsc. Ecol. 2015, 30, 357–373. [Google Scholar] [CrossRef]
- Kuang, W.; Dou, Y.; Zhang, C.; Chi, W.; Liu, A.; Liu, Y.; Zhang, R.; Liu, J. Quantifying the heat flux regulation of metropolitan land use/land cover components by coupling remote sensing modeling with in situ measurement. J. Geophys. Res. Atmos. 2015, 120, 113–130. [Google Scholar]
- Xiong, Y.; Huang, S.; Chen, F.; Ye, H.; Wang, C.; Zhu, C. The impacts of rapid urbanization on the thermal environment: A remote sensing study of Guangzhou, South China. Remote Sens. 2012, 4, 2033–2056. [Google Scholar] [CrossRef]
- Zhang, J.; Wang, Y. Study of the relationships between the spatial extent of surface urban heat islands and urban characteristic factors based on Landsat ETM+ Data. Sensors 2008, 8, 7453–7468. [Google Scholar] [CrossRef]
- Singh, R.B.; Grover, A.; Zhan, J. Inter-seasonal variations of surface temperature in the urbanized environment of Delhi using Landsat thermal data. Energies 2014, 7, 1811–1828. [Google Scholar] [CrossRef]
- Li, Y.Y.; Zhang, H.; Kainz, W. Monitoring patterns of urban heat islands of the fast-growing Shanghai metropolis, China: Using time-series of Landsat TM/ETM+ data. Int. J. Appl. Earth Obs. Geoinf. 2012, 19, 127–138. [Google Scholar] [CrossRef]
- Lo, C.P.; Quattrochi, D.A. Land-use and land-cover change, urban heat island phenomenon, and health implications: A remote sensing approach. Photogramm. Eng. Remote Sens. 2003, 69, 1053–1063. [Google Scholar] [CrossRef]
- Julien, Y.; Sobrino, J.A.; Mattar, C.; Ruescas, A.B.; JimeNez-Munoz, J.C.; SoRia, G.; Hidalgo, V.; Atitar, M.; Franch, B.; Cuenca, J. Temporal analysis of normalized difference vegetation index (NDVI) and land surface temperature (LST) parameters to detect changes in the Iberian land cover between 1981 and 2001. Int. J. Remote Sens. 2011, 32, 2057–2068. [Google Scholar] [CrossRef]
- Kawashima, S. Relation between vegetation, surface temperature and surface composition in the Tokyo region during winter. Remote Sens. Environ. 1994, 50, 52–60. [Google Scholar] [CrossRef]
- Zhang, X.X.; Wu, P.F.; Chen, B. Relationship between vegetation greenness and urban heat island effect in Beijing City of China. Procedia Environ. Sci. 2010, 2, 1438–1450. [Google Scholar] [CrossRef]
- Chen, X.L.; Zhao, H.M.; Li, P.X.; Yin, Z.Y. Remote sensing image-based analysis of the relationship between urban heat island and land use/cover changes. Remote Sens. Environ. 2006, 104, 133–146. [Google Scholar] [CrossRef]
- Zhang, Y.; Yiyun, C.; Qing, D.; Jiang, P. Study on urban heat island effect based on Normalized Difference Vegetated Index: A case study of Wuhan City. Procedia Environ.Sci. 2012, 8, 574–581. [Google Scholar] [CrossRef]
- Mallick, J.; Singh, C.K.; Shashtri, S.; Rahman, A.; Mukherjee, S. Land surface emissivity retrieval based on moisture index from Landsat TM satellite data over heterogeneous surfaces of Delhi city. Int. J. Appl. Earth Obs. Geoinf. 2012, 19, 348–358. [Google Scholar] [CrossRef]
- Mallick, J.; Kant, Y.; Bharath, B.D. Estimation of land surface temperature over Delhi using Landsat-7 ETM. J. Indian Geophys. Union 2008, 12, 131–140. [Google Scholar]
- Sharma, R.; Joshi, P.K. Monitoring urban landscape dynamics over Delhi (India) using remote sensing (1998–2011) inputs. J. Indian Soc. Remote Sens. 2013, 41, 641–650. [Google Scholar] [CrossRef]
- Kant, Y.; Bharath, B.D.; Mallick, J.; Atzberger, C.; Kerle, N. Satellite-based analysis of the role of land use/land cover and vegetation density on surface temperature regime of Delhi, India. J. Indian Soc. Remote Sens. 2009, 37, 201–214. [Google Scholar] [CrossRef]
- Acharya, A.K.; Nangia, P. Population growth and changing land-use pattern in Mumbai metropolitan region of India. Caminhos de Geografia 2004, 11, 168–185. [Google Scholar]
- Pacione, M. City profile—Mumbai. Cities 2006, 23, 229–238. [Google Scholar] [CrossRef]
- Grover, A.; Parthasarathy, D. Relocation and changing nature of vulnerability—A case study of Krantinagar Slum, Mumbai. Horizon J. Soc. Sci. 2012, 3, 1–19. [Google Scholar]
- Directorate of Census Operations. Provisional Population Totals, NCT of Delhi; Ministry of Home Affairs, Government of India: New Delhi, India, 2011. [Google Scholar]
- Directorate of Census Operations. Provisional Population Totals, Maharashtra; Ministry of Home Affairs, Government of India: New Delhi, India, 2011. [Google Scholar]
- Forest Survey of India. State of Forest Report; Ministry of Environment & Forests: Dehradun, India, 2011. [Google Scholar]
- United States Geological Survey (USGS). Available online: www.earthexplorer.usgs.gov (accessed on 15 October 2014).
- Singh, R.B.; Grover, A. Spatial correlations of changing land use, surface temperature(UHI) and NDVI in Delhi using Landsat satellite images. In Urban Development Challenges, Risks and Resilience in Asian Megacities; Singh, R.B., Ed.; Springer: Tokyo, Japan, 2015; pp. 83–98. [Google Scholar]
- Landsat 7 Science Data Users Handbook; National Aeronautics and Space Administration (NASA): Washington, DC, USA, 2003. Available online: http://landsathandbook.gsfc.nasa.gov/pdfs/Landsat7_Handbook.pdf (accessed on 8 April 2015).
- Murayama, Y.; Lwin, K.K. Estimation of Landsat TM Surface Temperature Using ERDAS Imagine Spatial Modeler; University of Tsukuba: Ibaraki, Japan, 2010. Available online: http://giswin.geo.tsukuba.ac.jp/sis/tutorial/koko/SurfaceTemp/SurfaceTemperature.pdf (accessed on 15 October 2014).
- Chander, G.; Markham, B.; Helder, D. Summary of current radiometric calibration coefficients for Landsat MSS, TM, ETM+ and EO-1 ALI sensors. Remote Sens. Environ. 2009, 113, 893–903. [Google Scholar] [CrossRef]
- Yue, W.; Xu, J.; Tan, W.; Xu, L. The relationship between land surface temperature and NDVI with remote sensing: Application to Shanghai Landsat 7 ETM+ data. Int. J. Remote Sens. 2007, 28, 3205–3226. [Google Scholar] [CrossRef]
- Roy, S.S.; Singh, R.B.; Kumar, M. An analysis of local spatial temperature patterns in the Delhi Metropolitan Area. Phys. Geogr. 2011, 32, 114–138. [Google Scholar] [CrossRef]
- Pandey, P.; Kumar, D.; Prakash, A.; Kumar, K.; Jain, V.K. A study of the summertime urban heat island over Delhi. Int. J. Sustain. Sci. Stud. 2009, 1, 27–34. [Google Scholar]
- Yuan, F.; Bauer, M.E. Comparison of impervious surface area and normalized difference vegetation index as indicators of surface urban heat island effects in Landsat imagery. Remote Sens. Environ. 2007, 106, 375–386. [Google Scholar] [CrossRef]
© 2015 by the authors; licensee MDPI, Basel, Switzerland. This article is an open access article distributed under the terms and conditions of the Creative Commons Attribution license (http://creativecommons.org/licenses/by/4.0/).
Share and Cite
Grover, A.; Singh, R.B. Analysis of Urban Heat Island (UHI) in Relation to Normalized Difference Vegetation Index (NDVI): A Comparative Study of Delhi and Mumbai. Environments 2015, 2, 125-138. https://0-doi-org.brum.beds.ac.uk/10.3390/environments2020125
Grover A, Singh RB. Analysis of Urban Heat Island (UHI) in Relation to Normalized Difference Vegetation Index (NDVI): A Comparative Study of Delhi and Mumbai. Environments. 2015; 2(2):125-138. https://0-doi-org.brum.beds.ac.uk/10.3390/environments2020125
Chicago/Turabian StyleGrover, Aakriti, and Ram Babu Singh. 2015. "Analysis of Urban Heat Island (UHI) in Relation to Normalized Difference Vegetation Index (NDVI): A Comparative Study of Delhi and Mumbai" Environments 2, no. 2: 125-138. https://0-doi-org.brum.beds.ac.uk/10.3390/environments2020125