Review

A Review of Applicability and Effectiveness of Low Impact Development/Green Infrastructure Practices in Arid/Semi-Arid United States

1
Environmental Protection Agency Office of Research and Development, Environmental Sciences Division, 944 East Harmon Ave., Las Vegas, NV 89119, USA
2
Urban Drainage and Flood Control District, 2480 W 26th Ave, Suite 156-B, Denver, CO 80211, USA
*
Author to whom correspondence should be addressed.
Submission received: 25 February 2015 / Revised: 29 April 2015 / Accepted: 5 May 2015 / Published: 8 June 2015

Abstract

:
Urbanized areas of the southwestern/western United States are among the fastest growing in the nation and face multiple water resource challenges. Low impact development (LID)/green infrastructure (GI) practices are increasingly popular technologies for managing stormwater; however, LID is often not as common in the southwest/west due to the lack of regulatory and/or economic drivers. There is also a lack of performance evaluation of these practices, particularly at the field scale. This study focused on investigating the hydrologic and pollutant removal performance of field-scale LID/GI systems in arid/semi-arid climates. Nine typical practices were reviewed: rainwater harvest system, detention pond, retention pond, bioretention, media filter, porous pavement, vegetated swale/buffer/strip, green roof, and infiltration trench, as well as integrated LIDs. We evaluate these practices by a cost-effectiveness analysis and also recommend best practices for the arid/semi-arid area. The analysis provides data support and insights for future implementation of LID/GI in the southwest/west.

1. Introduction

Low impact development (LID) is an approach to land development (or redevelopment) that works with nature to manage stormwater as closely to its source as possible. Green infrastructure (GI) uses natural hydrologic features to manage water and provide environmental and community benefits. Many municipalities are now implementing LID or GI programs known for their benefits in reducing stormwater runoff and nonpoint source pollution. Many of these techniques were developed and evaluated mainly in the eastern United States [1], where rainfall is abundant. Few studies have focused on the arid and semi-arid regions of the western/southwestern U.S. because of the perception that LID or stormwater control is useless in a region with so little annual precipitation [2].
In the western/southwestern U.S., precipitation mainly occurs during two periods: long-duration/low-intensity rainfall in winter and short-duration/high-intensity rainfall in summer. Mobile solutes accumulate during dry periods and are flushed from upland soil to surface waters during storm events [3,4]. Although the rainfall is episodic in this region, studies indicate that solute flushing from semi-arid uplands and hill slopes in response to summertime rainfall results in elevated streamflow solute concentrations and sediment transport [5,6]. In addition, watersheds in the desert west/southwest often release water almost immediately after a storm [7] due to sparse vegetation, steep topography, complex soils and rapid land development changes.
Lewis and Grimm [8] proved the “N build and flush” hypothesis in the central Arizona-Phoenix metropolitan area, which states there is little biotic processing of N deposited to arid urban surfaces with little organic matter, and that overland flow entrains nearly all mobilizable N and exports it from the catchment. They also found nitrate loads were greater for more impervious catchments, which could be attributed to increased short-term build-up of N in a mobilizable phase and increased runoff as overland flow. They suggested that, even with daunting seasonal and interannual variability in storm conditions, material export (e.g., nitrogen) can be reduced by managing intrinsic catchment features.
In the Las Vegas Valley, Reginato and Piechota [9] indicated that high nutrient loads from high rainfall in summer 2000 and winter 2001 may have contributed to Lake Mead’s algal bloom in spring 2001. Nonpoint source total phosphorus (TP) loads were approximately 15% of total loads to receiving waters, primarily from nonpoint source runoff during the wet period. Additionally, the TP level exceeded the value assumed by the Nevada Division of Environmental Protection (NDEP) and approached permitted loads from wastewater treatment plants that discharge into the Las Vegas Wash.
In semi-arid southern California’s Tijuana River Basin, deteriorating water quality has been associated with increasingly intensive urban development. The toxicity of waters in the Tijuana River was generally low under baseflow conditions, but greatly increased during high flow events [10]. Urban stormwater runoff is also a major source of contaminants in southern California’s coastal waters and toxic stormwater plumes have been found to result from stormwater discharge into Santa Monica Bay [11], San Diego Bay [12] and Newport Bay [13,14].
Stormwater management in the western/southwestern U.S generally focuses on rapid removal of stormwater through straightened and, frequently, lined channels with little consideration for water quality impact. Stormwater management has actually impaired the surface water [1]. For example, fecal coliform and E. Coli have been identified as pollutants of concern [15] and their concentration levels increased in many western rivers with storm runoff [16].
The fastest-growing urbanized regions in the country [17,18,19] from the western and southwestern U.S. have also been identified as the most persistent hotspots due to climate change associated with higher precipitation variability and higher temperatures [20,21]. Increasing evidence also suggests that, due to current warming trends, socioeconomic and natural systems of the western and southwestern US will likely be affected by more intense precipitation extremes [22,23]. Larger floods may cause more elevated solutes and nutrients in stormwater runoff more quickly [1,24]. To protect this ecologically sensitive region, design recommendations for LIDs are urgently needed
The objectives of this study are to: (1) review field performance studies of LID/GI practices in the western/southwestern U.S.; (2) analyze effectiveness of the practices, summarize benefits, and highlight research needs; (3) compare effectiveness of the reviewed practices; and (4) make recommendations for future implementation. This study will provide insights to guide LID/GI implementation in the western/southwestern U.S.

2. Methods and Procedures

2.1. Study Area

Arid and semi-arid regions of the western/southwestern U.S are defined by the United States Climate Regions, classified by the National Oceanic and Atmospheric Administration (NOAA). West refers to California and Nevada, and southwest refers to Utah, Colorado, Arizona, and New Mexico.

2.2. Evaluation of Benefits/Effectiveness of Low Impact Development/Green Infrastructure (LID/GI) Practices

The effectiveness of LID/GI was evaluated by runoff reduction and pollutant removal. Runoff reduction was calculated using Equation (1) and pollutant removal was evaluated by concentration/ load reduction rate, which is calculated using Equations (2) and (3).
Runoff Reduction Rate =  influent runoff volume   effluent runoff volume influent runoff volume ×  100%
Pollutant Concentration Reduction Rate/Efficiency =  (Conc in Conc out ) Conc in ×  100%
Pollutant Load Reduction Rate/Efficiency =  (Load in Load out ) Load in ×  100%
In this study, reduction is considered significant if the concentration reduction rate is greater than 50% or the load reduction greater than 70%; concentration reduction is a more conservative criterion than load reduction due to flow reduction. If multiple design formats are available for a particular LID practice, the format with the greatest effectiveness is selected to represent the practice’s full potential. Design differences will also be described for future implementation.
Water quality constituents in this review were selected based on constituents listed in the national drinking water standard [25]. All constituents and their abbreviations are summarized in Table 1.
Table 1. Water quality constituents and their abbreviations used in this study.
ConstituentsAbbreviation
Chemical Oxygen DemandCOD
Total Suspended SedimentTSS
Total NitrogenTN
Nitrite + NitrateNO3 + NO2
AmmoniaNH3-N
Total Kjeldahl NitrogenTKN
Total PhosphorusTP
Ortho-phosphateOrtho-P
Particulate PhosphorusParticulate P
Dissolved PhosphorusDis. P
Total CopperTot. Cu
Total NickelTot. Ni
Total ZincTot. Zn
Total LeadTot. Pb
Dissolved CopperDiss. Cu
Dissolved NickelDiss. Ni
Dissolved ZincDiss. Zn
Dissolved LeadDiss. Pb
Particulate CopperParticulate Cu
Particulate NickelParticulate Ni
Particulate ZincParticulate Zn
Particulate LeadParticulate Pb
AluminumAl
Total BerylliumTot. Be
Total ChromiumTot. Cr
Total ArsenicTot. As
Total SeleniumTot. Se
Total CadmiumTot. Cd
Total AntimonyTot. Sb
Fecal ColiformFecal Coli.

3. A Review of LID/GI Practices

3.1. Rainwater Harvest System

3.1.1. Definition and Applicability

Rainwater harvest (RWH) systems collect and store rainfall for later use. An RWH system is designed to slow and reduce runoff as well as provide irrigation water, reduce water bills and conserve municipal water supplies. It may be particularly attractive in arid/semi-arid regions where it can reduce demands on increasingly limited water supplies. The system includes active storage of collected water in a receptacle, or changing surface topography to slow/capture runoff to increase water storage for sediments [26].
The city of Tucson, AZ [27] published a Water Harvesting Guidance Manual which identified principles of stormwater runoff harvesting and explained its benefits in reducing site discharge, erosion, pollutant transport, and dependence on conventional stormwater management practices, as well as reducing costs.

3.1.2. Benefits/Effectiveness

DeCook and Foster [28] assessed the technical possibility for harvesting rainfall in Tucson’s urban area. They indicated that local characteristics of rainfall must be determined to design and operate the RWH system efficiently. Factors included annual rainfall amount and distribution, monthly rainfall distribution, rainfall intensity and duration, and quality of rainfall relative to its intended use. With diminishing supplies of groundwater (Tucson’s primary municipal water source), they suggested that harvested rainfall and runoff are attractive, technically feasible alternatives. A systematic plan to divert runoff also provided an opportunity to enhance groundwater recharge and, concurrently, reduce flood hazards during extreme runoff events.
Karpiscak et al. [29] conducted a four-year study on a single-family residence in Tucson to study potential benefits of rainwater harvesting, water-conserving fixtures, and graywater reuse. Tucson’s rainfall patterns are characterized by summer storms (monsoons) and winter rains, with an average rainfall of approximately 280 mm per year. The storage capacity of the RWH system was approximately 8000 gallons, with actual stored rainwater varying from 491 gallons in July 1986 to 8284 gallons in April 1987. They found efficient use of water could significantly decrease demand for domestic water at the residence without reducing quality of life. On average, municipal water use was reduced by 66 percent, total household use by 27 percent, and graywater reuse averaged approximately 32 percent of total household use. There were also dry years, however, when rainwater supplies were exhausted which limited the system’s operation.
Jensen [30] conducted a study in the Salt Lake City, UT metropolitan area (average annual rainfall 472 mm), assessing performance of an RWH system and its feasibility under western water laws. Daily water balance analysis indicated that captured rainfall could supply 2% to 10% of water use of a single-family residence. Monthly data analysis showed an 8500-gallon tank would serve outdoor water use for a small residence, although greater storage capacity might be needed in wet winter months. A neighborhood-scale RWH system could pay off tank construction costs in just five months, while the same practice at single residence-scale would take more than 30 years. Neighborhood RWH conservation would require approval for the water rights, however, which is often the most significant impediment to large-scale implementation of RWH in the west.
An RWH system was recently implemented in Denver, Colorado (Piza, personal communication). A 3000-gallon cistern collects rainwater from the roof of a school building which is then used to irrigate adjacent landscape areas; the building roof is 0.07 ha, most of which drains to this cistern. The system has a real-time connection to NOAA Weather forecasting that enables it to purge water in advance of a storm event to make more volume available for the forecasted event; this increases capture but also decreases volume available for irrigation. Data show that in 2012 and 2013, the system captured 45% of total runoff volume while supplying 69% of irrigation demand. It should be noted that the site received 100-year rainfall in September 2013 which greatly reduced the percent capture; when excluding that event from the data, the system captured 75% of the total rainfall.
Steffen et al. [31] quantified the water supply and stormwater management benefits of residential RWH in 23 U.S. cities across seven climatic regions. Their study was based on long-term rainfall records, historical water use data and model simulation using the Storm Water Management Model (SWMM). Water supply benefits were represented by water-saving efficiency at a residential parcel, which depended on cistern size and climatic pattern. A single rain barrel (190 L/50 gal) installed at a residence can provide approximately 50% water-saving efficiency for nonpotable indoor water demand scenarios in cities of the East Coast, Southeast, Midwest, and Pacific Northwest, but less than 30% in cities of the Mountain West, Southwest, and most of California. Stormwater management benefits are quantified by runoff reduction at a residential drainage catchment scale. Results showed RWH can reduce stormwater runoff volume by up to 20% in semi-arid regions using the SWMM based on long-term simulation.

3.1.3. Cost Analysis

Costs of RWH range from hundreds of dollars to tens of thousands, depending on the scale, water use, and end user water quality requirements. Currently, there is limited information about the whole life cycle cost and benefits of RWH at a municipal or watershed scale [32]. Recent work sponsored by the Water Environment Research Foundation and the EPA produced a set of whole life cycle cost tools for BMP and LID [33] which should be incorporated into life cycle cost assessment to aid future decisions—to implement LIDs.

3.1.4. Summary and Future Development Trends

Collecting rainwater is an excellent method of conserving water and controlling stormwater; however, water laws may be the most significant impediment to large-scale implementation of RWH in the western/southwestern U.S. [30,32,34]. While making western water laws amendable to RWH has been a recent topic in western state legislatures, there is also a need to revise building and development codes for RWH implementation. A number of cities and counties including Tucson, AZ and Santa Fe County, NM recently developed rainwater collection requirements for new construction. And finally, the cost and effectiveness of RWH should be assessed at site level as well as neighborhood and municipal levels, under a range of conditions, to facilitate urban planning [32].

3.2. Detention (Dry) Pond

3.2.1. Definition and Applicability

Dry detention ponds (also known as dry ponds and extended detention basins) have outlets designed to detain stormwater runoff for a minimum of 24 h to allow particles and associated pollutants to settle. Unlike wet ponds, they do not maintain a large, permanent pool of water [35].
Dry detention ponds (DPs) are one of the most feasible and widely used stormwater practices in arid/semi-arid regions since they do not require a permanent pool of water [36]. Most were designed exclusively for flood control, but can be easily modified for greater treatment of stormwater quality. While dry DPs are not noted for their ability to remove soluble pollutants, they are reasonably effective in removing sediment and other pollutants associated with particulate matter. In addition, they play key roles in downstream channel protection if an appropriate design is selected that incorporates adequate upstream pretreatment.

3.2.2. Benefits/Effectiveness

Piza et al. [37] studied the long-term performance of a dry DP at the Grant Ranch in Denver, Colorado with regard to runoff volume reduction and stormwater quality. The dry DP was the first step in a train approach to treating stormwater from residential development. The study watershed is 7.6 ha with site imperviousness of 51% and Hydrologic Soil Group C. The study area contained single-family residences, paved roads, and open space. Volume reduction was not calculated due to flow measurement errors. Based on a ten-year observation, significant reductions in TSS and Tot. Zn were found, while the dry ponds also showed potential in controlling E. Coli. (Table 2).
Table 2. Pollutant removal rates of dry detention pond case study one **.
ConstituentsAverage Influent ConcentrationAverage Effluent ConcentrationAverage Concentration Reduction (%) *50th Event-Based Reduction Rate (%) *
TSS (mg/L)103.032.668%66%
TN (mg/L)4.33.226%10%
NO3 + NO2 (mg/L)0.90.722%27%
TKN (mg/L)2.61.927%15%
TP (mg/L)0.40.325%16%
Ortho-P (mg/L)0.40.325%3%
Tot. Cu (µg/L)7.810.1−29%38%
Tot. Zn (µg/L)68.822.767%65%
Diss. Cu (µg/L)7.04.339%26%
Diss. Zn (µg/L)19.414.824%33%
E. Coli (#/100mL)28,472609979%47%
Note: * Average concentration reduction was calculated based on average influent/effluent concentrations; 50th event-based reduction rate was calculated based on each storm event. ** Data summary was based on reference [37].
In Logan, Utah, Yang et al. [38] evaluated field performance of a detention basin; the study site is 0.135 ha with 85% impervious area and Hydrologic Soil Group B. Average TSS reduction rate was reported as 80% which decreased with increasing impervious cover in the contributing watersheds.
In California, dry DPs were implemented at five sites (three in Los Angeles and two in San Diego) located within highway rights-of-way and with runoff collected exclusively from the highway [39]; annual average rainfall depths of the two locations were 25.4 mm and 40.5 mm, respectively. Site areas ranged from 0.4 to 5.42 ha with impervious percentage from 28% to 100%. The ponds were best at removing particulate constituents, but removal of nutrients and dissolved metals was comparatively modest. And pond material affected removal efficiency: earthen ponds had higher removal efficiencies than concrete-lined basins. Significant reduction was observed for TSS, Tot. Cu, Tot. Pb, Tot. Zn, particulate Cu, particulate Pb, and particulate Zn using earthen dry DPs as shown in Table 3; nutrient removals were not significant. Concrete-lined basins generally did not show significant reductions.
The highest load reductions were often attributed to high infiltration occurring at the site during small rainfall events. Infiltration amounts are often affected by soil, climatic conditions and local water table elevation in the earthen basin [39].
Table 3. Pollutant removal rates of dry detention pond case study 2 ****.
Flow/ConstituentsAverage Influent EMC * (mg/L)Average Effluent EMC * (mg/L)Concentration Reduction Rate ** (%)Load Reduction Rate*** (%)
TSS (mg/L)137397279
TN (mg/L)3.32.81435
NO3-N (mg/L)1.11.0830
TKN (mg/L)2.21.91738
TP (mg/L)0.50.33954
Ortho-P (mg/L)0.10.1−228
Particulate P (mg/L)0.50.33966
Tot. Cu (µg/L)53.022.05868
Tot. Pb (µg/L)87.024.07279
Tot. Zn (µg/L)418.0115.07379
Diss. Cu (µg/L)12.012.0024
Diss. Pb (µg/L)3.02.02946
Diss. Zn (µg/L)71.060.01636
Particulate Cu (µg/L)41.010.07682
Particulate Pb (µg/L)84.022.07480
Particulate Zn (µg/L)347.055.08488
Note: * EMC = Event Mean Concentration. ** The concentration reduction was computed based on average mean EMC during the study period. *** Load reduction was computed based on total estimated wet season influent and effluent runoff volumes for all sites, and reported concentrations shown in the table. **** Data summary was based on reference [39].

3.2.3. Cost Analysis

Caltrans [39] provided a cost analysis of a dry DP, with construction costs ranging from $91,035 to $356,300 (average of $172,737) and annual operation and maintenance costs of $3120. To account for differences in storm depth design and differences in the runoff coefficient of each site, construction costs have been normalized by water quality volume (WQV) which ranges from $303 to $1307/m3 WQV. The life cycle cost is $673/m3 WQV over a 20-year life span which was estimated by adding the value of normalized expected operation and maintenance costs to normalized construction costs.

3.2.4. Summary and Future Development Trends

Overall, the dry DP is effective at removing particulate pollutants through sedimentation, but not at removing soluble pollutants. Concentration reductions were: TSS (72%), Total Cu (58%), Total Pb (72%), Total Zn (73%), particulate Cu (76%), particulate Pb (74%), and particulate Zn (84%). The results are generally consistent with studies performed in other regions [40,41,42]. In North Carolina, Stanley [42] found the median treatment efficiency was 71% for TSS, 45% for particulate N, 33% for particulate P, and 26%−55% for metals. In Florida, typical removal rates reported by Schueler [41] were 61% for TSS, 19% for TP, 31% for TN, 9% for NO3-N, 26% to 54% for metals. In a national study on mitigating highway runoff, Young et al. [40] indicated reduction rate ranges varied with detention time: 68%–90% for TSS, 42%–50% for TP, 28%–40% for TN, 68%–90% for Pb, and 42%–50% for total Zn/Cu.
In our study, removal of reviewed nutrients was not promising. The removal rate of TN was lower than that of other regions, which must be confirmed by future studies. Ortho-P showed elevated concentration in the effluent, so designers should be aware of this and handle it with caution to prevent pollution problems.

3.3. Retention Pond

3.3.1. Definition and Applicability

Retention ponds (RPs), also known as wet retention ponds, wet extended detention ponds and wet basins, are constructed basins that have a permanent pool of water throughout the year, or at least throughout the wet season [35]. RPs are often built for water quality treatment purposes and can also be used for temporary runoff storage. Ponds treat incoming stormwater runoff by allowing particles to settle and algae to take up nutrients. Wet ponds can be applied in most U.S. regions, except extremely dry climates where it is difficult to justify the supplemental water needed to maintain a permanent pool due to water scarcity.

3.3.2. Benefits/Effectiveness

Yang et al. [38] evaluated performance of a retention basin in Logan, UT of 0.016 ha with 81% impervious area and Hydrologic Soil Group D. They reported an average TSS concentration reduction of around 54%.
In San Diego, a wet basin was constructed within the highway right-of-way to collect runoff from northbound lanes [39]. The site was constructed in sandy soil substrate rather than in the preferred substrate; an impermeable liner was included to improve the basin’s water-holding capability and ensure continuous circulation. The watershed area was 1.7 ha with impervious cover of 48%.
In the wet season, the RP performed best at removing particulate constituents, including metals, from stormwater, but was less effective at removing phosphorus where influent and effluent concentrations were not statistically different from the study by Caltrans [39]. TSS and total metal removals were effective, and significant concentration reductions were observed for TSS (94%), NO3-N (77%), Tot. Cu (89%), Tot. Pb (98%), Tot. Zn (91%), Dis. Cu (57%), Dis. Pb (76%), and Fecal Coli. (99%), as shown in Table 4.
Table 4. Concentration reduction of the retention pond ***.
ConstituentsAverage Influent EMC * (mg/L)Average Effluent EMC (mg/L)Conc. Reduction Rate ** (%)
TSS (mg/L)210.014.094
TN (mg/L)5.82.851
NO3-N (mg/L)2.80.777
TKN (mg/L)3.02.227
TP (mg/L)0.90.95
Ortho-P (mg/L)0.10.4−266
Tot. Cu (µg/L)97.011.089
Tot. Pb (µg/L)294.06.098
Tot. Zn (µg/L)414.037.091
Diss. Cu (µg/L)20.09.057
Diss. Pb (µg/L)9.02.076
Diss. Zn (µg/L)56.033.041
Fecal Coli. (MPN/100 mL)11,70010099
Note: * EMC = Event Mean Concentration. ** The concentration reduction was computed based on average mean EMC during the study period. *** Data summary was based on reference [39].

3.3.3. Cost Analysis

RP systems often cost 25% to 40% more than other detention methods, depending on the contributing watershed area [43]. Maintenance typically consists of inspections, trash and debris removal, and mowing of embankments. Sediments must also be removed since failure to do so will decrease long-term performance. Based on a cost analysis [39], construction cost is $448,412 and annual operation and maintenance cost is $16,980. The normalized construction cost is $1731/m3 (WQV). The life cycle cost was estimated to be $2183/m3 WQV over a 20-year span.

3.3.4. Summary and Future Development Trends

Overall, the wet pond in the San Diego area of California showed effective removals of TSS, NO3-N, and total metals, consistent with results of other studies [40,44]. Reported average removal efficiencies in treating highway runoff were: TSS: 46%–84%, TP: 37%–49%, TN: 29%–34%, NO2 + NO3: 36%, Pb: 69%, and Zn: 59%; other metals ranged from 41% to 72%.
Besides high construction and maintenance costs, there are also environmental challenges for implementing wet ponds in southwestern/western regions. Since they require a relatively moist environment to be effective [40], major design modifications are often needed in arid or semi-arid areas. Stormwater designers must design for a variable pool level with as much as a three-foot draw down during the dry season. Use of wetland plants along the pond’s shoreline can help conceal the drop in water level, but managers also must consider chronic algal blooms, high densities of aquatic plants and occasional odor problems [36]. It is also difficult to justify supplemental water usage to maintain a stable pool level because of water scarcity.

3.4. Bioretention (Rain Garden)

3.4.1. Definition and Applicability

Bioretention (BR) or rain gardens are landscaping features adapted to provide on-site treatment of stormwater runoff. Rain gardens are often used to reduce runoff through evapotranspiration and improve water quality through bioreduction. They are commonly located in parking lot islands or within small pockets of residential land. Surface runoff is directed into shallow, landscaped depressions designed to incorporate many pollutant removal mechanisms that operate in forested ecosystems. During storms, the runoff ponds above the mulch and soil; runoff from larger storms is generally diverted past the facility to a storm drain system and the remainder filters through the mulch and prepared soil mix. Filtered runoff can be collected in a perforated underdrain and returned to the storm drain system. Bioretention systems are generally applied to small sites and in highly urbanized settings. Moreover, they can be applied in many climatological and geologic situations, especially arid/semi-arid climates where major design modifications are needed. [35].

3.4.2. Benefits/Effectiveness

A rain garden was built in a residential neighborhood in Lakewood, Colorado and vegetated with a drought-tolerant seed mixture and assorted plantings. The rain garden collected runoff from a medium density residential area of 0.77 ha with a composite impervious area of 46.7%. Runoff volume reduction, peak flow attenuation, and pollutant removal was monitored for three years (performance reported in Table 5). Removal of NH3-N, TSS, Cr, and Pb were significant, while concentrations for dissolved nutrients, as well as Be, Cu, As, Se, and Cd, were elevated after passing through the rain garden (Table 6).
Table 5. Flow volume and peak flow reduction rate of rain garden **.
YearAverage Runoff Volume Reduction Rate (%)
201160
201261
201337
3-Year Average53
Note: ** Data was based on experiment.
Table 6. Constituents concentrations and reduction rates of rain garden **.
ConstituentsMean InfluentMean EffluentEvent-Based Concentration Reduction Rate (%)Event-Based Load Reduction Rate (%)
5th *MedianMean95th *5th *MedianMean95th *
TSS (mg/L)264.351.3−5%91%63%98%−183%94%−21%99%
NO3 + NO2 (mg/L)0.72.1−1327%−128%−559%−5%−752%−105%−200%38%
TKN (mg/L)3.12.6−363%18%−31%70%−225%30%6%86%
NH3-N (mg/L)0.70.0−378%96%−28%100%−31%100%72%100%
TP (mg/L)0.40.7−1947%−133%−494%76%−1960%−26%−473%92%
Ortho-P (mg/L)0.20.4−844%−252%−269%−99%−443%−64%−106%80%
Diss. P (mg/L)0.51.1−1357%−196%−358%49%−842%−194%−241%38%
Tot. sol. P (mg/L)0.10.4−560%−350%−317%−104%−655%−158%−245%−57%
Tot. Cu (µg/L)16.623.4−393%−12%−73%63%−338%34%−31%77%
Tot. Pb (µg/L)8.15.0−503%98%−30%100%−360%100%16%100%
Tot. As (µg/L)3.34.4−139%−100%−112%100%−755%84%−129%100%
Tot. Be (µg/L)0.00.1−100%−100%−33%80%−265%24%−11%90%
Tot. Cd (µg/L)0.10.2−407%−100%−107%100%−177%100%10%100%
Tot. Cr (µg/L)2.91.4−170%100%32%100%100%100%93%100%
Tot. Sb (µg/L)0.40.5−100%32%26%100%45%83%74%100%
Tot. Se (µg/L)0.10.1−100%−100%−68%11%−170%−51%−17%68%
Note: * Percent reduction values represent the 5th and 95th percentiles. ** Data was based on experiment.

3.4.3. Cost Analysis

The total construction cost for the Lakewood rain garden project was $100,433. The facilities treated a total watershed area of 1.38 ha with 60.3% impervious area, or $120,692 per impervious hectare.

3.4.4. Summary and Future Development Trends

The rain garden effectively reduced average runoff volume by 53%. Removal of TSS (91%) and some metals was consistent with nationwide studies [45,46,47,48]; however, nitrogen and phosphorus removals were not promising. Although good removal of phosphorus was reported [48,49], all monitored phosphorus species showed that significantly elevated concentrations increased by 133%–350%. A possible reason is that nutrients in the media material were removed by runoff during storms since Dietz and Calusen [50] indicated rain garden soils were a source of stormwater pollutants. Nitrogen removal is challenging and removal performance varied greatly in other studies [51,52]. In a recent study of nitrogen fate in bioretention systems, Li and Davis [53] suggested that preventing dissolved organic nitrogen (DON) leaching and creating denitrification conditions for NO3-N are both critical for effective nitrogen removal. More investigation is needed to confirm the reason for elevated nutrients and to find solutions that improve performance of rain gardens in the southwest/west.

3.5. Media Filter

3.5.1. Definition

A stormwater media filter (MF) system captures and temporarily stores stormwater, passing it through a filter bed of sand, organic matter, soil or other media. Filtered runoff can be collected and returned to the conveyance system or allowed to partially exfiltrate into the soil. Filtering generally is adopted only to provide pollutant removal, although in exfiltration designs, some ground water recharge can be provided. Sand filters are widely used and can be applied in most regions and on most sites [35].

3.5.2. Benefits/Effectiveness

Six sites in California (three in Los Angles, three in San Diego) implemented sand filters. The annual rainfall depth of the two locations during the study year was 25.4 mm and 33.0–48.3 mm, respectively. Watershed areas ranged from 0.3 to 1.1 ha, with impervious cover percentages of 56% to 100%. Five sites used an Austin-style sand filter and one a Delaware sand filter. The major design difference between the two is that Delaware maintains a permanent pool in the sedimentation chamber while Austin does not require one. Thus, slight variations in performance were observed as shown in Table 7. The TSS and stormwater pollutant removals were generally effective except for nutrients, particularly NO3-N. Concentration reductions were: TSS (81%−90%), TKN (53%), P (39%–44%), Tot. Cu (50%–66%), Tot. Zn (80%–92%), Tot. Pb (87%), Dis. Pb (40%), and Dis. Zn (61%–94%), as shown in Table 7.
Table 7. Pollutant concentration reduction of sand filters**.
ConstituentsAustin Sand FilterDelaware Sand Filter
Average Influent EMC *Average Effluent EMCConc. Reduction Rate (%)Average Influent EMCAverage Effluent EMCConc. Reduction Rate (%)
TSS (mg/L)88.08.690102.019.081
TN (mg/L)3.82.6322.32.19
NO3-N (mg/L)0.71.1−670.40.8−142
TKN (mg/L)3.11.5531.91.236
TP (mg/L)0.40.3390.40.244
Ortho-P (mg/L)0.20.1240.10.111
Tot. Cu (µg/L)21.010.05021.07.066
Tot. Pb (µg/L)20.03.08715.02.085
Tot. Zn (µg/L)236.047.080429.033.092
Dis. Cu (µg/L)9.08.077.04.040
Dis. Pb (µg/L)2.01.0402.01.031
Dis. Zn (µg/L)94.036.061215.012.094
Note: * EMC = Event Mean Concentration. ** Data summary was based on reference [39].

3.5.3. Cost Analysis

The construction cost of the sand filters ranged from $230,145 to $314,346, with an average of $242,799, and normalized unit construction costs ranged from $746 to $2118/WQV. The annual operation and maintenance cost was $2910 [39].

3.5.4. Summary and Future Development Trends

Sand filters are effective for pollutant removal except nitrates, which appear to be exported from filtering systems. Effective reductions were observed for TSS (81%–90%); and total and dissolved metals such as Tot. Cu (50%–66%), Tot. Zn (80%–92%), Tot. Pb (87%), Dis. Pb (40%), and Dis. Zn (61%–94%). The sand filter also indicated potential to remove Ortho-P and TP. NO3-N showed greater concentrations in the effluent which is consistent with reported performance in the International Stormwater BMP Database [54]. Compared to mean influent concentrations, however, effluent concentrations for TN and TKN were reduced by 32% and 53%, respectively.
The export of nitrates from filters, which can be attributed to mineralization of organic nitrogen in the filter bed, has been reported by previous studies [35]. Schueler and Holland [55] also indicated that composition of filter media and hydrologic design of the system are the primary factors that can affect N removal. They also suggested that designing an anaerobic zone in the bottom of a filter bed may promote denitrification and potentially increase nitrate removal, which needs further investigation. Researchers found the design of an internal water storage layer (IWS) is effective in promoting denitrifying conditions in the other stormwater filtering system—rain gardens [56]. Future research could also test this IWS design in media filter systems, especially to solve the nitrate problem in nutrient-sensitive regions.

3.6. Porous Pavement

3.6.1. Definition and Applicability

Porous pavement (PP) encompasses a variety of media—from porous concrete and asphalt to plastic grid systems and permeable interlocking concrete pavement. Permeable and porous pavements reduce stormwater runoff by allowing water to soak through the paved surface into the ground below. They reduce runoff volumes at a considerably lower cost than traditional storm drain systems [35].
Porous asphalt can be used by municipal stormwater management programs and private development. The runoff volume and rate control, plus pollutant reductions, allow municipalities to improve the quality of stormwater discharges through use of porous asphalt to reduce combined sewer overflows by infiltrating and treating stormwater on-site. Private development projects use porous asphalt to meet post-construction stormwater quantity and quality requirements.

3.6.2. Benefits/Effectiveness

Three types of porous pavements, permeable interlocking concrete pavement, porous asphalt pavement, and pervious concrete, were implemented in the Denver, Colorado metropolitan area. Watersheds range from 0.05 to 0.08 ha and consist of pavement and concrete walkways. Impervious area percentages range from 67% to 100%. When comparing measured flow at the reference site to the BMP site, flow volume reduction was 33% for permeable interlocking concrete pavement and 38% for pervious concrete pavement. Flow reduction was not available for the porous asphalt pavement site due to measurement problems. Significant constituent reductions were observed for Tot. Zn, COD, TKN, and TSS in permeable interlocking concrete pavement site; NO3 + NO2 and Tot. Se in porous asphalt site; and TSS, TP, TKN, COD and Cu in pervious concrete site.

3.6.3. Cost Analysis

No information documenting costs were found in the references.

3.7. Vegetated Swale, Buffer, and Strip

3.7.1. Definition and Applicability

Vegetated swale (also known as grassed channel, biofilter or bioswale) refers to a vegetated, open-channel management practice designed specifically to treat and attenuate stormwater runoff for a specified water quality volume [35]. As stormwater runoff flows along these channels, it is treated by vegetation slowing the water to allow sedimentation, filtering through a subsoil matrix or infiltration into underlying soils. Specific design features and methods of treatment differ in each design, but all are improvements over traditional drainage ditches. They incorporate modified geometry and other features that use the swale as a treatment and conveyance practice.
Swales are well-suited for treating highway or residential road runoff because they are linear [35]. Swales are also useful as one in a series of stormwater BMPs or as part of a treatment train such as conveying water to a detention pond or receiving water from filter strips. Grassed swales can be applied in most regions of the United States. However, their value in arid and semi-arid climates must be weighed against the amount of water needed to irrigate them.

3.7.2. Benefits/Effectiveness

Six bioswale sites in the Los Angeles and San Diego areas were evaluated for stormwater management benefits by the California Department of Transportation [39]. Bioinfiltration swales were used to manage water quality of highway runoff. Contributing watershed areas ranged from 0.08 to 0.96 ha with impervious cover above 90%. High removals for metals were observed, but reductions in other constituents generally were not significant (Table 8). For P, effluent frequently had higher concentrations than influent, which could be attributed to leaching from plants.
Table 8. Concentration reduction of swale sites ****.
ConstituentsAverage Influent EMC *Average Effluent EMCConc. Reduction Rate (%) **Load Reduction Rate (%) **
TSS (mg/L)94474976
TN (mg/L)4.643.243067
NO3-N (mg/L)1.220.892765
TKN (mg/L)3.432.363167
TP (mg/L)0.260.53−1061
Ortho-P (mg/L)0.130.4−218−52
Tot. Cu (µg/L)0.0490.0196382
Tot. Pb (µg/L)0.0990.0316885
Tot. Zn (µg/L)0.3490.0797789
Particulate Cu (µg/L)0.0240.0124976
Particulate Pb (µg/L)0.0180.0075780
Particulate Zn (µg/L)0.170.0457487
Fecal Coli. (MPN ***/100 mL)12,300 16,000 −30NA
Note: * EMC = Event Mean Concentration. ** The concentration reduction was computed based on average mean EMC during the study period. Load reduction was computed based on total estimated wet season influent and effluent runoff volumes for all sites and reported concentrations in the table. *** MPN: most portable number. **** Data summary was based on reference [39].
A two-year water quality monitoring project evaluated the effectiveness of removing stormwater containments using roadside vegetated buffers [57]. Eight locations that represented the range of climate, vegetation coverage, and other regional factors that might impact pollutant removal by roadside vegetated buffer strips were selected across California. Soil type ranged from hydrologic group B to D; width of strip ranged from 1 to 13 m; and slope ranged from 5% to 52%. The quantity and quality of the runoff discharged from the buffer strip was compared to freeway runoff collected at the pavement edge. Buffer strips consistently reduced concentration of TSS and total metals, but were less effective in removing dissolved metals; no reduction was observed for N and P. To achieve effective reduction of constituents, a 5-meter wide strip was needed for sites with greater than 80% vegetation coverage and less than 35% slope. Vegetation species and height were similar at most sites and had no observed effect on performance, which is consistent with Yuan et al. [58].
The reduction in pollutant mass transported to receiving waters was greater than reduction in concentration because of runoff lost to infiltration. The load reduction at each site was calculated from the pavement edge concentration, discharge concentration and runoff coefficient at the minimum buffer widths, as shown in Table 9.

3.7.3. Cost Analysis

Caltrans [39] provided cost analysis for the biofiltration swale and strips: average construction costs are $57,818 and $63,037, respectively, and average unit costs are $752 and $748/WQV, respectively. Operation and maintenance are approximately $2750 for both.

3.7.4. Summary and Future Development Trends

USEPA [35] suggested that grassed swales effectively reduce TSS by 81%, show moderate reductions of TP by 29% and NO3-N by 38%, and metal removal efficiencies ranging from 14% to 55%. In this study, swales showed high reductions of TSS, nitrogen and metals, while TP and Ortho-P showed greater concentrations in effluent as well as in export of bacteria.
Table 9. Load reduction percentage of vegetated buffers (at minimum effective width) **.
Site LocationLoad Reduction Percentage (%)
TSSCuPbZn
Redding97768490
Sacramento85838787
Camp Pendleton77888392
San Rafael96989897
Cottonwood96959597
Irvine97989999
Yorba Linda94969598
Moreno Valley−450 *46−6368
Note: * −450% is greatly out beyond the range of other cases and was thus excluded from the final analysis. ** Data summary was based on reference [39].

3.8. Green Roof

3.8.1. Definition and Applicability

A green roof is a building rooftop partially or completely covered with vegetation, over high quality waterproof membranes, to compensate for the vegetation removed when the building was constructed [59]. It can be used to reduce stormwater runoff from commercial, industrial, and residential buildings and it also helps mitigate the urban “heat island” effect. Green roofs are applicable in all parts of the country. In climates with extreme temperatures, they provide additional building insulation, making them more financially justifiable [35]. On the other hand, they may create problems in arid/semi-arid climates because of their need for irrigation.

3.8.2. Effectiveness

The green roof installed at EPA’s Region 8 Office in Denver, CO retained more than 80% of the rainfall it received [60]. Another green roof in Denver on top of a parking structure which has 45% impervious cover in the 0.2 ha contributing area indicated a three-year average efficacy of 68.7% (Table 10).
Table 10. Three-year runoff reduction rate of a green roof *.
YearAverage Runoff Volume Reduction Rate (%)
201156
201282
201368
3-Year Average 68.7
Note: * Data was based on experiment.

3.8.3. Cost Analysis

Costs of green roofs are associated with size and type: shallow (extensive) roof systems often cost less than deeper (intensive) ones; the cost per square foot also is typically lower for larger green roofs. Square foot costs for ten case studies in Design Guidelines and Maintenance Manual for Green Roofs in the Semi-Arid and Arid West [61] ranged from $13 to $58, with the average close to $30; case studies included both extensive and intensive roofs. These costs could decrease in the future because of incentives provided at the municipal level.

3.8.4. Summary and Future Development Trends

Since conventional roofing can be a source of numerous toxic pollutants, green roofs increasingly are used to manage stormwater. Average rainfall retention by green roofs varies between 40% and 83% in the U.S., depending on depth of roof soil layers [51,52]; the performance has been shown to decrease with increasing rainfall amounts. Green roofs also have shown potential in reducing pollutants such as nitrogen and phosphorous due to soil microbial processes and plant uptake. Current studies presented conflicting results for nutrient removal, particularly nitrogen. Very few have quantified removal of nutrients and other stormwater pollutants from green roof systems [51,61].
Beside stormwater management benefits, green roofs help reduce energy for building cooling and mitigate effects of the urban heat island by sequestering greenhouse gas emissions. They also extend the roof’s lifetime: conventional roofs typically require replacement every 10–20 years, while green roofs only every 40–50 years. In dense, urban settings, green roofs also provide valuable recreational space and can reduce stormwater management costs by reducing or eliminating the need for stormwater vaults or ponds. EPA’s Region 8 Office, for example, reduced the cost of the below-ground stormwater detention vault from about $363,800 to $150,000 [60].

3.9. Infiltration Basin/Trench

3.9.1. Definition and Applicability

An infiltration basin/trench (or infiltration galley) is a rock-filled trench with no outlet that receives stormwater runoff and is designed to infiltrate stormwater into the soil. Stormwater runoff passes through a combination of pretreatment measures such as a swale and detention basin and into the trench where runoff is stored in the void between the stones and then infiltrates through the bottom into the soil matrix [35]. Infiltration basins can be utilized in most regions, although their use at a site is often restricted by concerns over ground water contamination, soils, and clogging. In regions with karst topography, these stormwater management practices may not be suitable due to increased potential for sinkhole formation and ground water contamination.

3.9.2. Effectiveness

Infiltration basins are believed to have a high pollutant removal efficiency and can also help recharge the ground water, increasing baseflow to stream systems. They can be challenging to apply on many sites, however, because of their soil requirements. Studies have also shown relatively high failure rates compared to other management practices [35].
Two infiltration basins were implemented near highways in California to collect runoff from the highway (San Diego area) and from a maintenance station (Los Angeles area). Core samples at varying depths were analyzed to determine the rate at which constituents were transported to the subsurface; data were collected for zinc, lead, copper, and total petroleum hydrocarbons. Although few differences were shown at different depths, the pilot study was not of sufficient duration to fully discover the potential of pollutants to be transported within the site’s soil, and further investigations are needed.

3.10. Integrated LID Practices

3.10.1. Integrated LID

Figueroa et al. (personal communication) evaluated the effectiveness of three integrated structural BMP systems in removing nutrients and sediment metals from urban runoff. The 5.4 ha site is located near San Clemente Villages, CA, and treats runoff from recreational fields, parking lots, and residential areas. Annual average rainfall is 493 mm. The runoff contains fertilizers, pesticides, and reclaimed water used in landscape maintenance, as well as trash, motor oil, and automotive debris from roads and parking surfaces. The integrated BMP consists of a detention-based stormwater management system, a series of low-capacity vegetated swales and one high-capacity vegetated swale. Sedimentation, vegetative uptake, and flow impoundment were identified as the chief mechanisms preventing pollutant discharge into downstream wetlands, while detention capacity was the most important factor in enabling them.
Load Reduction was estimated based on the fact that only one-third of all storms passed through the system, while two-thirds of the rainfall were retained. Assuming the monitored storms reflect the average number of storms in the region, removal efficiencies for stormwater pollutants are summarized in Table 11.
Table 11. Pollutant removal rates using integrated LIDs **.
BMP TypesConstituentsInfluent Conc.Effluent Conc.Event-Based Conc. Reduction (%)Event-Based Load Reduction (%)
Detention-Based Stormwater Management SystemTN (mg/L)3.3239.479.8
Ortho-P (mg/L)0.40.238.979.6
Al (μg/L)102.730.969.9NA*
Cd (μg/L)7.61.678.5NA
Cu (μg/L)0.90.547.1NA
Pb (μg/L)0.20.175.9NA
Zn (μg/L)4.30.978.3NA
Parking Lot Low-Capacity Swales + WetlandTN (mg/L)2.42.34.268.1
Ortho-P (mg/L)0.30.5−57.647.5
Al (μg/L)260.6152.341.6NA
Cd (μg/L)9.12.275.7NA
Cu (μg/L)2.10.673.7NA
Pb (μg/L)0.40.161.8NA
Zn (μg/L)7.92.272.6NA
High-Capacity SwaleTN (mg/L)3.13.8−22.659.1
Ortho-P (mg/L)1.61.8−17.360.9
Notes: * NA means data are not available. ** Data was based on experiment.
The City of Santa Monica, CA installed a green street project to demonstrate how comprehensively structural BMPs can harvest urban runoff for infiltration, in both dry and wet weather, keeping this single largest source of water pollution out of the Santa Monica Bay [62]. In a highly urbanized residential-commercial city block, four types of BMPs were installed: sub-surface plastic concave infiltration chambers under the parking lane; wider, depressed parkways with climate-appropriate flora and low-volume solar-powered irrigation; gutter-oriented catch basin filters; and pervious concrete parking lanes. The project harvested any dry weather runoff and up to 80% of wet weather runoff. Water quality analyses showed significant removal of heavy metals; mixed results for nutrients; and reduction in bacteria. TSS increased because the influent was relatively clean; however, the runoff picked up fine materials to increase TSS as it filtered through the soil. It is suggested that using depressed and widened parkways with sub-surface infiltration under them is a cost-effective solution for street runoff control.

3.10.2. Cost Analysis

The cost of constructing the swales and stormwater management was approximately $400,000 over the five-year establishment phase.

4. Effectiveness Evaluation and Comparison of LID/GI Practices

4.1. Comparison of Runoff Reduction

Ranges of median runoff/peak flow reduction rates are summarized in Table 12. The green roof and rain garden indicated promising runoff reduction, while porous pavement was less effective. All observations were from Colorado sites, and reported depth of rainfall events averaged around 0.5 inches. More quantitative examinations are needed to comprehensively evaluate the runoff reduction performance of LIDs/GIs in other southwestern/western regions and with different rainfall quantities.
Table 12. Comparison of Runoff Reduction of Different Practices.
PracticesRainwater Harvest Bioretention (Rain Garden)Porous PavementGreen Roof
Median Runoff Volume Reduction *(%)755333–386980
LocationDenver, ColoradoLakewood, ColoradoDenver, ColoradoDenver, ColoradoDenver, Colorado
RainfallNA **Studied rainfall ranged from 0.1 to 2.3 in, for an average of 0.5 inNAStudied rainfall ranged from 0.1 to 1.9 in, for an average of 0.5 inNA
Note: * Mean values used if median not available. ** NA = not available.

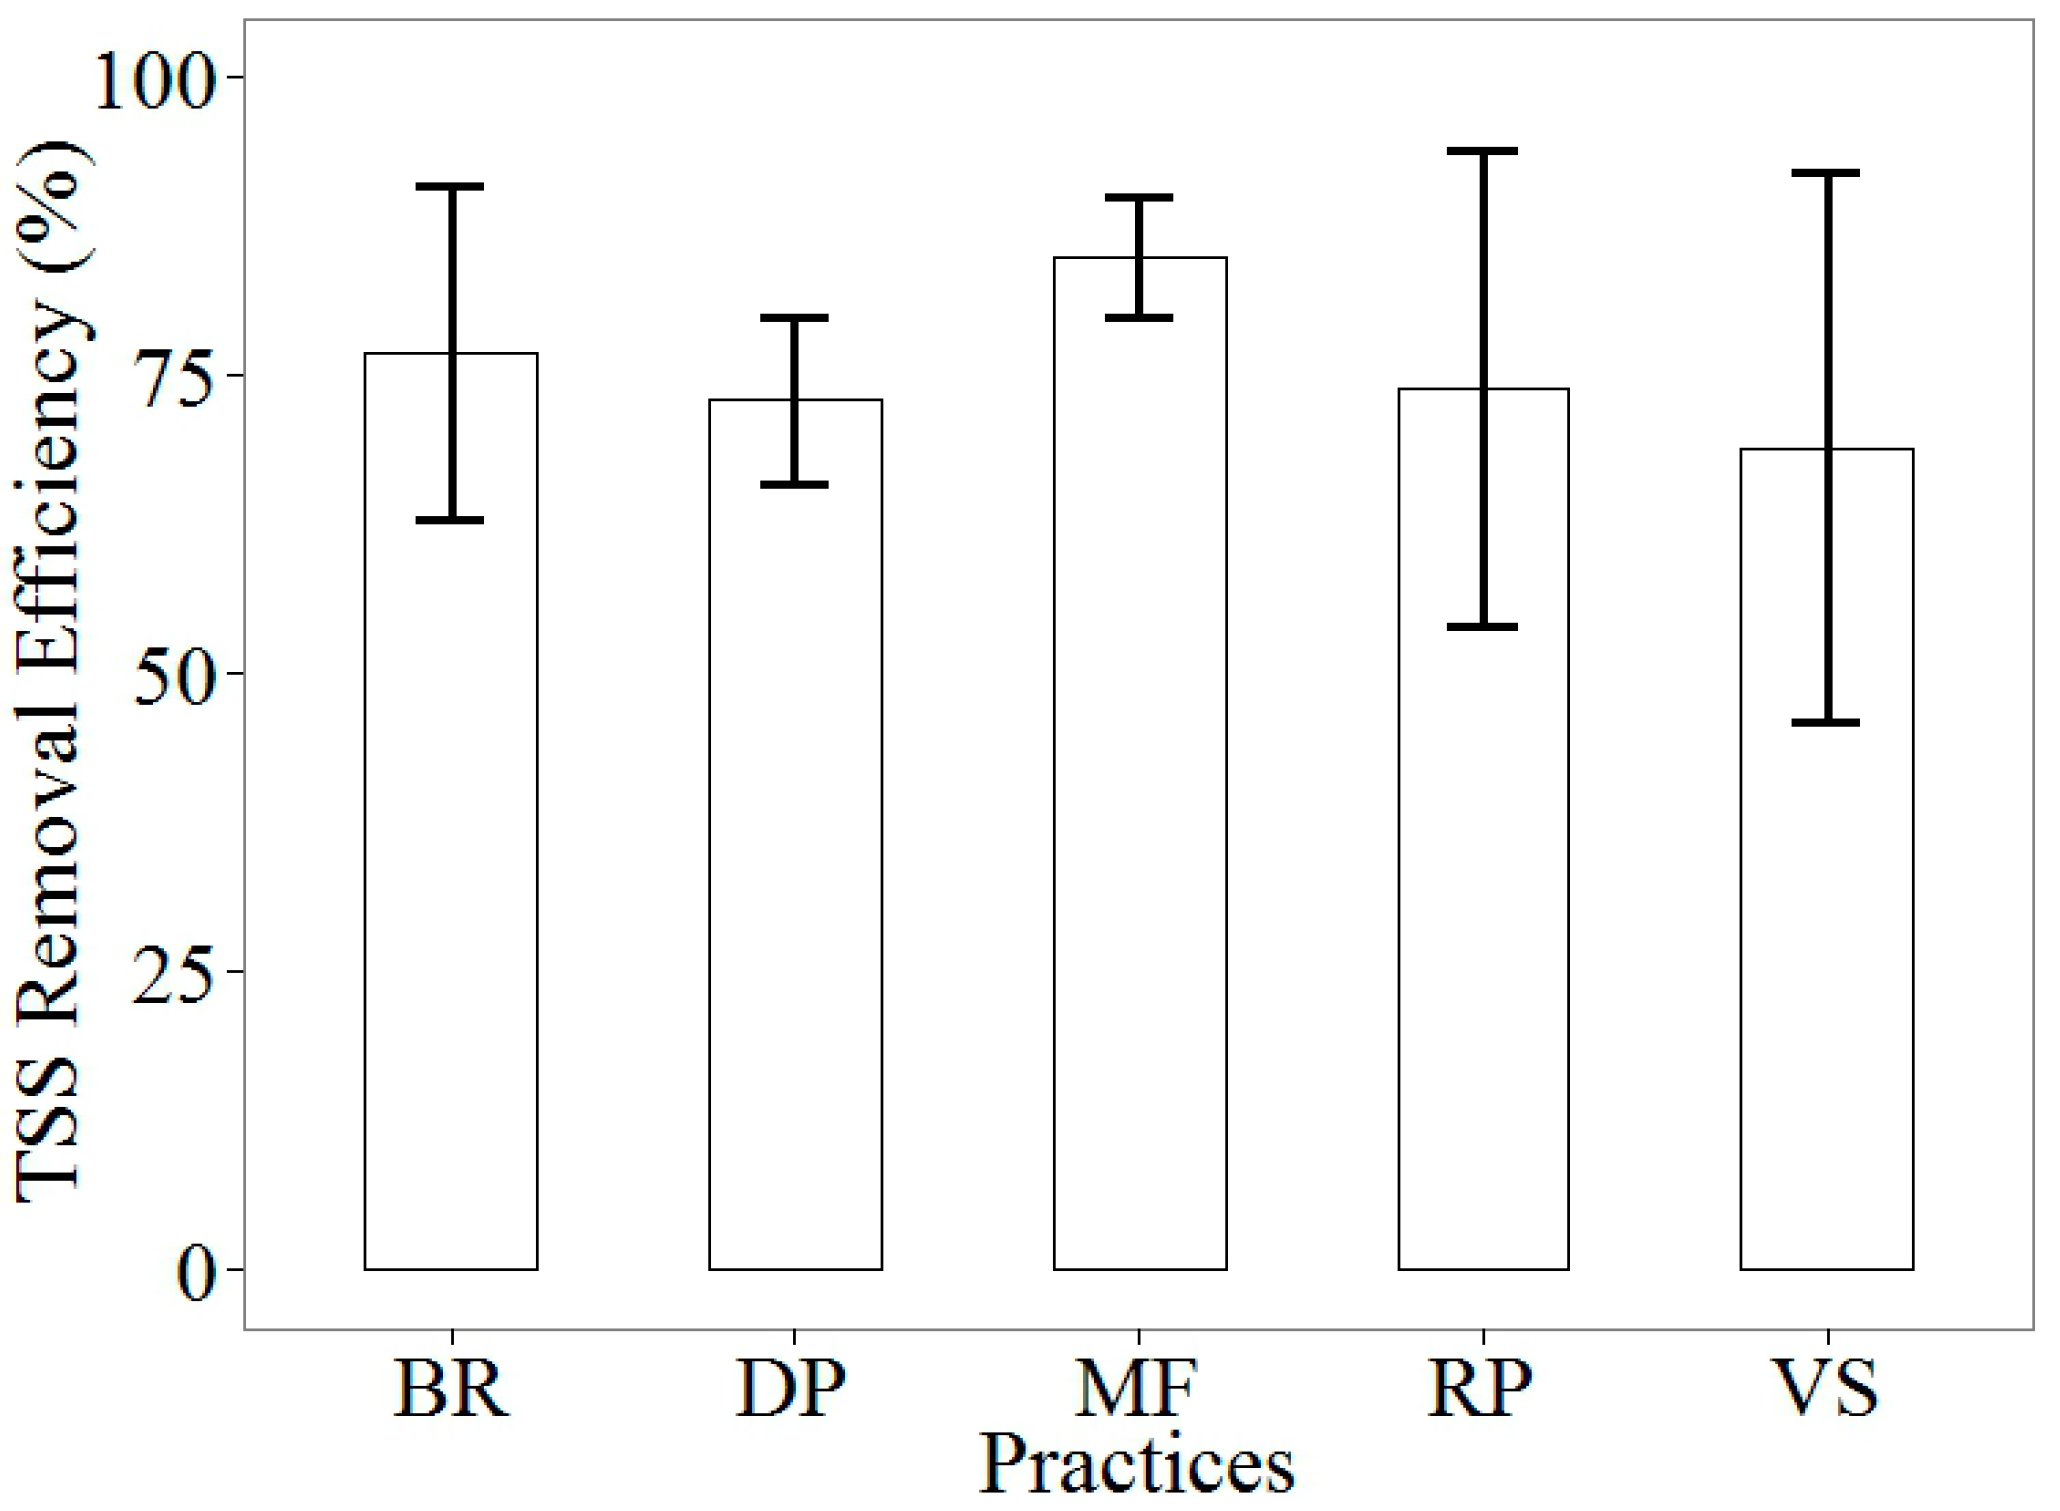
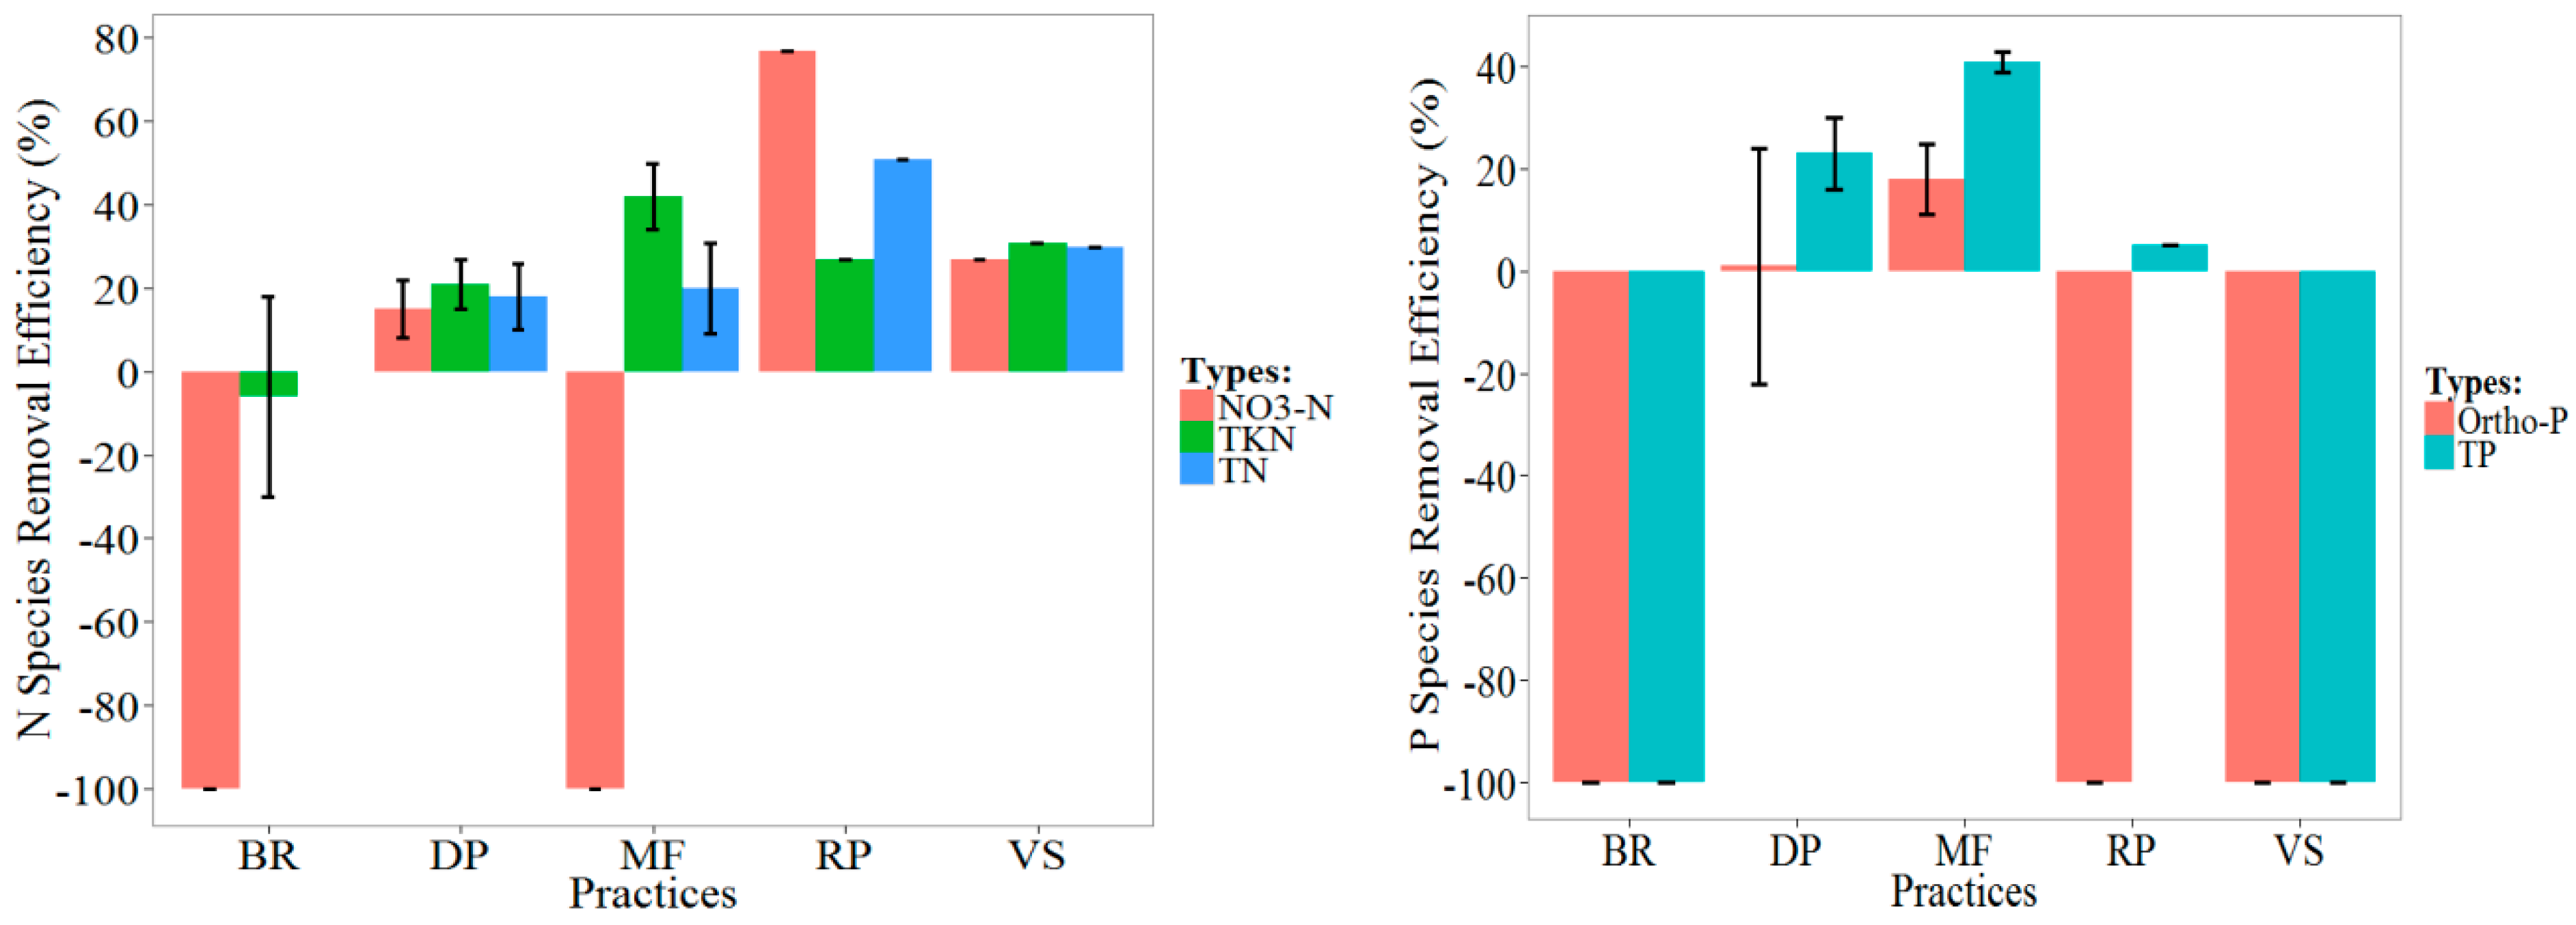
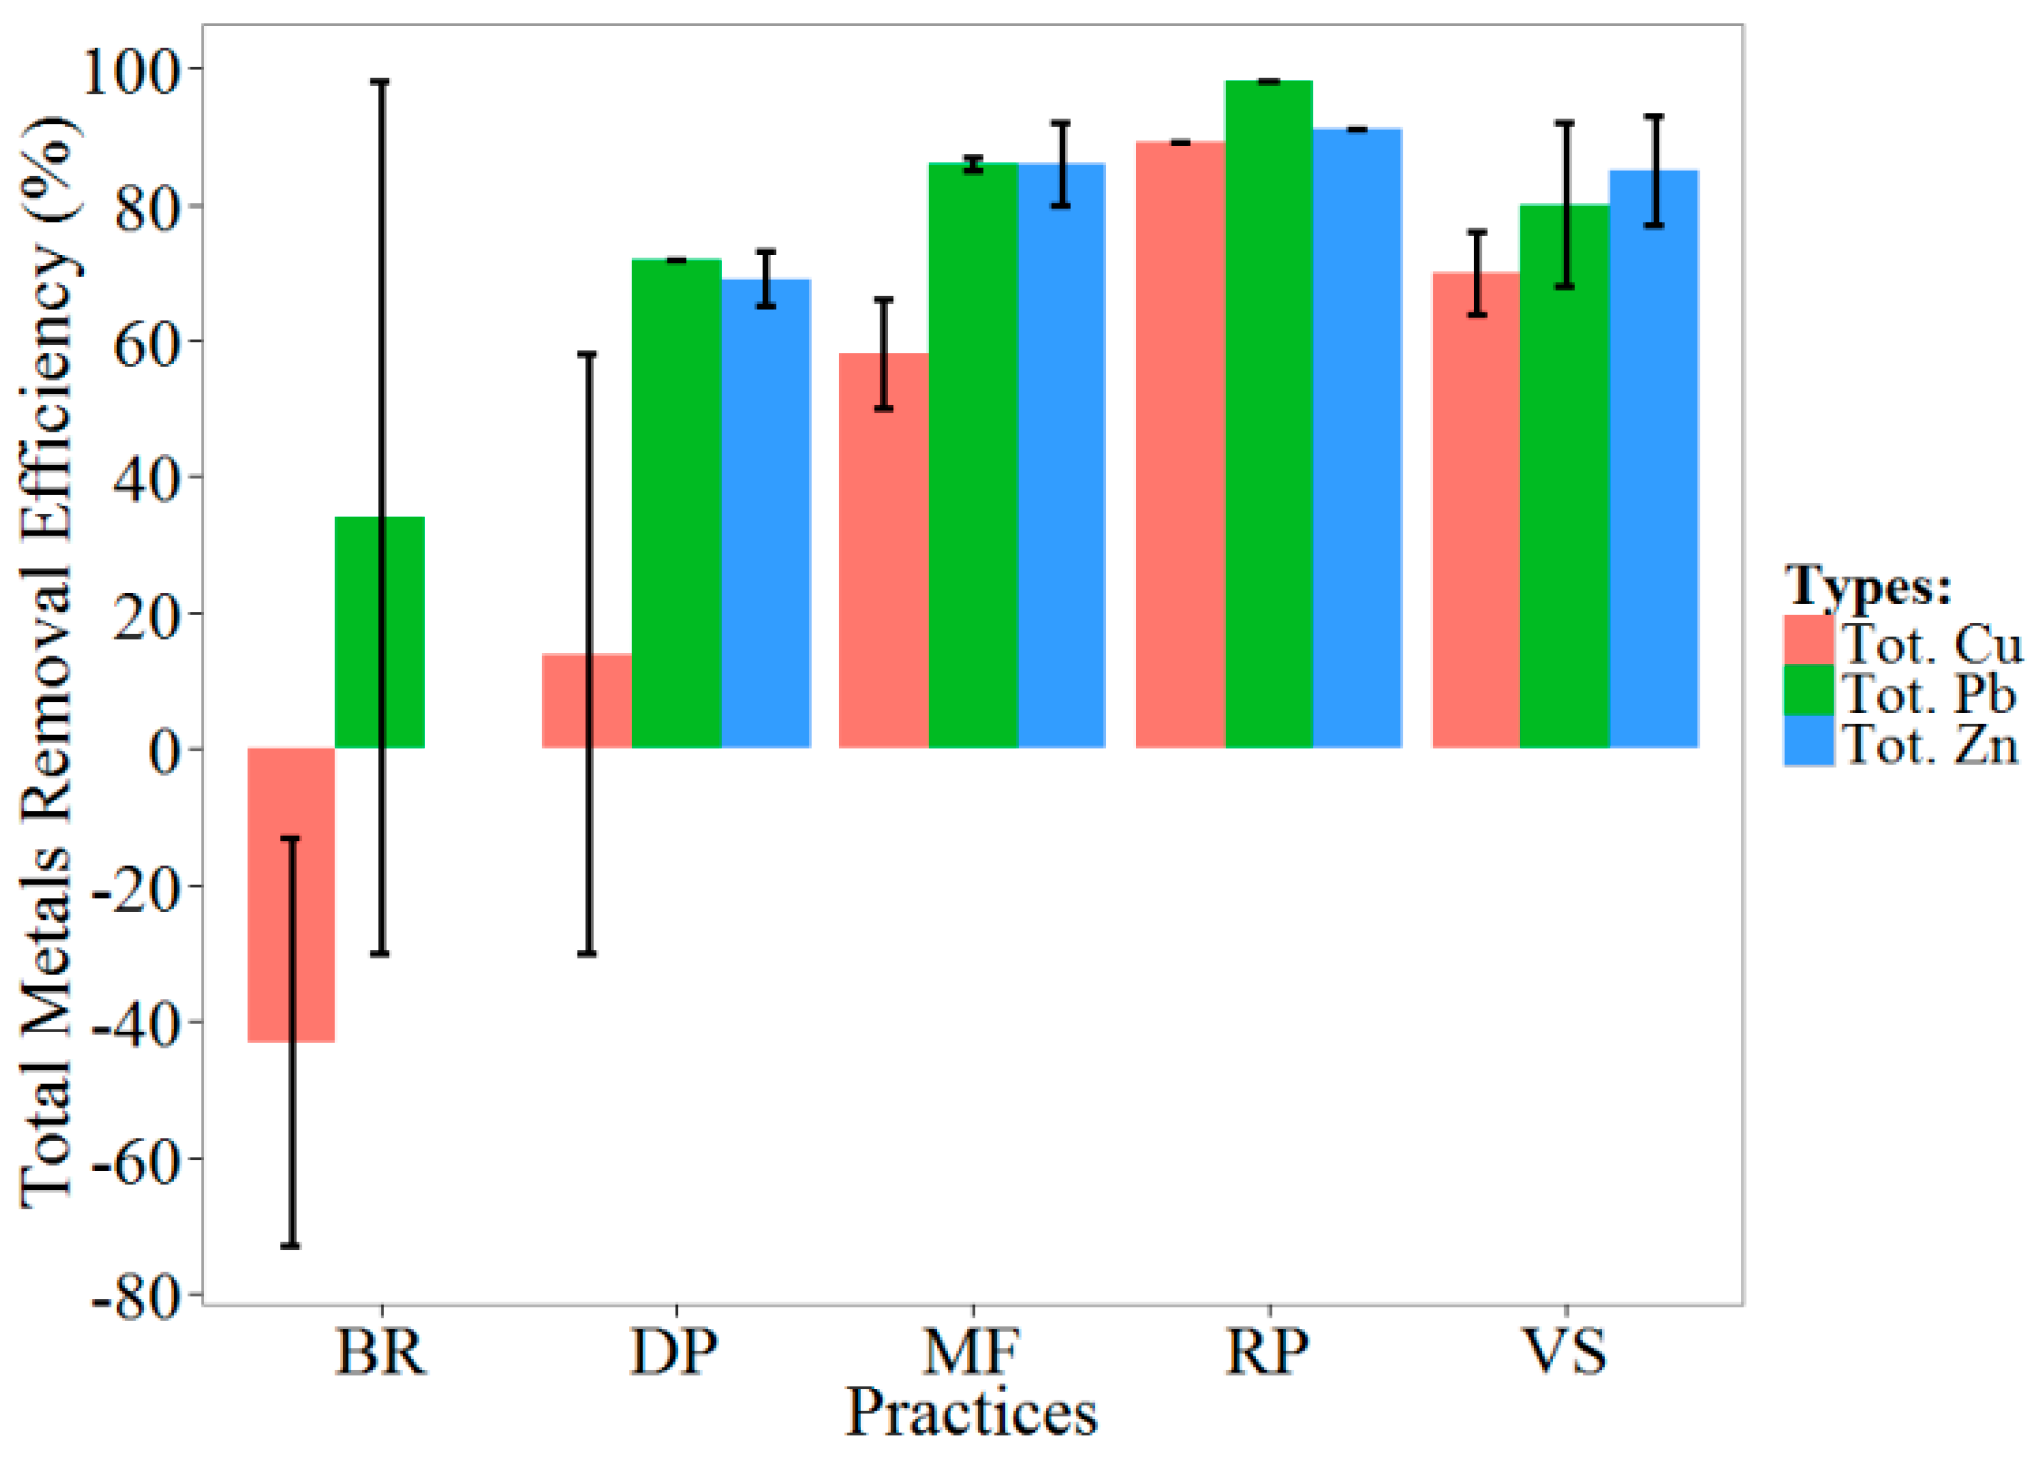
4.2. Comparison of Water Quality Constituents Removal

Performance data on removing water quality pollutants were available for five practices; ranges of average removal rates are summarized in Table 13. All five were very effective in TSS reduction, with removal rates generally above 50% (shown in Figure 1). The Media Filter had the highest TSS removal rate at 81%–90%.
Table 13. Summary of average pollutant removal rates in reviewed studies.
ConstituentsDetention (Dry) PondRetention (Wet) PondBioretention (Rain Garden)Media Filter (Sand Filter)Vegetated Swale/Buffer/Strip
TSS 66 to 8054 to 9463–9181 to 9046 to 92
TN 10 to 2651 9 to 3230
NO3-N8 to 2277−128 to −559−67 to −14227
TKN15 to 2727−31 to 1836 to 5331
TP 16 to 295−494 to 7639 to 44−106
Ortho-P −22 to 25−266−269 to −9911 to 24−218
Diss. P −358 to −196
Tot. sol. P −350 to −317
Tot. Cu −29 to 5889−73 to −1250 to 6663 to 76
Tot. Pb7298−30 to 9885 to 87 68 to 92
Tot. Zn65 to7391 80 to 9277 to 94
Diss. Cu26 to 3957 7 to 40
Diss. Pb 2976 31 to 40
Diss. Zn16 to 3341 61 to 94
Particulate Cu 49
Particulate Pb 57
Particulate Zn 74
Tot. As −112 to −100
Tot. Be −100 to −33
Tot. Cd −107 to −100
Tot. Cr 32 to 100
Tot. Sb 26 to 32
Tot. Se −100 to −68
Figure 1. Comparison of TSS Removal Efficiency by Different Practices (Abbreviation of Practices: BR: bioretention, DP: dry pond, MF: media filter, RP: retention pond, VS: vegetation swale and buffer).
Environments 02 00221 g001
For nitrogen species (NO3-N, TKN, and TN), dry ponds and vegetation swale and buffers showed moderate removal (see Figure 2); in comparison, retention ponds performed best, especially in their capacity to control NO3-N. Bioretention and media filters both indicated significant export of NO3-N which should be used with caution in nitrogen-sensitive regions. For phosphorous species (Ortho-P and TP), almost all practices showed either low removal or export problems; only media filters showed moderate TP removal (39%–44%) and Ortho-P (11%–24%).
For metal species Cu, Pb, Zn (total, dissolved, particulate), moderate-to-high removals were observed for all practices except bioretention (rain garden). Since it is possible that nutrients in the rain garden media material were washed off by runoff during storms, more investigation is needed to evaluate its effectiveness in reducing metal species.
Figure 2. Comparison of Removal Efficiency of N and P Species by Different Practices (Abbreviations are the same as Figure 1. Since the removal rate can be exaggerated by a small denominator, especially for pollutant export phenomena when the rate drops below −100%, the rate would be rounded to −100% to indicate significant export).
Environments 02 00221 g002
Figure 3. Comparison of Removal Efficiency of Total Metals by Different Practices (Abbreviations are the same as Figure 1).
Environments 02 00221 g003

5. Conclusions and Recommendations

The effectiveness of each practice is summarized and compared in Table 12. Retention ponds are not recommended due to their relatively high maintenance costs and need for water. Rainwater harvest systems, detention ponds, media filters, and vegetation swale/buffers are generally recommended, but many should be implemented with caution because of nutrient export problems. More research is needed on metal leaching in bioretention (rain garden) systems. Green roofs were shown to be both economical and effective in reducing runoff, especially considering the cost of land; irrigation needs might limit its use where water is scarce, however. Due to the limited number of studies we reviewed, more research on LID/GI application in arid/semi-arid areas is needed.
Table 14. Cost-effectiveness analysis and recommendations for practices.
PracticesEffectivenessDesignCosts
Rainwater Harvest SystemEffective for reducing runoff, controlling water pollutants, and saving municipal waterRecommendNeighborhood-scale is more cost effective than single-family, which can pay off the construction cost in less than a year
Detention PondEffective for reducing runoff, TSS, particulate/total metals; moderate/low attenuation of nitrogen and phosphorous species; elevates the Ortho-PRecommendNormalized construction costs range from $303 to $1307/m3 WQV; annual operation and maintenance cost is around $3120.
Retention PondEffective for reducing runoff and most stormwater pollutants, except Ortho-PGenerally not recommended because evaporation rates are too high to maintain Normalized construction costs are $1731/m3 (WQV); annual operation and maintenance costs are $16,980
BioretentionEffective for reducing runoff and some metals; seemed problematic with phosphorous species and NO3-N, but need more investigation to confirmNeed more research investigation on potential design modificationsConstruction cost of the rain garden project was $100,433 for a watershed of 1.38 ha with composite impervious area of 60.3%
Media FilterHighly effective for reducing runoff and metals except Ortho-PRecommendNormalized construction costs range from $746 to $2118/WQV; annual operation and maintenance cost is $2910
Porous PavementModerate reduction of runoff and some stormwater pollutantsMore research needed to determine recommendationNA
Vegetated Swale/BufferEffective for reducing runoff, TSS, and metals; moderate removal of nitrogen species; exports of phosphorous species and bacteriaRecommend with caution due to nutrients leachingConstruction costs range from $748–$752/WQV; annual operation and maintenance costs are $2750
Green RoofEffective in reducing runoff, but little known about effect on water quality pollutantsRecommend, but need more investigationConstruction costs per square foot range from $13 to $58
Integrated LIDsEffective in removing metals, but problematic with TN and Ortho-PRecommend with caution due to nutrientsFor three sites, a total of $400,000 over 5-year establishment
Note: Infiltration basin/trench was not summarized due to lack of performance data.

Acknowledgments

The United States Environmental Protection Agency through its Office of Research and Development funded and managed the research described here. It has been subjected to Agency review and approved for publication. Mention of trade names or commercial products does not constitute endorsement or recommendation for use. The authors are grateful for the valuable comments and suggestions provided by anonymous reviewers.

Author Contributions

Yongping Yuan had the original idea for the study. Yan Jiang performed the review, data analyses and drafted the paper under Yongping Yuan’s guidance. Holly Piza provided data from Colorado. Drafted manuscript has been revised and approved (the final manuscript) by all authors (Yongping Yuan, Yan Jiang and Holly Piza).

Conflicts of Interest

The authors declare no conflict of interest.

References

  1. LaBadie, K. Identifying Barriers to Low Impact Development and Green Infrastructure in the Albuquerque Area; The University of New Mexico: Albuquerque, NM, USA, 2010. [Google Scholar]
  2. Gautam, M.R.; Acharya, K.; Stone, M. Best management practices for stormwater management in the desert southwest. J. Contemp. Water Res. Educ. 2010, 146, 39–49. [Google Scholar] [CrossRef]
  3. Michalski, G.; Meixner, T.; Fenn, M.; Hernandez, L.; Sirulnik, A.; Allen, E.; Thiemens, M. Tracing atmospheric nitrate deposition in a complex semiarid ecosystem using δ17o. Environ. Sci. Technol. 2004, 38, 2175–2181. [Google Scholar] [CrossRef] [PubMed]
  4. Welter, J.R.; Fisher, S.G.; Grimm, N.B. Nitrogen transport and retention in an arid land watershed: Influence of storm characteristics on terrestrial–aquatic linkages. Biogeochemistry 2005, 76, 421–440. [Google Scholar] [CrossRef]
  5. Meixner, T.; Huth, A.K.; Brooks, P.D.; Conklin, M.H.; Grimm, N.B.; Bales, R.C.; Haas, P.A.; Petti, J.R. Influence of shifting flow paths on nitrogen concentrations during monsoon floods, San Pedro River, Arizona. J. Geophys. Res. 2007, 112. [Google Scholar] [CrossRef]
  6. Polyakov, V.; Nearing, M.; Nichols, M.; Scott, R.; Stone, J.; McClaran, M. Long-term runoff and sediment yields from small semiarid watersheds in Southern Arizona. Water Resour. Res. 2010, 46. [Google Scholar] [CrossRef]
  7. Graf, W.L. Definition of flood plains along arid-region rivers. In Flood Geomorphology; Baker, V.R., Kochel, R.C., Patton, P.C., Eds.; John Wiley & Sons, Inc.: Hoboken, NJ, USA, 1988; pp. 231–242. [Google Scholar]
  8. Lewis, D.B.; Grimm, N.B. Hierarchical regulation of nitrogen export from urban catchments: Interactions of storms and landscapes. Ecol. Appl. 2007, 17, 2347–2364. [Google Scholar] [CrossRef] [PubMed]
  9. Reginato, M.; Piechota, T.C. Nutrient contribution of nonpoint source runoff in the Las Vegas Valley. J. Am. Water Resour. Assoc. 2004, 40, 1537–1552. [Google Scholar] [CrossRef]
  10. Gersberg, R.M.; Daft, D.; Yorkey, D. Temporal pattern of toxicity in runoff from the Tijuana River watershed. Water Res. 2004, 38, 559–568. [Google Scholar] [CrossRef] [PubMed]
  11. Bay, S.; Jones, B.H.; Schiff, K.; Washburn, L. Water quality impacts of stormwater discharges to Santa Monica Bay. Mar. Environ. Res. 2003, 56, 205–223. [Google Scholar] [CrossRef]
  12. Schiff, K.; Bay, S.; Diehl, D. Stormwater toxicity in chollas creek and San Diego Bay, California. Environ. Monit. Assess. 2003, 81, 119–132. [Google Scholar] [CrossRef] [PubMed]
  13. Lee, G.F.; Taylor, S. Results of Aquatic Toxicity Testing Conducted during 1997–2000 in the Upper Newport Bay, Orange County, CA, Watershed; Report of G. Fred Lee & Associates: El Macero, CA, USA, 2003. [Google Scholar]
  14. Lee, G.F.; Taylor, S.; Neiter, D. Review of Existing Water Quality Characteristics of Upper Newport Bay, Orange County, California, and Its Watershed and Results of Aquatic Life Toxicity Studies Conducted during 1997–98 in the Upper Newport Bay Watershed; Prepared for California State Water Resources Control Board, Santa Ana Regional Water Quality Control Board, and Orange County Public Facilities and Resources Department; Lee and Associates: Madero, CA, USA, 1999. [Google Scholar]
  15. Middle Rio Grande-Albuquerque Reach Watershed Group (MRGARWG). Middle Rio Grande-Albuquerque Reach Watershed Action Strategy (WRAS). Available online: https://www.env.nm.gov/swqb/documents/swqbdocs/WPS/WRAS/MiddleRioGrandeWRAS12-2008.pdf (accessed on 1 May 2015).
  16. Sanders, E.C.; Yuan, Y.; Pitchford, A. Fecal coliform and E. Coli concentrations in effluent-dominated streams of the upper Santa Cruz watershed. Water 2013, 5, 243–261. [Google Scholar] [CrossRef]
  17. Berling-Wolff, S.; Wu, J. Modeling urban landscape dynamics: A case study in Phoenix, USA. Urban Ecosyst. 2004, 7, 215–240. [Google Scholar] [CrossRef]
  18. Wu, J.; Jenerette, G.D.; Buyantuyev, A.; Redman, C.L. Quantifying spatiotemporal patterns of urbanization: The case of the two fastest growing metropolitan regions in the United States. Ecol. Complex. 2011, 8, 1–8. [Google Scholar] [CrossRef]
  19. Houdeshel, C.D.; Pomeroy, C.A.; Hultine, K.R. Bioretention design for xeric climates based on ecological principles1. JAWRA J. Am. Water Resour. Assoc. 2012, 48, 1178–1190. [Google Scholar] [CrossRef]
  20. Diffenbaugh, N.S.; Giorgi, F.; Pal, J.S. Climate change hotspots in the United States. Geophys. Res. Lett. 2008, 35. [Google Scholar] [CrossRef]
  21. Arriaga-Ramírez, S.; Cavazos, T. Regional trends of daily precipitation indices in northwest Mexico and southwest United States. J. Geophys. Res. Atmos. (1984–2012) 2010, 115. [Google Scholar] [CrossRef]
  22. Dominguez, F.; Rivera, E.; Lettenmaier, D.; Castro, C. Changes in winter precipitation extremes for the western United States under a warmer climate as simulated by regional climate models. Geophys. Res. Lett. 2012, 39. [Google Scholar] [CrossRef]
  23. Kim, J. A projection of the effects of the climate change induced by increased CO2 on extreme hydrologic events in the western US. Clim. Chang. 2005, 68, 153–168. [Google Scholar] [CrossRef]
  24. Webb, R.H.; Betancourt, J.L. Climatic Variability and Flood Frequency of the Santa Cruz River, Pima County, Arizona; U.S. Geological Survey (USGS): Reston, VA, USA, 1992.
  25. U.S. EPA. Drinking Water Standards and Health Advisories; U.S. Environmental Protection Agency Report EPA 816-F-09-0004; Office of Water: Washington, DC, USA, 2009.
  26. Norman, L.; Tallent-Halsell, N.; Labiosa, W.; Weber, M.; McCoy, A.; Hirschboeck, K.; Callegary, J.; Van Riper, C., III; Gray, F. Developing an ecosystem services online decision support tool to assess the impacts of climate change and urban growth in the Santa Cruz watershed; where we live, work, and play. Sustainability 2010, 2, 2044–2069. [Google Scholar] [CrossRef]
  27. Phillips, A.A. City of Tucson, Department of Transportation, Stormwater Management Section. In City of Tucson Water Harvesting Guidance Manual; City of Tucson, Department of Transportation, Stormwater Management Section: Tucson, AZ, USA, 2005. [Google Scholar]
  28. Decook, K.J.; Foster, K.E. Systems for rainfall and runoff use, Tucson, Arizona. Water Resour. Bull. 1984, 20, 883–888. [Google Scholar] [CrossRef]
  29. Karpiscak, M.M.; Foster, K.E.; Schmidt, N. Residential water conservation: Casa del agua1. J. Am. Water Resour. Assoc. 1990, 26, 939–948. [Google Scholar] [CrossRef]
  30. Jensen, M.A. Feasibility of Rainwater Harvesting for Urban Water Management in Salt Lake City. Master’s Thesis, University of Utah, Salt Lake City, UT, USA, 2008. [Google Scholar]
  31. Steffen, J.; Jensen, M.; Pomeroy, C.A.; Burian, S.J. Water supply and stormwater management benefits of residential rainwater harvesting in us cities. J. Am. Water Resour. Assoc. 2013, 49, 810–824. [Google Scholar] [CrossRef]
  32. Burian, S.J.; Jones, D. National Assessment of Rainwater Harvesting as A Stormwater Best Management Practice: Challenges, Needs, and Recommendations. Proceedings of the 2010 International Low Impact Development Conference, ASCE, San Francisco, CA, USA, 11–14 April 2010; pp. 842–852. Available online: http://toc.proceedings.com/08291webtoc.pdf (accessed on 1 May 2015).
  33. WERF (Water Environment Research Foundation). BMP and LID Whole Life Cost Models: Version 2.0. 2009. Available online: http://www.werf.org/i/a/Ka/Search/ResearchProfile.aspx?ReportId=SW2R08. (Accessed on 9 May 2014).
  34. Salkin, P.E. Sustainability and land use planning: Greening state and local land use plans and regulations to address climate change challenges and preserve resources for future generations. Wm. Mary Envtl. L. Policy Rev. 2009, 34, 121–170. [Google Scholar]
  35. US EPA (US Environmental Protection Agency). National Menu of Best Management Practices: Factsheet. 2000. Available online: http://www.epa.gov/npdes/stormwater/menuofbmps (accessed on 9 May 2014). [Google Scholar]
  36. Caraco, D. Stormwater strategies for arid and semi-arid watersheds. In The Practice of Watershed Protection; Schueler, T.R., Holland, H.K., Eds.; Center for Watershed Protection: Ellicott City, MA, USA, 2000; Article 66. [Google Scholar]
  37. Piza, H.; Stawski, J.; Eisel, C. Stormwater Quality Monitoring Report: Extended Detention Basin at Grant Ranch, Denver, Colorado 2001–2011. Available online: http://www.udfcd.org/downloads/down_sw_bmp.htm (accessed on 9 May 2014).
  38. Yang, B.; Goodwin, A.A.; Dupont, R.R.; Rycewicz-Borecki, M. Form-based variables for stormwater quality performance: Comparing three bmp types in five us states. Urban Plan. Des. Res. 2014, 2, 14–19. [Google Scholar]
  39. Caltrans. BMP Retrofit Pilot Program—Final Report; Appendix C3; California Department of Transportation, Division of Environmental Analysis: Sacramento, CA, USA, 2004.
  40. Young, G.K.; Stein, S.; Cole, P.; Kammer, T.; Graziano, F.; Bank, F. Evaluation and Management of Highway Runoff Water Quality; FHWA-PD-96-032; Federal Highway Administration: Washington, D.C., USA, 1996.
  41. Schueler, T. Influence of groundwater on performance of stormwater ponds in Florida. Watershed Prot. Tech. 1997, 2, 525–528. [Google Scholar]
  42. Stanley, D.W. Pollutant removal by a stormwater dry detention pond. Water Environ. Res. 1996, 68, 1076–1083. [Google Scholar] [CrossRef]
  43. Barrett, M.E.; Zuber, R.D.; Collins, E.R.; Malina, J.F.; Charbeneau, R.J.; Ward, G.H. A Review and Evaluation of Literature Pertaining to the Quantity and Control of Pollution from Highway Runoff and Construction; Center for Research in Water Resources, Bureau of Engineering Research, the University of Texas at Austin: Austin, TX, USA, 1995. [Google Scholar]
  44. City of Austin. Removal Efficiencies of Stormwater Control Structures; Environmental and Conservation Services Dept.: Austin, TX, USA, 1990.
  45. Hunt, W.; Jarrett, A.; Smith, J.; Sharkey, L. Evaluating bioretention hydrology and nutrient removal at three field sites in north carolina. J. Irrig. Drain. Eng. 2006, 132, 600–608. [Google Scholar] [CrossRef]
  46. Davis, A.P.; Shokouhian, M.; Sharma, H.; Minami, C.; Winogradoff, D. Water quality improvement through bioretention: Lead, copper, and zinc removal. Water Environ. Res. 2003, 75, 73–82. [Google Scholar] [CrossRef] [PubMed]
  47. Davis, A.P. Field performance of bioretention: Water quality. Environ. Eng. Sci. 2007, 24, 1048–1064. [Google Scholar] [CrossRef]
  48. Davis, A.P.; Shokouhian, M.; Sharma, H.; Minami, C. Water quality improvement through bioretention media: Nitrogen and phosphorus removal. Water Environ. Res. 2006, 78, 284–293. [Google Scholar] [CrossRef] [PubMed]
  49. Chapman, C.; Horner, R.R. Performance assessment of a street-drainage bioretention system. Water Environ. Res. 2010, 82, 109–119. [Google Scholar] [CrossRef] [PubMed]
  50. Dietz, M.E.; Clausen, J.C. Saturation to improve pollutant retention in a rain garden. Environ. Sci. Tech. 2006, 40, 1335–1340. [Google Scholar] [CrossRef]
  51. Ahiablame, L.M.; Engel, B.A.; Chaubey, I. Effectiveness of low impact development practices: Literature review and suggestions for future research. Water Air Soil Pollut. 2012, 223, 4253–4273. [Google Scholar] [CrossRef]
  52. Dietz, M.E. Low impact development practices: A review of current research and recommendations for future directions. Water Air Soil Pollut. 2007, 186, 351–363. [Google Scholar] [CrossRef]
  53. Li, H.; Davis, A.P. Water quality improvement through reductions of pollutant loads using bioretention. J. Environ. Eng. 2009, 135, 567–576. [Google Scholar] [CrossRef]
  54. Leisenring, M. J.; Clary, P. Hobson. ternational Stormwater Best Management Practices (BMP) Database Pollutant Category Summary Statistical Addendum: TSS, Bacteria, Nutrients, and Metals; Geosyntec Consultant Inc. and Wright Water Engineers Inc: Boca Raton, FL, USA and Denver, CO, USA, 2012. Available online: http://www.bmpdatabase.org/Docs/2012%20Water%20Quality%20Analysis%20Addendum/BMP%20Database%20Categorical_SummaryAddendumReport_Final.pdf (accessed on 9 May 2014).
  55. Schueler, T.R.; Holland, H.K. The Practice of Watershed Protection; Center for Watershed Protection: Ellicott City, MD, USA, 2000. [Google Scholar]
  56. Brown, R.; Hunt, W. Underdrain configuration to enhance bioretention exfiltration to reduce pollutant loads. J. Environ. Eng. 2011, 137, 1082–1091. [Google Scholar] [CrossRef]
  57. Barrett, M.; Lantin, A.; Austrheim-Smith, S. Storm water pollutant removal in roadside vegetated buffer strips. Trans. Res. Rec. J. Trans. Res. Board 2004, 1890, 129–140. [Google Scholar] [CrossRef]
  58. Yuan, Y.; Bingner, R.L.; Locke, M.A. A review of effectiveness of vegetative buffers on sediment trapping in agricultural areas. Ecohydrology 2009, 2, 321–336. [Google Scholar] [CrossRef]
  59. USEPA. Vegetated Roof Cover; EPA-841-B-00–005D; Office of Water: Philadelphia, PA and Washington, DC, USA, 2000.
  60. Tolderlund, L. Design Guidelines and Maintenance Manual for Green Roofs in the Semi-Arid and Arid West. Available online: http://www2.epa.gov/sites/production/files/documents/GreenRoofsSemiAridAridWest.pdf (accessed on 10 November 2014).
  61. Collins, K.A.; Lawrence, T.J.; Stander, E.K.; Jontos, R.J.; Kaushal, S.S.; Newcomer, T.A.; Grimm, N.B.; Cole Ekberg, M.L. Opportunities and challenges for managing nitrogen in urban stormwater: A review and synthesis. Ecol. Eng. 2010, 36, 1507–1519. [Google Scholar] [CrossRef]
  62. City of Santa Monica, California. Bicknell Avenue Green Street Urban Runoff BMP Treatment Demonstration Project Report. 2010. Available online: http://www.smgov.net/Departments/OSE/Categories/Urban_Runoff/Case_Studies.aspx (accessed on 9 May 2014). [Google Scholar]

