Article

Mercury Accumulation, and the Mercury-PCB-Sex Interaction, in Lake Whitefish (Coregonus clupeaformis)

by
Charles P. Madenjian
1,*,
Mark P. Ebener
2 and
David P. Krabbenhoft
3
1
U.S. Geological Survey, Great Lakes Science Center, 1451 Green Road, Ann Arbor, MI 48105, USA
2
Chippewa Ottawa Resource Authority, Inter-Tribal Fisheries and Assessment Program, 179 West Three Mile Road, Sault Ste. Marie, MI 49783, USA
3
U.S. Geological Survey, Wisconsin Water Science Center, 8505 Research Way, Middleton, WI 53562, USA
*
Author to whom correspondence should be addressed.
Submission received: 3 November 2015 / Revised: 18 February 2016 / Accepted: 29 February 2016 / Published: 9 March 2016
(This article belongs to the Special Issue Ecotoxicology of Freshwater Environments)

Abstract

:
We determined whole-fish Hg concentrations of 26 female and 34 male adult lake whitefish (Coregonus clupeaformis) from northern Lake Huron captured during November 2010. Subsampling from these 60 fish, Hg concentration was also determined in both somatic tissue and ovaries (n = 5), while methylmercury (MeHg) concentration was determined in whole fish (n = 18). Bioenergetics modeling was used to assess the growth dilution effect on the difference in Hg concentrations between the sexes. Mean whole-fish Hg concentration in females (59.9 ng/g) was not significantly different from mean whole-fish Hg concentration in males (54.4 ng/g). MeHg accounted for 91% of the mercury found in the lake whitefish. Bioenergetics modeling results indicated that the growth dilution effect did not contribute to the difference in Hg concentrations between the sexes. We estimated that females increased in Hg concentration by 17.9%, on average, immediately after spawning due to release of eggs. Using polychlorinated biphenyl (PCB) data for the same 60 lake whitefish from a previous study, we detected a significant interaction between sex and contaminant type (Hg or PCBs), which was attributable to males being significantly higher in PCB concentration than females. Males may be eliminating Hg at a faster rate than females.

1. Introduction

Lake whitefish (Coregonus clupeaformis) populations in the upper Great Lakes (i.e., Lakes Superior, Huron, and Michigan) have supported highly valued commercial fisheries [1,2]. Lake whitefish were prized as a food fish by both aboriginal people and early European settlers of the upper Great Lakes region. Some of these settlers described lake whitefish as the “best fish in the world” while also proclaiming that “one could eat if for days and never grow tired of it” [3]. The first commercial fisheries in the upper Great Lakes were focused on lake whitefish due to its excellent quality as a food fish and because spawning aggregations would concentrate in shallow water close to shore where they could be harvested with gill nets and seines by early settlers [2]. Commercial fisheries for lake whitefish in the upper Great Lakes began in the late 1700s and have continued to the present time. Overall, lake whitefish commercial harvest has appeared to be sustainable at moderate, or perhaps even high, levels of exploitation [2]. Lake whitefish have exhibited a remarkable ability to adapt their diet in response to changes in the food web brought about by biological invasions [4,5].
By way of atmospheric emissions and transport, mercury has become a globally dispersed pollutant [6]. Because mercury can biomagnify in food webs, top predators, including humans, tend to exhibit elevated mercury concentrations. Mercury has been ranked as one of the ten chemicals of major public health concern in the world [7]. Mercury contamination is more damaging to the brain of fetal humans than to the brain of adult humans [8,9,10,11]. Mercury can interfere with normal brain development by inhibiting the division and migration of neuronal cells in the brain of a human fetus. In addition, recent research has shown a link between mercury exposure and subclinical autoimmunity among reproductive-age women [12]. Consumption of contaminated fish is the predominant source of mercury exposure to humans and fish-eating wildlife, and consequently mercury contamination in fish is of special concern [9,13]. To develop fish consumption advisories and to assess risk to humans and wildlife consuming contaminated fish, determinations of mercury concentrations in fish are of vital importance [9,14,15,16,17,18].
In Lake Huron, the biogeochemical cycling of mercury is currently dominated by air-water exchange processes [19,20]. Water column concentrations of total mercury (Hg) are relatively low, typically averaging less than 1 ng/L. Moreover, based on analysis of sediment core samples and determinations of Hg concentrations in the surficial sediments, Marvin et al. [21] concluded that the current degree of mercury contamination in Lake Huron sediments does not represent a significant degree of anthropogenic enrichment, because present-day Hg concentrations in the surficial sediments averaged only 0.04 μg/g. In fact, Lake Huron had the lowest sediment Hg concentrations of all five Laurentian Great Lakes. In contrast, Hg concentrations in the water of Clear Lake, a highly contaminated lake in California (USA), ranged from 2 to 8 ng/L, and sediment Hg concentrations in this lake ranged from 0.50 to 83 μg/g [22].
An interesting pattern appears to be emerging with regard to the difference between the ratio of whole-fish Hg concentration in males to whole-fish Hg concentration in females and the ratio of whole-fish polychlorinated biphenyl (PCB) concentration in males to whole-fish PCB concentration in females [23]. Specifically, the ratio of Hg concentrations has been shown to be substantially lower than the ratio of PCB concentrations for a given population of teleost fish. This difference between the ratios is surprising, because both Hg and PCBs are considered reliable tracers of food consumption by fish [24,25]. Given that nearly all of the Hg and PCB body burdens accumulated by fish are from dietary intake, we would have expected that the relative difference in Hg concentrations between the sexes is identical to the relative difference in PCB concentrations between the sexes. In several fish populations, including lake whitefish, PCB concentration in males has been shown to be greater than PCB concentration in females by 15%–45% [26]. For lake whitefish from northern Lake Huron, PCB concentration in males exceeded that in females by 34%, and this difference was statistically significant. The higher PCB concentration in males was attributed to a higher rate of energy expenditure in males, stemming from higher activity and a higher resting metabolic rate (or standard metabolic rate, SMR) in males. Because males expend energy at a higher rate than females, males consume food at a higher rate than females, which, in turn, leads to males accumulating PCBs at a higher rate than females. In lake trout (Salvelinus namaycush) from Lake Ontario, males were 22% greater in PCB concentration but only 8% greater in Hg concentration than females [27]. Male burbot (Lota lota) from Lake Erie and Great Slave Lake were 29% greater in PCB concentration than female burbot, whereas female burbot from these two lakes were 22% greater in Hg concentration than male burbot [23]. This lower value for the ratio of Hg concentration in males to Hg concentration in females compared with the ratio of PCB concentration in males to PCB concentration in females has been attributed to males eliminating Hg from their bodies at a faster rate than females, whereas long-term elimination rates for PCBs are negligible for both sexes. According to this explanation, Hg is ingested at a faster rate by males than by females, but Hg is also eliminated at a faster rate by males than by females. In contrast, PCBs are ingested at a faster rate by males than by females, but PCB long-term elimination rates do not vary meaningfully between the sexes because these rates are negligible for both sexes. Faster Hg-elimination rates in adult male northern pike (Esox lucius) compared with adult female northern pike have been documented using isotopically enriched Hg [28]. To the best of our knowledge, the above-mentioned study on northern pike has been the only study, to date, directly determining the difference in Hg-eliminations rates between the sexes of a fish species.
Total mercury (Hg) concentrations have been determined in the muscle tissue of lake whitefish [29,30], but, to the best of our knowledge, whole-fish Hg concentrations have not been determined for lake whitefish. Thus, differences in whole-fish Hg concentrations between the sexes of lake whitefish have apparently not been examined. Whole-fish contaminant determinations are critical for ensuring a complete and accurate assessment of the difference in contaminant concentrations between the sexes [31]. The difference between the muscle tissue contaminant concentrations between the sexes may accurately reflect the difference in whole-fish contaminant concentrations between the sexes in some cases, but not in others [31]. Whole-fish contaminant determinations are useful in assessing risk to wildlife because wildlife typically consume the entire fish [9,13,16].
Mercury accumulated by fish can either be methylmercury (MeHg) or inorganic mercury. Typically, MeHg is the predominant form found in fish [32], but inorganic mercury can make a substantial contribution to Hg in some cases [33]. When modeling Hg accumulation in fish, all of the Hg found in the fish is often assumed to be MeHg [24].
The overall goal of our study was to characterize Hg accumulation in lake whitefish from northern Lake Huron. We were especially interested in whether the pattern in lake whitefish results would mimic those for lake trout and burbot, for which the ratio of PCB concentration in males to PCB concentration in females was substantially greater than the ratio of Hg concentration in males to Hg concentration in females. If these two ratios were found to differ, we then identified the factor or factors most likely responsible for the difference between these two ratios. The specific objectives were to: (1) estimate the mean whole-fish Hg concentration for Lake Huron lake whitefish; (2) estimate the proportion of MeHg in the Hg found in Lake Huron lake whitefish; (3) quantify the difference in Hg concentrations between the sexes of Lake Huron lake whitefish; (4) use bioenergetics modeling to assess the effect of growth dilution on the observed difference in Hg concentrations between the sexes; (5) compare Hg concentration in somatic tissue with Hg concentration in the ovaries of ripe female lake whitefish; (6) using the results of Madenjian et al. [26], determine whether sex significantly interacted with contaminant type (Hg or PCBs); and (7) discuss the implications of these results for the continued operation of the lake whitefish fisheries in Lake Huron.

2. Materials and Methods

2.1. Field Methods

A commercial trap net was set in waters between 5 and 15 m deep in northern Lake Huron in the vicinity Cedarville, MI during fall 2010. This part of Lake Huron is at the center of the spawning area used by the Detour stock of lake whitefish [34]. The trap net catch was retrieved on 6 November 2010, and 60 lake whitefish were randomly selected from the catch. Spawning by lake whitefish in northern Lake Huron typically peaks in mid-November [34]. For each of the 60 lake whitefish, weight was determined to the nearest 10 g, total length (TL) was measured to the nearest mm, and sex and maturity were determined by visual inspection of the gonads. Then, each lake whitefish was individually bagged with a cardboard tag marked with a unique identification number and then frozen at −20 °C. The frozen lake whitefish were transported to the Great Lakes Science Center (GLSC) in Ann Arbor, MI for further processing. We used the same lake whitefish in our study as those used by Madenjian et al. [26] in their study on PCB concentrations in lake whitefish.

2.2. Mercury Determinations

We selected 5 female lake whitefish, at random, for Hg determinations of both somatic tissue and ovaries. For each of these 5 females, the fish was partially thawed, ovaries were removed and weighed to the nearest 0.1 g, the remainder of the fish (i.e., the somatic tissue) was weighed to the nearest 0.1 g, and otoliths were extracted for aging purposes. Somatic tissue and ovaries were homogenized separately in blenders. Approximately 100 g of the homogenate was transferred to a contaminant-free glass jar, sealed with a lid, and then stored at −20 °C. For the 55 other lake whitefish, each fish was partially thawed, otoliths were removed, and then the whole fish was homogenized in a blender. Again, about 100 g of the homogenate was transferred to a contaminant-free glass jar, sealed with a lid, and then stored at −20 °C. We shipped all of the frozen homogenates to the U.S. Geological Survey (USGS) Mercury Research Laboratory in Middleton, WI for mercury determinations. Otoliths were shipped to the Chippewa Ottawa Resource Authority (CORA) fishery research facility in Sault Ste. Marie, MI, USA, where aging was accomplished via the break-and-burn technique [35].
At the USGS Mercury Research Laboratory, USEPA Method 7473 was followed to determine the Hg concentration in each of the homogenates [36]. After freeze-drying, each of the samples was further homogenized using a stainless steel ball mill. We used a Nippon model MA2000 equipped with a BC1 autosampler (Tokyo, Japan) for all Hg determinations. An aliquot of fish tissue was weighed to the nearest 0.1 mg and then transferred to a ceramic boat along with interference-reducing reagents. In a tube furnace with a copper catalyst at 850 °C, the sample was decomposed, and the resulting gaseous Hg(0) was collected on diatomite particles, and then thermally released and quantified by atomic absorption at 253.7 nm. Based on a 7-point calibration curve, mass of Hg per sample aliquot was derived from sample absorbance. Quality assurance/quality control (QA/QC) protocols were performed throughout the Hg determination process and included analysis of analytical blanks, sample replicates, and standard reference materials (SRMs), as well as laboratory practices to prevent sample contamination. We performed triplicate analyses at a rate of once every 5 samples, and the relative standard deviation (RSD) for the triplicate analyses ranged from 0.8 to 9.8% (mean of 4.0%). With regard to SRM, International Atomic Energy Agency Reference Material 407 (IAEA 407) was used as part of the QA/QC protocols and was included in every set of samples. In total, 30 SRM determinations were made and recovery of the SRM averaged 91.0%, which is well within the range of acceptance (75%–125% recovery) for the USGS Mercury Research Laboratory. Using multiple analyses of a fish homogenate (IAEA 407) and following USEPA protocol [37], a detection limit of 7 ng/g (dry weight basis) was determined.
To determine whether the bulk of the Hg found in the lake whitefish was MeHg, we selected a subset of 18 lake whitefish (10 females and 8 males) whole-fish homogenates for MeHg determinations. An adaptation of USEPA [38] method 1630 was used to determine MeHg concentrations, with the adaptation being use of dilute nitric acid rather than a distillation procedure in the extraction step. Approximately 25–150 mg of freeze-dried and homogenized tissue was weighed to the nearest 0.1 mg from each sample, and then transferred to a Teflon digestion tube and extracted in 10 mL of 5 M HNO3 at 60 °C for 8 h. We used a Brooks Rand model Merx-M automated system (Brooks Rand Instruments, Seattle, WA, USA). To facilitate conversion of MeHg to methylethylmercury (MeEeHg), approximately 150 μL of the sample extract was mixed with an equivalent volume of 4.5 M KOH in a 42-mL glass vial filled with reagent water, and 50 μL of sodium tetraethylborate (NaTEB) was added as a derivatization agent. Using argon gas, the MeEeHg was stripped from the liquid, then retained on Tenex traps, desorbed back into the sample stream, and separated from the inorganic forms of mercury in the sample with a gas chromatography column. The MeEeHg was then reduced into elemental mercury, and then quantified using cold vapor atomic fluorescence spectrophotometry. QA/QC protocols were followed throughout the MeHg determination process. Again, we performed triplicate analyses at a rate of once every 5 samples, and the relative standard deviation (RSD) for the triplicate analyses ranged from 1.8% to 14.1% (mean of 6.0%). Again, IAEA 407 was used as the SRM. In total, 6 SRM determinations were made and recovery of the SRM averaged 106.8%, which is well within the range of acceptance (75%–125% recovery) for the USGS Mercury Research Laboratory. Using multiple analyses of a fish homogenate (IAEA 407) and following USEPA protocol [37], we determined a detection limit for MeHg of 2 ng/g (dry weight basis). All mercury (both Hg and MeHg) concentrations for the lake whitefish homogenates were expressed on a wet weight basis.

2.3. Data Analyses for Hg and MeHg Concentrations

We estimated the whole-fish Hg concentrations of the 5 females selected for somatic tissue and ovary Hg determinations using the procedure outlined by Niimi [39]. Accordingly, body burden in both the somatic tissue and the ovaries was calculated by the product of Hg concentration and tissue weight. These two body burdens were summed to yield the whole-fish body burden, which was then divided by the weight of the entire fish to yield the whole-fish Hg concentration. In addition, expected percent change in whole-fish Hg concentration due to release of eggs at spawning was calculated using the algorithm by Niimi [39]. The ratio of somatic tissue Hg concentration to whole-fish Hg concentration was subtracted from 1, and this difference was then multiplied by 100. The gonadosomatic index (GSI) was calculated for each of the 5 females by dividing the weight of the ovaries by the total weight of the fish and then multiplying by 100.
To test whether sex had a significant effect on Hg concentration, an analysis of covariance (ANCOVA) model was applied to the data set. The dependent variable was Hg concentration, the main effect was sex, and the covariate was age. We substituted the value for the grand mean of age into the fitted ANCOVA model to estimate the ratio of mean Hg concentration of males to mean Hg concentration of females. A key assumption of the ANCOVA was that the slope of the regression line of Hg concentration as a function of age for females was equal to that for males. Thus, an F test for equality of slopes was performed to determine the validity of this assumption. We set α = 0.05 for all of our statistical testing. Even though Hg concentration was positively correlated with TL, weight, and age, Hg concentration showed the strongest correlation with age.
The fraction of Hg as MeHg was calculated by the ratio of MeHg concentration to Hg concentration for each of the 18 lake whitefish used in the MeHg determinations. The mean of these 18 ratios was then calculated. In addition, we calculated mean ratios by sex. To determine whether the fraction of Hg as MeHg varied significantly with age, we used simple linear regression analysis to determine whether the slope of the regression line of ratio of MeHg concentration to Hg concentration as a function of age was significantly different from zero.

2.4. Bioenergetics Modeling

We used bioenergetics modeling to assess the effect of growth dilution on the difference in Hg concentrations between the sexes of lake whitefish; refer to Madenjian [31] for more details on this approach. To briefly summarize, gross growth efficiency (GGE) is defined as the amount of growth by a fish divided by the amount of food consumption needed to achieve that growth. Hg concentration is inversely proportional to GGE. Therefore, if the difference in Hg concentration was entirely due to a difference in GGEs between the sexes, then the ratio of male Hg concentration to female Hg concentration should equal the ratio of female GGE to male GGE. Bioenergetics modeling can be used to quantify the relative difference in GGEs between the sexes that is solely due to a difference in growth rates between the sexes, and this quantification represents the magnitude of the growth dilution effect. In performing this bioenergetics modeling to assess the growth dilution effect, SMR and activity are assumed not to vary between the sexes [31].
Growth trajectories were developed for both female and male lake whitefish, based on our TL, weight, and age data. A von Bertalanffy growth model was fitted to age and TL data for both females and males. We also fitted length-weight regressions for both females and males. Using the fitted von Bertalanffy growth curves, TL at age was estimated for both females and males over ages 7–17. Weight at age for both sexes was estimated by applying the appropriate fitted length-weight regression to length at age. By late fall, age-0 lake whitefish in northern Lake Michigan have been estimated to attain a TL of 150 mm [40], which corresponds with a 30-g fish based on our fitted length-weight regressions. Thus, we assumed that both female and male age-0 lake whitefish weighed 30 g in early November. To complete development of the growth trajectories, we also assumed that lake whitefish weight increased linearly between ages 0 and 7 for both sexes. Diet composition data were insufficient to estimate food consumption by an age-0 lake whitefish from time of hatching in spring to early November via bioenergetics modeling. Thus, GGE was assumed to be equal to 0.125 during this time period because GGE for age-0 bloater, a species closely related to lake whitefish, in Lake Michigan was estimated to be 0.125 by Rudstam et al. [41]. The lake whitefish used in our study were caught on 6 November 2010, and therefore we designated 6 November as the starting day in our bioenergetics model simulations.
We applied the Madenjian et al. [42] modification to the generalized coregonid model developed by Rudstam et al. [41] to the above-mentioned lake whitefish growth trajectories to estimate food consumption by an average female lake whitefish and an average male lake whitefish from the Detour spawning stock in northern Lake Huron. According to the structure of this bioenergetics model, which represents an energy budget for the lake whitefish, energy losses are calculated as functions of water temperature, lake whitefish size, and food consumption, and then an estimate of the amount of food consumption necessary for the lake whitefish to achieve the observed size (weight) at a given age is generated. The lake whitefish’s energy budget can be written as:
C = G + R + Eg + Ex + S
where C = consumption, G = growth, R = respiration, Eg = egestion, Ex = excretion, and S = spawning losses. Respiration was modeled as a function of water temperature and lake whitefish weight. Egestion of fecal matter and excretion of nitrogenous wastes were modeled as functions of food consumption. Spawning was simulated by the lake whitefish losing the appropriate amount of weight on the spawning day. Based on GSI measurements for male lake whitefish from Lake Michigan [43], we assumed that mature males lost 2.1% of their body weight on the spawning day. We assumed that the mature females’ loss of body weight on spawning day was equivalent to the mean GSI for the 5 females from our study. Because GSI of females was not significantly correlated with age, we used the same GSI value for all ages of adult female lake whitefish in our simulations. We designated 15 November as the spawning day in our bioenergetics model simulations [34,43], and we assumed that lake whitefish reached maturity by age 8 [44].
Input data, including the water temperature regime experienced by the lake whitefish, diet composition, and energy densities of both prey and the lake whitefish, for the bioenergetics model simulations were taken from Pothoven and Madenjian [5]. These researchers documented and summarized the changes in diet composition of lake whitefish from northern Lake Huron during 1990–2010. Mysis, Diporeia, dreissenid mussels, chironomids, snails, and Bythotrephes constituted the major invertebrate prey groups for lake whitefish in northern Lake Huron over this time period. Round goby (Neogobius melanostomus), an invasive fish from the Ponto-Caspian region, has represented over 20% of the diet of lake whitefish from northern Lake Huron since 2007 [5].
To calculate cumulative GGE for each sex of lake whitefish, we divided the increase in lake whitefish weight by the cumulative amount of food consumption, as estimated by the bioenergetics modeling, required to attain the observed growth. The ratio of cumulative GGE for females to cumulative GGE for males for each of the lake whitefish ages 0–17 was then calculated. If the difference in Hg concentrations between the sexes were to be fully explained by the growth dilution effect, then the ratio of GGE for females to GGE for males would equal the ratio of Hg concentration in males to Hg concentration in females.

2.5. Comparison of PCBs with Hg

To determine whether contaminant type (Hg or PCBs) significantly interacted with sex, we determined whether the regression line of PCB concentration as a linear function of Hg concentration for females was significantly different from the regression line of PCB concentration as a linear function of Hg concentration for males. To perform this analysis, Hg concentration was paired with PCB concentration for each of the 60 lake whitefish. Data for PCB concentrations were taken from Madenjian et al. [26]. For both females and males, a simple linear regression analysis of PCB concentration as a function of Hg concentration was performed. An F test for equality of regression lines was used to determine whether the two regression lines were significantly different from one another.

3. Results

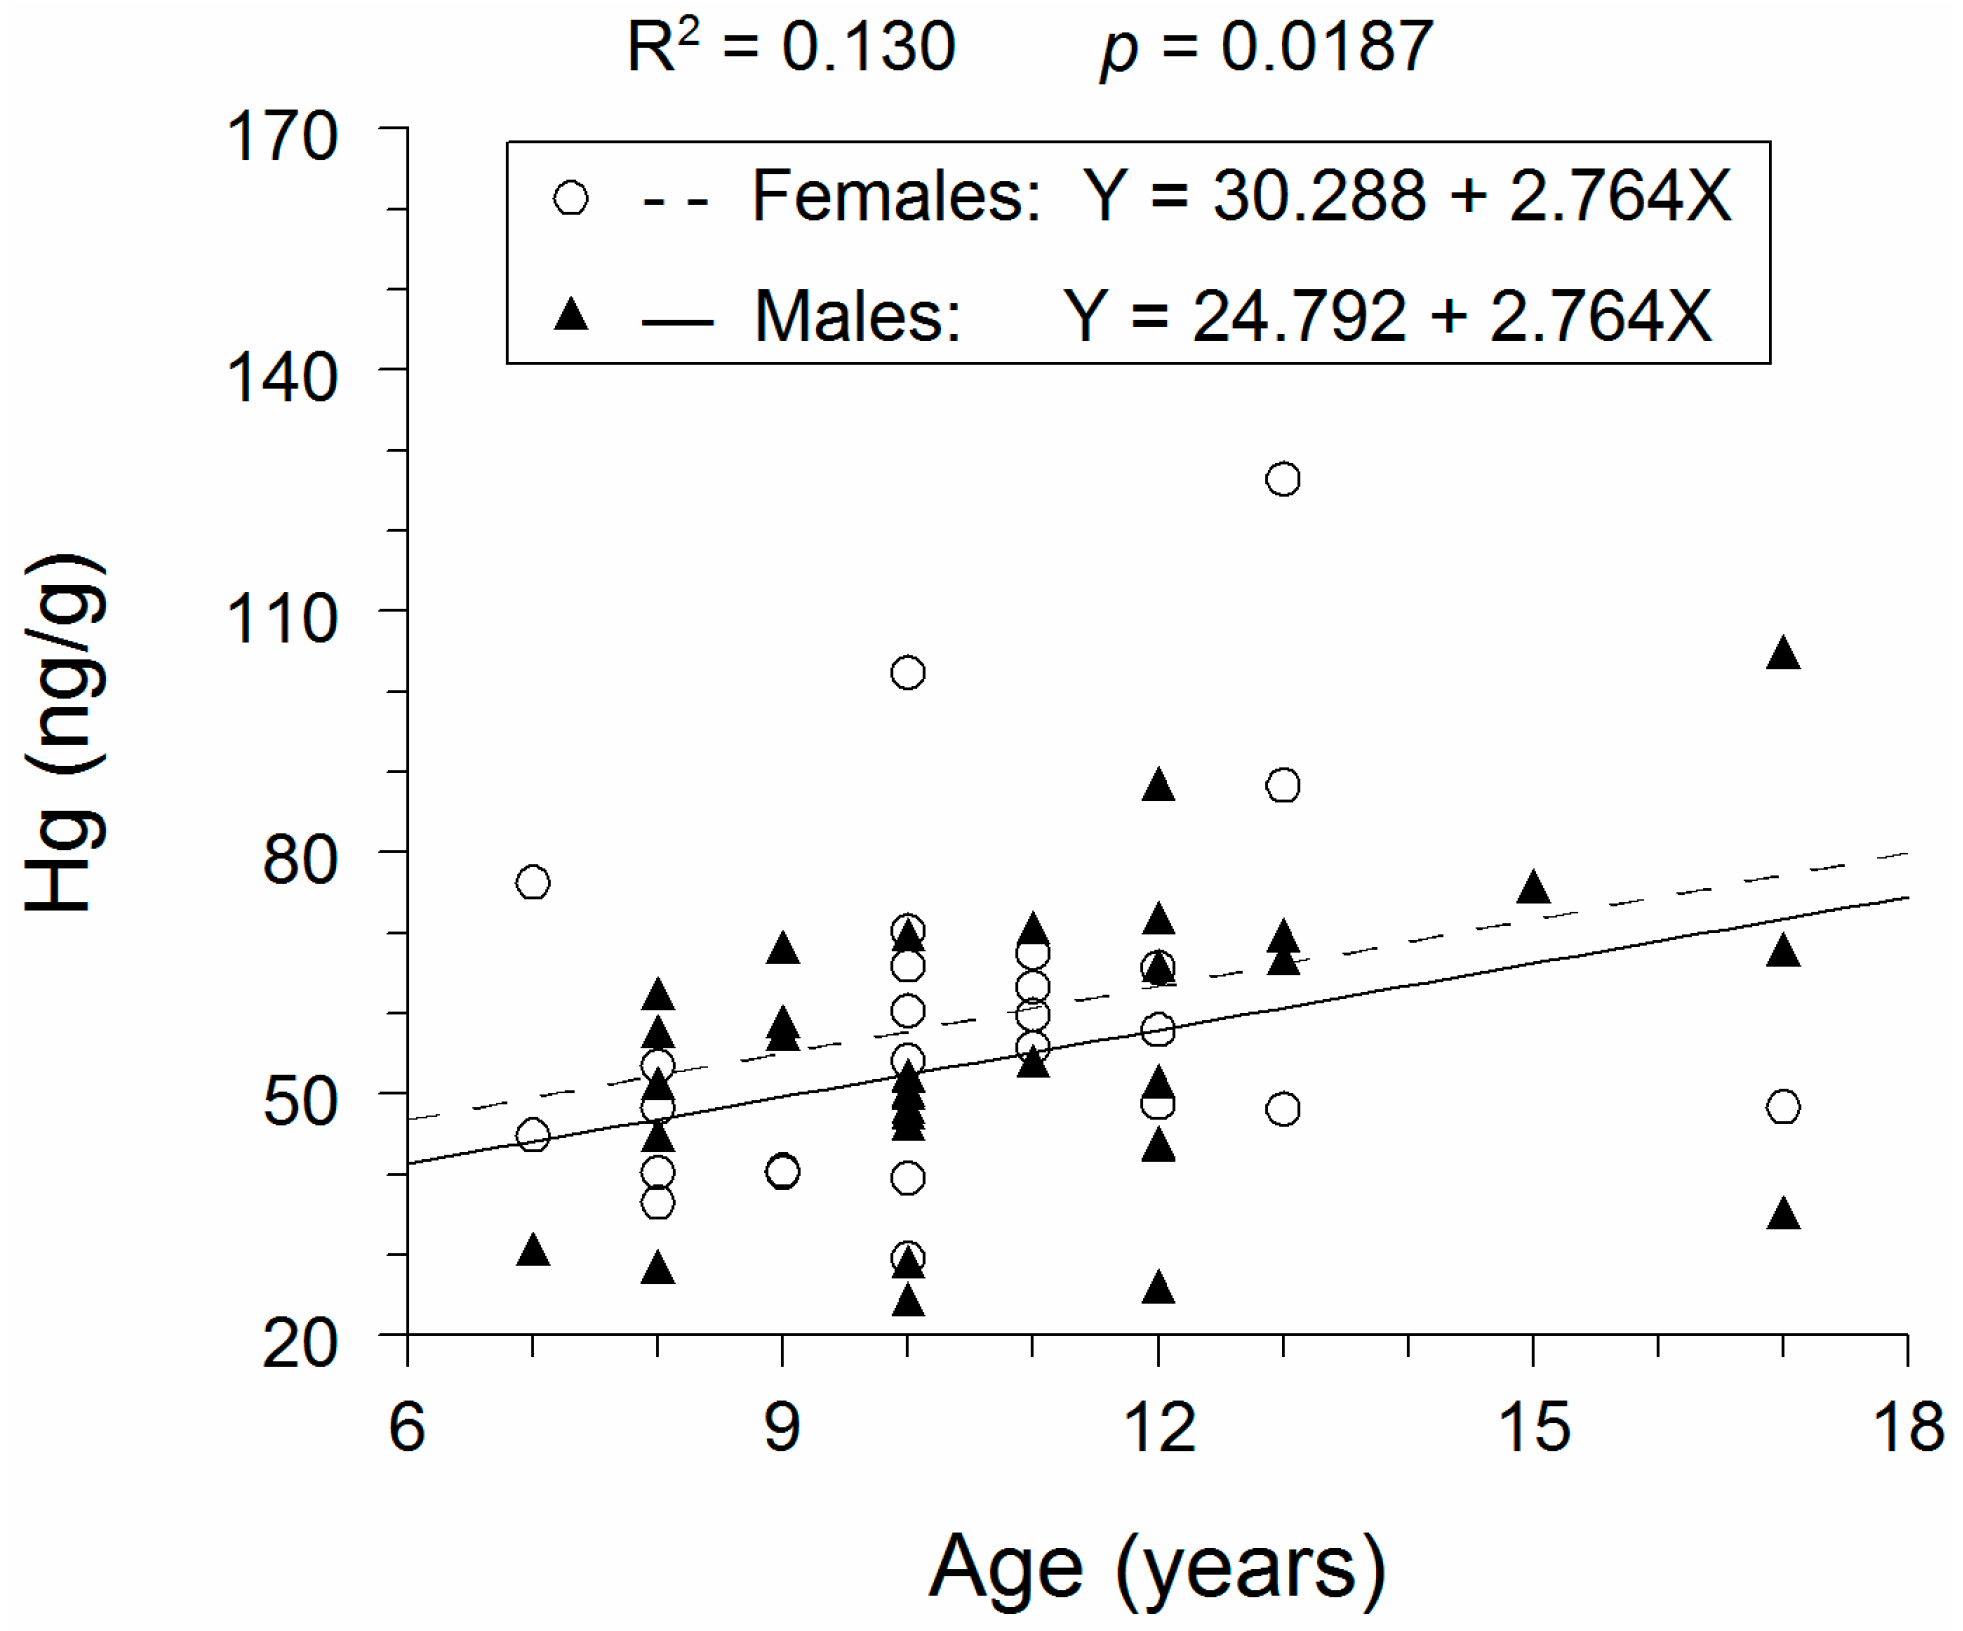
3.1. Hg Concentrations

Despite the sexes being similarly aged, female lake whitefish were larger than male lake whitefish (Table 1). Both sexes ranged in age between 7 and 17 years. Females grew faster than males, based on results from fitting the von Bertalanffy growth model to total length and age data (Table 1). Gonads of all of the lake whitefish were in ripe or nearly ripe condition.
Based on our statistical analyses, whole-fish Hg concentration did not significantly vary between the sexes (ANCOVA: F = 1.31; degrees of freedom (df) = 1.57; p = 0.2580) (Figure 1). Whole-fish Hg concentration significantly increased with increasing lake whitefish age (ANCOVA: F = 2.76; df = 1.57; p = 0.0069). Because slopes of the regression lines did not vary between the sexes (F = 0.01; df = 1.56; p = 0.9260), our use of ANCOVA was appropriate.
Substitution of the value for grand mean of age (10.7 years) into our fitted ANCOVA model yielded estimates of mean whole-fish Hg concentrations of 59.9 ng/g for females and 54.4 ng/g for males. Thus, the ratio of mean whole-fish Hg concentration in males to mean whole-fish Hg concentration in females was equal to 0.91.
Mean Hg concentration in the somatic tissue was greater than mean Hg concentration in the ovaries (Table 2). On average, whole-fish Hg concentration of the females was expected to increase by 17.9% immediately after spawning due to release of eggs. Mean GSI for the females was 16.1% (Table 2).

3.2. MeHg Concentrations

Overall, 91% of the Hg found in the lake whitefish from northern Lake Huron was MeHg, as the mean (standard error of the mean) ratio of whole-fish MeHg concentration to whole-fish Hg concentration was equal to 0.91 (0.01). Mean ratio of whole-fish MeHg concentration to whole-fish Hg concentration varied little between the sexes, as these ratios averaged 0.90 (0.02) and 0.92 (0.02) for females and males, respectively. The ratio of whole-fish MeHg concentration to whole-fish Hg concentration did not significantly vary with lake whitefish age (t = −0.06; df = 16; p = 0.9502).

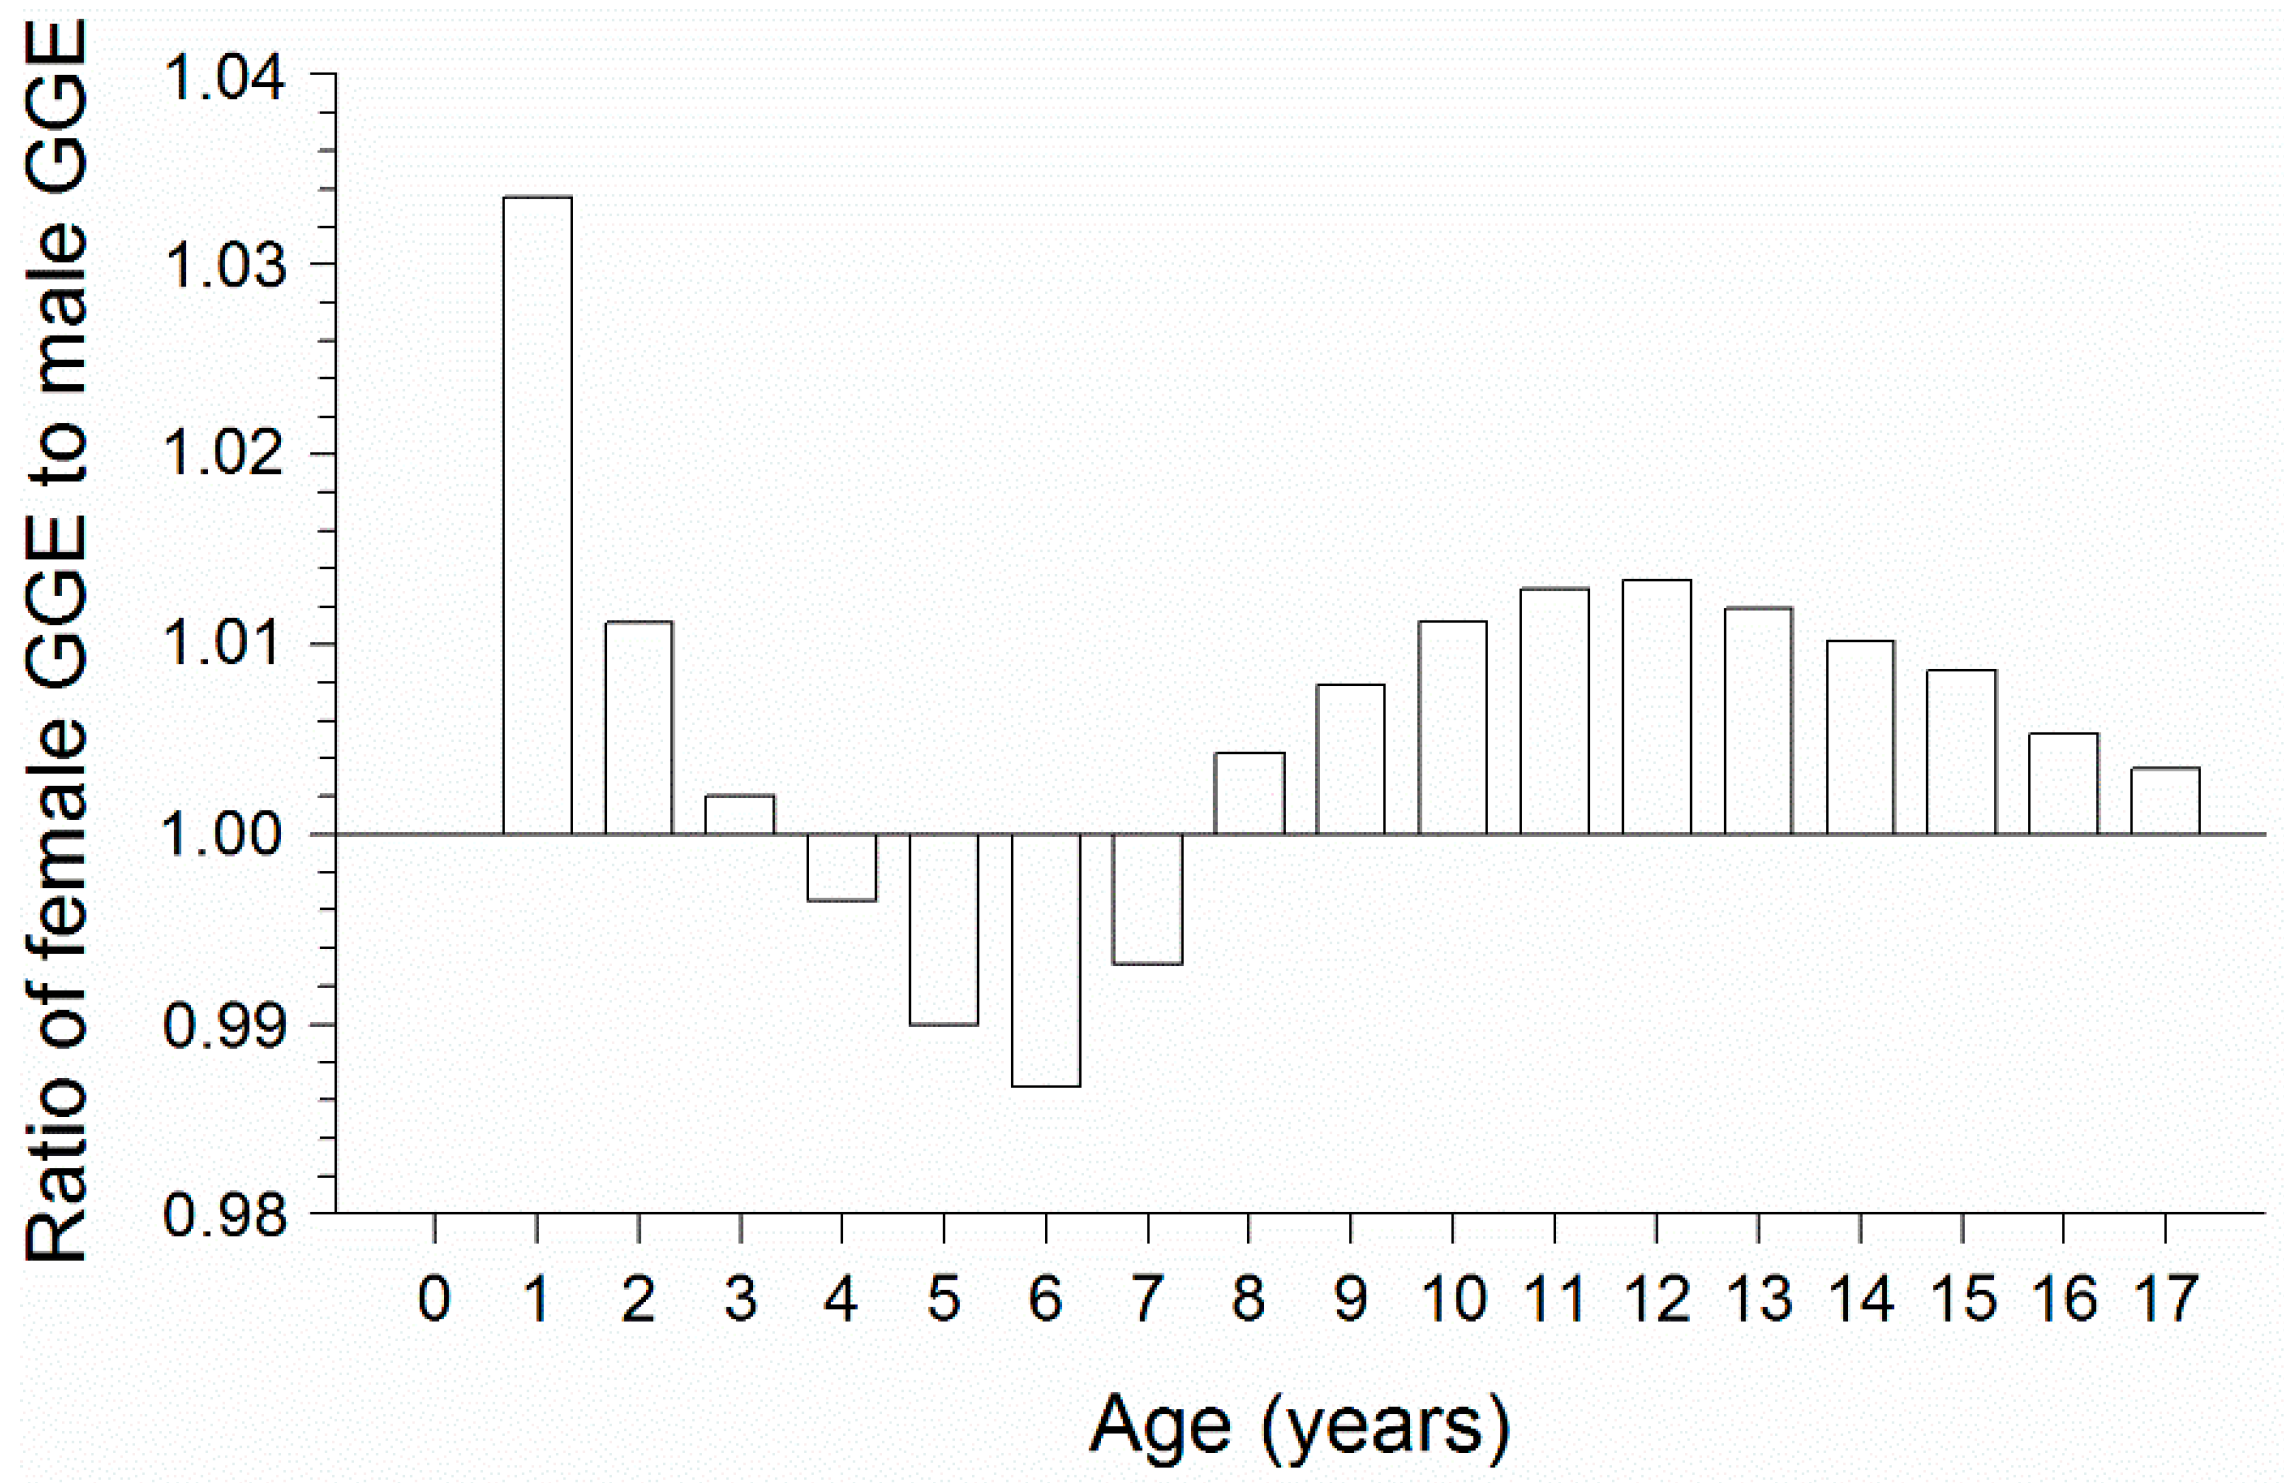
3.3. Bioenergetics Modeling

For both sexes, GGE showed an overall decreasing trend over ages 0–17 (Table 3). Even though females grew substantially faster than males, the ratio of GGE for females to GGE for males did not exceed 1.04 over ages 0–17 (Figure 2). The ratio of GGE for females to GGE for males averaged only 1.007 across ages 7–17. Thus, the growth dilution effect could account for males being only 0.7% greater in whole-fish Hg concentration compared with females.

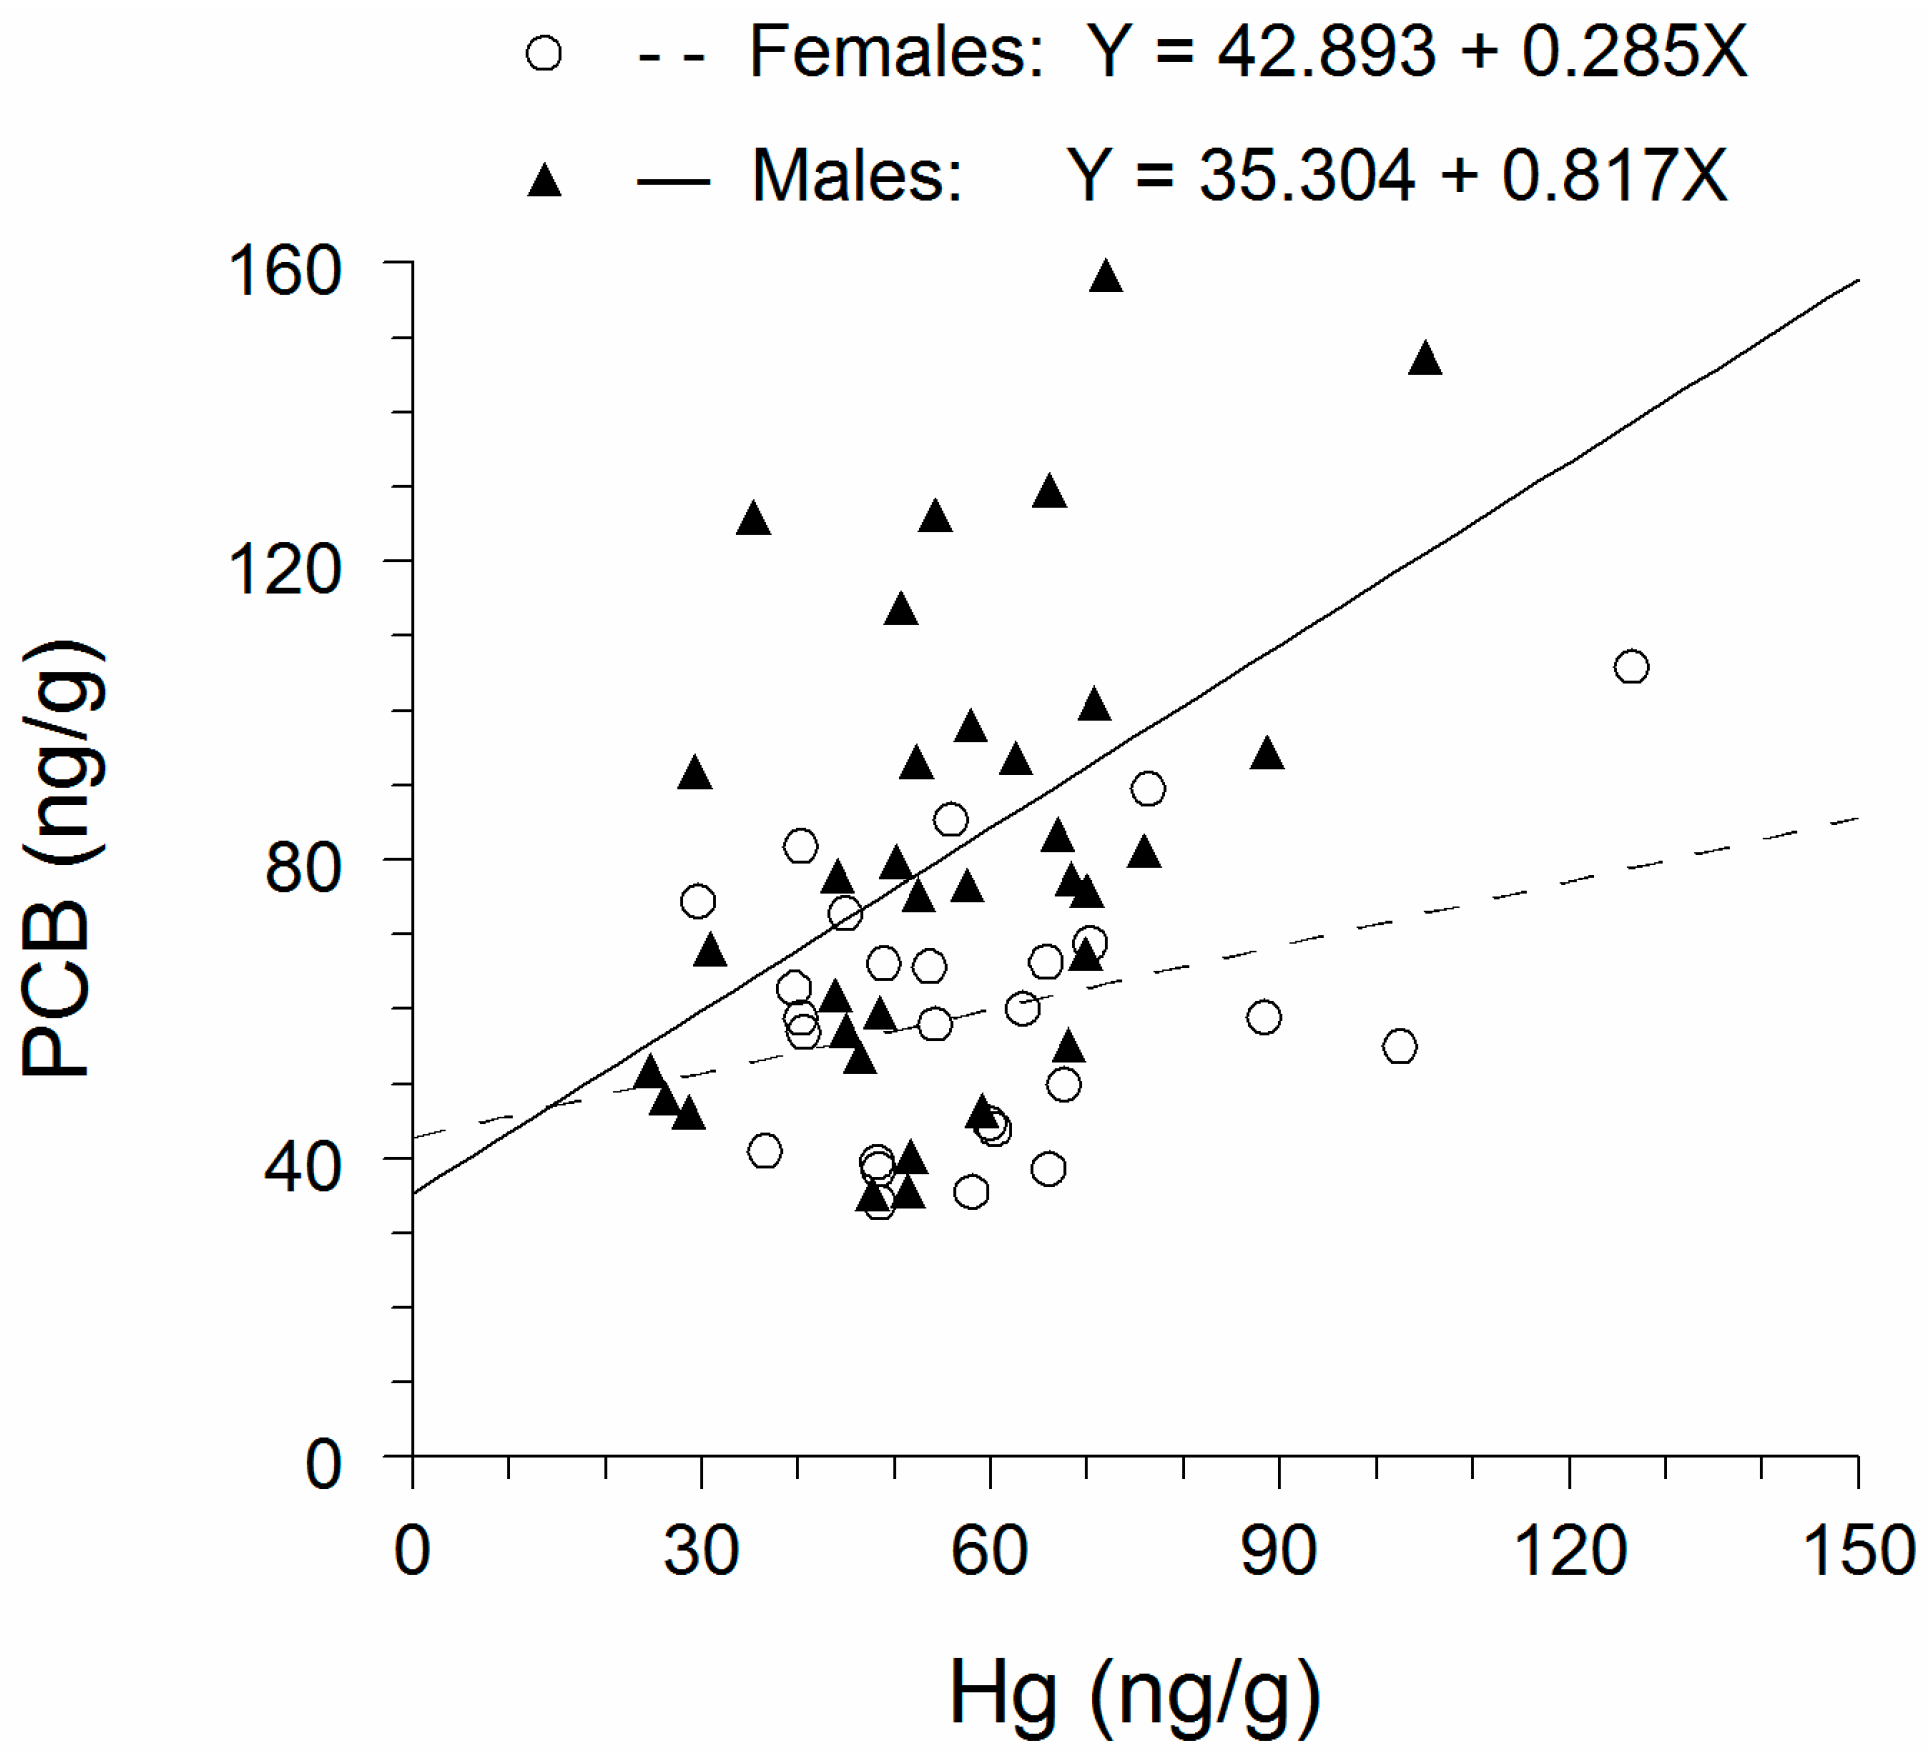
3.4. Comparison of PCBs with Hg

The effect of sex on Hg concentration was significantly different from the effect of sex on PCB concentration (F = 7.67; df = 2.56; p = 0.0011). Thus, the regression line of PCB concentration as a function of Hg concentration for females was significantly different from the regression line of PCB concentration as a function of Hg concentration for males (Figure 3). In other words, sex significantly interacted with contaminant type.

4. Discussion

Our results were in accord with results from studies by Madenjian et al. [27] on lake trout and by Madenjian et al. [23] on burbot. We estimated a ratio of Hg concentration in males to Hg concentration in females of 0.91, and we did not detect a significant effect of sex on Hg concentration in the lake whitefish. In contrast, the ratio of PCB concentration in males to PCB concentration in females was estimated at 1.34 for the same lake whitefish used in our study, and sex did have a significant effect on PCB concentration [26]. Further, we found the interaction between sex and contaminant type (Hg or PCBs) to be significant for lake whitefish. Similarly, the ratio of PCB concentration in males to PCB concentration in females was substantially greater than the ratio of Hg concentration in males to Hg concentration in females for both lake trout and burbot [23,27]. As proposed in earlier studies, a likely explanation for the ratio of PCB concentration in males to PCB concentration in females exceeding the ratio Hg concentration in males to Hg concentration in females was that males eliminated Hg at a faster rate than females. Thus, in lake whitefish, although males were apparently ingesting Hg at a higher rate than females, the rate of Hg elimination by males was sufficiently faster than that by females such that females were actually higher in Hg concentration than males. Males have been shown to eliminate Hg at a faster rate than females in laboratory mice (Mus musculus) and in northern pike [28,45]. Moreover, the faster Hg-elimination rates in males appear to be due to enhancement of the elimination process by certain androgens, as has been demonstrated in laboratory mice [45,46,47,48,49]. Interestingly, the sea lamprey (Petromyzon marinus), a very primitive fish, does not possess the same androgens as the teleost fishes [50]. Madenjian et al. [51] proposed that the androgens found in sea lamprey do not enhance Hg-elimination rate, thereby providing a plausible explanation for the ratio of PCB concentration in males to PCB concentration in females being nearly equal to the Hg concentration in males to Hg concentration in females in sea lamprey.
Of the three above-mentioned teleost fishes, burbot exhibited the lowest ratio of Hg concentration in males to Hg concentration in females. A plausible explanation for this relatively low ratio value was that male burbot eliminated Hg from their bodies at a substantially faster rate than most other male fishes [23]. Male burbot, with a mean GSI of about 11%, exhibited much greater relative testes size than either lake trout or lake whitefish, with mean GSIs between 2% and 4%. Madenjian et al. [23] reasoned that if androgen production is positively related to relative testes size, then male burbot would have higher androgen levels than most other male fishes, and therefore male burbot would likely eliminate Hg at a higher rate than most other male fishes. These researchers did acknowledge that GSI is not the only factor regulating androgen levels in males, and that androgen concentration may not be the only factor affecting Hg-elimination rate in males. Even though GSIs for male lake trout and male lake whitefish were similar, the ratio of Hg concentration in males to Hg concentration in females was equal to 1.08 for lake trout but equal to only 0.91 for lake whitefish. Perhaps androgen concentration was greater in male lake whitefish than in male lake trout, despite the similarity in GSIs between these two species. Coincidentally, Hg-elimination rate estimates from laboratory experiments for lake trout and lake whitefish were 0.000244 day−1 and 0.000730 day−1, respectively [52,53]. These estimates were derived from mixed-sex fish populations held in laboratory tanks. A plausible explanation for the substantially greater Hg-elimination rate for lake whitefish compared with lake trout was that male lake whitefish eliminated Hg at greater rate than male lake trout, and consequently the difference in Hg-elimination rates between the sexes for lake whitefish exceeded that for lake trout. This explanation would account for the ratio of Hg concentration in males to Hg concentration in females being greater for lake trout than for lake whitefish.
The growth dilution effect could not explain why female lake whitefish were slightly higher in Hg concentration than male lake whitefish. We estimated that the growth dilution effect could account for male lake whitefish being 0.7% greater in Hg concentration compared with female lake whitefish. We also estimated that females were slightly (about 10%) higher in Hg concentration compared with males, although the difference was not significant. Because females grew faster than males, the growth dilution effect could not explain females having a slightly higher Hg concentration than males.
Given the results of previous research on the relative difference in contaminant (Hg or PCBs) concentrations between the sexes of fish [23,26,31], the change in Hg concentration due to release of eggs at spawning did not appear to affect the difference in Hg concentrations between the sexes of lake whitefish. Similarly, the change in PCB concentration due to release of eggs at spawning had no apparent effect on the difference in PCB concentrations between the sexes of lake whitefish from the Detour spawning stock [26]. Results from the aforementioned previous research have indicated that the expected change in contaminant concentration due to shedding of eggs at spawning is not linked to the observed relative difference in contaminant concentrations between the sexes. We estimated that female lake whitefish would increase 17.9% in Hg concentration immediately after spawning due to release of eggs, and this value was well within the range of 5.5%–22.4% documented for other fishes [23,39].
The available data on movements of the Detour spawning stock of lake whitefish in northern Lake Huron indicated that habitat utilization did not vary between the sexes. Thus, a difference in habitat utilization between the sexes was probably not a factor influencing either the difference in Hg concentrations between the sexes or the difference in PCB concentrations between the sexes of lake whitefish from this Detour spawning stock. Mark-recapture data did not provide any suggestion that males were spatially segregated from females for an extended period of time over the course of the year [34]. Moreover, a difference in diet composition between the sexes of lake whitefish was unlikely, given the results from previous studies on other fish species [26]. For example, diet composition of both lake trout and coho salmon (Oncorhynchus kisutch) from Lake Michigan did not significantly differ between the sexes [31].
Ratio of Hg concentration in males to Hg concentration in females varied considerably from one fish species to another. For lake trout, adult males averaged 8% higher in whole-fish Hg concentration than adult females [27]. In contrast, adult males were 18% and 21% lower in whole-fish Hg concentration than adult females for populations of burbot and bluegill (Lepomis macrochirus), respectively [23,54]. Based on our study results, adult male lake whitefish were 9% lower, on average, in whole-fish Hg concentration than adult female lake whitefish. Based on muscle tissue determinations, males tended to have higher Hg concentrations than females in some species of fish, whereas the opposite pattern was found in other fish species [30,55,56]. This interspecific variation in the ratio of Hg concentration in males to Hg concentration in females may be due, in part, to interspecific variation in the relative difference in Hg-elimination rates between the sexes. For species with higher Hg concentrations in males compared with females, the relative difference in Hg-elimination rates between the sexes would be expected to be relatively low. For these cases, although males presumably both ingest and eliminate Hg at faster rates than females, the relative difference in Hg-elimination rates between the sexes is sufficiently low to allow for higher Hg concentrations in males than in females. For species with higher Hg concentrations in females compared with males, the relative difference in Hg-elimination rates between the sexes would be expected to be relatively high. Accordingly, although males presumably ingest Hg at a higher rate than females, males eliminate Hg sufficiently faster than females such that females are higher in Hg concentration than males. Thus, this interspecific variability in the ratio of Hg concentration in males to Hg concentration in females suggested that Hg-elimination rates for males varied substantially from one species to another.
We showed that 91% of the Hg in whole lake whitefish was MeHg. To the best of our knowledge, our study was the first to assess the ratio of MeHg concentration to Hg concentration in lake whitefish. Typically, MeHg is the predominant form of mercury in fish [24,32]. However, only 16% of the Hg found in fillets of white perch (Morone americana) from the Hackensack River (NJ, USA) was MeHg, with the remainder of the Hg being inorganic mercury [33]. Reasons for this unusually high percentage of inorganic mercury were not clear. Nearly all of the Hg found in mummichogs (Fundulus heteroclitus) from the Hackensack River was MeHg [33]. Raymond and Rossmann [32] determined that between 60% and 70% of the Hg found in alewives (Alosa pseudoharengus) from Lake Michigan was MeHg, whereas all (100%) of the Hg in Lake Michigan lake trout was MeHg. These researchers partly attributed the disparity in these percentages to a difference in trophic levels between the two species. All or nearly all of the Hg found in a top predator, like lake trout, is expected to be MeHg, while the proportion of Hg represented by MeHg may be somewhat lower for prey fish, such as alewife, than for the top predators [32]. The lake whitefish is considered a generalist feeder rather than a top predator in the Laurentian Great Lakes [5]. Nonetheless, lake whitefish are capable of a moderate degree of piscivory [5]. Our results for lake whitefish were identical to those for burbot from Great Slave Lake, where MeHg represented 91% of the Hg found in these fish [23]. For Lake Erie burbot, 100% of the Hg was determined to be MeHg [23]. Thus, the proportion of Hg represented by MeHg was similar between lake whitefish and burbot, a piscivore of coldwater ecosystems.
Our finding that whole-fish Hg concentration significantly increased with increasing lake whitefish age was similar to the findings of Gewurtz et al. [30], who showed that Hg concentration in lake whitefish muscle tissue was significantly and positively correlated with lake whitefish length in about 50% of the lake whitefish populations surveyed in Ontario. These positive relationships are attributable to at least two factors. First, GGE tends to decrease as lake whitefish grow [43], and GGE is inversely proportional to contaminant concentration [31]. Thus, holding all other factors constant, Hg concentration will increase as GGE decreases. Our bioenergetics modeling results indicated that GGE of lake whitefish from northern Lake Huron exhibited an overall decreasing trend between ages 0 and 17. Second, if Hg concentration in the prey of lake whitefish monotonically decreased over a long (>10 years) period of time immediately prior to sampling the population, then Hg concentration of the older and larger lake whitefish in the sample would be higher than Hg concentration of the smaller and younger lake whitefish in the sample, again holding all other factors constant.
Our results have implications for maintaining the operation of commercial fisheries for lake whitefish in Lake Huron. The U.S. Environmental Protection Agency (EPA), Ontario Ministry of the Environment (OMOE), and U.S. Food and Drug Administration (FDA) have set thresholds of 300, 610 (for the general public), and 1000 ng/g, respectively, for Hg concentrations in fish eaten by people, and either restricted consumption or no consumption is advised when these thresholds are exceeded [18,57]. Mean whole-fish Hg concentration of Lake Huron lake whitefish was estimated at 57 ng/g. Muscle tissue Hg concentration is about 10% higher than whole-fish Hg concentration in most fishes [58]. Applying this conversion rate to our estimated mean for whole-fish Hg concentration in Lake Huron lake whitefish yielded an estimated mean of 63 ng/g for muscle Hg concentration. Thus, mean Hg concentration in muscle tissue of Lake Huron lake whitefish was estimated to be well below the EPA, OMOE, and FDA guidelines. Applying the Becker and Bigham [58] conversion factor to our set of 60 lake whitefish Hg determinations indicated that all of the lake whitefish in our sample were well below the above-mentioned guidelines with regard to Hg concentration in their muscle tissue. Similarly, PCB concentrations of lake whitefish from northern Lake Huron were low compared with established guidelines. The OMOE and FDA thresholds for PCB concentrations in fish eaten by people are 844 (for the general public) and 2000 ng/g, respectively [57,59]. Lake whitefish from Lake Huron averaged 71 ng/g in whole-fish PCB concentration [26]. Typically, whole-fish PCB concentrations are higher than PCB concentrations in fish fillets [60]. Thus, mean PCB concentration in Lake Huron lake whitefish fish fillets was expected to be well below the OMOE and FDA guidelines. Further, none of the whole-fish PCB determinations by Madenjian et al. [26] exceeded 160 ng/g. Thus, all of the lake whitefish in our sample were expected to be well below both of the above-mentioned guidelines with regard to fillet PCB concentrations.

5. Conclusions

We documented that although whole-fish Hg concentrations in adult females were 10% higher, on average, than whole-fish Hg concentrations in adult males for Lake Huron lake whitefish, this difference was not statistically significant. In contrast, adult males were 34% higher in whole-fish PCB concentration than adult females, and this difference was statistically significant [26]. Our results were in accord with results from earlier studies on lake trout and burbot with regard to this pattern of a substantially greater ratio of PCB concentration in males to PCB concentration in females compared with the ratio of Hg concentration in males to Hg concentration in females. A likely explanation for this pattern was that males eliminated Hg at a faster rate than females. MeHg represented 91% of the Hg in the lake whitefish. Mean whole-fish Hg concentration of Lake Huron lake whitefish was estimated to be only 57 ng/g, which was well below the USEPA, OMOE, and FDA guidelines of 300, 610, and 1000 ng/g, respectively. Thus, our findings should be useful to decision makers deliberating on the continued operation of the lake whitefish commercial fisheries in Lake Huron, as well as to managers developing advisories for the consumption of lake whitefish from Lake Huron.

Acknowledgments

We thank Tim Desorcie, Lynn Ogilvie, and Justin Mychek-Londer for their assistance with the homogenization of the fish tissues, John DeWild and Jake Ogorek for determining Hg and MeHg concentrations in the homogenates, and Ron Kinnunen for reviewing a draft manuscript and making suggestions for manuscript improvement. This research was funded by the U.S. Geological Survey Mercury Research Laboratory and the U.S. Geological Survey Great Lakes Science Center. Use of trade, product, or firm names does not imply endorsement by the U.S. Government. This article is Contribution 2020 of the U.S. Geological Survey Great Lakes Science Center.

Author Contributions

Charles P. Madenjian developed the initial idea for this research. Mark P. Ebener played a key role in coordinating the fieldwork. Charles P. Madenjian assisted with the fish homogenization. David P. Krabbenhoft played a key role in determining the mercury concentrations in the homogenates. Mark P. Ebener played a key role in determining the fish ages. Charles P. Madenjian performed the statistical analyses and the bioenergetics modeling. Charles P. Madenjian, Mark P. Ebener, and David P. Krabbenhoft wrote the manuscript.

Conflicts of Interest

The authors declare no conflict of interest.

References

  1. Brenden, T.O.; Brown, R.W.; Ebener, M.P.; Reid, K.; Newcomb, T.J. Great Lakes commercial fisheries: Historical overview and prognoses for the future. In Great Lakes Fisheries Policy and Management: A Binational Perspective, 2nd ed.; Taylor, W.W., Lynch, A.J., Leonard, N.J., Eds.; Michigan State University Press: East Lansing, MI, USA, 2013; pp. 339–397. [Google Scholar]
  2. Ebener, M.P.; Kinnunen, R.E.; Schneeberger, P.J.; Mohr, L.C.; Hoyle, J.A.; Peeters, P. Management of commercial fisheries for lake whitefish in the Laurentian Great Lakes of North America. In International Governance of Fisheries Ecosystems: Learning from the Past, Finding Solutions for the Future; Schechter, M.G., Taylor, W.W., Leonard, N.J., Eds.; American Fisheries Society: Bethesda, MD, USA, 2008; pp. 99–143. [Google Scholar]
  3. Kinietz, W.V. The Indians of the Western Great Lakes, 1615–1760; University of Michigan Press: Ann Arbor, MI, USA, 1965. [Google Scholar]
  4. Pothoven, S.A.; Madenjian, C.P. Changes in consumption by alewives and lake whitefish after dreissenid mussel invasions in Lakes Michigan and Huron. N. Am. J. Fish. Manag. 2008, 28, 308–320. [Google Scholar]
  5. Pothoven, S.A.; Madenjian, C.P. Increased piscivory by lake whitefish in Lake Huron. N. Am. J. Fish. Manag. 2013, 33, 1194–1202. [Google Scholar] [CrossRef]
  6. Wiener, J.G.; Krabbenhoft, D.P.; Heinz, G.H.; Scheuhammer, A.M. Ecotoxicology of mercury. In Handbook of Ecotoxicology, 2nd ed.; Hoffman, D.J., Rattner, B.A., Burton, G.A., Jr., Cairns, J., Jr., Eds.; CRC Press: Boca Raton, FL, USA, 2003; pp. 407–461. [Google Scholar]
  7. WHO (World Health Organization). Ten Chemicals of Major Public Health Concern. 2010. Available online: http://www.who.int/ipcs/assessment/public_health/chemicals_phc/en/ (accessed on 3 November 2015).
  8. Clarkson, T.W.; Magos, L.; Myers, G.J. The toxicology of mercury—Current exposures and clinical manifestations. N. Engl. J. Med. 2003, 349, 1731–1737. [Google Scholar] [CrossRef] [PubMed]
  9. Scheuhammer, A.M.; Meyer, M.W.; Sandheinrich, M.B.; Murray, M.W. Effects of environmental methylmercury on the health of wild birds, mammals, and fish. Ambio 2007, 36, 12–18. [Google Scholar] [CrossRef]
  10. Sandheinrich, M.B.; Bhavsar, S.P.; Bodaly, R.A.; Drevnick, P.E.; Paul, E.A. Ecological risk of methylmercury to piscivorous fish of the Great Lakes region. Ecotoxicology 2011, 20, 1577–1587. [Google Scholar] [CrossRef] [PubMed]
  11. Wiener, J.G.; Evers, D.C.; Gay, D.A.; Morrison, H.A.; Williams, K.A. Mercury contamination in the Laurentian Great Lakes region: Introduction and overview. Environ. Pollut. 2012, 161, 243–251. [Google Scholar] [CrossRef] [PubMed]
  12. Somers, E.C.; Ganser, M.A.; Warren, J.S.; Basu, N.; Wang, L.; Zick, S.M.; Park, S.K. Mercury exposure and antinuclear antibodies among females of reproductive age in the United States: NHANES. Environ. Health Perspect. 2015, 123, 792–798. [Google Scholar] [CrossRef] [PubMed]
  13. Wren, C.D. A review of metal accumulation and toxicity in wild mammals. I. Mercury. Environ. Res. 1986, 40, 210–244. [Google Scholar] [CrossRef]
  14. Ginsberg, G.L.; Toal, B.E. Development of a single-meal fish consumption advisory for methyl mercury. Risk Anal. 2000, 20, 41–47. [Google Scholar] [CrossRef] [PubMed]
  15. Burger, J.; Gochfeld, M.; Powers, C.W.; Waishwell, L.; Warren, C.; Goldstein, B.D. Science, policy, stakeholders, and fish consumption advisories: Developing a fish fact sheet for the Savannah River. Environ. Manag. 2001, 27, 501–514. [Google Scholar] [CrossRef]
  16. Pastorok, R.A.; Bartell, S.M.; Ferson, S.; Ginzburg, L.R. Ecological Modeling in Risk Assessment: Chemical Effects on Populations, Ecosystems, and Landscapes; Lewis: Boca Raton, FL, USA, 2002. [Google Scholar]
  17. McClain, W.C.; Chumchal, M.M.; Drenner, R.W.; Newland, L.W. Mercury concentrations in fish from Lake Meredith, Texas: Implications for the issuance of fish consumption advisories. Environ. Monit. Assess. 2006, 123, 249–258. [Google Scholar] [CrossRef] [PubMed]
  18. Cai, Y.; Rooker, J.R.; Gill, G.A.; Turner, J.P. Bioaccumulation of mercury in pelagic fishes from the northern Gulf of Mexico. Can. J. Fish. Aquat. Sci. 2007, 64, 458–469. [Google Scholar] [CrossRef]
  19. Mason, R.P.; Sullivan, K.A. Mercury in Lake Michigan. Environ. Sci. Technol. 1997, 31, 942–947. [Google Scholar] [CrossRef]
  20. Lepak, R.F.; Yin, R.; Krabbenhoft, D.P.; Ogorek, J.M.; DeWild, J.F.; Holsen, T.M.; Hurley, J.P. Use of stable isotope signatures to determine mercury sources in the Great Lakes. Environ. Sci. Technol. Lett. 2015, 2, 335–341. [Google Scholar] [CrossRef]
  21. Marvin, C.; Painter, S.; Rossmann, R. Spatial and temporal patterns in mercury contamination in sediments of the Laurentian Great Lakes. Environ. Res. 2004, 95, 351–362. [Google Scholar] [CrossRef] [PubMed]
  22. Suchanek, T.H.; Mullen, L.H.; Lamphere, B.A.; Richerson, P.J.; Woodmansee, C.E.; Slotton, D.G.; Harner, E.J.; Woodward, L.A. Redistribution of mercury from contaminated lake sediments of Clear Lake, California. Water Air Soil Pollut. 1998, 104, 77–102. [Google Scholar] [CrossRef]
  23. Madenjian, C.P.; Stapanian, M.A.; Cott, P.A.; Krabbenhoft, D.P.; Edwards, W.H.; Ogilvie, L.M.; Mychek-Londer, J.G.; DeWild, J.F. Females exceed males in mercury concentrations of burbot Lota lota. Arch. Environ. Contam. Toxicol. 2015, 68, 678–688. [Google Scholar] [CrossRef] [PubMed]
  24. Trudel, M.; Tremblay, A.; Schetagne, R.; Rasmussen, J.B. Estimating food consumption rates of fish using a mercury mass balance model. Can. J. Fish. Aquat. Sci. 2000, 57, 414–428. [Google Scholar] [CrossRef]
  25. Madenjian, C.P.; O’Connor, D.V.; Nortrup, D.A. A new approach toward evaluation of fish bioenergetics models. Can. J. Fish. Aquat. Sci. 2000, 57, 1025–1032. [Google Scholar] [CrossRef]
  26. Madenjian, C.P.; Ebener, M.P.; Sepúlvede, M.S. PCB concentrations of lake whitefish (Coregonus clupeaformis) vary by sex. J. Great Lakes Res. 2015, 41, 1185–1190. [Google Scholar] [CrossRef]
  27. Madenjian, C.P.; Keir, M.J.; Whittle, D.M. Sexual difference in mercury concentrations of lake trout (Salvelinus namaycush) from Lake Ontario. Chemosphere 2011, 83, 903–908. [Google Scholar] [CrossRef] [PubMed]
  28. Madenjian, C.P.; Blanchfield, P.J.; Hrenchuk, L.E.; Van Walleghem, J.L.A. Mercury elimination rates for adult northern pike Esox lucius: Evidence for a sex effect. Bull. Environ. Contam. Toxicol. 2014, 93, 144–148. [Google Scholar] [CrossRef] [PubMed]
  29. Gerstenberger, S.L.; Dellinger, J.A. PCBs, mercury, and organochlorine concentrations in lake trout, walleye, and whitefish from selected tribal fisheries in the upper Great Lakes region. Environ. Toxicol. 2002, 17, 513–519. [Google Scholar] [CrossRef] [PubMed]
  30. Gewurtz, S.B.; Bhavsar, S.P.; Fletcher, R. Influence of fish size and sex on mercury/PCB concentration: Importance for fish consumption advisories. Environ. Int. 2011, 37, 425–434. [Google Scholar] [CrossRef] [PubMed]
  31. Madenjian, C.P. Sex effect on polychlorinated biphenyl concentrations in fish: A synthesis. Fish Fish. 2011, 12, 451–460. [Google Scholar] [CrossRef]
  32. Raymond, B.; Rossmann, R. Total and methyl mercury accumulation in 1994–1995 Lake Michigan lake trout and forage fish. J. Great Lakes Res. 2009, 35, 438–446. [Google Scholar]
  33. Weis, P.; Ashley, J.T.F. Contaminants in fish of the Hackensack Meadowlands, New Jersey: Size, sex, and seasonal relationships as related to health risks. Arch. Environ. Contam. Toxicol. 2007, 52, 80–89. [Google Scholar] [CrossRef] [PubMed]
  34. Ebener, M.P.; Brenden, T.O.; Wright, G.M.; Jones, M.L.; Faisal, M. Spatial and temporal distributions of lake whitefish spawning stocks in Northern lakes Michigan and Huron, 2003–2008. J. Great Lakes Res. 2010, 36 (Suppl. 1), 38–51. [Google Scholar] [CrossRef]
  35. Christensen, J.M. Burning of otoliths, a technique for age determination of soles and other fish. J. Cons. Perm. Int. Exp. Mer 1964, 29, 73–81. [Google Scholar] [CrossRef]
  36. USEPA (United States Environmental Protection Agency). Method 7473: Mercury in Solids and Solutions by Thermal Decomposition, Amalgamation, and Atomic Absorption; Office of Water: Washington, DC, USA, 2007.
  37. USEPA (United States Environmental Protection Agency). Guidelines Establishing Test Procedures for the Analysis of Pollutants; Office of Water: Washington, DC, USA, 1990.
  38. USEPA (United States Environmental Protection Agency). Method 1630: Methyl Mercury in Water by Distillation, Aqueous Ethylation, Purge and Trap, and Cold Vapor Atomic Fluorescence Spectrometry; Office of Water: Washington, DC, USA, 1998.
  39. Niimi, A.J. Biological and toxicological effects of environmental contaminants in fish and their eggs. Can. J. Fish. Aquat. Sci. 1983, 40, 306–312. [Google Scholar] [CrossRef]
  40. Claramunt, R.M.; Michigan Department of Natural Resources, Charlevoix, MI, USA. Personal communication, 2015.
  41. Rudstam, L.G.; Binkowski, F.P.; Miller, M.A. A bioenergetics model for analysis of food consumption patterns of bloater in Lake Michigan. Trans. Am. Fish. Soc. 1994, 123, 344–357. [Google Scholar] [CrossRef]
  42. Madenjian, C.P.; Pothoven, S.A.; Kao, Y.-C. Reevaluation of lake trout and lake whitefish bioenergetics models. J. Great Lakes Res. 2013, 39, 358–364. [Google Scholar] [CrossRef]
  43. Madenjian, C.P.; O’Connor, D.V.; Pothoven, S.A.; Schneeberger, P.J.; Rediske, R.R.; O’Keefe, J.P.; Bergstedt, R.A.; Argyle, R.L.; Brandt, S.B. Evaluation of a lake whitefish bioenergetics model. Trans. Am. Fish. Soc. 2006, 135, 61–75. [Google Scholar] [CrossRef]
  44. Mohr, L.C.; Ebener, M.P. The coregonine community. In The State of Lake Huron in 1999; Ebener, M.P., Ed.; Great Lakes Fishery Commission Special Publication: Ann Arbor, MI, USA, 2005; pp. 69–76. [Google Scholar]
  45. Hirayama, K.; Yasutake, A. Sex and age differences in mercury distribution and excretion in methylmercury-administered mice. J. Toxicol. Environ. Health 1986, 18, 49–60. [Google Scholar] [CrossRef] [PubMed]
  46. National Academy of Sciences. Toxicological Effects of Methylmercury; National Academy Press: Washington, DC, USA, 2000. [Google Scholar]
  47. Yasutake, A.; Hirayama, K.; Inoue, M. Mechanism of urinary excretion of methylmercury in mice. Arch. Toxicol. 1989, 63, 479–483. [Google Scholar] [CrossRef] [PubMed]
  48. Tanaka, T.; Naganuma, A.; Kobayashi, K.; Imura, N. An explanation for strain and sex differences in renal uptake of methylmercury in mice. Toxicology 1991, 69, 317–329. [Google Scholar] [CrossRef]
  49. Tanaka, T.; Naganuma, A.; Miura, N.; Imura, N. Role of testosterone in γ-glutamyltranspeptidase-dependent renal methymercury uptake in mice. Toxicol. Appl. Pharmacol. 1992, 112, 58–63. [Google Scholar] [CrossRef]
  50. Bryan, M.B.; Scott, A.P.; Li, W. Sex steroids and their receptors in lampreys. Steroids 2008, 73, 1–12. [Google Scholar] [CrossRef] [PubMed]
  51. Madenjian, C.P.; Johnson, N.S.; Siefkes, M.J.; Dettmers, J.M.; Blum, J.D.; Johnson, M.W. Mercury accumulation in sea lamprey (Petromyzon marinus) from Lake Huron. Sci. Total Environ. 2014, 470–471, 1313–1319. [Google Scholar] [CrossRef] [PubMed]
  52. Madenjian, C.P.; O’Connor, D.V. Trophic transfer efficiency of mercury to lake whitefish Coregonus clupeaformis from its prey. Bull. Environ. Contam. Toxicol. 2008, 81, 566–570. [Google Scholar] [CrossRef] [PubMed]
  53. Madenjian, C.P.; David, S.R.; Krabbenhoft, D.P. Trophic transfer efficiency of methylmercury and inorganic mercury to lake trout Salvelinus namaycush from its prey. Arch. Environ. Contam. Toxicol. 2012, 63, 262–269. [Google Scholar] [CrossRef] [PubMed]
  54. Madenjian, C.P.; Francis, J.T.; Braunscheidel, J.J.; Bohr, J.R.; Geiger, M.J.; Knottnerus, G.M. Mercury concentrations of bluegill (Lepomis macrochirus) vary by sex. Environments 2015, 2, 546–564. [Google Scholar] [CrossRef]
  55. Monteiro, L.R.; Isidro, E.J.; Lopes, H.D. Mercury content in relation to sex, size, age and growth in two scorpionfish (Helicolenus dactylopterus and Pontinus kuhlii) from Azorean waters. Water Air Soil Pollut. 1991, 56, 359–367. [Google Scholar] [CrossRef]
  56. Stafford, C.P.; Hansen, B.; Stanford, J.A. Mercury in fishes and their diet items from Flathead Lake, Montana. Trans. Am. Fish. Soc. 2004, 133, 349–357. [Google Scholar] [CrossRef]
  57. OMOE (Ontario Ministry of the Environment). Guide to Eating Ontario Sport Fish 2013–2014; Queen’s Printer for Ontario: Toronto, ON, Canada, 2013. [Google Scholar]
  58. Becker, D.S.; Bigham, G.N. Distribution of mercury in the aquatic food web of Onondaga Lake, New York. Water Air Soil Pollut. 1995, 80, 563–571. [Google Scholar] [CrossRef]
  59. USFDA (United States Food and Drug Administration). Health and Human Services; Public Health Service: Rockville, MD, USA, 2015.
  60. Amrhein, J.F.; Stow, C.A.; Wible, C. Whole-fish versus filet polychlorinated-biphenyl concentrations: An analysis using classification and regression tree models. Environ. Toxicol. Chem. 1999, 18, 1817–1823. [Google Scholar] [CrossRef]
Figure 1. Whole-fish Hg concentration as a function of age for adult lake whitefish caught near Cedarville, MI (USA) in northern Lake Huron during November 2010. Fitted regression lines from an ANCOVA application to the Hg concentrations are also displayed. R2 value and attained significance level for the fitted ANCOVA model are also reported.
Environments 03 00007 g001
Figure 2. Ratio of GGE for females to GGE for males as a function of lake whitefish age. Gross growth efficiency (GGE) was estimated by applying the lake whitefish bioenergetics model [41,42] to growth data for male and female lake whitefish caught near Cedarville, MI (USA) in northern Lake Huron during November 2010. Refer to the text for more details on the bioenergetics model applications.
Environments 03 00007 g002
Figure 3. Whole-fish PCB concentration as a function of whole-fish Hg concentration for both female and male adult lake whitefish caught near Cedarville, MI (USA) in northern Lake Huron during November 2010. Fitted regression lines are also displayed. Data for PCB concentrations were taken from Madenjian et al. [26].
Environments 03 00007 g003
Table 1. Mean (standard error of the mean enclosed within parentheses) {range enclosed within brackets} for total length, weight, and age of adult lake whitefish caught near Cedarville, MI (USA) in northern Lake Huron during November 2010; also included are the mean asymptotic length and the Brody growth coefficient, as estimated by fitting the von Bertalanffy growth model to total length and age data, by sex.
AttributeFemales (n = 26)Males (n = 34)
Total length (mm)515 (5) {468–548}501 (4) {451–549}
Weight (g)1192 (40) {825–1670}1012 (27) {740–1360}
Age (years)10.4 (0.4) {7–17}10.9 (0.4) {7–17}
Mean asymptotic length (mm)556542
Brody growth coefficient (year−1)0.1650.138
Note: n = number of observations.
Table 2. Mean (standard error of the mean enclosed within parentheses) {range enclosed within brackets} for Hg concentration in ovaries, Hg concentration in somatic tissue, expected percent change in whole-fish Hg concentration immediately after spawning due to release of eggs, and gonadosomatic index (GSI) of five adult female lake whitefish caught near Cedarville, MI (USA) in northern Lake Huron during November 2010.
CharacteristicMean
Hg concentration in somatic tissue (ng/g)68.3 (6.5) {44.9–84.7}
Hg concentration in ovaries (ng/g)4.9 (0.6) {3.3–6.9}
Expected percent change in whole-fish Hg concentration
immediately after spawning due to release of eggs (%)+17.9 (2.8) {+11.2–+25.4}
GSI (%)16.1 (2.0) {11.1–21.3}
Table 3. Cumulative consumption and cumulative gross growth efficiency (GGE), by age and sex, for lake whitefish from northern Lake Huron.
Age (years)FemalesMales
Weight at Age (g)Cumulative Consumption (g)Cumulative GGEWeight at Age (g)Cumulative Consumption (g)Cumulative GGE
0302400.125302400.125
11689000.1871498250.181
230521880.13926819440.138
344341240.10738736100.107
458067330.08650558420.086
571812,2770.05862410,5630.059
685519,0230.04574316,3110.046
799326,7700.03786223,0800.037
8106034,9790.03090830,0920.030
9111943,8270.02694837,4220.025
10117148,9630.02498541,6490.024
11121754,3110.022101846,0180.022
12125659,8410.021104650,5030.021
13129065,5310.020107255,1050.019
14132071,3660.018109559,8070.018
15134577,3230.017111464,5940.017
16136683,3810.016113269,4640.016
17138589,5330.015114774,4060.015
Estimates of consumption based on application of the Wisconsin bioenergetics model.

