Article

The Potential Reduction of Carbon Dioxide (CO2) Emissions from Gas Flaring in Nigeria’s Oil and Gas Industry through Alternative Productive Use †

1
Institute of Agriculture and Environment, Massey University, Palmerston North 4474, New Zealand
2
School of Engineering & Advanced Technology, Massey University, Palmerston North 4474, New Zealand
*
Author to whom correspondence should be addressed.
Proceedings of SBE16 Dubai, 17–19 January 2016, Dubai-UAE (Paper number: SBE16D135)
Submission received: 25 August 2016 / Revised: 17 November 2016 / Accepted: 18 November 2016 / Published: 23 November 2016
(This article belongs to the Special Issue Environmental Risk and Climate Change)

Abstract

:
Globally, climate change and its adverse effects on the human population and the environment has necessitated significant research on the sustainable use of natural resources. Gas flaring in Nigeria’s oil and gas industry causes environmental and health hazards and to a large extent, culminates in yearly loss of the Nation’s revenue. The aim of the study is to highlight the potentials of converting flared gas from the Nigerian oil and gas industry to compressed natural gas (CNG) which could be an alternative fuel for the 220 Lagos Bus Rapid Transit (BRT-Lite) while reducing CO2 emissions. In addition, the study provided an overview of gas flaring in the oil and gas industry and energy utilisation in some selected sectors in the country. The Long-range Energy Alternative Planning System (LEAP) software was employed to model the energy demand and carbon dioxide emissions from the BRT-Lite by creating a current scenario and projections to the year 2030. The use of CNG as an alternative fuel for Lagos BRT-Lite will significantly reduce CO2 emissions in Nigeria’s oil and gas industry. Other utilization options for flared gas from this industry includes: Liquefied Natural Gas (LNG), Liquefied Petroleum Gas (LPG), and power generation.

1. Introduction

Nigeria is Africa’s most populous country, endowed with large and diverse energy resources, which include crude oil, natural gas, coal and lignite, wind, solar radiation and biomass. The reserves of crude oil and natural gas = 36.2 billion barrels and 187 Tscf, respectively [1]. The country is often described as a gas province with substantial oil accumulations that can last another 41 years at 2011 production levels [2,3]. Globally, Nigeria’s gas reserves are ranked as the ninth largest with about 5150.6 billion cubic metres (bcm) [4,5]. This immense gas reserve occurs as associated natural gas (crude oil trapped along with natural gas) or non-associated natural gas which refers to natural gas in a reservoir with little or no crude oil [6]. A greater volume of Nigeria’s gas reserves is found as associated natural gas [7,8].
In recent times, sustainable use of natural resources have attracted the attention of researchers globally due to climate change and its adverse effects on the human population and the environment. There have been concerted efforts in research areas of impacts, adaptation, and vulnerability to climate change. An important component to consider in sustainable use of natural resources is energy conservation through the use of innovative and cost efficient technologies. Technology policies are one of the strategies employed in the reduction of carbon emissions and the usage of energy [9]. In the face of global climate change, energy efficiency and conservation are very essential components of policies for addressing emerging concerns on energy security and the reduction of greenhouse gas emissions [10]. The review of Dincer and Acar [11] outlined standards for sustainable energy systems. In addition to describing that sustainable energy systems should be equitable and efficient, Dincer and Acar suggested that the systems should have: the ability to meet the current and future energy demands of the population, least possible social or environmental impact, limited carbon net or emissions of other greenhouse gases (GHGs), no depletion of natural resource, no adverse effects on the future generations, and should be able to protect water, land, and air resources. However, adopting sustainable energy systems which are affordable, secure, and offer low-carbon energy services involve the use of techniques that recognize the complexity of energy systems from an environmental, economic, and social perspective [12]. Similarly, the dissemination of low-carbon technologies may be restricted by institutional, social and behavioural factors but their large-scale global deployment are necessary for the stabilisation of global climate [13].
The natural gas reserves in Nigeria have prospects to reduce energy-related costs through increased efficiency [4] but gas flaring has been a major cause of environmental pollution contributing significantly to GHG emissions, a waste of a significant energy source and loss of revenue to the country [6,14,15]. From a global perspective gas flaring in the petroleum and natural gas sector constitutes a significant environmental problem and a waste valuable energy source [16]. Globally, the contribution of gas flaring to GHG emissions annually is about 400 million tons of CO2 which represents 1.5% of global CO2 emissions [17].
Despite Nigeria’s large and diverse energy resources, the gap between energy demand and supply is significantly high due to lack of diversification and utilization of energy resources. The aim of the study is to highlight the promising potentials of converting flared gas from the Nigerian oil and gas industry to compressed natural gas (CNG) which could be an alternative fuel for the 220 Lagos Bus Rapid Transit (BRT-Lite) while mitigating GHG (CO2) emissions. Other objectives include:
(1)
to provide an overview of gas flaring in the oil and gas industry in Nigeria.
(2)
to analyse the energy demand and CO2 emissions from Lagos BRT-Lite by creating a current scenario and projections to the year 2030.

2. Gas Flaring in Nigeria’s Oil and Gas Industry

The quantity of gas flared in Nigeria is enough to meet its energy demands and leave a healthy balance for export especially for many neighbouring African countries [18,19]. Annually, the country flares about 36.79 bcm of natural gas [20] and 0.0392 bcm per day [21]. About 75% of the associated gas is flared with just 12% of produced gas re-injected back into sub-surface reservoirs [22,23]. Nigeria flared over 14% out of 160 bcm gas that was flared globally in 2004 ranking the country as the second to Russia accounting for 16% of global gas flared [24]. Nigeria loses more than 4.9 million USD/day to gas glaring [6]. From 1999 to 2009, Nigeria lost 11 billion USD annually to gas flaring [25]. From earlier study, [26] reported that over the period of 1970 to 2006, Nigeria lost about 72 billion USD in revenues and 2.5 billion USD annually to gas flaring.

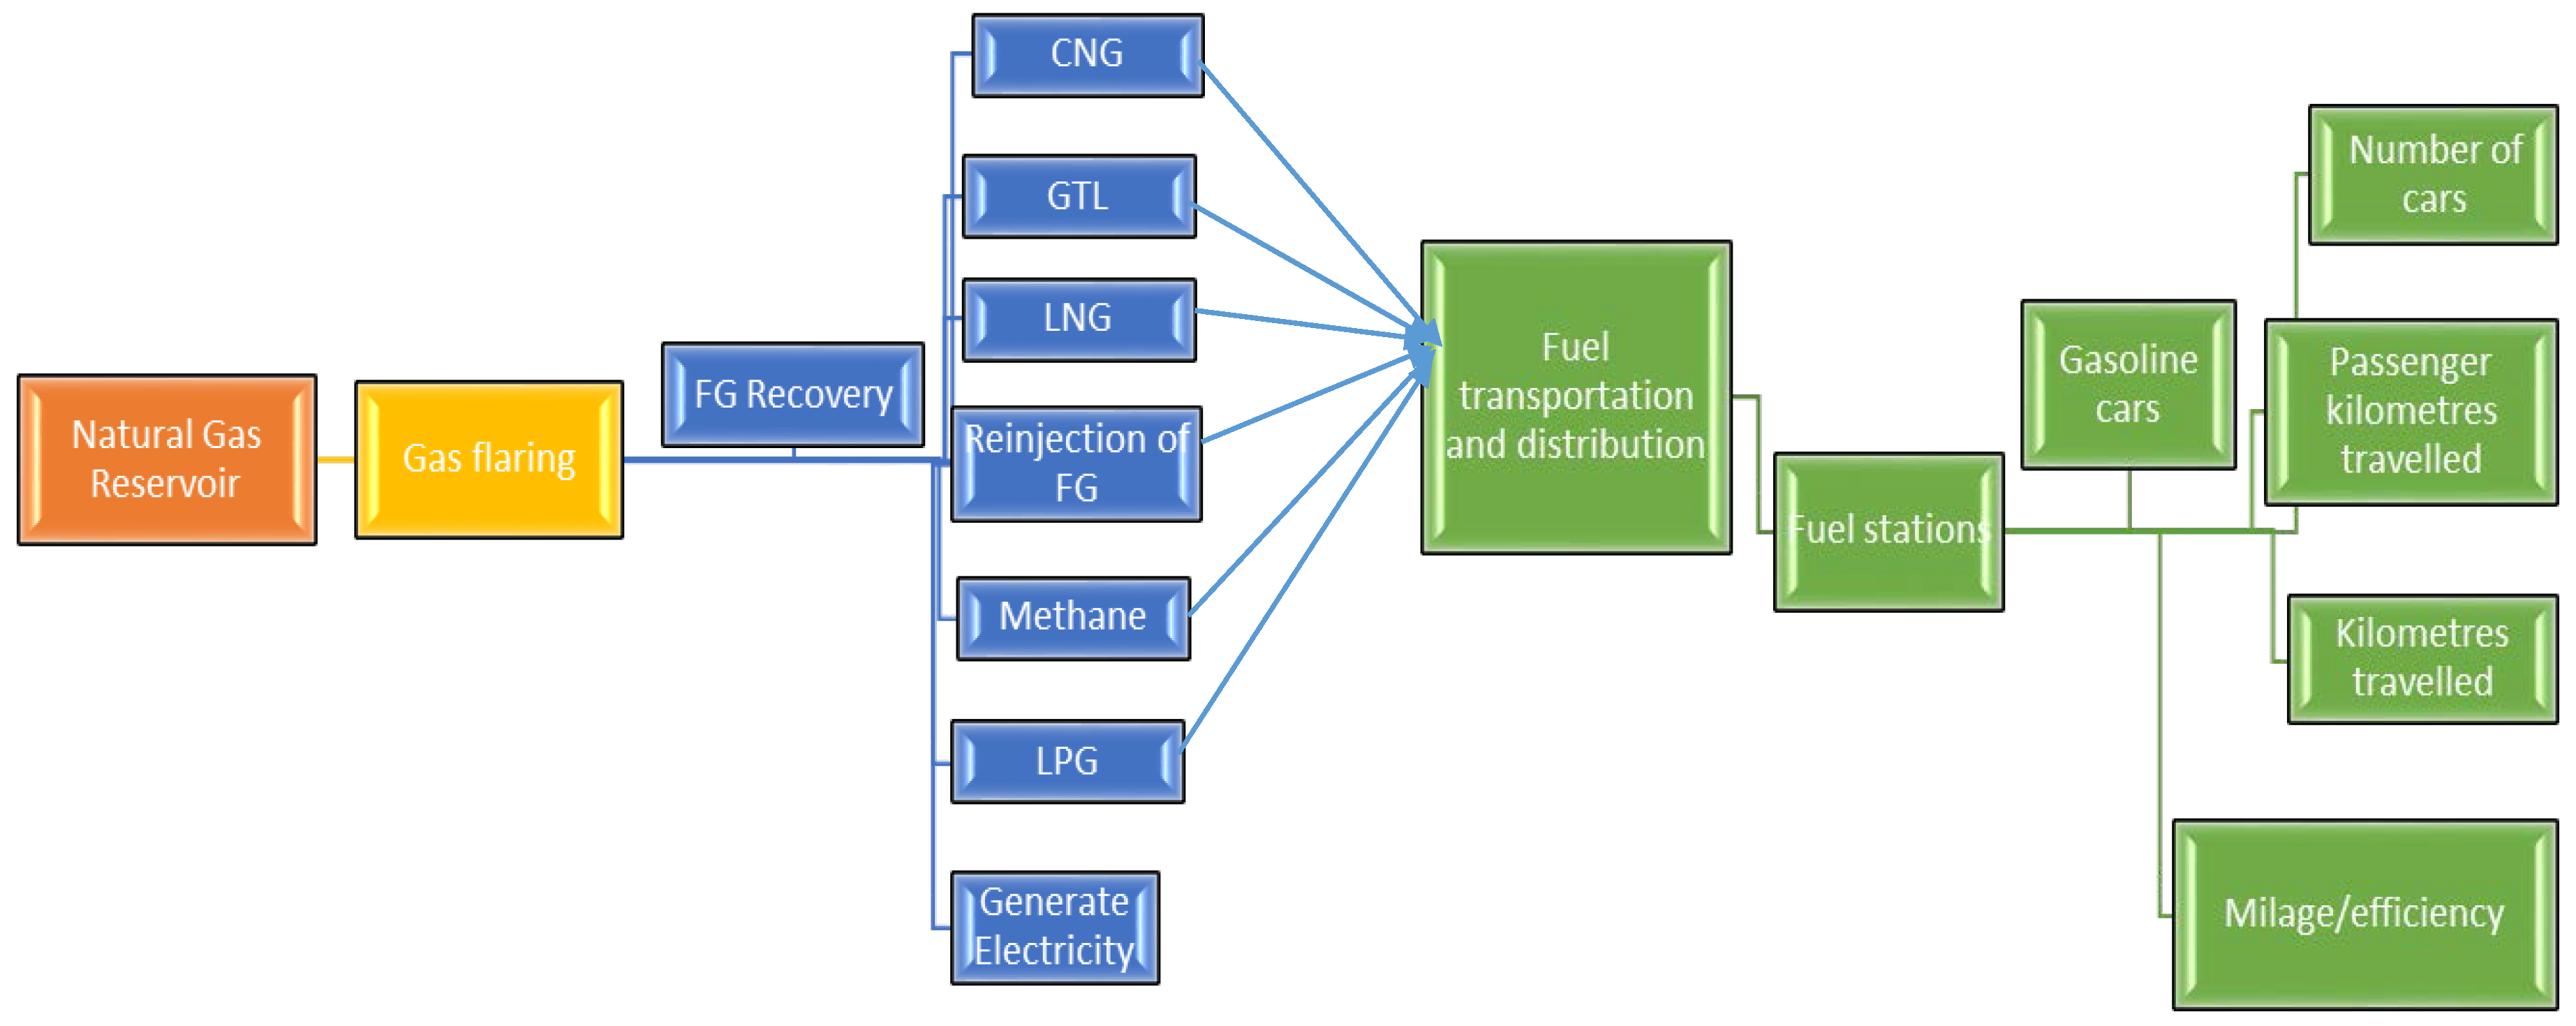
3. Utilization Options for Flared Gas from Oil and Gas Industry

Concerted efforts have been made globally to reduce GHG emissions from gas flaring in oil wells including the development of renewable energy systems [25,27,28]. In United States of America, tremendous success is being recorded in the development and improvement of conventional technologies in the transportation sector to reduce GHG emissions and dependency on foreign oils. The use of CNG, Liquefied Natural Gas (LNG), Liquefied Petroleum Gas (LPG) and hydrogen (H2) are examples of outstanding success of transportation fuels derived or produced from natural gas in United States [29] Gas that would have been flared was utilised for LPG for household cooking and feedstock to a local fertiliser plant in Rang Dong oilfield in Vietnam operated by Japan Vietnam Petroleum Co. Ltd under the Kyoto Protocol’s Clean Development Mechanism [30]. As cited by previous study [30] the project within 10 years will eliminate about 6.8 million tonnes of CO2 emissions.
By re-injecting gas in Rabi oilfield southern Gabon, flaring of about 0.54 bcm of natural gas per year was reduced to 0.018 bcm reducing CO2 emissions by a total of 1.1 million tonnes [30]. In Russia, Irkutsk oil company (IOC) commenced a gas processing plant at the Yarakta field for injecting recovered flare gas into the reservoir with capacity of 0.0009 bcm a day in the first phase commissioning and 0.006 bcm a day by 2015 [31]. A good use of flared gas is the GE’s Jenbacher gas engine. It is an example of a technology that converts flare gas to power. The GE’s Jenbacher plant systems was first installed in Italy and generates about 3.6 million MWh of electricity a year supplying about 1.2 million households in Europe [32]. About 900 million litres of diesel fuel per year is saved by generating electrical power with flare gas [32].
In the year 2009, over 4.9 bcm of associated gas was flared in KhMAO Russia but the introduction of gas-powered generating stations and gas turbine plants with the completion of the reconstruction of the Yuzhny Balyk gas refinery increased gas utilisation by 86.5% in the year 2010 increasing the refining capacity by 1.5 bcm [31]. Results from simulation models shows 48,056 barrels per day of valuable gas to liquid (GTL) products is produced from recovered flared gas in Asalooye gas refinery Iran [33]. Methanol which can be processed from flared gas is a unique and promising fuel for transportation with a combination of portable liquid petroleum [34].
A model framework for utilization options for flared gas in Nigeria’s oil and gas industry (Figure 1) are provided in this study. Options provided is electricity generation and the conversion of flared gas to CNG which could be an alternative fuel for the 220 Lagos Bus Rapid Transit (BRT-Lite). However, electricity option is an overview while the major focus is on CNG. Previous studies [4,17] reported feasible gas utilisation options for the country and this includes CNG, GTL, LNG, gas to fertilizer (GTF), and gas to power using gas fed by transmission and distribution pipeline networks to supply combined cycle gas turbines (CCGT).
For Nigeria to be part of the twenty most industrious nations by the year 2020 (vision 20:2020), access to clean and stable electricity is essential [1,35]. The target of vision 20:2020 is to provide reliable electricity for 75% of the country’s population with increase in electricity production from 4000 MW in 2007 to 40,000 MW in 2020 and results from ECN’s analysis [1] for the year 2020 revealed a projected population of about 227 million people and consumption per capita of 1340 kWh/capita from 148 kWh/capita in 2009. Electricity production in Nigeria is mainly from thermal (64%) and hydro (36%) [36,37]. Installed capacity is 8425 Megawatts (MW), operational capacity is about 50% of installed capacity (4125 MW) [38]. About 22,000 MW to 25,000 MW daily generation capacity will be needed to provide steady and reliable power supply [39]. Only about 40% of Nigeria’s population is connected to the national electricity grid with consistent (60%) power cuts [40,41]. The inability of operational capacity to meet the growing energy demand has promoted self-production power supply through the use of traditional biomass, privately operated petrol or diesel generators by households, commercial and industrial sectors [42,43]. The number of Nigerians that own power generating sets are about 60 million and the cost of fuel per year to generate electricity using them is about 1.52 trillion naira which is equivalent to 13.35 billion USD [44]. The country’s socio-economic and technological developments are greatly affected by the unreliable and insufficient power supply [40,45]. Commercial and industrial sectors that cannot afford their own electricity generating sets incur losses of up to 65% of working hours [46].

Conversion of Flared Gas in Nigeria’s Oil and Gas Industry to CNG: Providing an Alternative Fuel for Lagos Bus Rapid Transit (BRT-Lite)

The Nigeria transportation system is dependent on fossil fuel (oil and gas). Carbon dioxide emissions from fossil fuels in Nigeria have been on a progressive rise (68.5 million metric tons to 105.2 million metric tons) from 1980 to 2005 accounting for about 54% significant emissions [47]. The conversion of flared gas in Nigeria’s oil and gas industry to CNG would be a productive way to reduce pollution, improve the nation’s economy and meet the growing energy demand.
CNG is an efficient transportation fuel especially for urban transit. CNG vehicles are economic, modern and reliable option to diesel vehicles and they have greater level of reduction of GHG emissions and noise pollutions when used for urban transport [48,49,50,51,52]. Studies [53,54,55,56] reveal that the Fuel economy of CNG buses ranges from 2.51 to 7.37 miles per diesel gallon equivalence (MPDGE) depending on the bus capacity and travel distance. Potentials for reduction of GHG emissions with vehicles using CNG has been reported in Greater Cairo, Egypt [57] and Jakarta, Indonesia [58]. In Greater Cairo [57] results showed that the maximum emission factor of 2.6 kg CO2/kg fuel for CNG vehicles which was lower compared to the maximum of 3.1 kg CO2/kg fuel for gasoline and diesel. By switching the diesel busway buses with modern CNG buses, the findings from Jakarta [58] recorded reduction in NOx emissions (8%) and PM emissions (77.5%). Examples of countries that run CNG buses for BRT in their cities include, Argentina, Australia, Brazil, China, Indonesia, Italy, Peru, France, Pakistan, Republic of Korea, Thailand, and United Sates of America [32,34,40]. Australian BRT services are identified globally as eco-friendliest because all the BRT buses in its cities run on CNG [51].
Lagos is the sixth largest city in the world having prospects to be the largest urban agglomeration in Africa and third largest agglomeration in the world after Tokyo and Mumbai [59,60,61] but faced with unreliable public transport system [62]. Lagos city representing Nigeria on a global scale ranked 108 out of 178 economies based on the attractiveness of business environments [63]. The city has a total area of 357,700 hectares, a population of 20 million [60] at a growth rate of 6% [64] produces 45% of Nigeria’s skilled manpower making it the hub of the country’s industrial and commercial activities [59,64,65]. Despite the availability of air and waterways, road transport is the major mode of transport in Lagos [66] accounting for about 50% of Nigeria’s GHG emissions [65].
Private cars, commercial motorcycles (okada), 75,000 mini buses (danfo), including midi-buses (molue) and shared taxis (kabu-kabu) are the common means of transport [59,67]. About sixteen million bus trips are made daily in the city of Lagos but this is not enough to meet the transport demand as the system is characterised by notorious traffic jams with long waiting time and high cost of intra-city mobility [62,66,68]. Factors contributing to the efficient transport system include rapid population growth, inefficient public transport system, poor integration between urban and transport planning, private sector dominance in the public transport services, absence of regulatory public transport framework and weak institutional structure [59,65,67,69]. The transportation system of a city is a paradigm that shows the relationship between social and political activities and also an indicator of economic development. It is, therefore, obvious that the provision of effective, qualitative and sustainable means of transportation in the road transport sector is a necessity for continuity of urban life in Lagos state and rapid economic growth and development for Nigeria. Transportation has significant effects on all areas of urban life such as leisure, education, business and industry [68].
Lagos Bureau of Statistics [60] reported that in the year 2010, road transport sector in Lagos state accounted for N3.2 trillion (21.3 billion USD) to a GDP of N12.091 trillion (80.61 billion USD) representing 26.47%. In the same year, Lagos GDP contributed 35.6% to National GDP of N33.985 trillion (226.5 billion USD).
The Lagos BRT-Lite is an extensive and integrated approach on public transport launched in 17 March 2008 with the aim of providing Lagos commuters with a clean, affordable, fast, comfortable and reliable intracity mobility and sustainable transport system [60,70]. Previous studies [59,64,65,68,70] reveal the following key characteristics of the Lagos BRT-Lite:
  • Number of buses launched in in the year 2008 = 220 buses
  • Corridor (13.5 km, existing road = 7.5 m width with central median of 2 m width) = The BRT-Lite system runs along Ikorodu Road, Western Avenue and Eko Bridge, a key radial highway that makes the 22 km connection between Mile 12 and Lagos Island. Other supporting structures include 3 bus terminals, 28 bus shelters, bus depot garage, 65% segregated bus ways, road markings and other traffic.
  • Time of operation = It runs a 16-h operations from 6.00 a.m. to 10 p.m. weekdays and with reduced hours of operation on the weekends.
  • Cost per km for BRT = 1.4 USD
  • Fleet capacity utilization = 95%
  • Average trip per bus per day = 5
  • Average waiting time = 15 min
  • Average journey time = 55 min
  • Average speed = 30 km/hour
  • Kilometres per bus per day = 220
  • Average passenger kilometres per day = 5
  • Average Load factor = 1000 passengers carried per bus per day. About 220,000 passengers carried daily. About 39,457,962 passengers were carried in 2008 while 69,672,333 was carried in 2009. However, about 10,000 passengers per direction per hour during peak travel hours was projected.

4. Materials and Methods
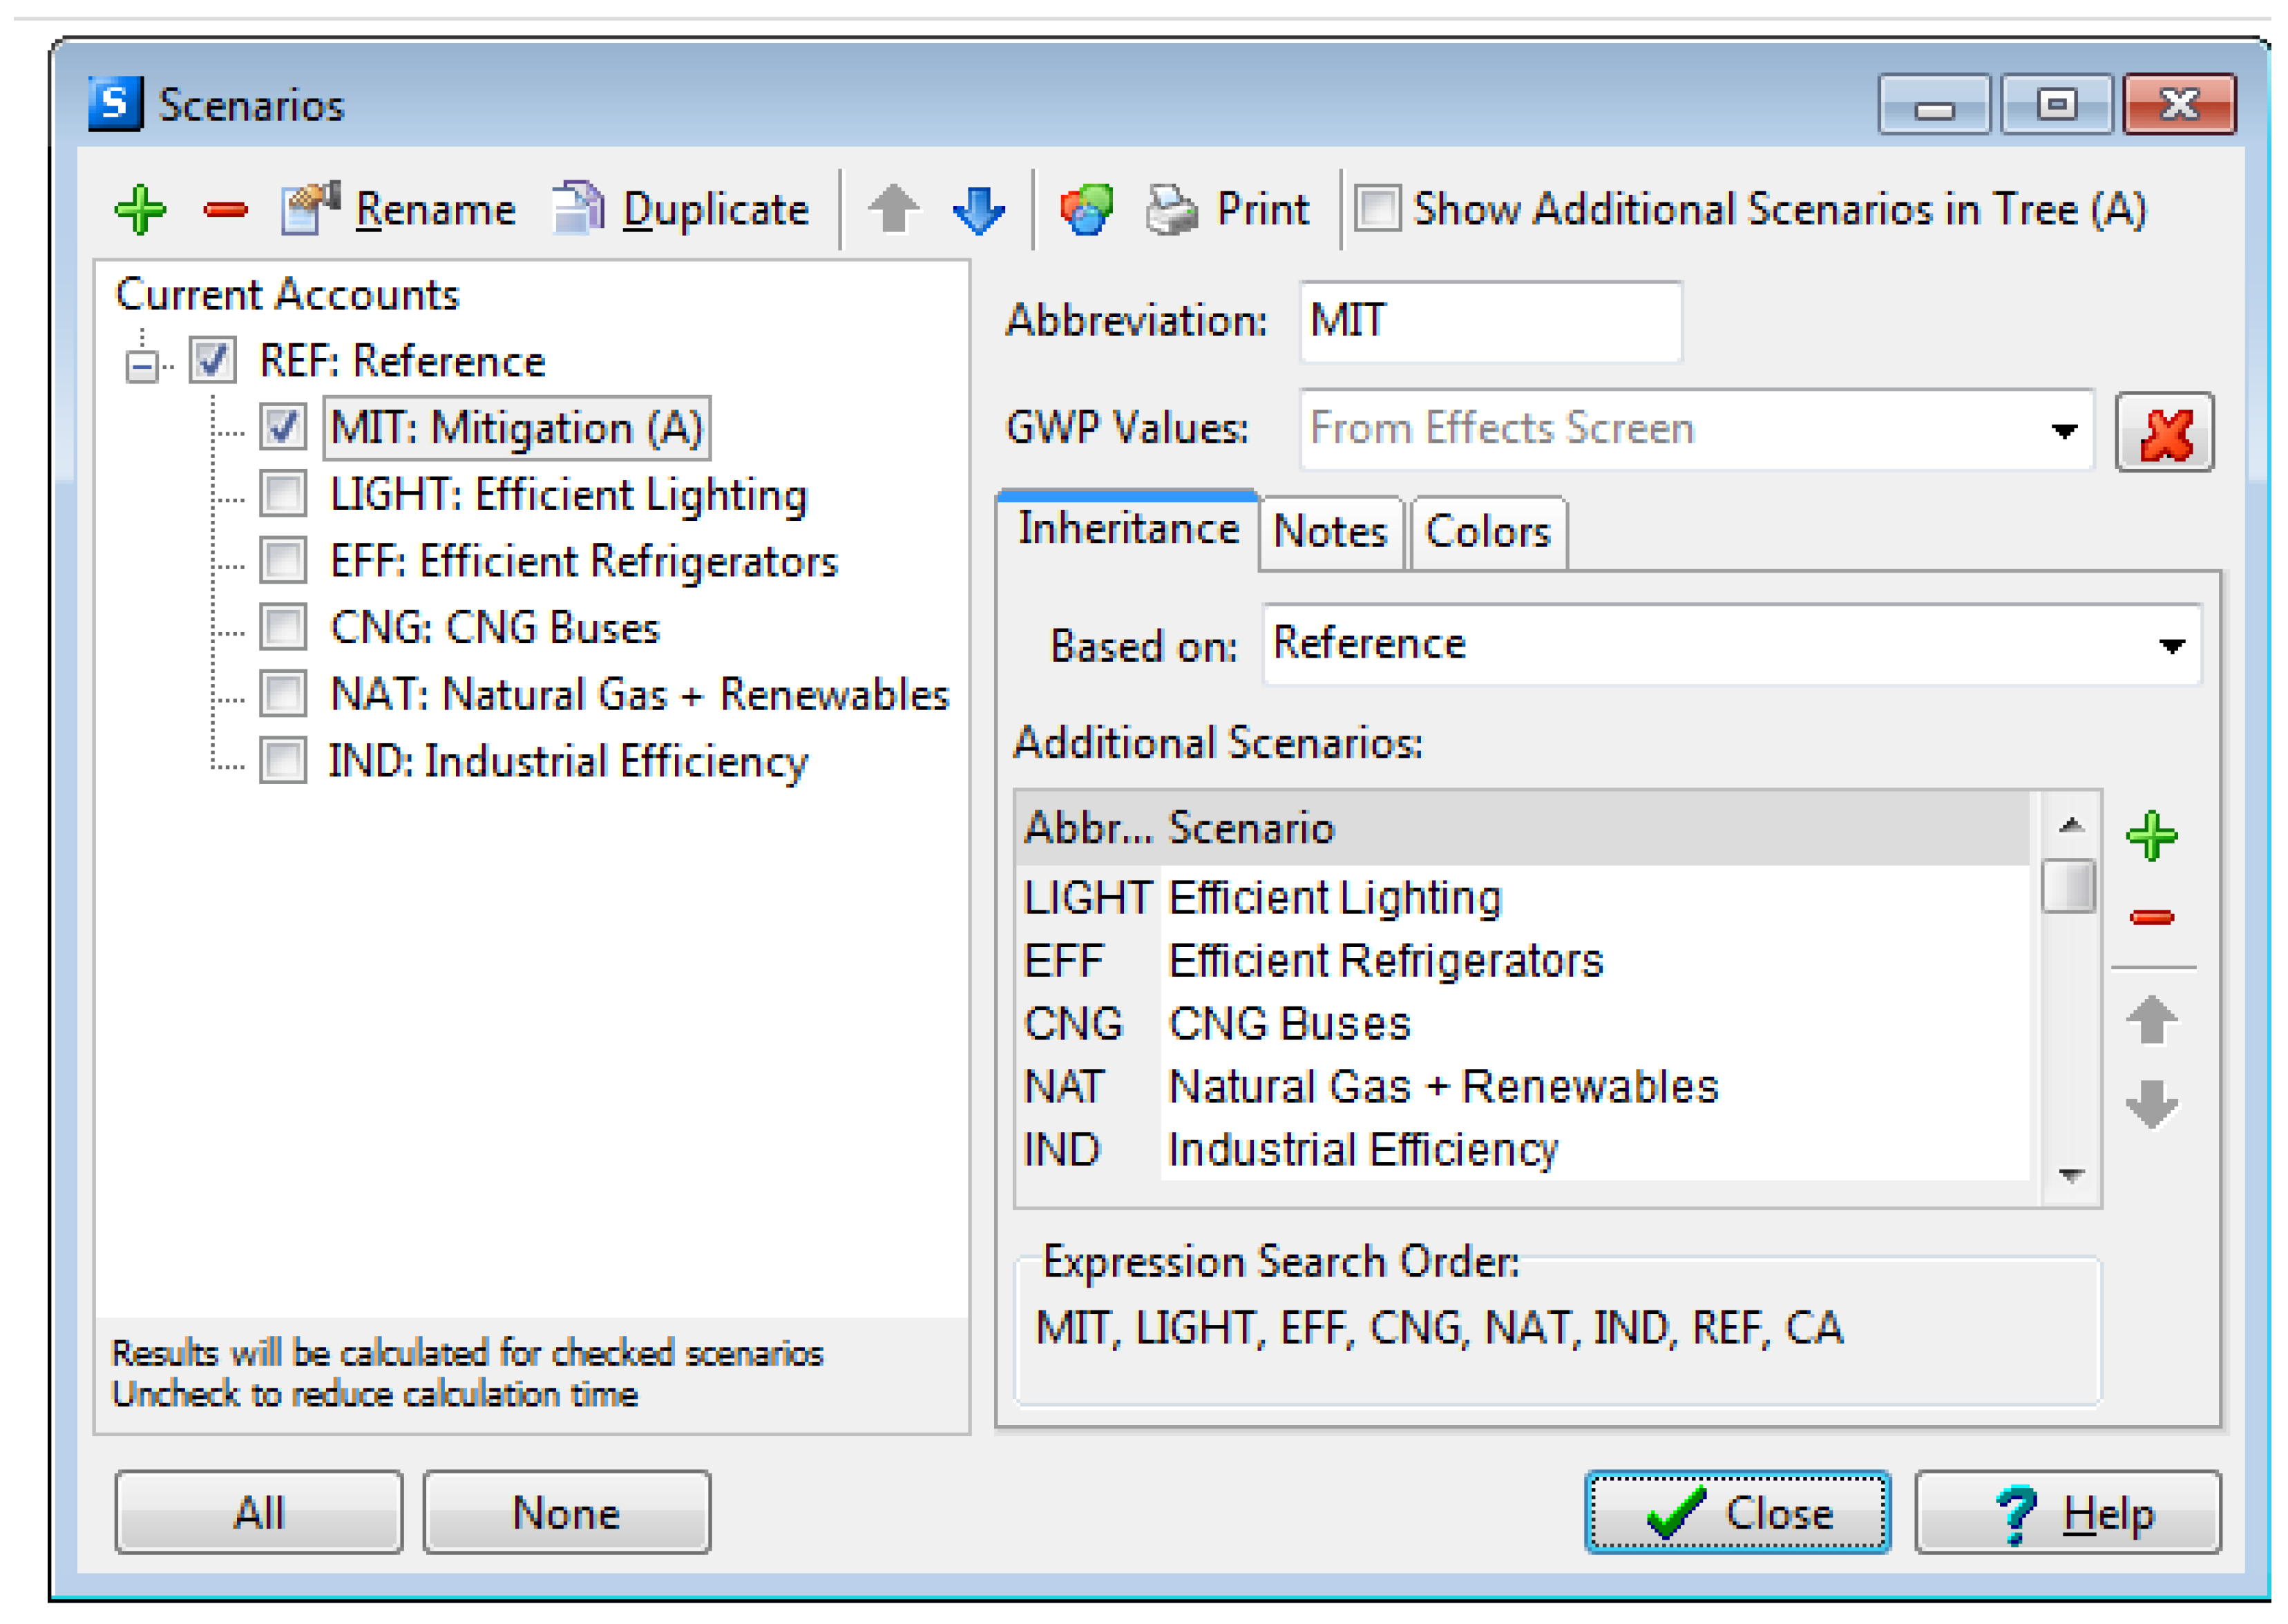
Data was sourced from relevant literatures, Long-range Energy Alternatives Planning System (LEAP) starter data for Nigeria and published resources from government institutions like the Nigerian National Petroleum Commission (NNPC), Energy Commission of Nigeria (ECN), Lagos Bureau of Statistics (LBS) and Lagos Metropolitan Area Transport Authority (LAMATA). The study employed LEAP 2014 model for analysis of data collected.

4.1. Leap Model

The Long-range Energy Alternatives Planning system (LEAP) is modelling software developed by the US Stockholm Environment Institute (SEI) in 1980 for energy policy analysis and climate change mitigation assessment. The main idea of scenario analysis in LEAP is to analyse the current energy situations and to simulate alternative energy futures along with environmental emissions under a range of user-defined assumptions (Figure 2). LEAP employs economic techniques to simulate various future scenarios, given projections about population and social conditions, economic growth, development of prospective technology and its penetration to the future. It has features that could enable the user to estimate energy consumption, production and resource extraction in all sectors of an economy [71]. LEAP offers the user a systematic mechanism for analysing within and across-sector competition of technologies and fuels [72]. Furthermore, LEAP can be used to account for both energy sector and non-energy sector GHG emission sources and sinks, analyse emissions of local and regional air pollutants. Amoo and Fagbenle [72] used LEAP technology database and model to assess the economic impact of hydrogen energy in Nigeria’s transportation, energy, and power sectors. Also explored in the analysis of Amoo and Fagbene is the GHG emissions of the alternative and conventional technologies in the sectors. In another study, Aliyu et al. [35] used LEAP model to simulate Nigeria’s electricity generation system in 20 years period (base year = 2010 and end year = 2030). Included in the analysis were introduction of electricity generation technologies that have not been used in the base year, electricity demand and supply projection per scenario, and global warming potentials of the technologies considered.

4.2. Transport Analysis Calculation

• Passenger-km (Travel Demand)
Passenger-km is one of the key output measures of public transport performance. It is used to determine public transport use and loadings on specific route segments. In LEAP model, passenger-km is expressed as travel demand.
Travel demand (t) = ∑Vi(t) × VKTi(t) × Vehicle occupancy rate
where Vi(t) is the number of buses on the street, VKTi(t) is the average annual vehicle-km travelled by a vehicle of type i in year t.
Total kilometres travelled by buses per day = 220 × 220 = 48,400.
Total kilometres travelled by buses per year = 48400 × 365 = 17,666,000.
Total number of passengers carried by BRT-Lite in the year 2009 (vehicle occupancy per year) = 6,967,233 as reported in previous study [64].
Passenger kilometres in 2009 = 17,666,000 × 6,967,233 = 123,083,138,178,000 approximately 123 trillion passenger kilometres.
• Fuel economy
Fuel economy is the average fuel consumption of a vehicle per year in km/litres.
Fuel consumption per bus per day = 208.32 L using previous study [73].
Fuel consumption for total number of buses per day = 208.32 × 220 = 45,830 L.
Annual fuel consumption by total number of buses = 45,830.4 × 365 = 16,728,096 L = 4,419,096 US gallons.
• Energy demand
The energy demand of the vehicle by fuel types was computed as a function of the numbers of buses, the average vehicle kilometre travelled and the fuel economy of the vehicle.
Hence, total energy consumption of vehicle is shown in the equation below:
Energy demand = ∑Vi(t) × VKTi(t) × Fi(t)
where Vi(t) is the number of vehicles on the street, VKTi(t) is the average annual vehicle-km travelled by a vehicle of type i in year t and Fi(t) is the fuel economy of vehicle type i in year (t) in km/L.
• Emissions
The emissions of buses considered were computed as the product of the energy demand of the vehicles and their emission factors. The emission factor was added from LEAP Technology and Environmental Database (TED) which has The Technology and Environmental Database. Extensive information describing the technical characteristics, costs and environmental impacts of a wide range of energy technologies including existing technologies, current best practices and next generation devices. This is shown in the equation below:
Ej(t) = ∑Vi(t) × VKTi(t) × EFij(t) × Fi(t)
where, Ej(t) is the total emission of emission type j in year t by passenger transportation in tonnes, Vi(t) is the number of vehicles on the street, VKTi(t) is the average annual vehicle-km travelled by a vehicle of type i in year t, EFij(t) is the emission factor of pollutant type j of vehicle type i in year (t) in g/km, and Fi(t) is the fuel economy of vehicle type i in year (t) in km/litres.

4.3. Assumptions Used for Scenario Construction

  • Base year = 2009.
  • Lagos state population (20 million at 6% growth rate), State Gross Domestic Product—SGDP of Lagos State (80.61 billion USD at 5% growth rate) [60,64].
  • Per capita income (4030.50 USD at 3.5% growth rate).
  • Scenario 1 is business as usual (BAU), Scenario 2 involves the use of CNG for 100 units of Lagos BRT-Lite in the year 2016 while Scenario 3 entails complete utilization of CNG for 220 units of Lagos BRT-Lite. The fuel economy of CNG buses considered for the study is 6.01 MPDGE (Gillig’s CNG bus with a Cummins ISL-G engine, Allison B400R transmission and Modine E-Fan cooling) [74].

5. Results and Discussions

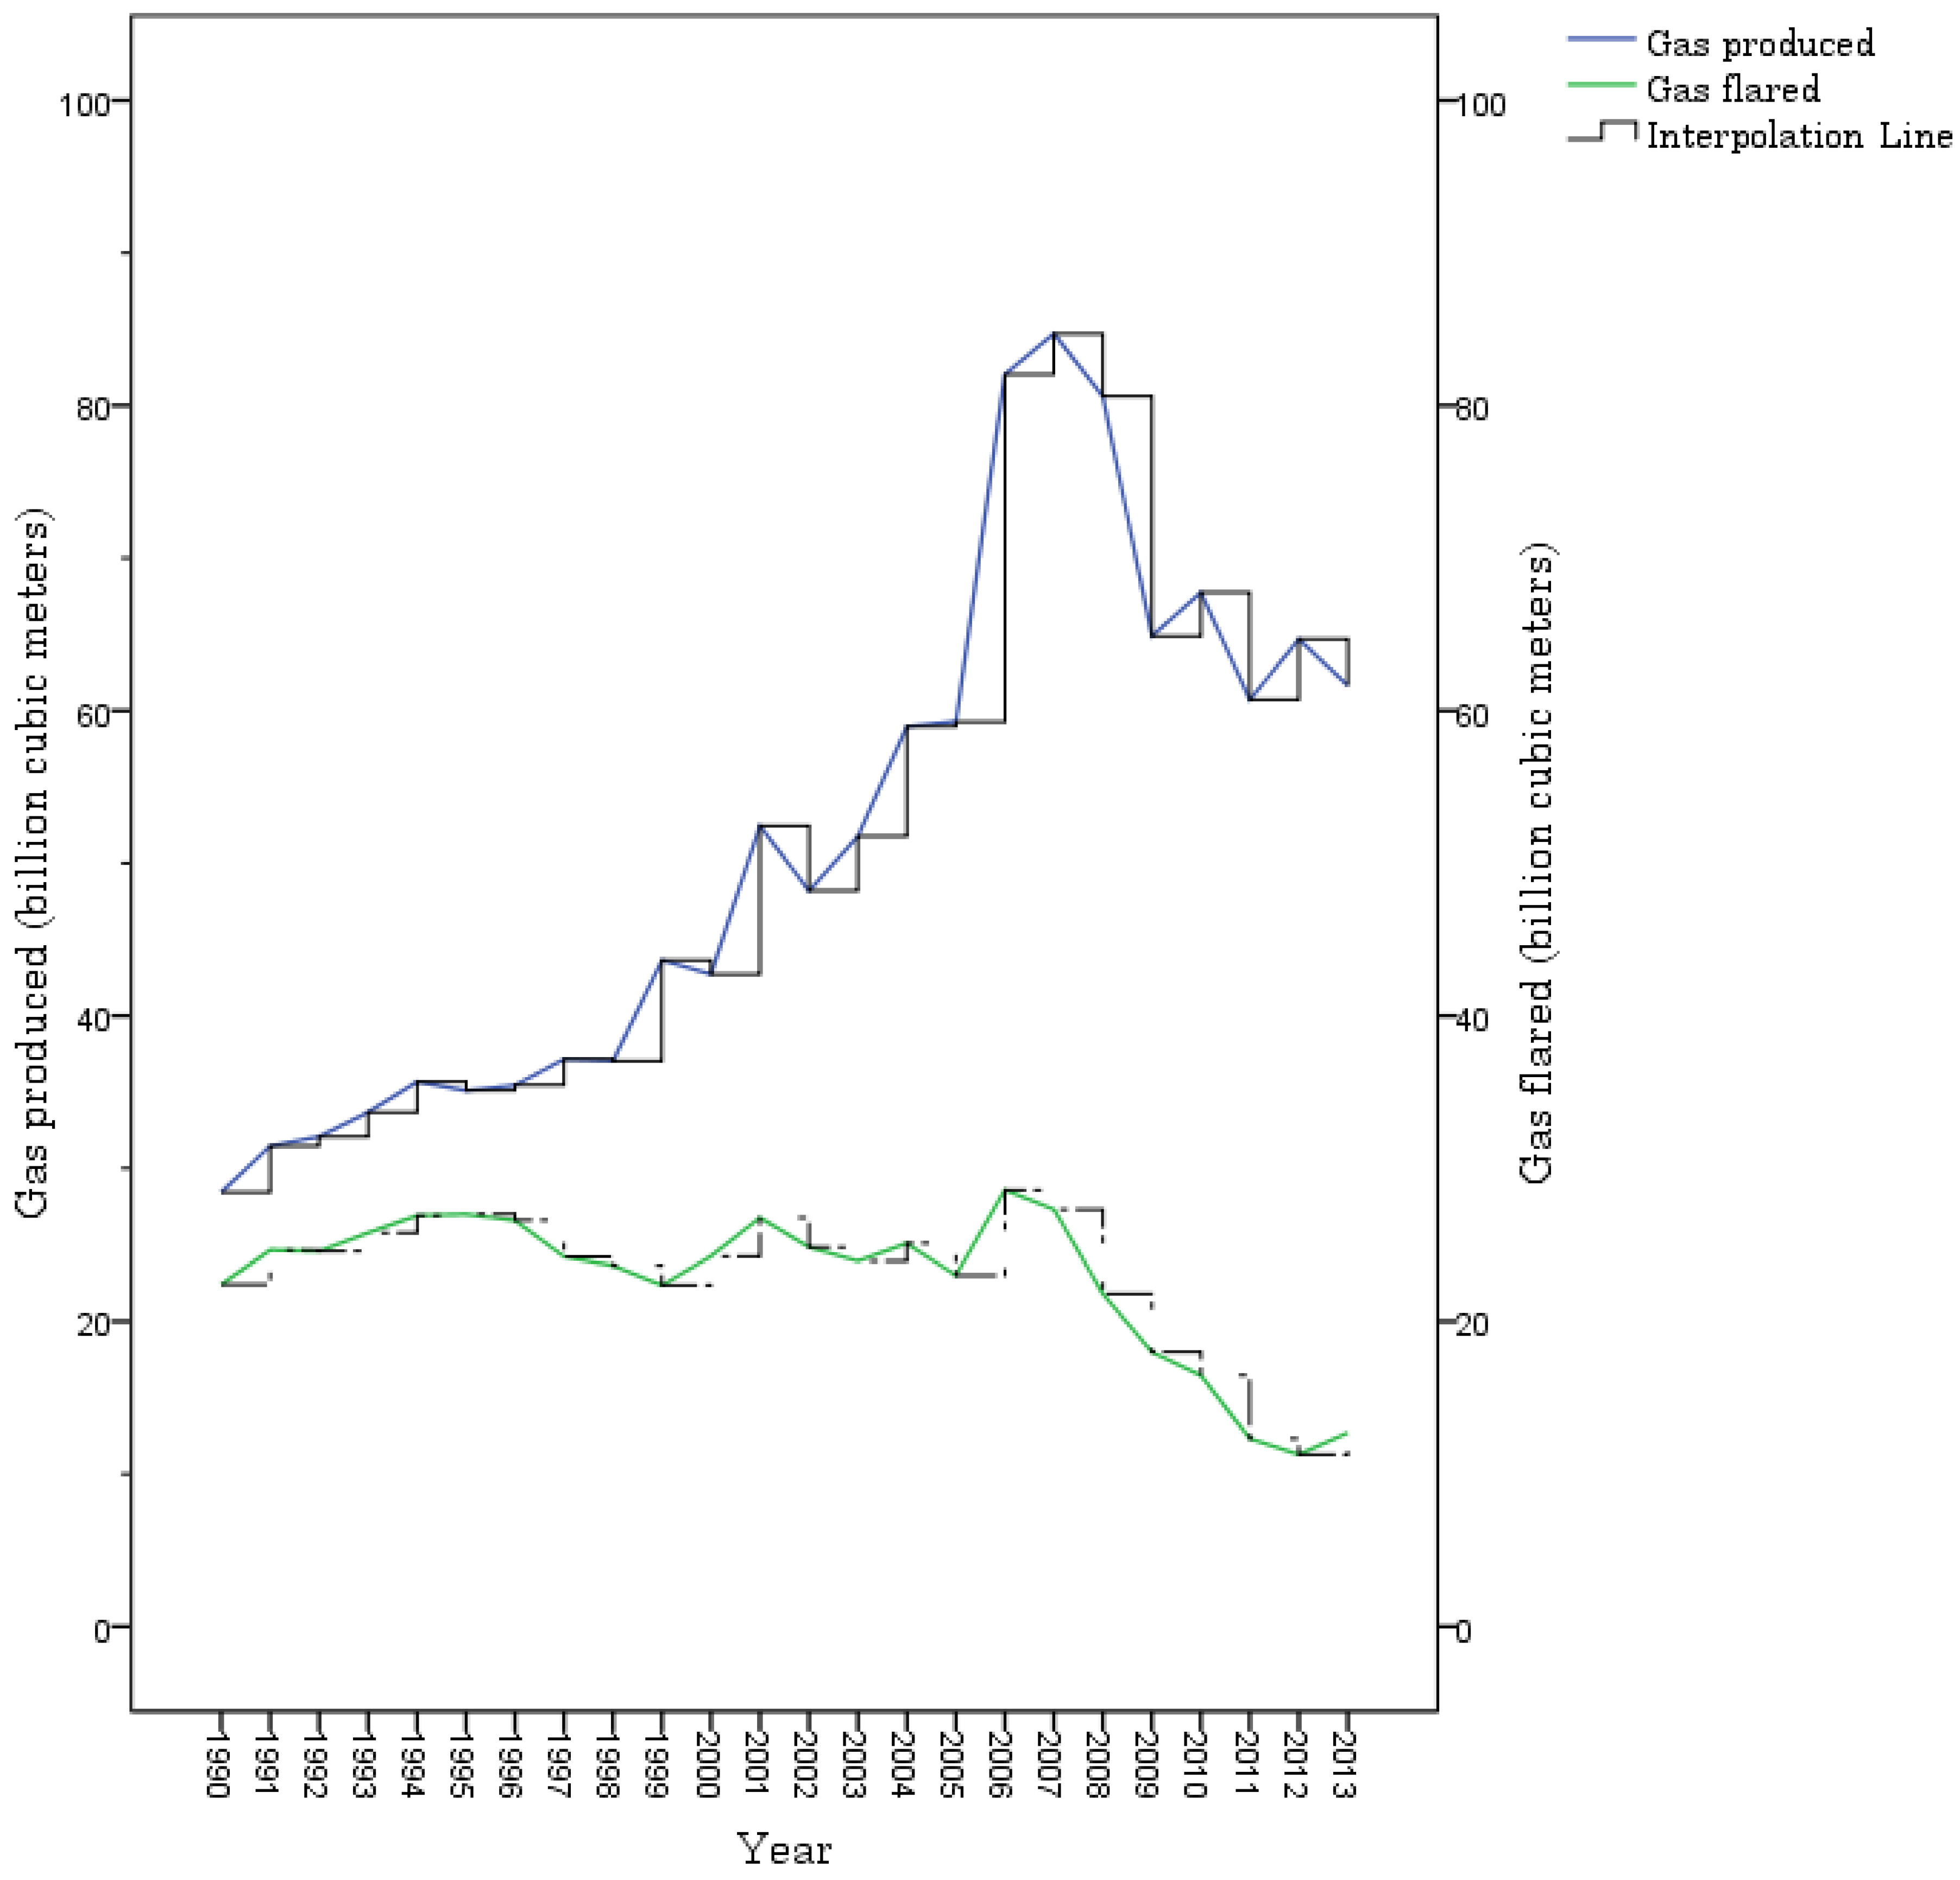
5.1. Quantity of Gas Produced and Gas Flared in Nigeria’s Oil and Gas Industry

From the inception (1950s) of the oil and gas industry in Nigeria, large quantities of gas have been flared yearly. Analysis of data sourced from previous studies [75,76,77,78,79,80,81,82,83] revealed that approximately 897.36 bcm of gas was flared out of 1628.89 bcm gas produced from 1965 to 2013. This is slightly higher compared to 895.01 bcm of flared gas reported in a previous study [19]. There is a direct relationship between the rate of gas produced and gas flared (Figure 3). The interpolation line reflects values of every increase and decrease in the amount of gas produced or flared yearly from 1990 to 2013.

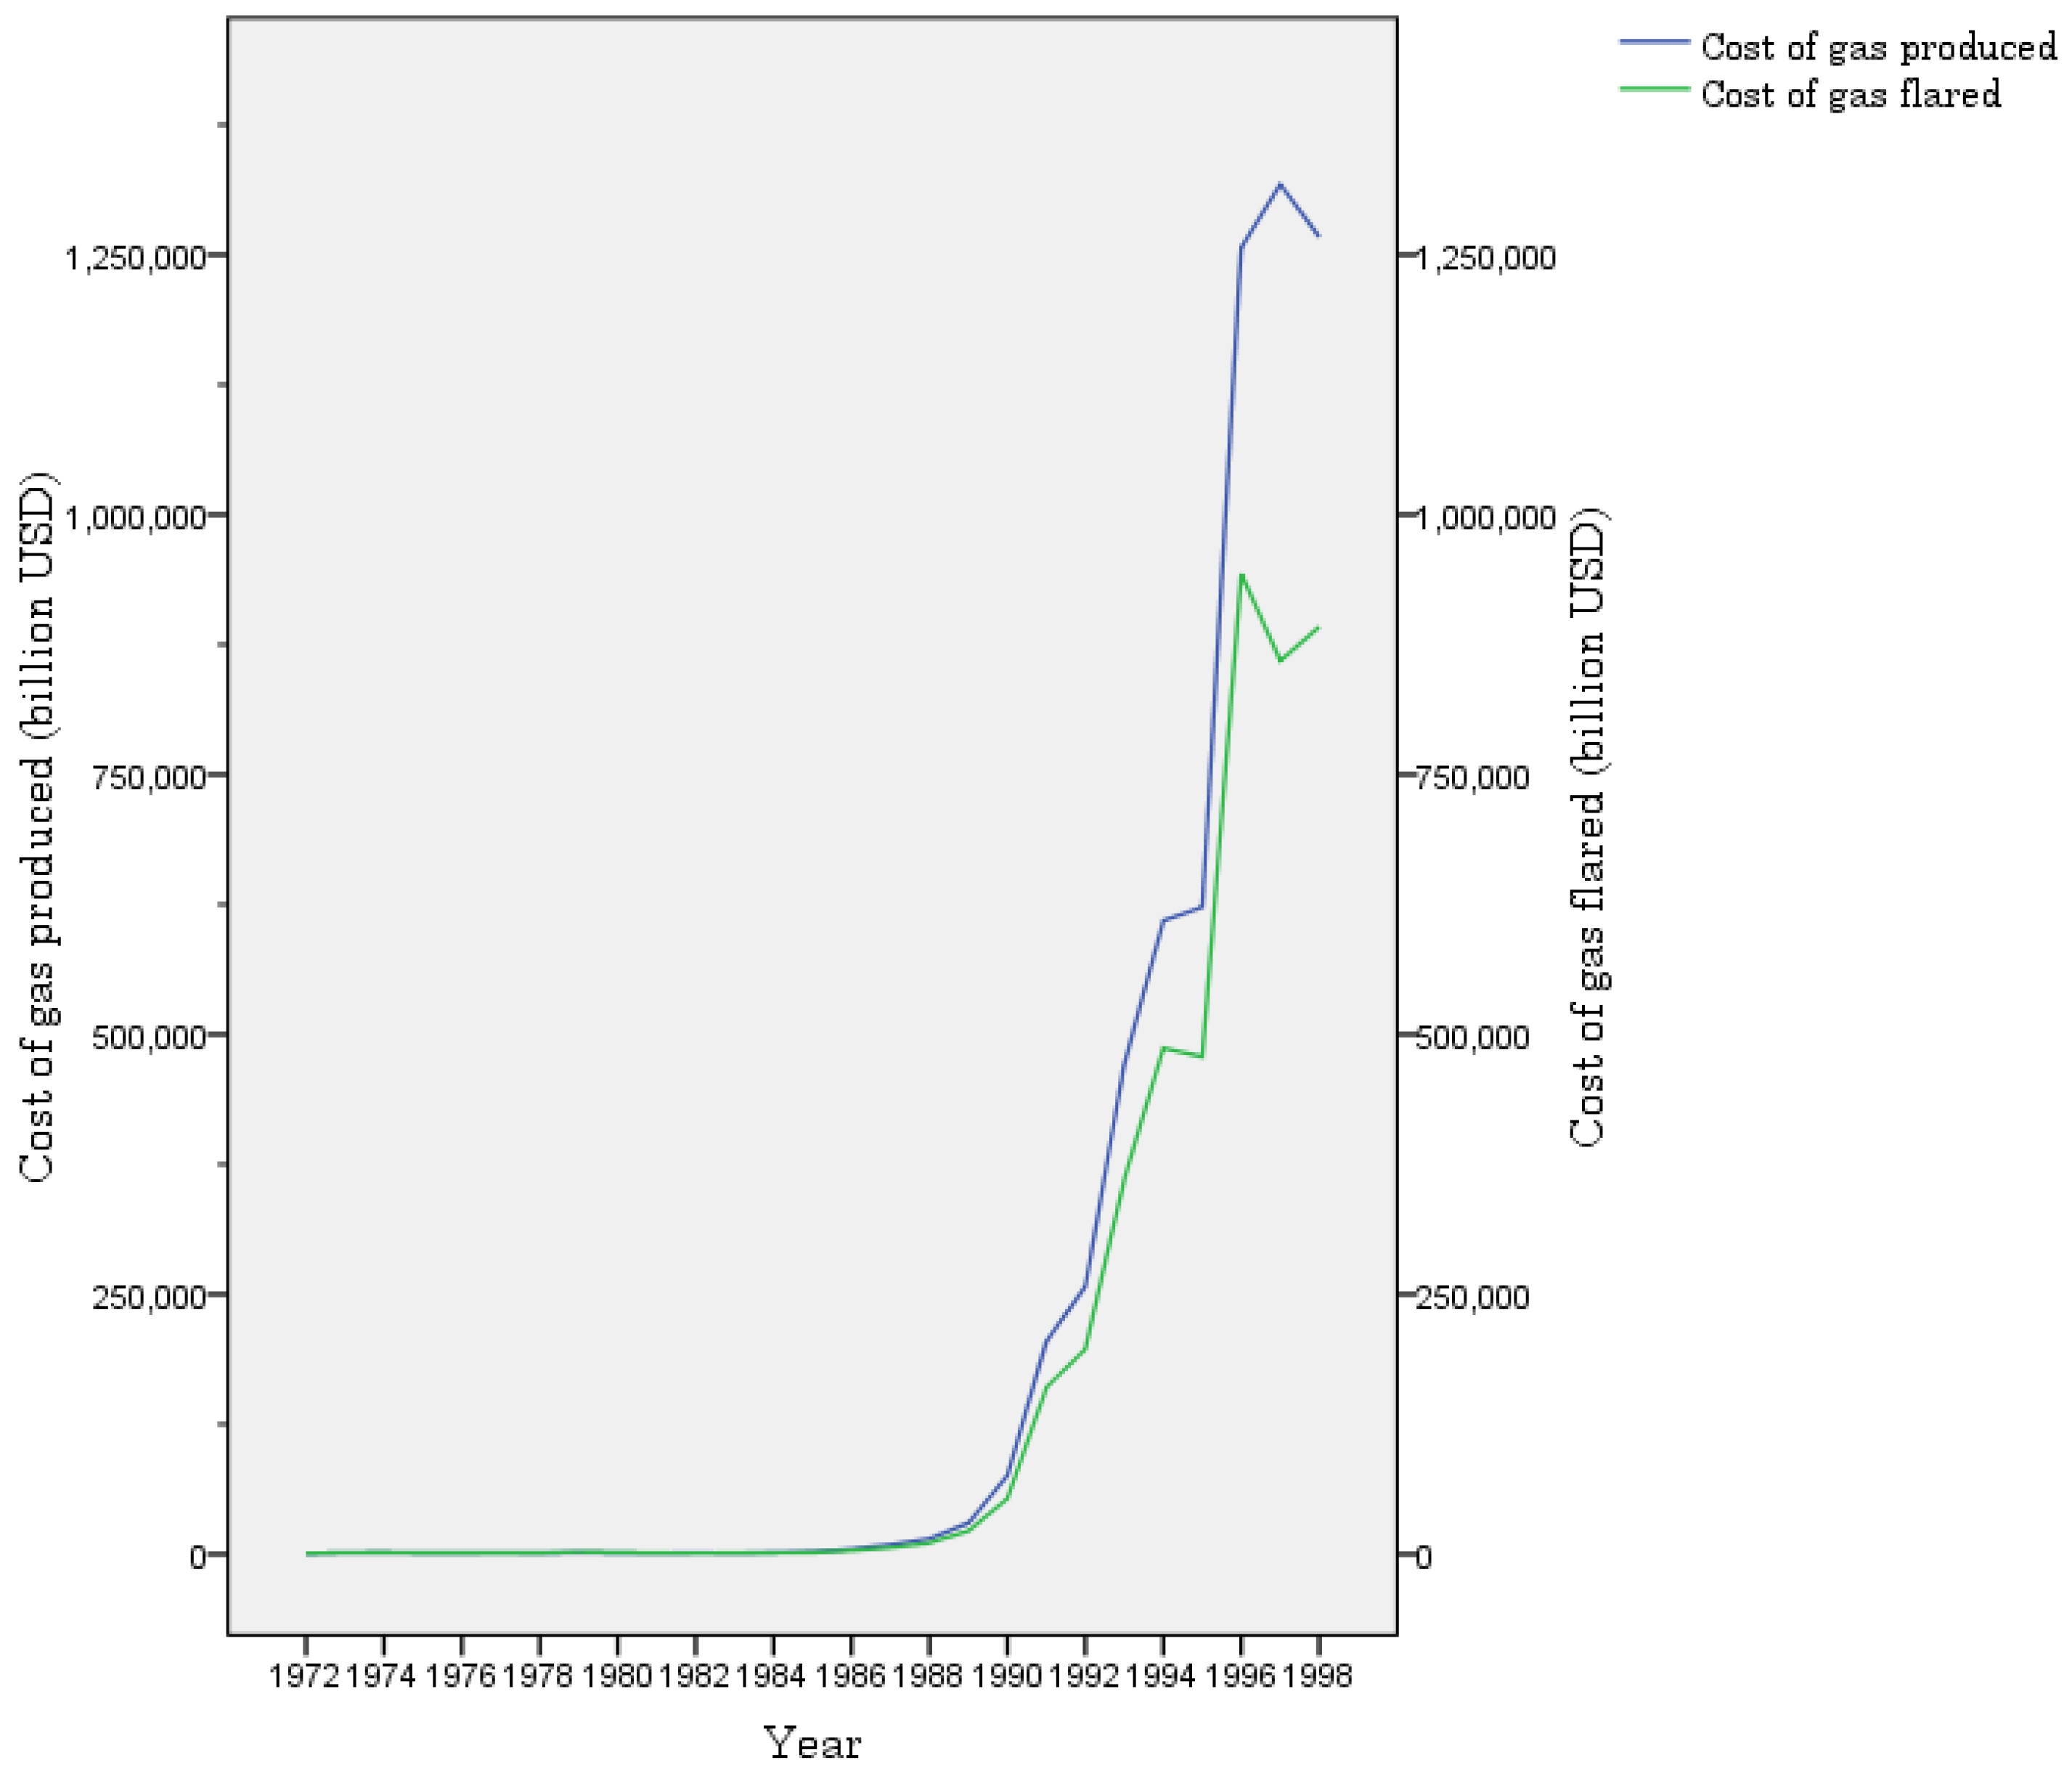
5.2. Cost of Gas Produced and Gas Flared in Nigeria’s Oil And Gas Industry

Data from the report of Okoh [84] and historical exchange rate of naira to USD was used to compute the cost of gas produced and gas flared in Nigeria’s oil and gas industry from 1972 to 1998. Results from the analysis revealed that the total cost of gas flared from 1972 to 1998 was 4,493,348.23 billion USD out of 6,160,462.29 billion USD cost for gas production. Gas flaring in Nigeria’s oil and gas industry is an ongoing occurrence resulting in significance loss of the nation’s resources for every amount of gas produced yearly [3,6,14,15]. Figure 4 shows the annual trend in cost of gas produced and gas flared from 1972 to 1998.

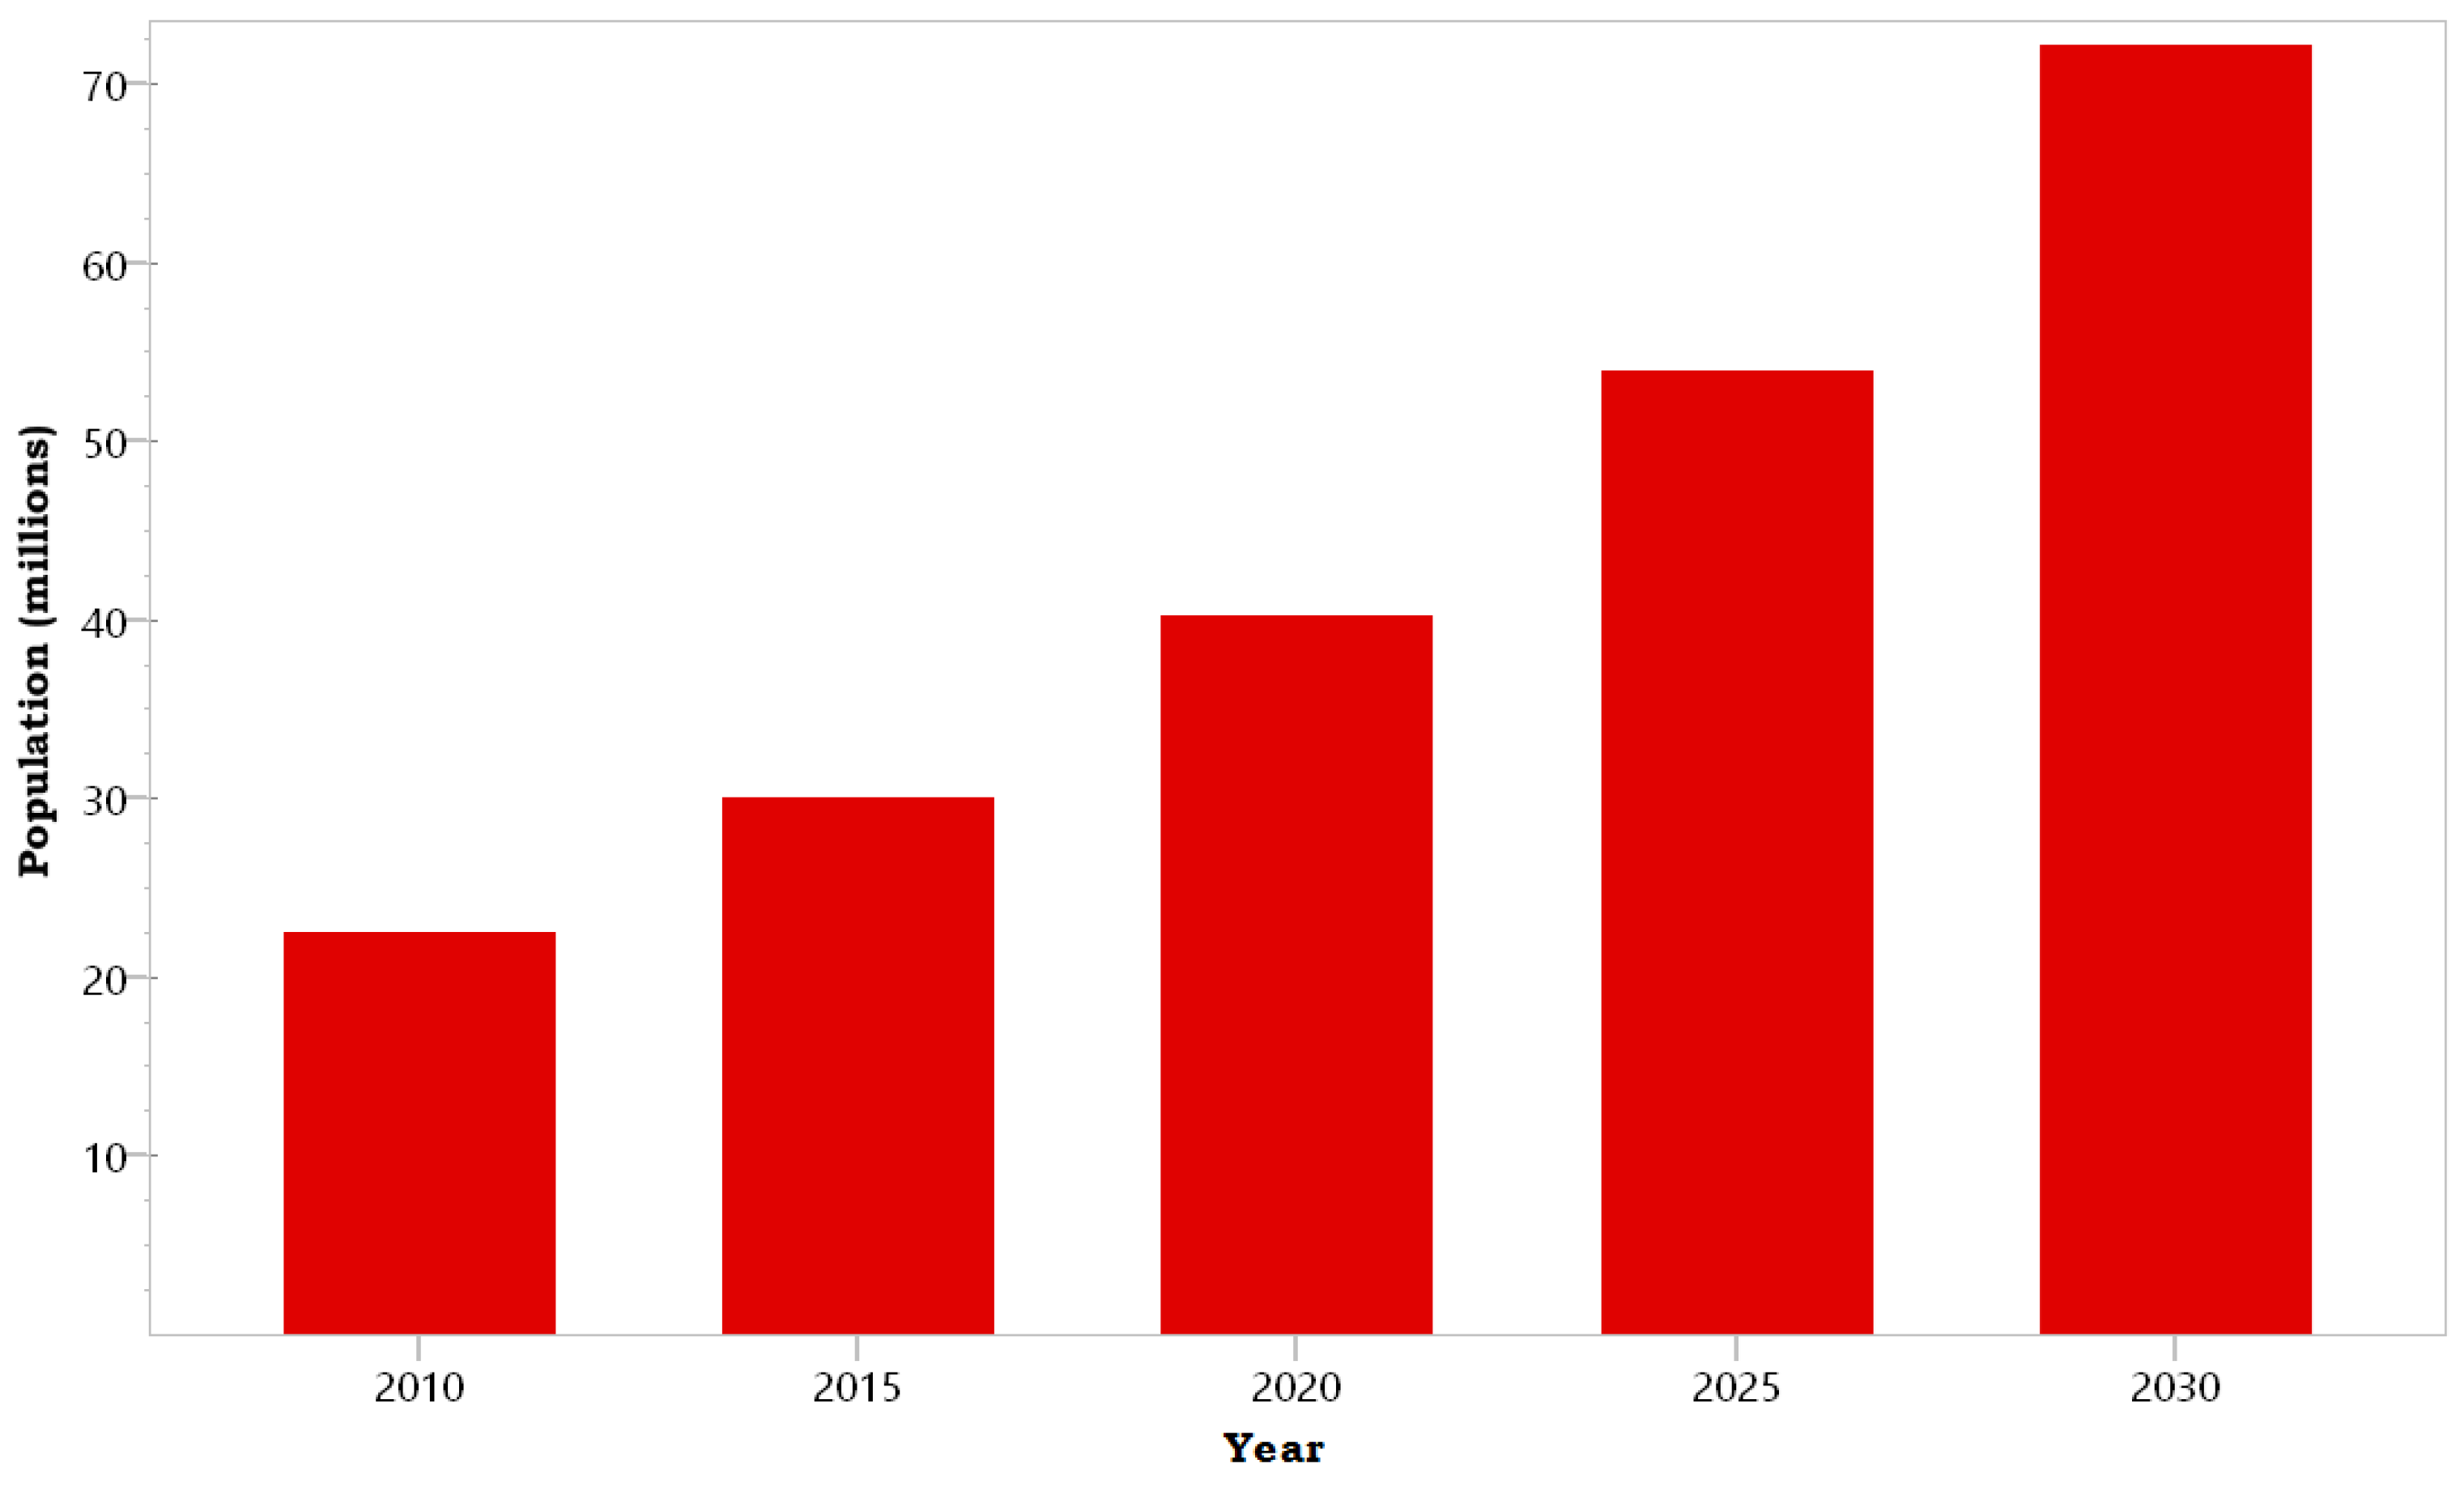
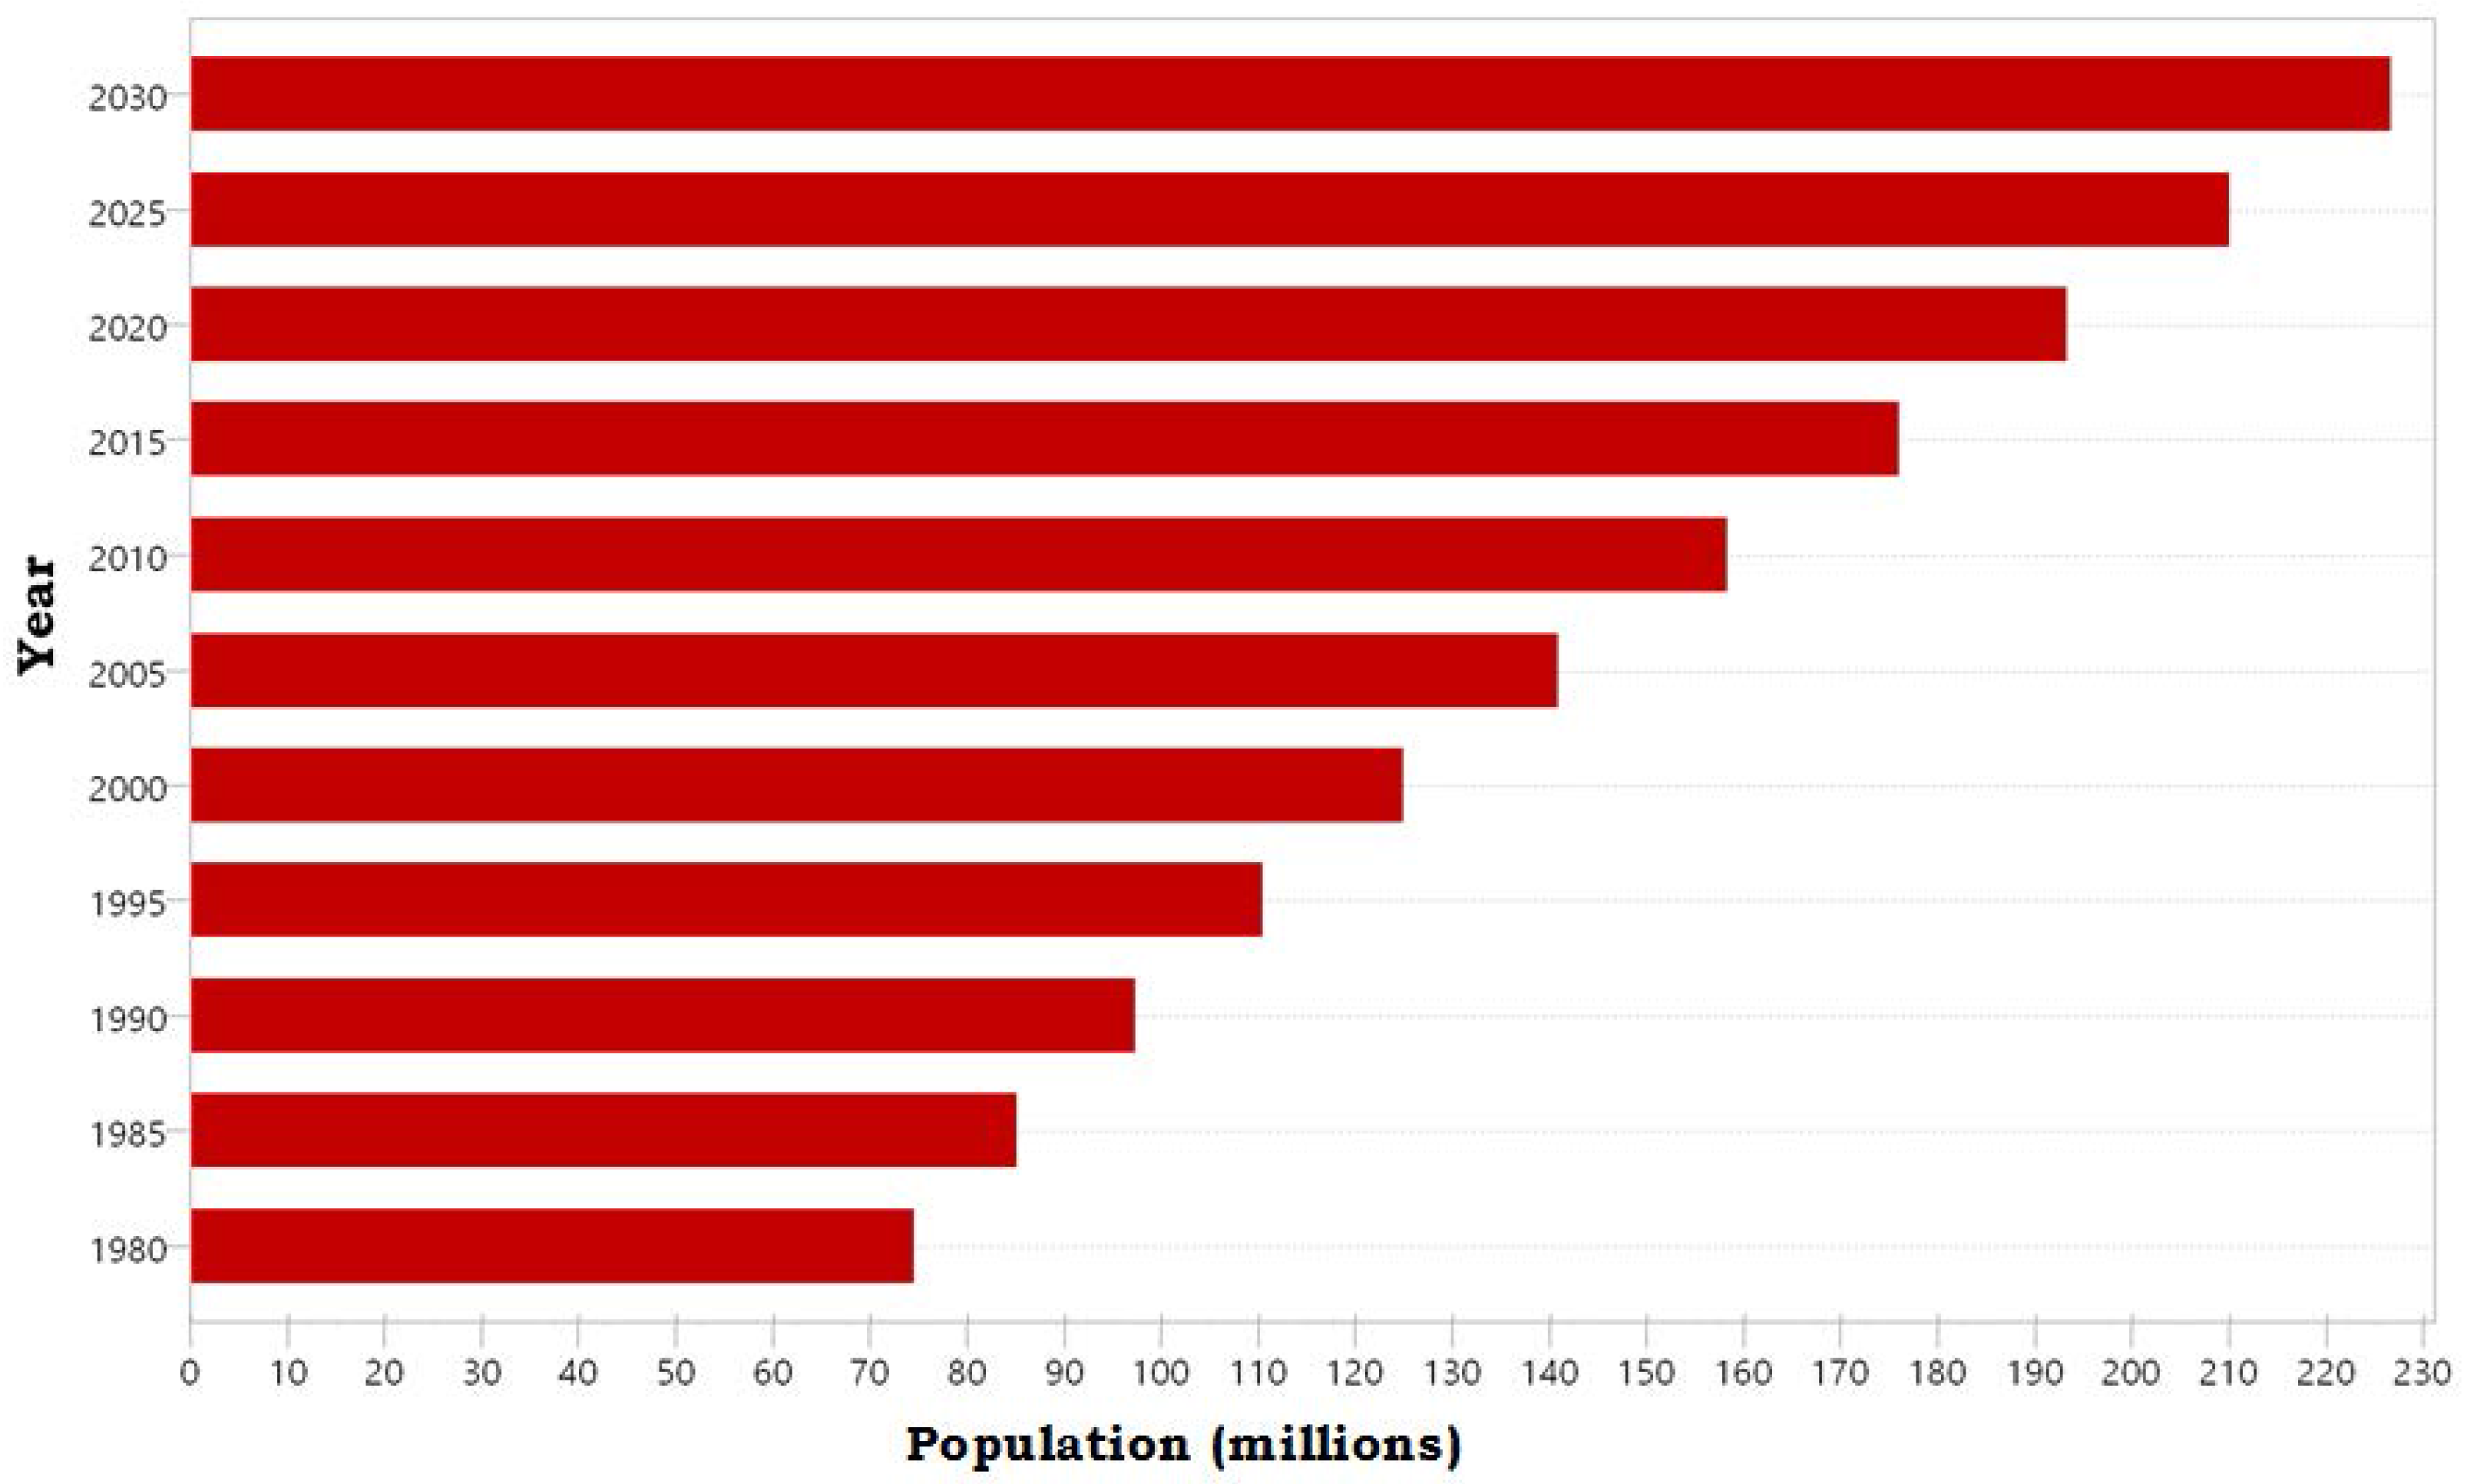
5.3. Population Projection for Lagos State and Nigeria

Results from the study reveals that in the year 2030, the population of Lagos state will be about 72 million people (Figure 5) while at a medium growth rate, Nigeria’s population in the year 2030 will be above 220 million people (Figure 6). This agrees with other studies [61,86,87,88].

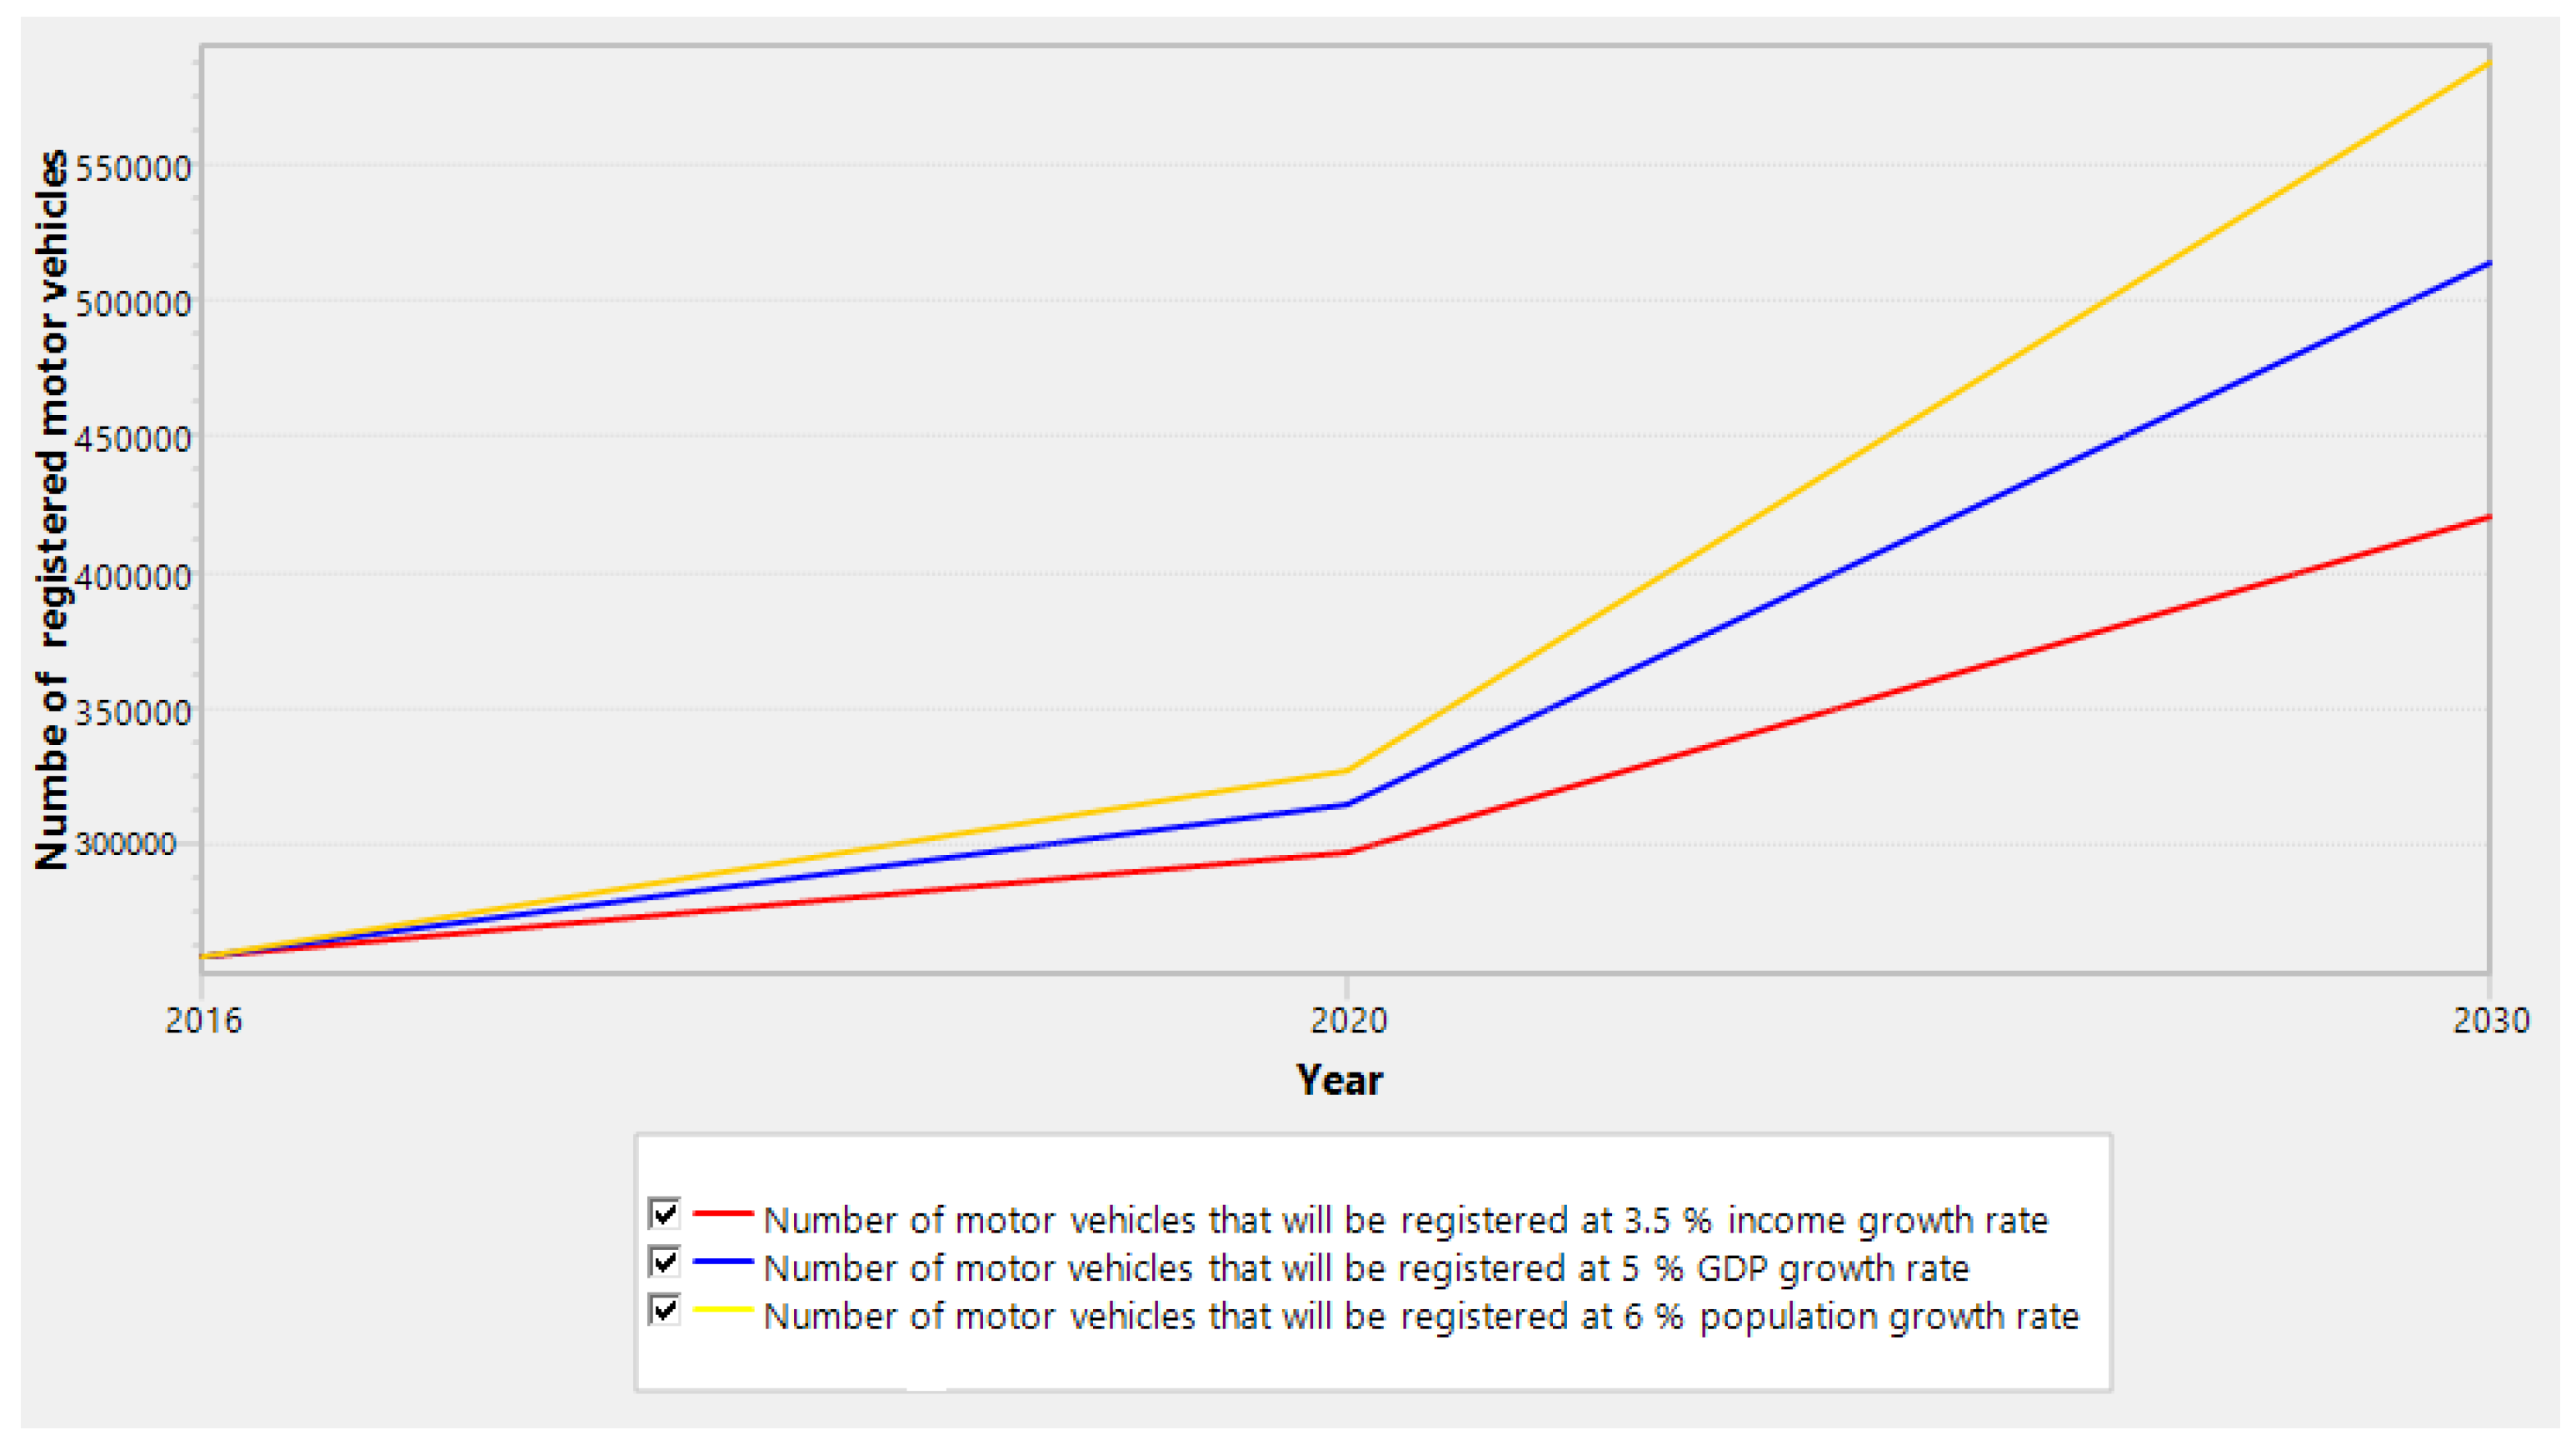
5.4. Total Number of Motor Vehicles That Will Be Registered in Lagos in the Year 2030

In most modernising societies, the demand for mobility especially motorised transport can be associated with economic development and population growth. Studies [89,90,91] reported that population and economic growth are major factors that influence transport demand. Increased transport demand significantly contributes to GHG emissions [92,93,94]. The statistics of total number of registered motor vehicles (Saloon/Station wagon, Van, Pick-up, Lorry/Truck, Minibus, Omnibus, Tanker, Tractor, Trailer and Tipper) in 2011 by Lagos Bureau of Statistics [95] was 259,473. The results from this study shows that the population, GDP, and income of Lagos State in 2030 will be 72 million people, 236 billion USD, and 8,591 USD at growth rate of 6%, 5% and 3.5% respectively. The total number of motor vehicles that will be registered in Lagos state in the year 2030 at this population, GDP, and income with varying growth rate will about 580,000, 510,000 and 420,000 respectively (Figure 7).

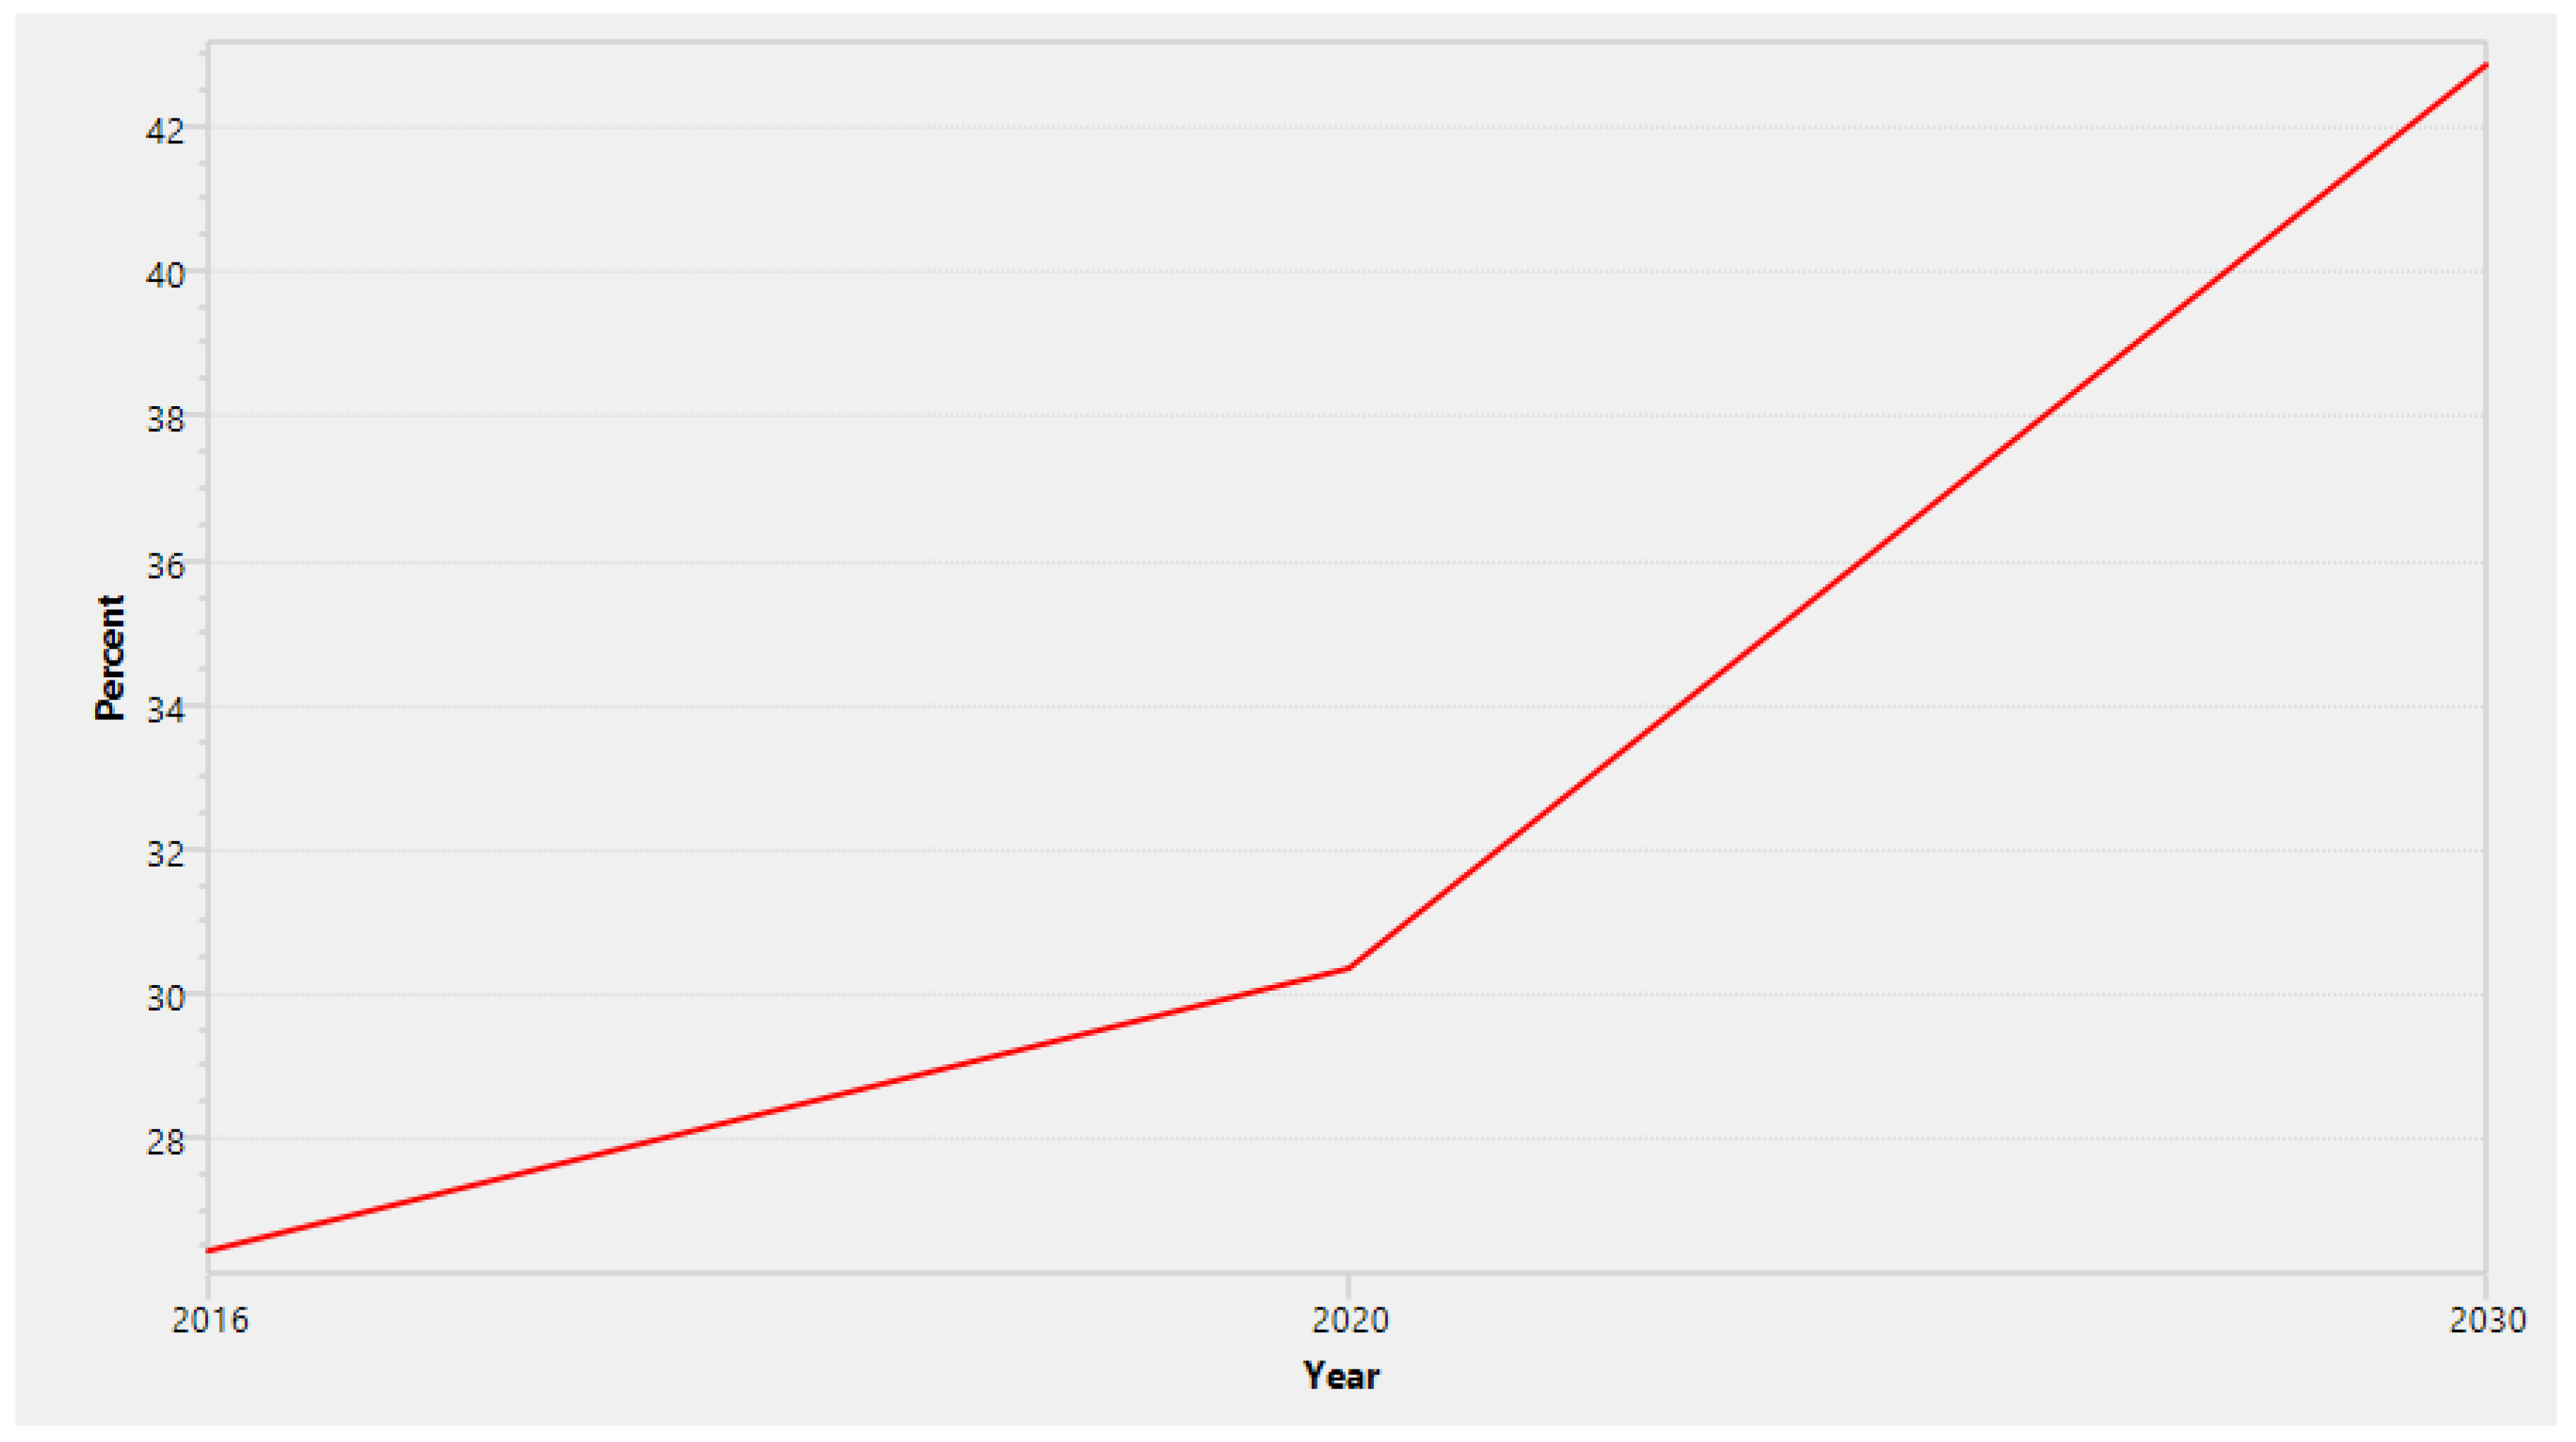
5.5. Contribution of Road Transport to Lagos State GDP in the Year 2030

Lagos Bureau of Statistics [60] report revealed that in the year 2010, road transport sector accounted for 21.3 billion USD to a GDP of 80.61 billion USD representing 26.47%. The results from this study reveals that road transport will contribute about 43 % to the total GDP of Lagos State in the year 2030 (Figure 8).

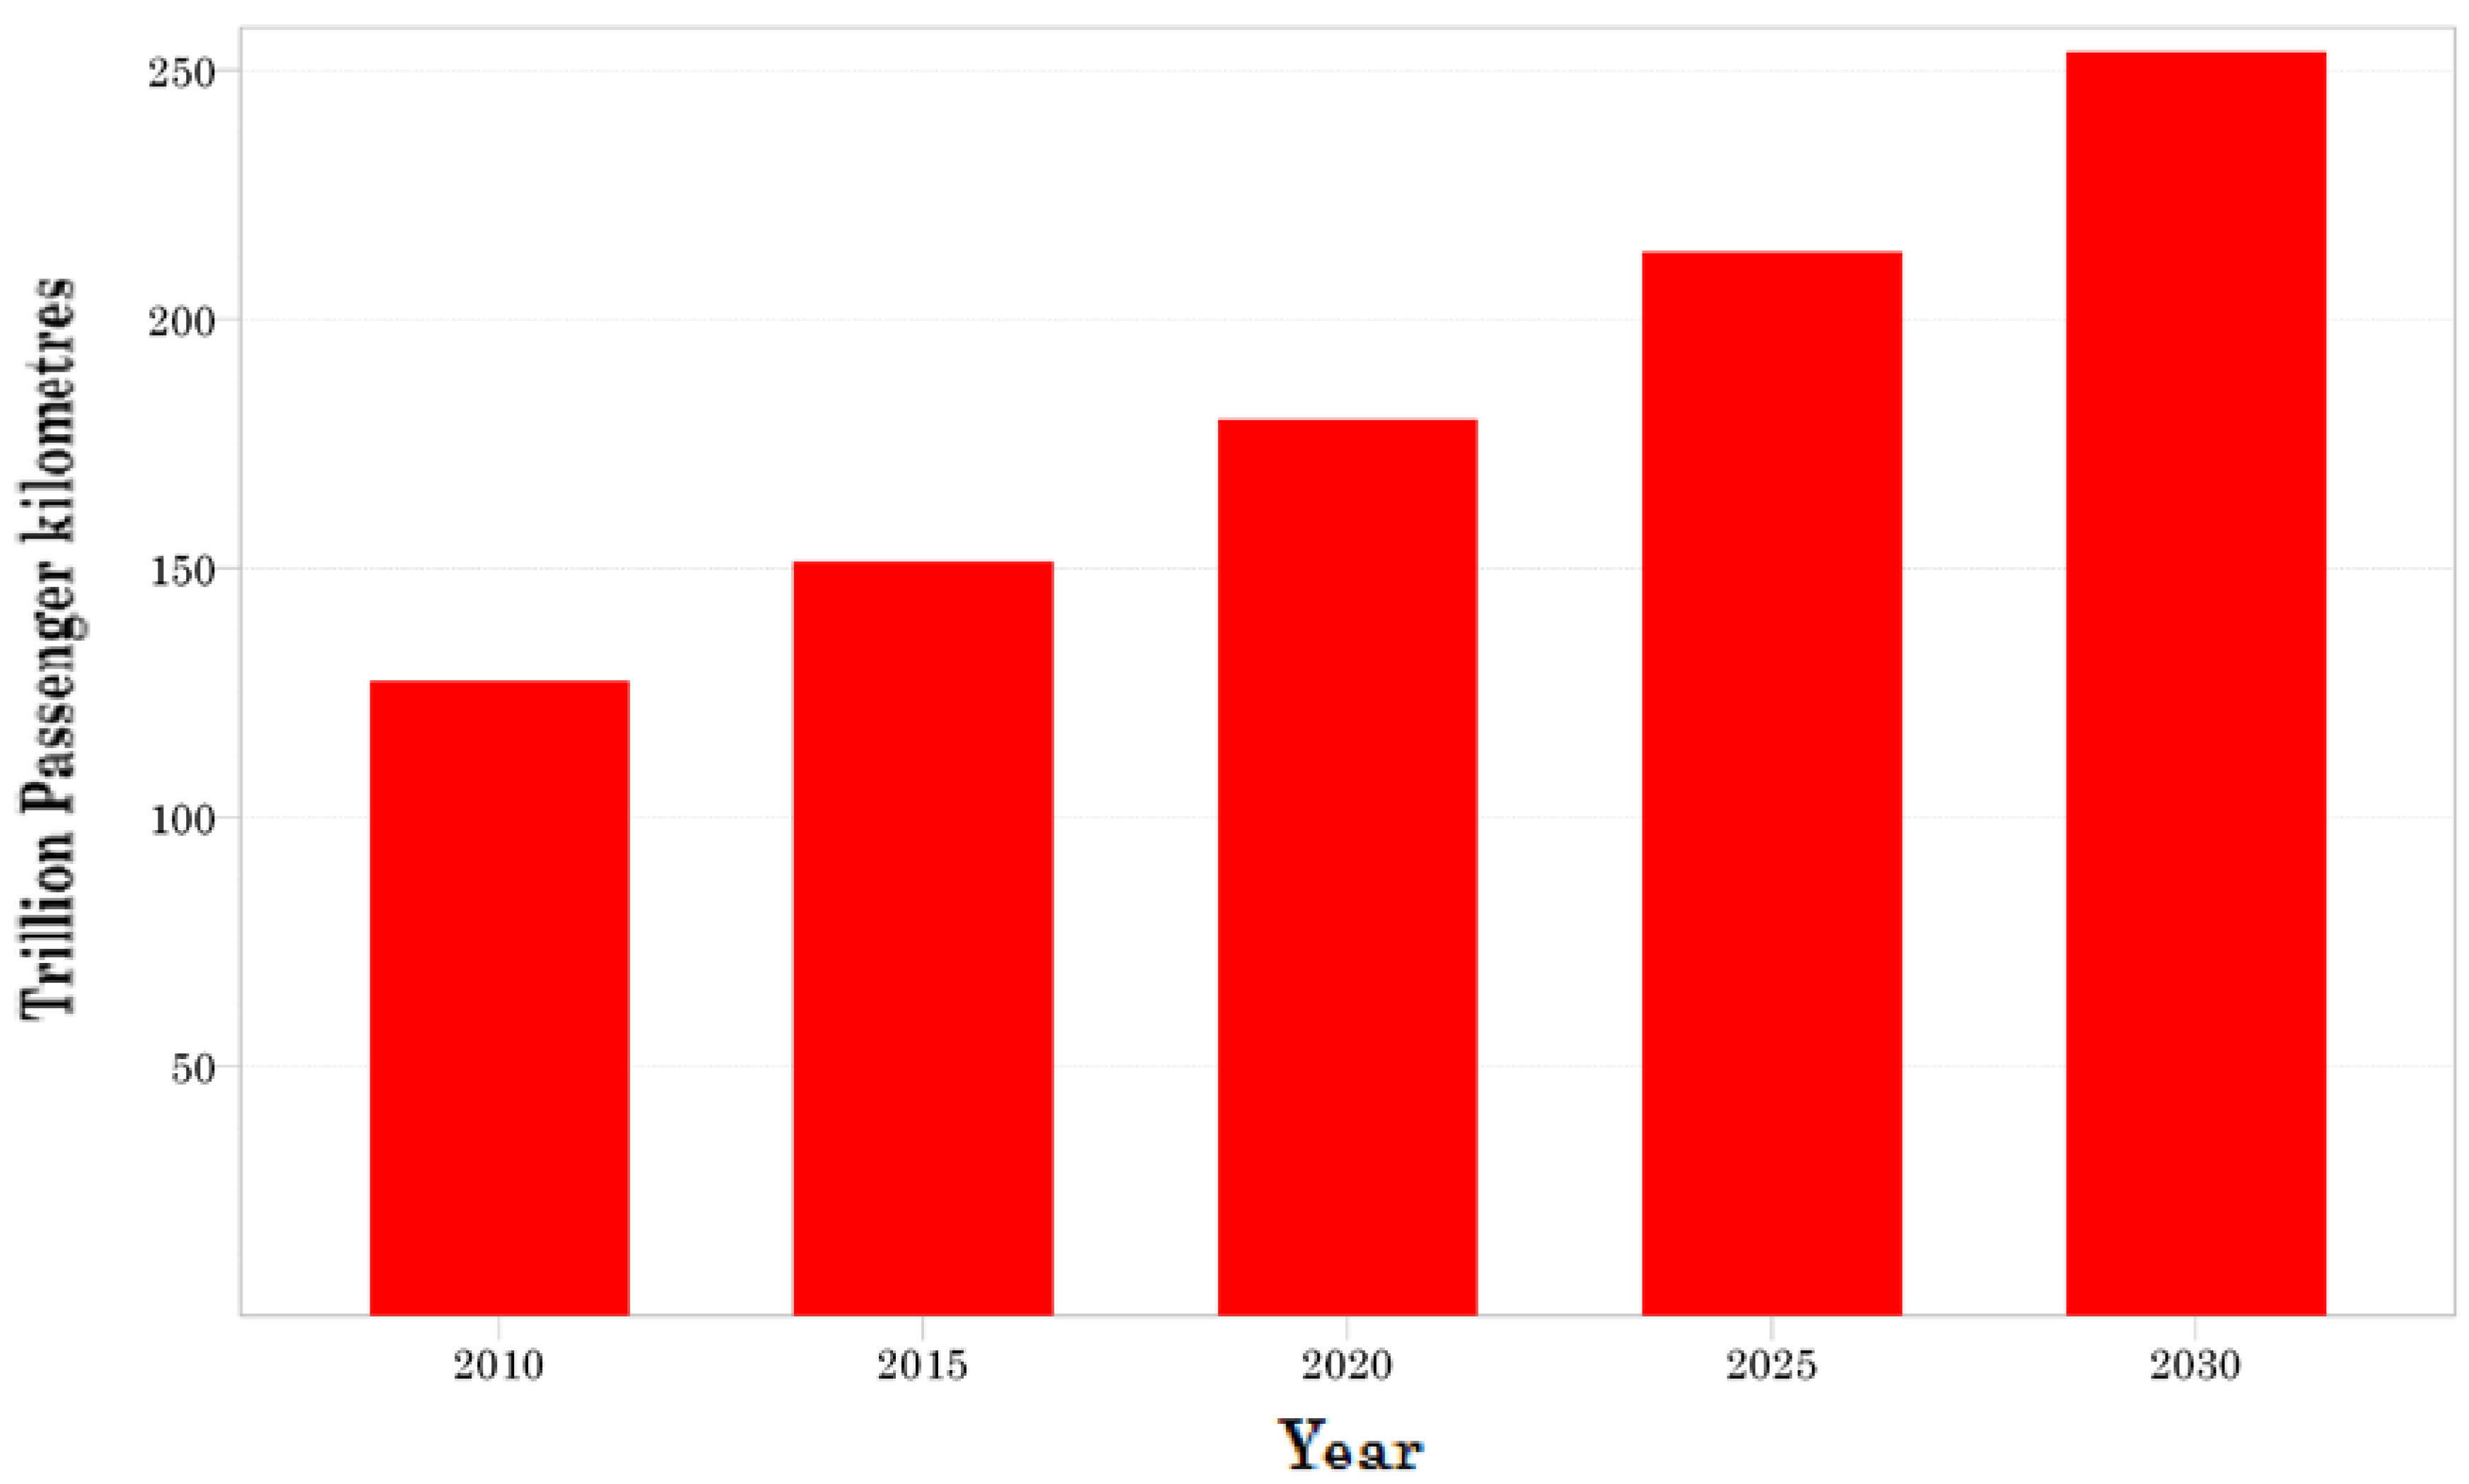
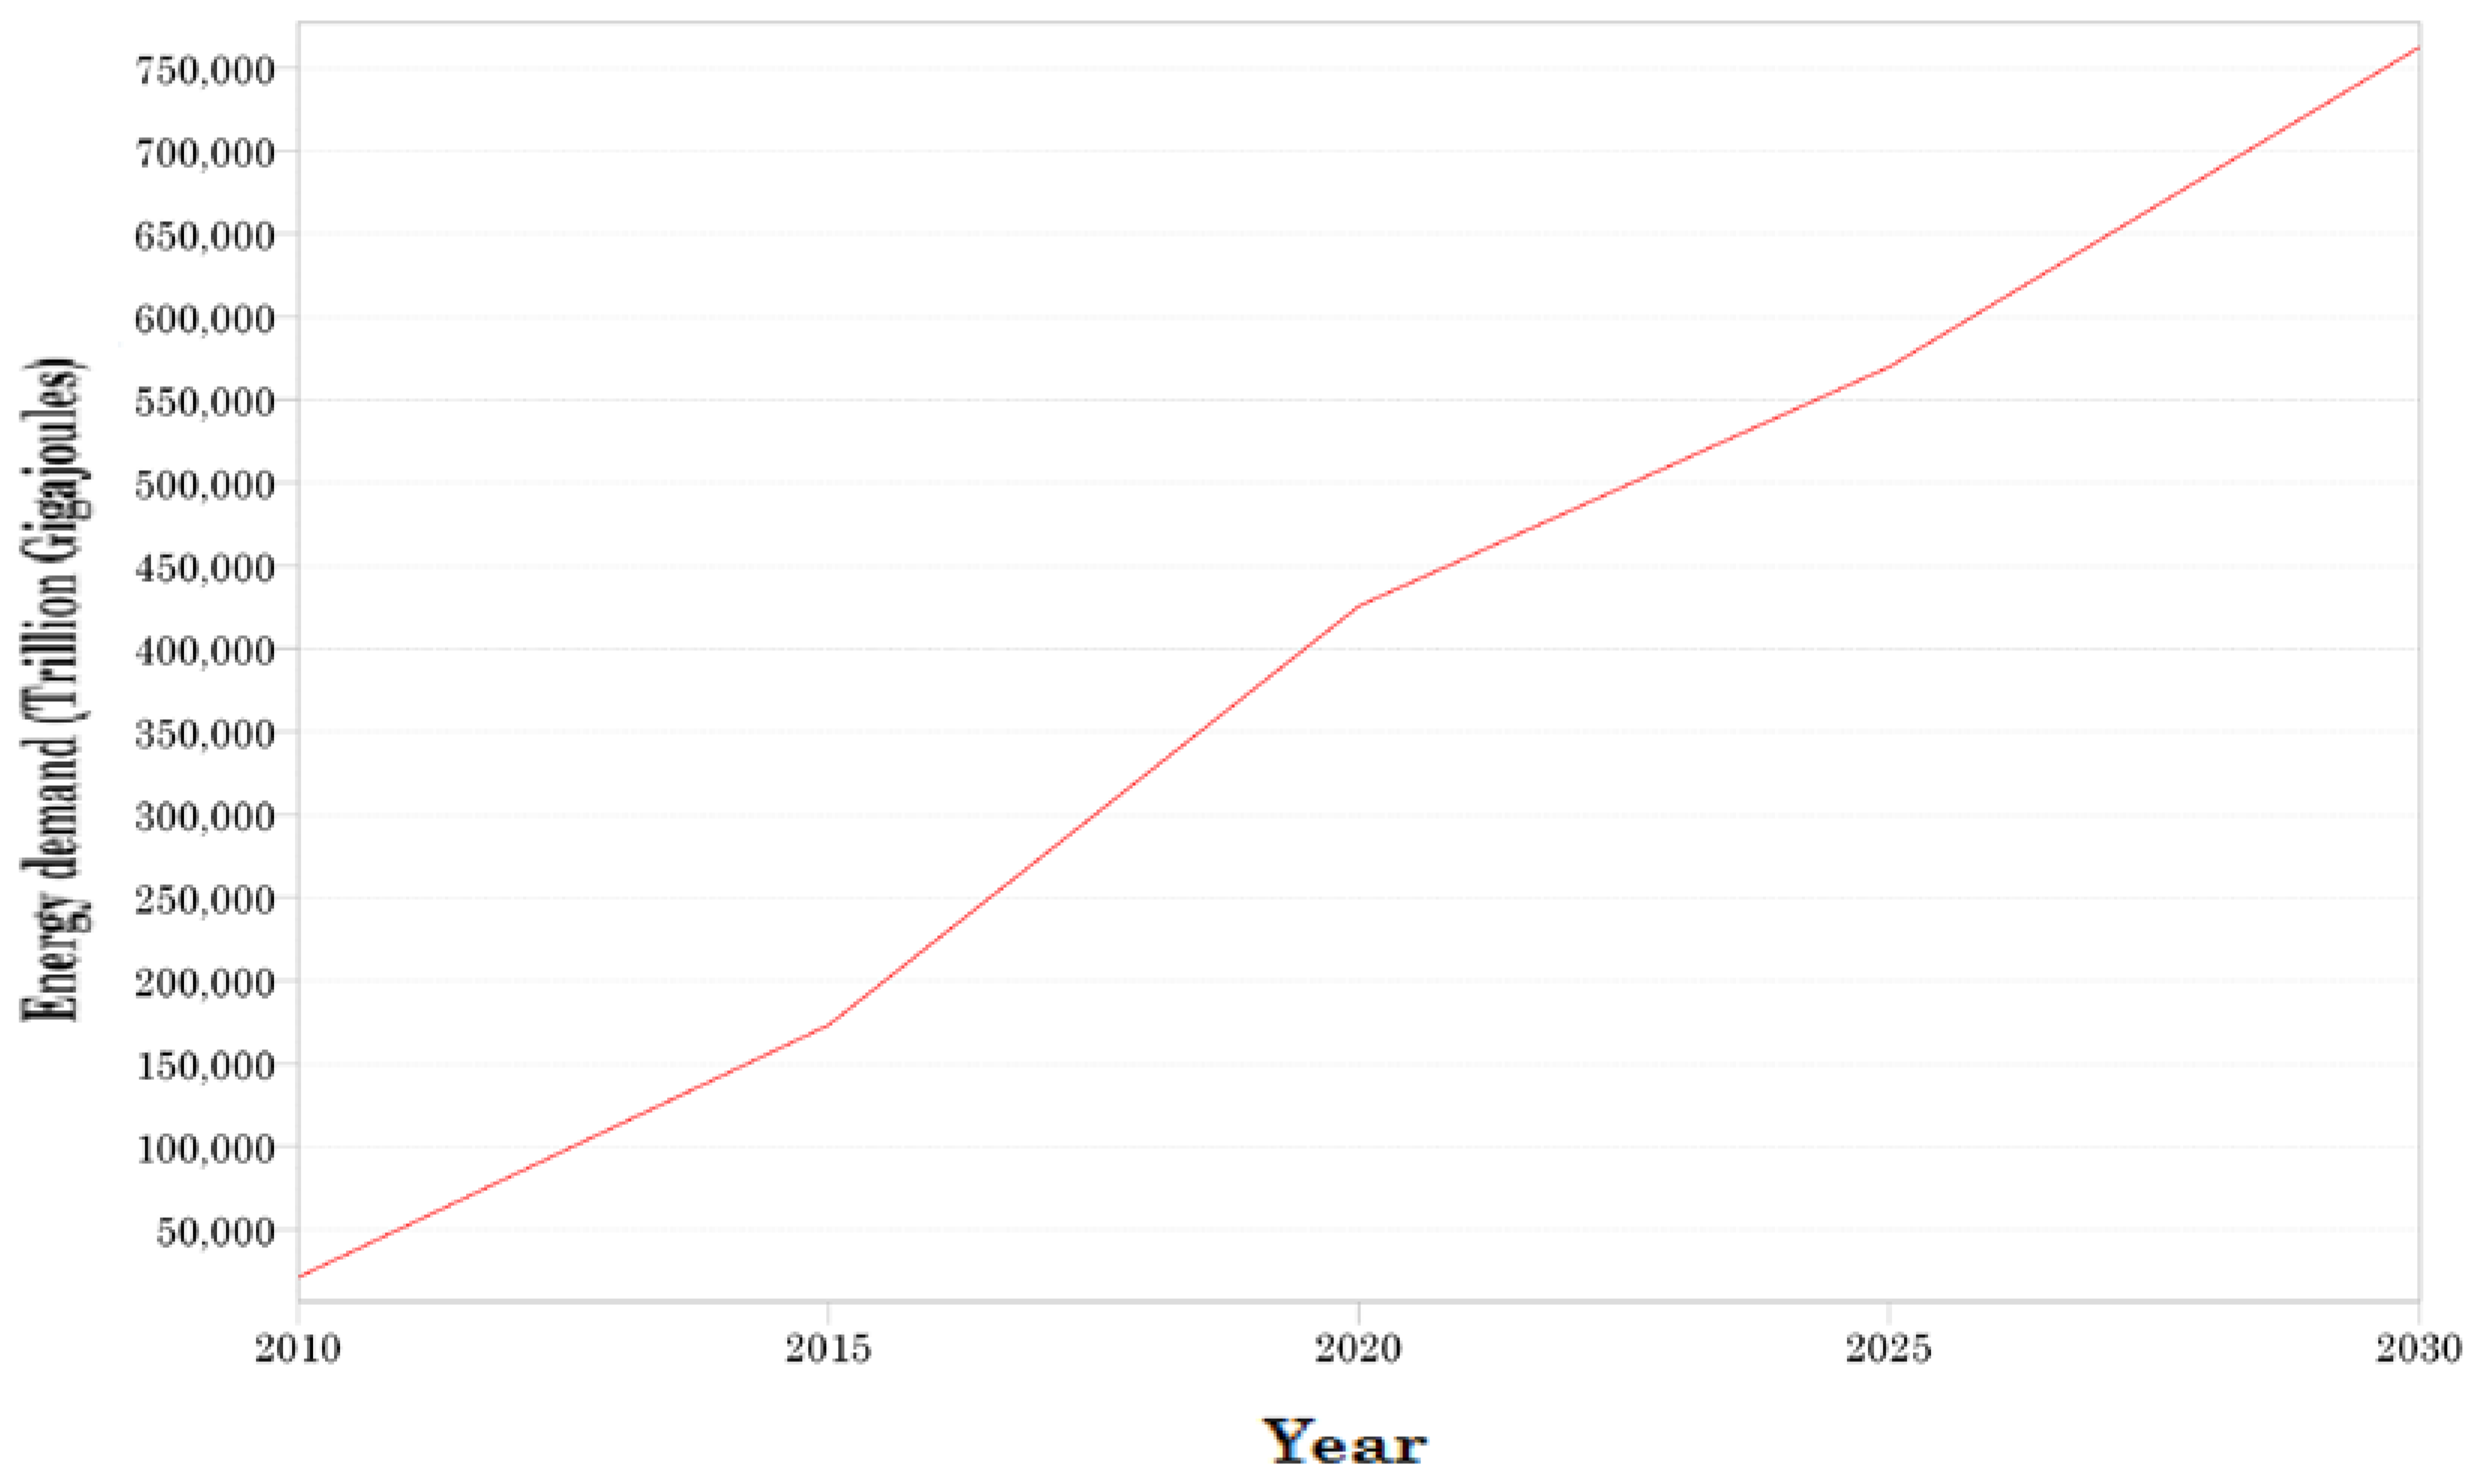
5.6. Passenger Kilometres and Energy Demand on 220 Lagos BRT-Lite (2030 Projection)

The Lagos BRT-Lite will increase from 123 trillion passenger kilometres in 2009 to 253 trillion passenger kilometres in the year 2030 (Figure 9). The energy demand for Lagos BRT-Lite in the year 2030 will be about 760,000 trillion Gigajoules (Figure 10). An increase of 130 trillion passenger kilometres and energy demand of 760,000 trillion Gigajoules projected for 220 Lagos BRT-Lite can be attributed to the population growth rate of 6%. The socio-economic characteristics of the population varies. Hence, a major concern on the observed projected increase in travel demand is the number of the population that can access of the BRT-Lite in the year 2030. The results from a previous study [97] revealed that about 50% of Lagos inhabitants have attained reasonable resources to access the BRT buses while about half of the population is disadvantaged due to their socio-economic status. Inadequate accessibility and affordability of transport are major features of poor services in transport delivery especially public transport. Adequate access to transport is important for socio-economic development as it plays significant role in human welfare, economic opportunities and social benefits [97].

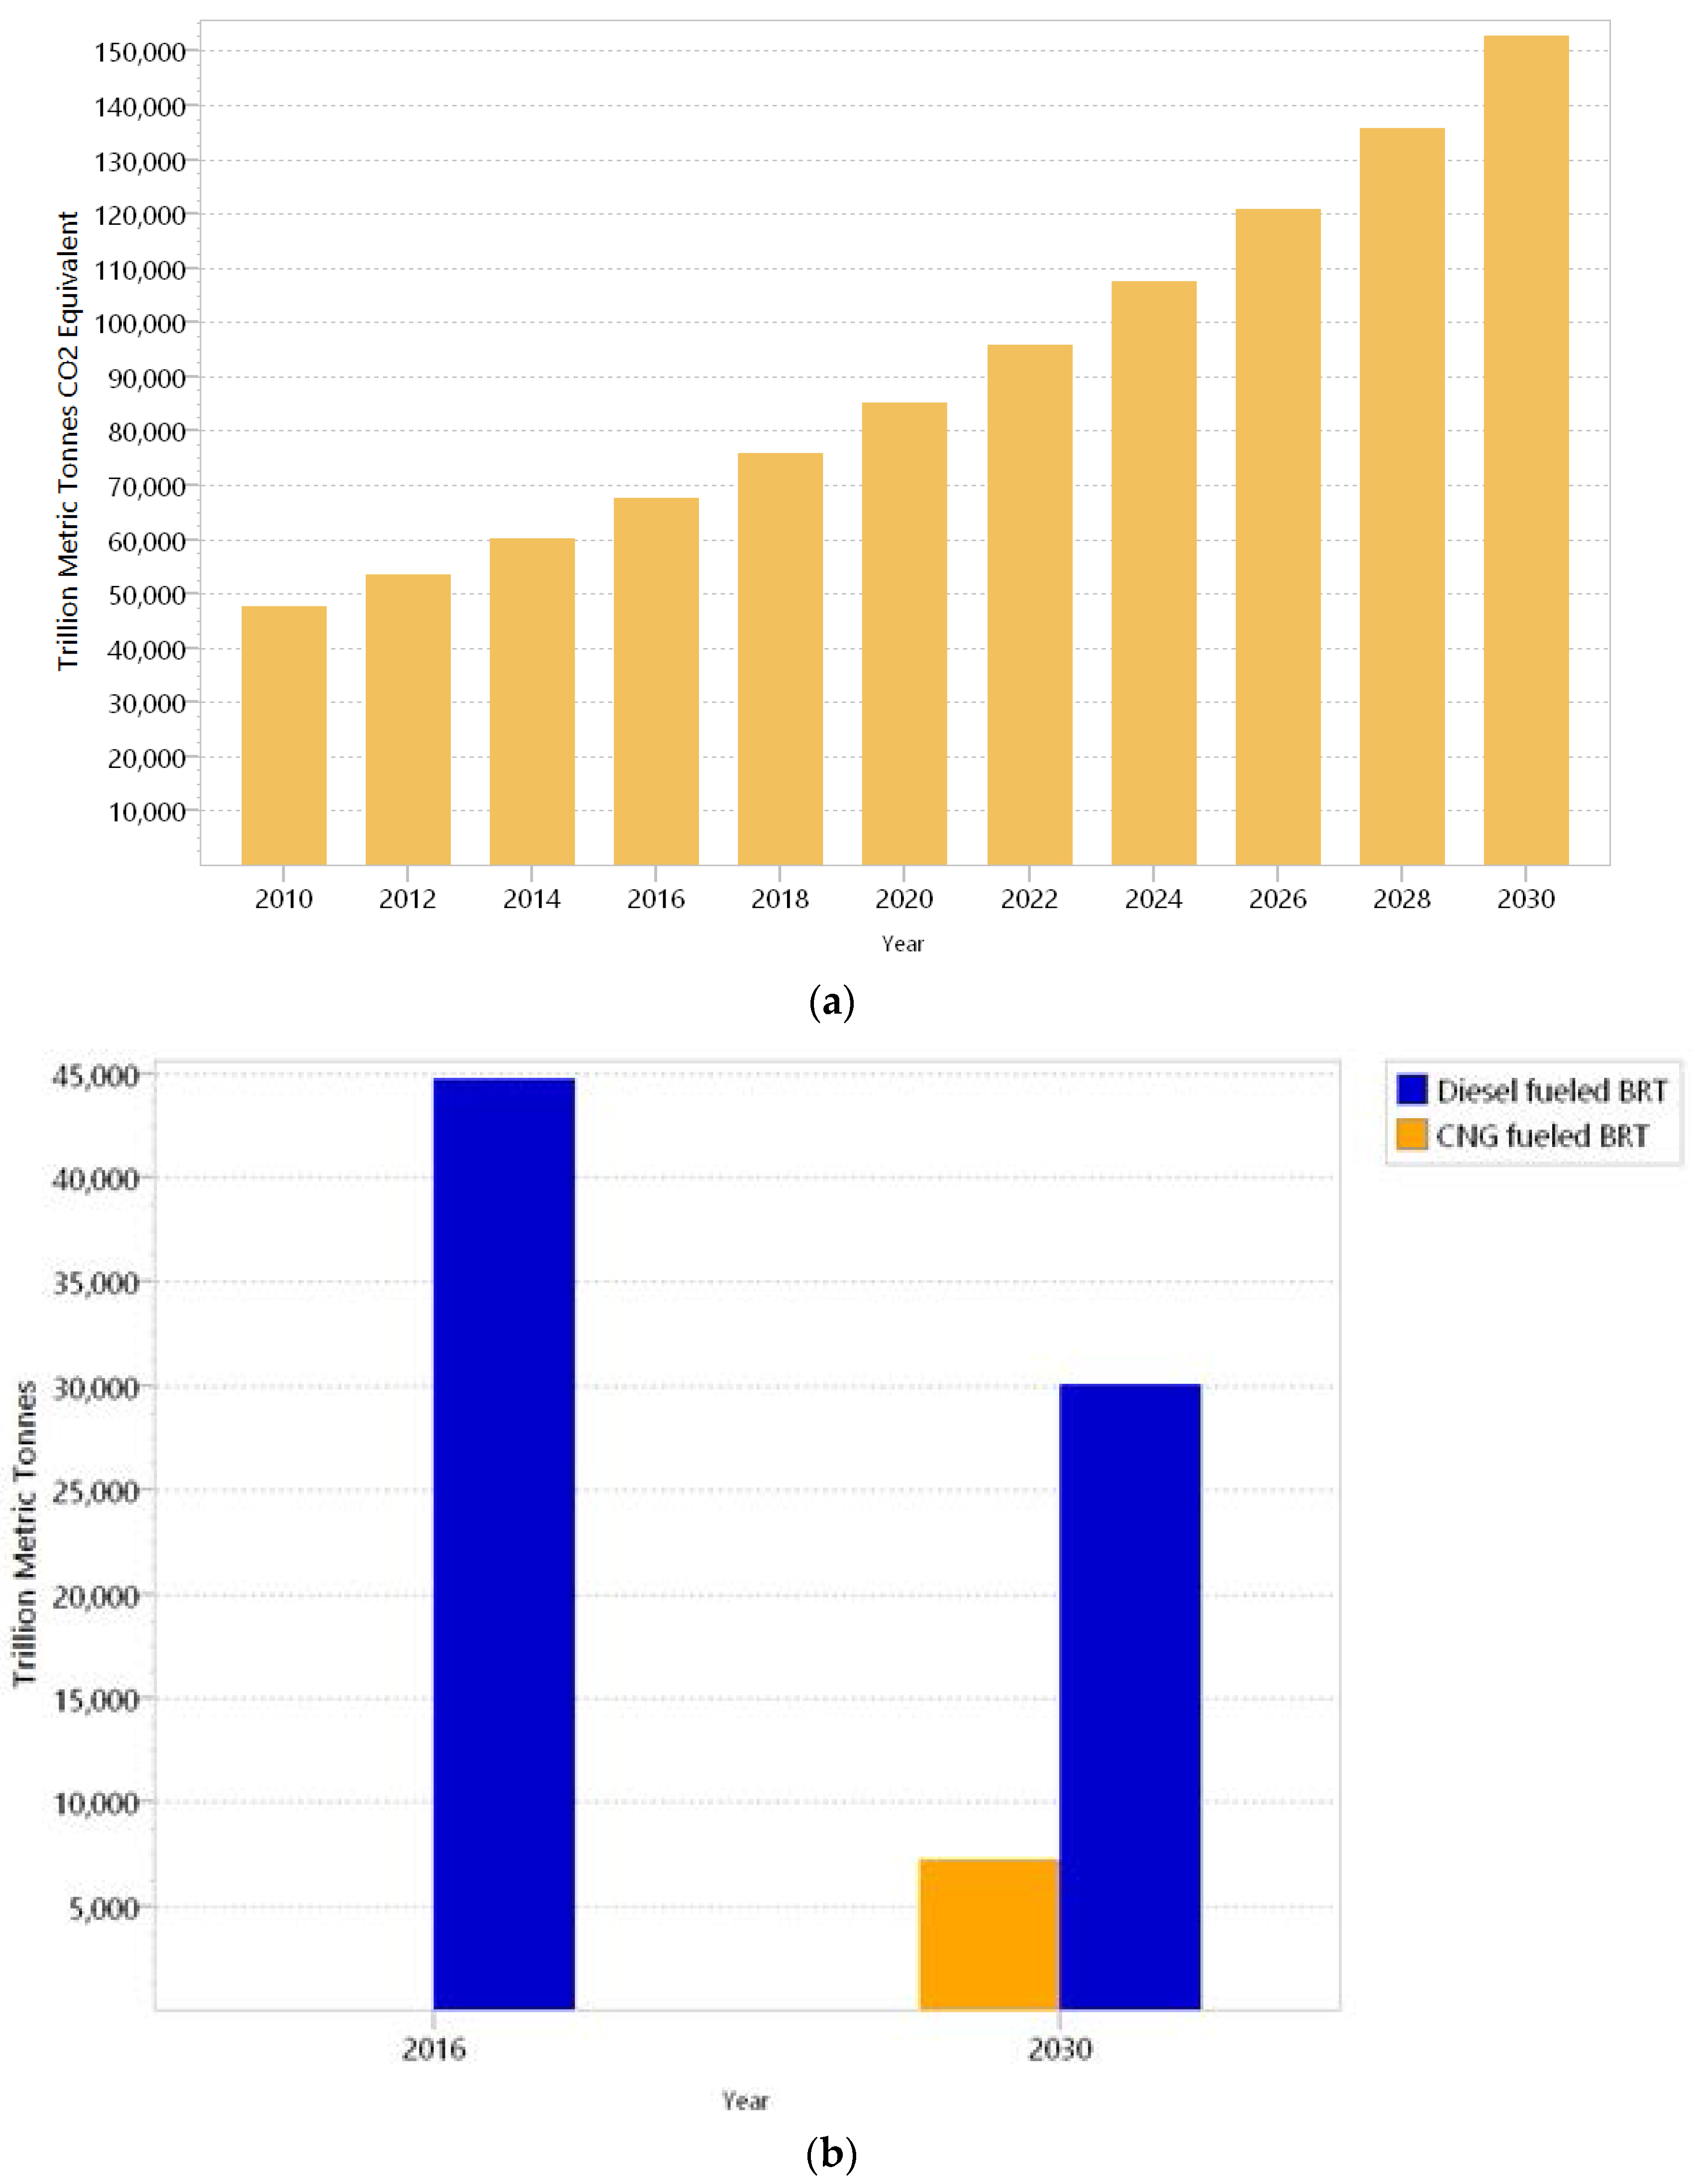
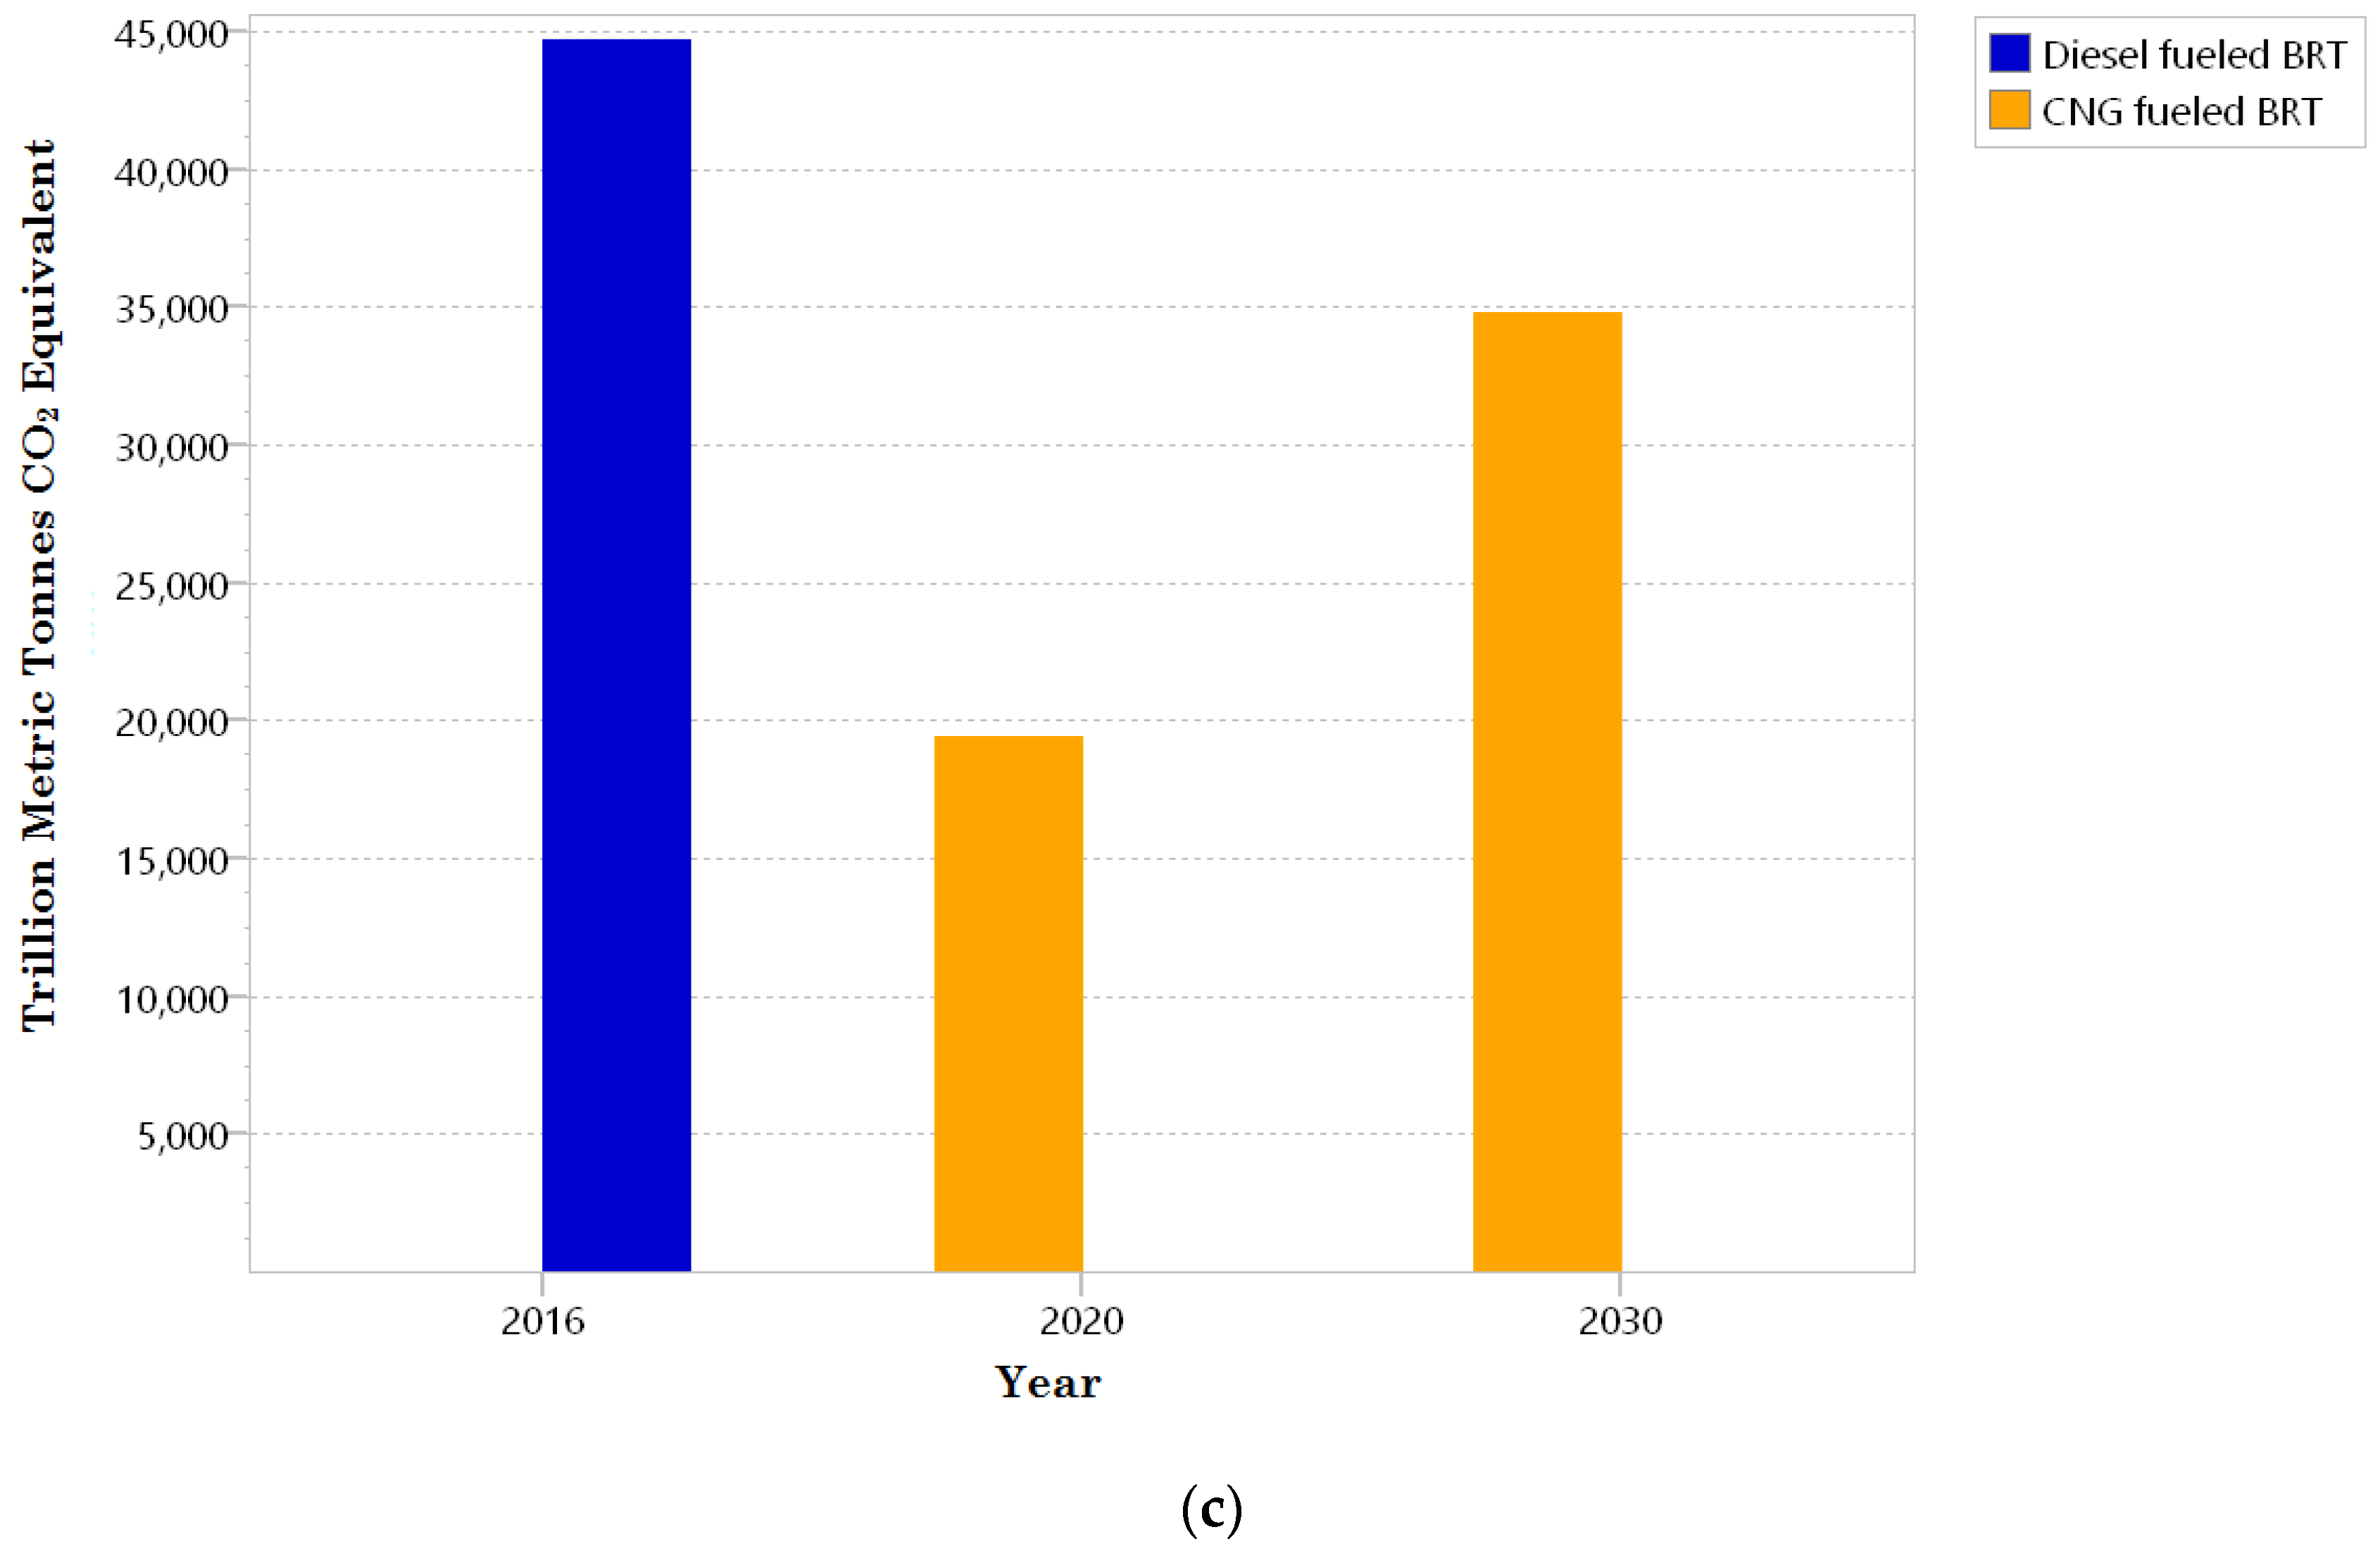
5.7. The Use of Compressed Natural Gas Produced from Flared Gas for Transport Fuel: Lagos BRT-Lite

• Lagos BRT-Lite Carbon Dioxide (Non-Biogenic) emission: Scenario 1 (BAU)
The CO2 (non-biogenic) emission from the Lagos BRT-Lite under business as usual scenario in 2030 will be 152,000 trillion metric tonnes (Figure 11a).
• The Use of CNG for 100 units of Lagos BRT-Lite (scenario 2)
The use of CNG for 100 units of Lagos BRT-Lite in the year 2016 will reduce the CO2 emissions to 30,000 trillion metric tonnes from 152,000 trillion metric tonnes of diesel fueled BRT under business as usual scenario while the CO2 emissions from the 100 units converted to CNG will be about 7,000 trillion metric tonnes (Figure 11b).
• The use of CNG for 220 Units of Lagos BRT-Lite (scenario 3)
The complete utilisation of CNG for the 220 units of Lagos BRT-Lite in the year 2020 will reduce total CO2 emissions to 34,000 trillion metric tonnes from 152,000 trillion metric tonnes of diesel fueled BRT under business as usual scenario (Figure 11c).
The results from the analysis in this study show that switching from diesel to CNG as transport fuel for Lagos BRT-Lite reduced CO2 emissions. Under the mitigation scenario, the complete utilisation of CNG for the 220 units of Lagos BRT-Lite in the year 2020 will reduce CO2 emissions compared to diesel fuelled BRT under business as usual scenario. The environmental benefits from the replacement of diesel with CNG as vehicle fleet fuel is on the increase globally. Among other alternative fuels, CNG is a preeminent option for green transportation fuel [98]. On a well-to-wheels basis, CNG produce less greenhouse gases as compared to conventional gasoline and diesel vehicles and when used in public transportation can contribute to the improvement of urban air, reduce adverse health effects and social costs of air pollution [99]. In compliance with Euro-4 and SULEV emission limits, CNG operation in small sedan (model year 2000 and a curb weight of 1020 kg) reduced 30% CO2 emissions compared to gasoline vehicle with similar configuration [100]. Dondero and Goldemberg [101] reported an average reduction of 20% in CO2 emissions from the conversion of 21 gasoline light vehicles (24% of GMBlazer vehicles, 28% of VW Kombi vehicles and 48% of VW Quantum vehicles) to CNG. The comparison of CO2 emissions of 1.5 L, 4-cylinder Proton Magma retrofitted spark ignition car engine fueled by gasoline and CNG under steady state operating conditions revealed that the retrofitted CNG fuelled engines reduced CO2 emissions by about 20% compared to the gasoline [102]. Tsutsumizaki and Kuroki [103] reported 33% reduction in CO2 on two-wheeled vehicles fueled with CNG compared to 125 cm3 class gasoline-fueled scooter which was a proto-type two-wheeled vehicle used in the study. In contrast, Alvarez et al. [104] reported that switching from gasoline or diesel vehicles to CNG vehicles showed increase in radiative forcing of the climate for 80 or 280 years respectively. Consequently, the study [105] suggests that net climate benefits from switching from gasoline or diesel vehicles to CNG vehicles are expected after these years.

5.8. Constraints to Non-Realization of Flare Reduction Policy in Nigeria’s Oil and Gas Industry

Market and institutional barriers are the major hindrances to the realisation of policies to mitigate gas flaring in Nigeria. Such hindrances include: lack of necessary technology capture and convert the gas flared to productive use; high cost of investment needed for gas infrastructure such that it is cheaper to wastefully burn the associated gas than to invest in gas utilization/reinjection schemes; unclear or incomplete disclosures of information on environmental sensitive activities and data needed to tackling climate change impacts; limited and non-competitive market for gas and its related products; government’s failure to meet its financial contribution under the existing joint venture; evidence of general lack of environmental concern by companies operating in the upstream sector for the apparent negative environmental consequences of gas flaring; lack of clearly defined long-term vision for the gas sector; lack of robust fiscal, legal, and regulatory framework to interface with foreign investors; ccorruption and insecurity in the Niger Delta region of Nigeria [3,6,15,105].

6. Conclusions

Reducing CO2 emissions from gas flaring in Nigeria’s oil and gas industry through alternative productive use is important to achieving the nation’s commitment to reducing GHG emissions below its 1990 level. It will also contribute to social and industrial growth, meet energy demands and secure a productive economy. The use of CNG produced from flared gas as an alternative fuel for Lagos BRT-Lite in the study revealed reduction of CO2 emissions. Other utilization options for flared gas from the Nigerian oil and gas industry include Gas to Liquid (GTL), Liquefied Natural Gas (LNG), Liquefied Petroleum Gas (LPG), gas to fertilizer (GTF) and the recapture of flared gas to generate electricity.
Further studies should include the analysis of the volume of CNG that can be produced from recaptured flared gas and also financial strategies for the initial cost of recapturing flared gas. In addition, detailed analysis of other greenhouse gases flared in the sector is important. Since methane (CH4) has higher effect on radiative forcing than CO2, reductions of CH4 leakage from natural gas infrastructure and use (reductions of CH4 leakage across the fuel cycle) are very vital to increasing the climate benefits of natural gas [104]. Similarly, Camuzeaux et al. [106] suggested that climate benefits can be achieved from switching heavy-duty truck fleet from diesel to natural gas by combining significant well-to wheels methane emissions reductions and enhancement of natural gas vehicle efficiency.

Acknowledgments

The authors would like to thank the New Zealand Development Scholarship under New Zealand Aid Programme for funding this research.

Author Contributions

Iduh J.J. Otene designed the research, collected and analyzed data and also contributed to the review of literature; Phil Murray supervised the study with detailed advice on methodology, results and proof reading; Kevin E. Enongene contributed to the writing and revising of the manuscript.

Conflicts of Interest

The authors declare no conflict of interest.

References

  1. Energy Commission of Nigeria (ECN). Energy Implications for Vision 2020 and Beyond. Available online: http://www.energy.gov.ng/index.php?option=com_docman&task=cat_view&gid=39&Itemid=49&limitstart=45 (accessed on 25 August 2016).
  2. Punam, C.P.; Korman, V.; Angwafo, M.; Buitano, M. An analysis of issues shaping Africa’s economic future. Afr. Pulse Newsl. 2011, 3, 81684. [Google Scholar]
  3. Orji, U.J. Moving from gas flaring to gas conservation and utilisation in Nigeria: A review of the legal and policy regime. OPEC Energy Rev. 2014, 38, 149–183. [Google Scholar] [CrossRef]
  4. Nwaoha, C.; Wood, D.A. A review of the utilization and monetization of Nigeria’s natural gas resources: Current realities. J. Nat. Gas Sci. Eng. 2014, 18, 412–432. [Google Scholar] [CrossRef]
  5. Odumugbo, C.A. Natural gas utilisation in Nigeria: Challenges and opportunities. J. Nat. Gas Sci. Eng. 2010, 2, 310–316. [Google Scholar] [CrossRef]
  6. Hassan, A.; Kouhy, R. Gas flaring in Nigeria: Analysis of changes in its consequent carbon emission and reporting. Account. Forum 2013, 37, 124–134. [Google Scholar] [CrossRef]
  7. Omiyi, B. Shell Nigeria Corporate Strategy for Ending Gas Flaring. In Proceedings of the Seminar on Gas Flaring and Poverty Alleviation, Oslo, Norway, 18–19 June 2001.
  8. Ezekiel, A. Corporate Planning & Strategy Department, Nigeria LNG Limited. A Critical Technical Overview of Nigeria Gas Utilization Challenges & Bottlenecks. In Gas Utilization in Nigeria & Emerging Opportunities, Proceedings of the NOGTECH Conference, Lagos, Nigeria, 26–28 June 2012; p. 6.
  9. Greening, L.A.; Greene, D.L.; Difiglio, C. Energy efficiency and consumption—The rebound effect—A survey. Energy Policy 2000, 28, 389–401. [Google Scholar] [CrossRef]
  10. Gillingham, K.; Newell, R.G.; Palmer, K. Energy efficiency economics and policy. Nat. Bur. Econ. Res. 2009, w15031, 1–32. [Google Scholar] [CrossRef]
  11. Dincer, I.; Acar, C. A review on clean energy solutions for better sustainability. Int. J. Energy Res. 2015, 39, 585–606. [Google Scholar] [CrossRef]
  12. Bale, C.S.; Varga, L.; Foxon, T.J. Energy and complexity: New ways forward. Appl. Energy 2015, 138, 150–159. [Google Scholar] [CrossRef] [Green Version]
  13. Iyer, G.; Hultman, N.; Eom, J.; McJeon, H.; Patel, P.; Clarke, L. Diffusion of Low-Carbon Technologies and the Feasibility of Long-Term Climate Targets, Technological Forecasting and Social Change. Available online: http://0-dx-doi-org.brum.beds.ac.uk/10.1016/j.techfore.2013.08.025 (accessed on 17 September 2016).
  14. Edino, M.O.; Nsofor, G.N.; Bombom, L.S. Perceptions and attitudes towards gas flaring in the Niger Delta, Nigeria. Environtlist 2009, 30, 67–75. [Google Scholar] [CrossRef]
  15. Orubu, C.O.A. Quantitative assessment of gas utilization and flare reduction policies in the Nigerian Petroleum Industry. Pet. Train. J. 2005, 2, 63–73. [Google Scholar]
  16. Davoudi, M.; Rahimpour, M.R.; Jokar, S.M.; Nikbakht, F.; Abbasfard, H. The major sources of gas flaring and air contamination in the natural gas processing plants: A case study. J. Nat. Gas Sci. Eng. 2013, 13, 7–19. [Google Scholar] [CrossRef]
  17. Unnasch, S.; Wiesenberg, R.; Sanchez, S.T.; Brandt, A.; Mueller, S.; Plevin, R. Assessment of Life Cycle GHG Emissions Associated with Petroleum Fuels. Available online: http://www.newfuelsalliance.org/NFA_PImpacts_v35.pdf (accessed on 25 August 2016).
  18. Dung, E.J.; Leonardo, S.B.; Agusomu, T.D. The effect of gas flaring on crops in the Niger Delta, Nigeria. GeoJournal 2008, 73, 297–305. [Google Scholar] [CrossRef]
  19. Giwa, S.O.; Adama, O.O.; Akinyemi, O.O. Baseline black carbon emissions for gas flaring in the Niger Delta region of Nigeria. J. Nat. Gas Sci. Eng. 2014, 20, 373–379. [Google Scholar] [CrossRef]
  20. Society of Petroleum Engineers (SPE). Gas Flare Out, Challenges and the Way Forward. In Proceedings of the Annual Oloibiri Lecture Series & Energy Forum, Lagos, Nigeria, 8 March 2012.
  21. Department of Petroleum Resources (DPR). Nigeria Loses over N735m Daily to Gas Flaring-Official. 2013. Vanguard 9 July 2013. Available online: http://www.vanguardngr.com/2013/07/nigeria-loses-over-n735m-daily-to-gas-flaring-official/ (accessed on 24 August 2016).
  22. Ahmed, M.M.; Bello, A.A.; Idris, M.N. Natural gas utilization and the Nigerian gas-to-liquid project; an opportunity to end gas flaring. Int. J. Emerg. Trends Eng. Dev. 2012, 2, 240–256. [Google Scholar]
  23. Nwankwo, C.N.; Ogagarue, D.O. Effects of gas flaring on surface and ground waters in Delta state Nigeria. J. Geol. Min. Res. 2011, 3, 131–136. [Google Scholar]
  24. US Energy Information Administration. Nigeria’s Key Energy Statistics. 2013. Available online: http://www.eia.gov/beta/international/country.cfm?iso=NGA (accessed on 24 August 24 2016). [Google Scholar]
  25. Anomohanran, O. Determination of greenhouse gas emission resulting from gas flaring activities in Nigeria. Energy Policy 2012, 45, 666–670. [Google Scholar] [CrossRef]
  26. Bassey, N. Gas Flaring: Assaulting Communities, Jeopardizing the World (ERA). In Proceedings of the National Environmental Consultation Hosted by the Environmental Rights Action in Conjunction with the Federal Ministry of Environment, Reiz Hotel, Abuja, Nigeria, 10–11 December 2008.
  27. Jegannathan, K.R.; Chan, E.; Ravindra, P. Biotechnology in biofuels—A cleaner technology. J. Appl. Sci. 2011, 11, 2421–2425. [Google Scholar]
  28. Sharma, V.K.; Marano, D.; Anyanwu, C.N.; Okonkwo, G.O.; Ibeto, C.N.; Eze, I.S. Solar cooling: A potential option for energy saving and abatement of green-house gas emissions in Africa. Singap. J. Sci. Res. 2011, 1, 1–12. [Google Scholar] [CrossRef]
  29. Wang, M.Q.; Huang, H.S. A Full Fuel-Cycle Analysis of Energy and Emissions Impacts of Transportation Fuels Produced from Natural Gas. Available online: http://www.ipd.anl.gov/anlpubs/2000/01/34988.pdf (accessed on 25 August 2016).
  30. Wendel, B. The Elusive Goal to Stop Flares. Available online: www.shell.com/swonline (accessed on 25 August 2016).
  31. Kutepova, E.A.; Knizhnikov, A.Y.; Kochi, K.V. Associated Gas Utilization in Russia: Issues and Prospects. Available online: https://www.google.com.hk/url?sa=t&rct=j&q=&esrc=s&source=web&cd=1&ved=0ahUKEwjp8NfU27jQAhXJULwKHZn1B1wQFggkMAA&url=https%3A%2F%2Fwww.wwf.ru%2Fdata%2Fpubl%2F545%2Fas_gas_kpmg_eng.pdf&usg=AFQjCNHqVD_-Dcxwbx3Lr7PRctuDj3WPVg&cad=rja (accessed on 25 August 2016).
  32. Clark Energy. Associated Petroleum Gas/Flare Gas. 2014. Available online: http://www.clarke-energy.com/associated/ (accessed on 15 December 2014).
  33. Rahimpour, M.R.; Jamshidnejad, Z.; Jokar, S.M.; Karimi, G.; Ghorbani, A.; Mohammadi, A.H. A comparative study of three different methods for flare gas recovery of Asalooye Gas Refinery. J. Nat. Gas Sci. Eng. 2012, 4, 17–28. [Google Scholar] [CrossRef]
  34. Energy Commission of Nigeria (ECN). Renewable Energy Master Plan Final Draft Report. Available online: http://www.energy.gov.ng/index.php?option=com_docman&task=cat_view&gid=39&Itemid=49 (accessed on 25 August 2016).
  35. Aliyu, A.S.; Ramli, A.T.; Saleh, M.A. Nigeria electricity crisis: Power generation capacity expansion and environmental ramifications. Energy 2013, 61, 354–367. [Google Scholar] [CrossRef]
  36. Bala, E.J. Renewable energy policy and master plan in Nigeria. Energy Commission of Nigeria (ECN). In Proceedings of the National Training Workshop on Application of Renewable Energy Devices for Climate Change Mitigation for Rural Women, Framer and Amnesty Youth, Delta State, Nigeria, 25 July 2012.
  37. Energy Commission of Nigeria (ECN). Nuclear Power Development in Nigeria. 2012. Available online: http://www.energy.gov.ng/index.php (accessed on 24 August 2016). [Google Scholar]
  38. Nnaji, B. Investment opportunities in the Nigerian power sector. In Proceedings of the Nigeria Business and Investment Summit, London, UK, 30 July–1 August 2012.
  39. Clement, U. Paying More for Darkness: How the Hike in Electricity Tariff Affects You. The Vanguard, 10 June 2012. Available online: http://www.vanguardngr.com/2012/06/paying-more-for-darkness-how-the-hike-in-electricity-tariff-affects-you/ (accessed on 18 September 2016).
  40. Obadote, D.J. Energy Crises in Nigeria: Technical Issues and Solutions. Available online: http://www.obadote.com/media/ENERGY_CRISIS_IN_NIGERIA.pdf (accessed on 18 September 2016).
  41. Okafor, E.N.C.; Joe-Uzuegbu, C.K.A. Challenges to the development of renewable energy in for electric power sector in Nigeria. Int. J. Acad. Res. 2010, 2, 211–216. [Google Scholar]
  42. Ajayi, O.O.; Ajayi, O.O. Nigeria’s energy policy: Inferences, analysis and legal ethics toward RE development. Energy Policy 2013, 60, 61–67. [Google Scholar] [CrossRef]
  43. Ejiogu, A.R. A nuclear Nigeria: How feasible is it? Energy Strategy Rev. 2013, 1, 261–265. [Google Scholar] [CrossRef]
  44. Jacobs, F.S.U. 60 Million Nigerians Now Own Power Generators. Available online: http://www.vanguardngr.com (accessed on 24 August 2015).
  45. Sambo, A.A.; Garba, B.; Magaji, M.M. Electricity generation and the present challenges in the Nigerian power sector. In Proceedings of the 2010 World Energy Congress of the World Energy Council, Montreal, QC, Canada, 12–16 September 2010.
  46. Adenikinju, A.F. Electric infrastructure failures in Nigeria: A survey-based analysis of the costs and adjustment responses. Energy Policy 2003, 31, 1519–1530. [Google Scholar] [CrossRef]
  47. Daramola, A.Y.; Olubunmi, A. Climate Change and Development Policy. In Proceedings of the UNU-WIDER Conference on Climate Change and Development Policy, Helsinki, Finland, 28–29 September 2012; pp. 1–20.
  48. Adams, R.; Horne, D.B. Compressed Natural Gas (CNG) Transit Bus Experience Survey: April 2009–April 2010. Available online: http://www.osti.gov/bridge (accessed on 15 December 2014).
  49. Alfredo, M. CNG for Cleaner Cities and Road Transport. Available online: http://ec.europa.eu/environment/archives/clean_bus/slides/martin.pdf (accessed on 16 October 2014).
  50. Matt, P. Analysis of Fuels and Propulsion System Options for BRT Vehicles; Federal Transit Administration U.S. Department of Transportation: Washington, DC, USA, 2004; pp. 1–131.
  51. Robert, C. Bus Rapid Transit (BRT): An Efficient and Competitive Mode of Public Transport. Available online: https://www.acea.be/uploads/publications/20th_SAG_HR.pdf (accessed on 25 August 2016).
  52. Xiangzhen, Z.; Jia, F. Local Policies and Best Practices on Greening: Urban Transport in Chinese Cities. Available online: https://sustainabledevelopment.un.org/content/documents/booklet-greeningchina.pdf (accessed on 25 August 2016).
  53. MJB & A. Comparison of Modern CNG, Diesel and Diesel Hybrid-Electric Transit Buses: Efficiency & Environmental Performance; M.J. Bradley & Associates, LLC.: Concord, MA, USA, 2014; pp. 1–46. [Google Scholar]
  54. Nigel, N.C.; Feng, Z.; Scott, W.W.; Donald, W.L. Transit Bus Life Cycle Cost and Year 2007 Emissions Estimation; Federal Transit Administration U.S. Department of Transportation: Washington, DC, USA, 2007; pp. 1–50.
  55. Steve, R. Hybrid-Diesel vs. CNG: An Updated Comparison of Transit Fleet Alternatives. Available online: publicsolutionsgroup.publishpath.com (accessed on 16 October 2014).
  56. U.S. Department of Transportation. Vehicle Catalog: A Compendium of Vehicles and Power Train Systems for Bus Rapid Transit Service 2006 Update. Available online: www.nbrti.org/docs/pdf/2006_brt_compendium.pdf (accessed on 25 August 2016).
  57. Huzayyin, A.S.; Salem, H. Analysis of thirty years evolution of urban growth, transport demand and supply, energy consumption, greenhouse and pollutants emissions in Greater Cairo. Res. Transp. Econ. 2013, 40, 104–115. [Google Scholar] [CrossRef]
  58. Allen, H.; Millard, K.; Rahman, M.S.U.; Barlow, T. A Study on Potential Use of Compressed Natural Gas (CNG) in Public Transport in Indonesia. Transport Research Laboratory. Available online: http://www.academia.edu/21149033/A_Study_on_Potential_Use_of_Compressed_Natural_Gas_CNG_in_Public_Transport_in_Indonesia (accessed on 25 August 2016).
  59. Dayo, M. Lagos BRT-Lite System: Africa’s First Bus Rapid Transit Scheme. Available online: http://documents.worldbank.org/curated/pt/874551467990345646/Africas-first-bus-rapid-transit-scheme-the-Lagos-BRT-Lite-system (accessed on 25 August 2016).
  60. Lagos Bureau of Statistics (LBS). Lagos State Gross Domestic Product Survey: 2010; Ministry of Economic Planning and Budget: Alausa, Ikeja, Nigeria, 2012; pp. 1–51. Available online: http://lagosbudget.org/ (accessed on 10 October 2014).
  61. United Nations. World Population Prospects: The 2012 Revision; Medium Variant; United Nations, Department of Economic and Social Affairs: New York, NY, USA, 2012. [Google Scholar]
  62. The World Bank. Nigeria: Lagos Urban Transport Project (LUTP), Developing New Frontiers to Improve Urban Mobility, A Success Story from Lagos. 2013. [Google Scholar]
  63. World Bank. Nigeria at a Glance; The World Bank: Washington, DC, USA, 2008; Available online: http://devdata.worldbank.org/AAG/nga_aag.pdf (accessed on 10 September 2014).
  64. Tayo, O. The Bus Rapid Transit System of Lagos, Nigeria. In A Presentation to United Nations Forum on Climate Change Mitigation, Fuel Efficiency & Sustainable Urban Transport, Seoul, Korea, 2010; pp. 1–33.
  65. Olukayode, T. Challenges of transportation in Lagos. Lagos Metropolitan Area Transport Authority (LAMATA). 2013. Available online: http://www.unep.org/transport/pcfv/PDF/cba_june/CBA_PublicTransportationLagos.Pdf (accessed on 8 September 2014).
  66. Atubi, A.O. Road Transport System Management and Traffic in Lagos, South Western Nigeria. Int. Multi-Discipl. J. 2010, 4, 459–470. [Google Scholar] [CrossRef]
  67. Cities of the World. Cities of the World: Lagos. 2008. Available online: http://www.city-data.com/world-cities/Lagos.html (accessed on 16 September 2016).
  68. Olawole, M.O. Accessibility to Lagos Bus Rapid Transit Lite Bus Stops: An Empirical Study. In Proceedings of the Conference CODATU XV, The Role of Urban Mobility in (Re)Shaping Cities, Addis Ababa, Ethiopia, 22–25 October 2012; pp. 1–16.
  69. Okanlawon, K.R. Inter-modal Transport System: A Study of Lagos State. J. Environ. Res. Policies 2007, 2, 67–71. [Google Scholar]
  70. Lagos Metropolitan Area Transport Authority (LAMATA) Public Transport. 2009. Available online: www.lamata-ng.com (accessed on 8 September 2014).
  71. Heaps, C.G. Long-Range Energy Alternatives Planning (LEAP) System, Software version: 2015.0.29; Stockholm Environment Institute: Somerville, MA, USA, 2016.
  72. Amoo, L.M.; Fagbenle, R.L. An integrated impact assessment of hydrogen as a future energy carrier in Nigeria’s transportation, energy and power sectors. Int. J. Hydrol. Energy 2014, 39, 12409–12433. [Google Scholar] [CrossRef]
  73. Immaculata, I.C.N.; John, O.A. Bio-Scape Energy Solution to Transport Induced Climate Change in Lagos Metropolis, Nigeria. In Proceedings of the International Conference on Advances in Bio-Informatics, Bio-Technology and Environmental Engineering (ABBE), London, UK, 1–2 June 2014; pp. 16–22.
  74. Metro Magazine. Gillig’s CNG Option Logs Best MPG ever at Altoona. 2011. Available online: http://www.metromagazine.com/bus/news/287240/gillig-s-cng-option-logs-best-mpg-ever-at-altoona (accessed on 10 October 2014).
  75. Niger Delta Environmental Survey (NDES). Socio-Economic Characteristics; NDES: Lagos, Nigeria, 1996; Volume 1. [Google Scholar]
  76. Homepage of National Bureau of Statistics (NBS). Available online: http://www.nigerianstat.gov.ng/ (accessed on 25 August 2016).
  77. Nigerian National Petroleum Corporation (NNPC). Annual Statistical Bulletin. Corporate Planning and Development Division (CPDD). January–December 1997. Available online: http://www.nnpcgroup.com/Portals/0/Monthly%20Performance/1997%20Annual%20Statistical%20Bulletin%20ASB.pdf (accessed on 25 August 2016).
  78. Nigerian National Petroleum Corporation (NNPC). Annual Statistical Bulletin. Corporate Planning and Development Division (CPDD). January–December 2008. Available online: http://www.nnpcgroup.com/Portals/0/Monthly%20Performance/2008%20ASB%201st%20Edition%20Web.pdf (accessed on 25 August 2016).
  79. Nigerian National Petroleum Corporation (NNPC). Annual Statistical Bulletin. Corporate Planning and Development Division (CPDD). January–December 2009. Available online: http://www.nnpcgroup.com/Portals/0/Monthly%20Performance/2009%20ASB%20web.pdf (accessed on 25 August 2016).
  80. Nigerian National Petroleum Corporation (NNPC). Annual Statistical Bulletin. Corporate Planning and Development Division (CPDD). January–December 2010. Available online: http://www.nnpcgroup.com/Portals/0/Monthly%20Performance/2010%20ASB%201st%20edition.pdf (accessed on 25 August 2016).
  81. Nigerian National Petroleum Corporation (NNPC). Annual Statistical Bulletin. Corporate Planning and Development Division (CPDD). January–December 2011. Available online: http://www.nnpcgroup.com/Portals/0/Monthly%20Performance/2011%20ASB%201st%20edition.pdf (accessed on 25 August 2016).
  82. Nigerian National Petroleum Corporation (NNPC). Annual Statistical Bulletin. Corporate Planning and Development Division (CPDD). January–December 2012. Available online: http://www.nnpcgroup.com/Portals/0/Monthly%20Performance/2012%20ASB%201st%20edition.pdf (accessed on 25 August 2016).
  83. Nigerian National Petroleum Corporation (NNPC). Annual Statistical Bulletin. Corporate Planning and Development Division (CPDD). January–December 2013. Available online: http://www.nnpcgroup.com/Portals/0/Monthly%20Performance/2013%20ASB%201st%20edition.pdf (accessed on 25 August 2016).
  84. Okoh, R.N. Cost-Benefit Analysis of Gas Production in Nigeria; NES: Ibadan, Nigeria, 2001; pp. 389–412. [Google Scholar]
  85. Homepage of Nairaland. Nigeria Exchange Rates to Dollar-History-Business-Nairaland. Available online: http://www.nairaland.com/498412/nigeria-exchange-rates-dollar-history (accessed on 25 August 2016).
  86. All Africa. Nigeria: Population to Hit 296 Million in 2030—UNFPA. 2008. Available online: http://allafrica.com/stories/200811130699.html (accessed on 18 September 2016).
  87. Euromonitor International. Nigeria in 2030: The Future Demographic. Economic and Consumer. 2013. Available online: http://www.euromonitor.com/nigeria-in-2030-the-future-demographic/report (accessed on 17 September 2016).
  88. International Futures (IFS). Population Forecast for Nigeria. 2014. Available online: http://www.ifs.du.edu/ifs/frm_CountryProfile.aspx?Country=NG (accessed on 14 September 2015).
  89. Schafer, A.; Victor, D.G. The future mobility of the world population. Transp. Res. A Policy Pract. 2000, 34, 171–205. [Google Scholar] [CrossRef]
  90. Roberta, Q.; Sierra, P. The energy–climate challenge: Recent trends in CO2 emissions from fuel combustion. Energy Policy 2007, 35, 5938–5952. [Google Scholar]
  91. Reinhard, M.; Yasin, S. Impacts of urbanization on urban structures and energy demand: What can we learn for urban energy planning and urbanization management? Sustain. Cities Soc. 2011, 1, 45–53. [Google Scholar]
  92. Lee, C. Transport and climate change: A review. J. Transp. Geogr. 2007, 15, 354–367. [Google Scholar]
  93. Alistair, T.; Roy, M.H. Sources and properties of non-exhaust particulate matter from road traffic: A review. Sci. Total Environ. 2008, 400, 270–282. [Google Scholar]
  94. André, M.; Rapone, M. Analysis and modelling of the pollutant emissions from European cars regarding the driving characteristics and test cycles. Atmos. Environ. 2009, 43, 986–995. [Google Scholar] [CrossRef]
  95. Lagos Bureau of Statistics (LBS). Motor Vehicles Statistics 2011; Ministry of Economic Planning and Budget: Alausa, Ikeja, 2011; pp. 1–102.
  96. Lagos Bureau of Statistics (LBS). Motor Vehicles Statistics 2012; Ministry of Economic Planning and Budget: Alausa, Ikeja, 2012; pp. 1–98.
  97. Adedayo, V.; Amure, K.; Adeaga, O.; Omenai, J. Access to Intra-Urban Public Transport across Varied Socio-Economic Groups: A Case of Lagos Bus Rapid Transit (BRT). Asian J. Hum. Soc. Sci. (AJHSS) 2014, 2, 1–9. [Google Scholar]
  98. Khan, M.I.; Yasmeen, T.; Shakoor, A.; Khan, N.B.; Wakeel, M.; Chen, B. Exploring the potential of compressed natural gas as a viable fuel option to sustainable transport: A bibliography (2001–2015). J. Nat. Gas Sci. Eng. 2016, 31, 351–381. [Google Scholar] [CrossRef]
  99. Khan, M.I.; Yasmin, T.; Shakoor, A. International experience with compressed natural gas (CNG) as environmental friendly fuel. Energy Syst. 2015, 6, 507–531. [Google Scholar] [CrossRef]
  100. Bach, C.; Lämmle, C.; Bill, R.; Soltic, P.; Dyntar, D.; Janner, P.; Seel, O. Clean Engine Vehicle: A Natural Gas Driven Euro-4/SULEV with 30% Reduced CO2-Emissions. SAE Technical Paper 2004. (No. 2004-01-0645). Available online: http://papers.sae.org/2004-01-0645/ (accessed on 30 October 2016).
  101. Dondero, L.; Goldemberg, J. Environmental implications of converting light gas vehicles: The Brazilian experience. Energy Policy 2005, 33, 1703–1708. [Google Scholar] [CrossRef]
  102. Aslam, M.U.; Masjuki, H.H.; Kalam, M.A.; Abdesselam, H.; Mahlia, T.M.I.; Amalina, M.A. An experimental investigation of CNG as an alternative fuel for a retrofitted gasoline vehicle. Fuel 2006, 85, 717–724. [Google Scholar] [CrossRef]
  103. Tsutsumizaki, T.; Kuroki, M. Study of CNG Fueled Two-Wheeled Vehicle with Electronically Controlled Gas Injection System. SAE Technical Paper 2005. (No. 2005-32-0034). Available online: http://papers.sae.org/2005–32–0034/ (accessed on 30 October 2016).
  104. Alvarez, R.A.; Pacala, S.W.; Winebrake, J.J.; Chameides, W.L.; Hamburg, S.P. Greater focus needed on methane leakage from natural gas infrastructure. Proc. Nat. Acad. Sci. 2012, 109, 6435–6440. [Google Scholar] [CrossRef] [PubMed]
  105. ICF-International. Nigeria: Carbon Credit Development for Flare Reduction Projects—Guide Book. Available online: http://siteresources.worldbank.org/EXTGGFR/Resources/NigeriaGGFRGuidebookICF.pdf> (accessed on 24 September 2014).
  106. Camuzeaux, J.R.; Alvarez, R.A.; Brooks, S.A.; Browne, J.B.; Sterner, T. Influence of methane emissions and vehicle efficiency on the climate implications of heavy-duty natural gas trucks. Environ. Sci. Technol. 2015, 49, 6402–6410. [Google Scholar] [CrossRef] [PubMed]
Figure 1. Utilization options for flared gas in Nigeria’s oil and gas industry. Note: FG: Flared Gas, CNG: Compressed Natural Gas, GTL: Gas to Liquid, LNG: Liquefied Natural Gas, LPG: Liquefied Petroleum Gas.
Environments 03 00031 g001
Figure 2. The LEAP Scenario Manager [72].
Environments 03 00031 g002
Figure 3. Quantity of gas produced and flared in Nigeria’s oil and gas industry (1990–2013). Source: Author’s computation, data from Niger Delta Environmental Survey [75], National Bureau of Statistics [76], Nigerian National Petroleum Corporation [77,78,79,80,81,82,83].
Environments 03 00031 g003
Figure 4. Cost of gas produced and flared 1972–1998 (Note: analysis is based on available data). Source: Author’s computation, data from Okoh [84]. Historical exchange rate values from [85].
Environments 03 00031 g004
Figure 5. Population of Lagos State at growth rate of 6% (2030 projection).
Environments 03 00031 g005
Figure 6. Population of Nigeria at growth rate of 2.6% (2030 projection).
Environments 03 00031 g006
Figure 7. Total number of vehicles that will be registered in Lagos state in the year 2030 at population growth of 6%, GDP growth rate of 5%, and income growth rate of 3.5%. Source: Author’s computation, data from Lagos Bureau of Statistics [95,96].
Environments 03 00031 g007
Figure 8. Contribution of road transport to the GDP of Lagos state in the year 2030.
Environments 03 00031 g008
Figure 9. Passenger Kilometres on the Available 220 Lagos BRT-Lite (2030 projection).
Environments 03 00031 g009
Figure 10. Energy Demand on the 220 Lagos BRT-Lite (2030 projection).
Environments 03 00031 g010
Figure 11. (a) Scenario 1 (BAU) Lagos BRT-Lite Carbon Dioxide (Non Biogenic); (b) The Use of CNG for 100 Units of Lagos BRT-Lite (scenario 2); (c)The use of CNG for 220 units of Lagos BRT-Lite (scenario 3).
Environments 03 00031 g011aEnvironments 03 00031 g011b

