Article

Assessing the Climatic Effects on Vegetation Dynamics in the Mekong River Basin

1
Key Laboratory of Water Cycle and Related Land Surface Processes, Institute of Geographic Sciences and Natural Resources Research, Chinese Academy of Sciences, Beijing 100101, China
2
Sino–Danish college, University of Chinese Academy of Sciences, Beijing 100049, China
3
College of Resources and Environment, University of Chinese Academy of Sciences, Beijing 100049, China
4
Department of Environmental Engineering, Technical University of Denmark, 2800 Kgs. Lyngby, Denmark
*
Author to whom correspondence should be addressed.
Submission received: 5 January 2017 / Revised: 8 February 2017 / Accepted: 13 February 2017 / Published: 16 February 2017
(This article belongs to the Special Issue Impacts of Agricultural Land Use Changes on Environments)

Abstract

:
Understanding long-term vegetation dynamics, their responses to climate, and other driving factors is crucial for integrated basin management in the Mekong River Basin (MRB) in a context of global change. In this study, Normalized Difference Vegetation Index (NDVI) and climate data from 1982 to 2013 were collected from Global Inventory Modeling and Mapping Studies (GIMMS) and Climate Research Unit Time Series Version 3.23 (CRU-TS 3.23). The long-term monthly average, Mann–Kendall trend (M–K) test, Sen’s slope, the coefficient of variation, correlation analysis, and the Partial Least Square Regression (PLSR) model with the Variable Importance in Projection (VIP) were applied in this study. The results showed an increasing temporal trend in NDVI and climate variables, especially temperature, in all vegetation types. There is a significantly increasing NDVI trend with relatively stable NDVI fluctuation across the majority of the MRB except in part of the Tibetan plateau in China. There is a positive spatial correlation between NDVI and air temperature, precipitation and PET (potential evapotranspiration) in the upper part of the basin. Air temperature is an important explanatory factor for all vegetation types, especially in forest ecosystems and croplands, while the role of precipitation and PET vary depending on vegetation type. In addition to physical aspects of the MRB, such as runoff, we conclude that the vegetation dynamics related to climate variables in the MRB should be considered in policies as the framework for ecological and environmental management plans of the MRB.

1. Introduction

Analysis of terrestrial vegetation dynamics allows a better understanding of climate effects on terrestrial ecosystems. Vegetation growth is influenced by the climate conditions, such as temperature and precipitation and also by ecosystem disturbances such as drought or fire. Climate change is increasing the frequency of such disturbances [1], which alters vegetation dynamics. Many earlier studies focused on ecological responses to climate change, and found that climate contributions to vegetation change are most crucial in many regions [2,3,4,5,6,7,8]. Hence, assessing the ecological effects of climate change on vegetation biomass is of importance for understanding and estimating climate-induced vegetation change in the last few decades, and disentangle it from the effect of other kind of disturbances. These assessments have the potential to become a supporting tool to identify possible future strategies of ecosystem management. Ecosystem indicators of primary productivity and greenness that can be used to assess climatic responses are vegetation indices data derived from satellite-collected data [9,10], such as the Normalized Difference Vegetation Index (NDVI).
Since the 1980s, remote-sensing NDVI has been widely used in order to monitor and evaluate vegetation greenness. Moreover, there has been focus on the relationship between NDVI and climatic factors, such as vegetation productivity, biomass, interannual and seasonal vegetation productivity, and phenology [5]. The relationship between vegetation dynamics and climate change has been widely explored in many regions, with many studies have addressed the link of vegetation dynamics with temperature and precipitation at different time scale [4,8,11,12,13,14]. For instance, there were stronger correlations between NDVI for different vegetation types and precipitation compared with temperature [4], while temperature increase has been pointed out as an important cause for the high-latitude NDVI greening trends [15,16]. However, the response of NDVI to climate variables could be explained by the unique temporal and spatial dimensions in the habitat, in addition to the degree of human disturbance [4]. For instance, the combined effects of climate variability and human activities have shaped the vegetation cover in hilly Southern China [8].
The Mekong River Basin (MRB) is the longest river in Southeast Asia, and it supports a wide diversity of life. However, nowadays, climate change has affected vegetation in the Mekong River Basin, not only in the lower part of the basin, which is dominated by agriculture, but also in the upper part, the Lancang River Basin [17,18]. Many researchers have focused only on the regional scale, such as the Lancang River Basin or Northeastern Thailand (Chi and Mun River basins). In the southeast Lancang River, the Net Primary Production (NPP) response to annual precipitation was complicated and had more influence than temperature, while temperature and precipitation variabilities had a strong relationship with the meadow-growing season (May to September) NPP change in the northwestern part of the basin [17]. The seasonal pattern of deciduous forest, paddy, and crop field NDVI relate to the precipitation patterns in the northeastern part of Thailand, which is located in the Mekong River sub-basin. Evergreen forests have shown that temperature was a driving factor that affected greenness and productivity [5]. However, these publications mainly focus on the temperature and precipitation effects on vegetation dynamics. The impacts of other factors should not be omitted, such as the maximum and minimum temperatures and potential evapotranspiration. In fact, disentangling the role of different climatic controls on vegetation dynamics in the MRB still remains a challenge [19].
The study of several climate factors in relation to vegetation dynamics is vital in order to improve the knowledge and understanding of the mechanisms that vegetation has to cope with a changing climate, which can support MRB environment and ecosystem management. Hence, the main purpose of this study was to explore interannual vegetation dynamics in the MRB, from 1982 to 2013, and investigate the relationship between NDVI and climate variables using satellite images and the reanalysis of climate datasets. More precisely, we wanted to address the following questions: (1) How are the seasonal NDVI dynamics for different vegetation types in the MRB? (2) What are the annual NDVI and climate trends and annual NDVI fluctuations over the past three decades? (3) How does the spatial relationship between NDVI and climate variables vary? (4) Which climate factors contribute the most NDVI dynamics for different vegetation types?

2. Materials and Methods

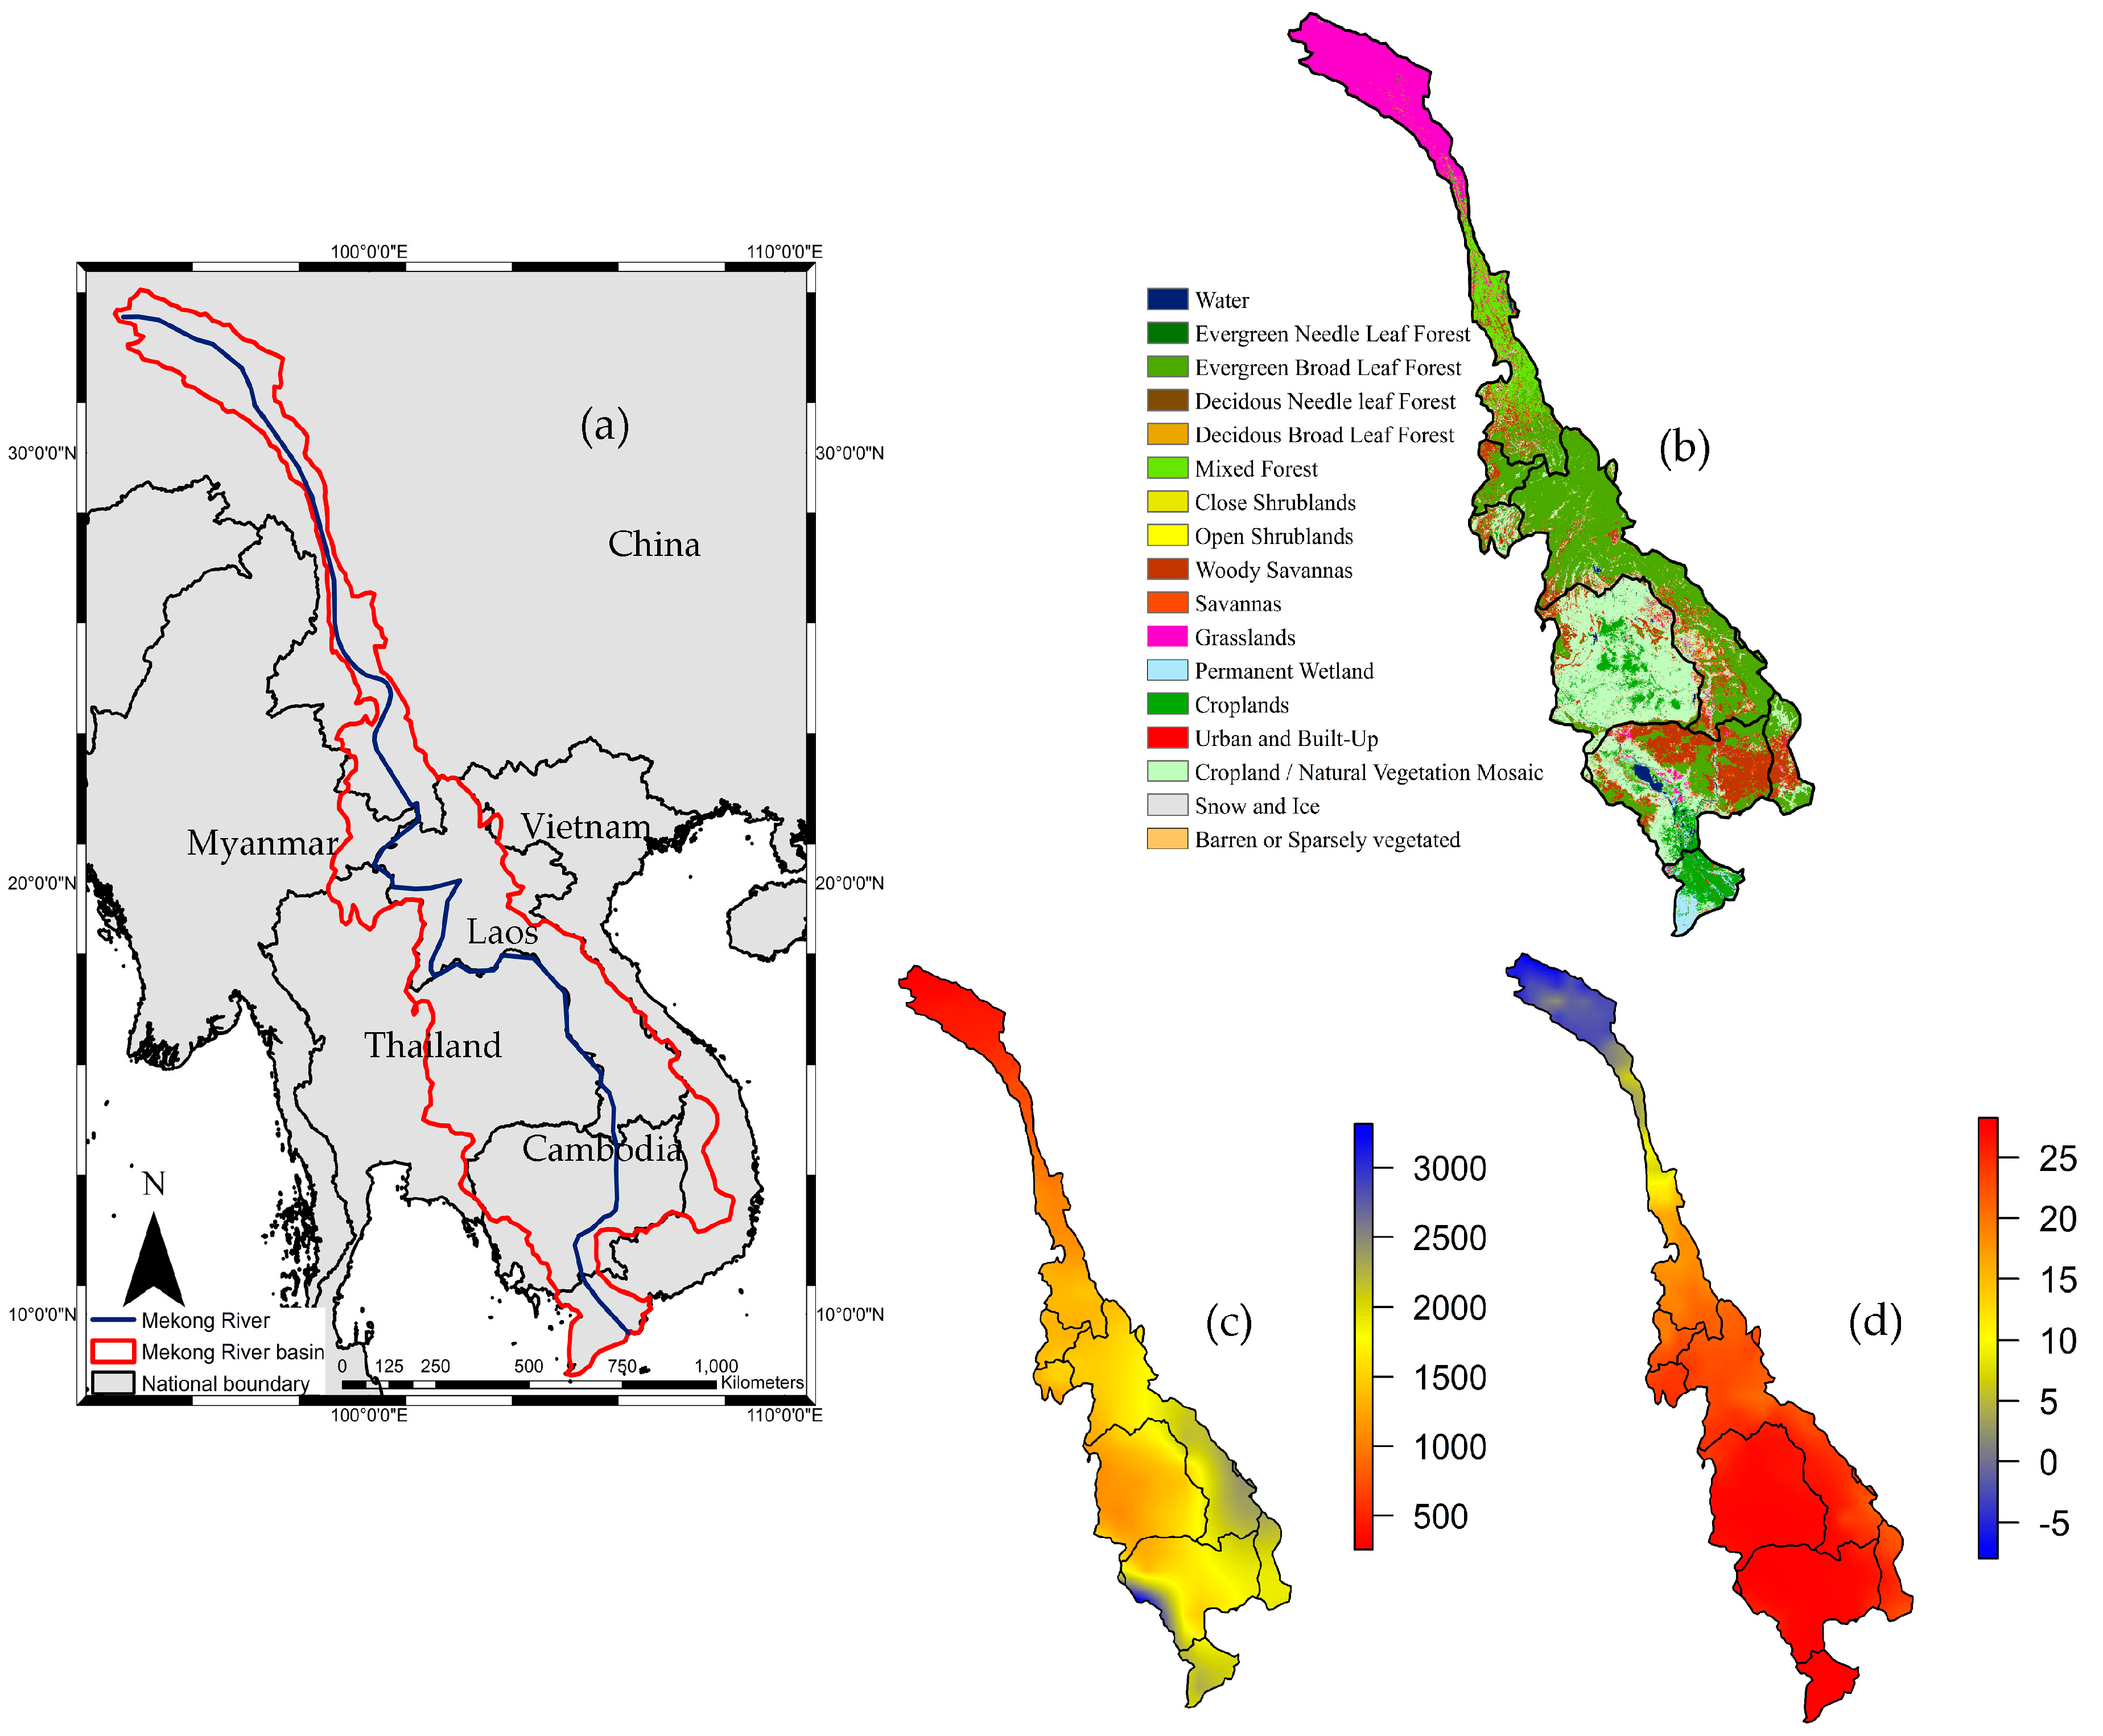
2.1. Study Area Description

The MRB, which is shown in Figure 1, originates in the Tibetan Plateau in China, covering an area of around 795,000 km2. The river flows through six countries, where its outlet runs into the South China Sea (Figure 1a). The basin shape can be separated into three parts—namely the upper basin, the lower basin, and the Mekong Delta. The upper basin includes the Lancang River Basin in the Qinghai-Tibetan Plateau and Yunnan Province, China, while the lower MRB is located in Southeast Asia and is downstream of Cambodia. The Mekong Delta is found in Vietnam.
The mean temperature in the MRB changes topographically from place to place (Figure 1d). The entire basin experiences an average temperature of around 24 °C. The upper part of the basin has a cold climate, while the lower part experiences two monsoons, i.e., the rainy southwest monsoon from mid-May to mid-October and the dry northeast monsoon from mid-October to April. The range of cumulative annual rainfall in the lower part of the basin is 1000 to 1500 mm in Thailand, to more than 3200 mm in Laos, while it ranges from 600 mm in the Tibetan Plateau to 1700 mm in Yunnan mountain regions (Figure 1c) [20,21].

2.2. Data Source and Pre-Processing

2.2.1. Land Cover Map

MODIS land cover type data product (MCD12Q1) with a 5’ × 5’ spatial resolution [22], based on the IGBP (International Geosphere–Biosphere Programme) Land Cover Type Classification, was used to classify the major vegetation cover in the MRB (Figure 1b). The data were projected into the World Geodetic System 1984 (WGS1984) coordinate reference system using latitude and longitude.

2.2.2. NDVI Data Set

In this study, the raw NDVI maps were downloaded from a Global Inventory Modeling and Mapping Studies (GIMMS) data set at a global scale [23]. The total number of NDVI images, downloaded from January 1982 through December 2013, equal 768 images; these include bi-weekly temporal resolutions × 12 months × 32 years. The following steps were taken to process the data. First, the Savitzky-Golay filter [24] was used to avoid pseudo peaks, atmospheric contaminants, in addition to deriving an accurate value from the NDVI time series. Then, the coordinate system was defined as GCS-WGS1984, and the bi-linear interpolation method was conducted in order to downscale, from an 8-km2 to a 1-km2 spatial resolution using the “raster” package in R programming [25].

2.2.3. Climate Data

For the climate data, the Climate Research Unit Time Series Version 3.23 (CRU-TS 3.23, University of East Anglia, Norwich, UK) was used. The grid climate dataset, produced by the Climatic Research Unit at the University of East Anglia, at a 0.5° spatial resolution, from January 1901 to December 2014 [26], was processed from monthly observations from the meteorological station, both at the global and national scales. This dataset was separated into two types: (1) the primary data variables, including precipitation and mean, maximum, and minimum temperature, and (2) the secondary data variables, including potential evapotranspiration (PET). PET was estimated using the Food and Agriculture Organization of the United Nations (FAO) Penman-Monteith method and was produced from the primary variables using well-known formulae [26]. Only average, maximum, and minimum temperature, precipitation, and PET were used in this study. The bi-linear interpolation method was utilized in order to downscale from a 0.5° spatial resolution to a 30-second spatial resolution using a “raster” package [25].

2.3. Methods

2.3.1. Coefficient of Variation

The coefficient of variation (CV) (standard deviation divided by the mean) was used to reveal the inter-annual variation of vegetation [6,27]. The equation is as follows:
CV = i = 1 n ( NDVI i NDVI ) ¯ 2 / n NDVI ¯
where NDVI i is the annual mean NDVI in year i, and NDVI ¯ is average annual mean NDVI from 1982 to 2013 (n = 32). When the CV value is large (small), it means that data are more (less) distributed around the mean, with more variation (more stability) in terms of inter-annual changes [6].

2.3.2. Sen’s Slope Analysis

The Sen’s Slope estimator is a robust statistical method that has been widely used to analyze long-time series data, and has proven to be more suitable for time series analysis than linear regression [8,28,29]. The magnitude of the slope (β) is computed as:
β = NDVI j NDVI i j i , i < j
If β < 0 (β > 0), then the trend of the variable time series has a decreasing (increasing) trend.

2.3.3. Mann–Kendall Trend Test

The Mann–Kendall test (M–K test) is a non-parametric test for identifying trends in time series data and is used to assess the level of significance of the Sen’s slope; the advantages of this method are that data do not need to be of a normal distribution and are not sensitive to outliers in the dataset [29,30]. The Mann–Kendall statistic (S) is as follows:
S = i = 1 n 1 j = i + 1 n sign ( NDVI j NDVI i )
In this equation, NDVI j and NDVI i are the annual mean NDVI value of time i and j, then:
sign ( NDVI j NDVI i ) = { 1 , if ( NDVI j NDVI i ) > 0 0 , if ( NDVI j NDVI i ) = 0 1 , if ( NDVI j NDVI i ) < 0
The variance of S is estimated as:
VAR ( S ) = n ( n 1 ) ( 2 n + 5 ) 18
Compute the normalized test statistic Z as follows:
Z = { S 1 VAR ( S ) , if S > 0 0 , if S = 0 S + 1 VAR ( S ) , if S < 0
The statistical trend of variables was evaluated using the Z value. The positive (negative) Z indicates upward (downward) trend, while 0 means that there is no trend in the time series. In this study, the significance of the detected trend was tested based on a 0.05 significance level.

2.3.4. Correlation Analysis

We used the Pearson Product-Moment Correlation Coefficient (r) to analyze the relationship between NDVI and climate variables. The coefficient is defined as:
r = i = 1 n [ ( x i x ¯ ) ( y i y ¯ ) ] i = 1 n ( x i x ) ¯ 2 i = 1 n ( y i y ) ¯ 2
where yi is NDVI at time i, xi is the climate factors at time i, y ¯ and x ¯ are the climatology NDVI and climatology climate factors from 1982 to 2013. The significant testing at a p-value < 0.05 was applied using the t-test.

2.3.5. Partial Least Square Regression (PLSR) Analysis

PLSR is the robust statistical method that combines Principle Component Analysis (PCA) and multiple regression with the ability to handle many predictors, even when predictors display co-linearity [31,32]. In this paper, we used PLSR in order to identify the climate factors that affect vegetation greenness [3]. The dependent variable in our case was NDVI, while the independent variables were five climate variables. However, the variation in biomes and climate gradient might influence the accuracy of PLSR’s analyses [3]. Hence, dominating pixels for each vegetation type were used to represent each climate zone [33]. Finally, the PLSR analysis was conducted. Table 1 shows the dominant vegetation types for each climate zone, based on the Köppen-Geiger climate classification [33]. To select the number of components, we ran the PLSR model, and the number of latent factors to be included in the model was determined by cross-validation. This is due to the three components of latent factors that were found to explain more than 90% of the variation in the NDVI dataset. Finally, the Variable Importance in Projection (VIP) was used to indicate the significance of each variable and the model coefficients, which quantify the effects of each predictor in the model.

4. Results and Discussion

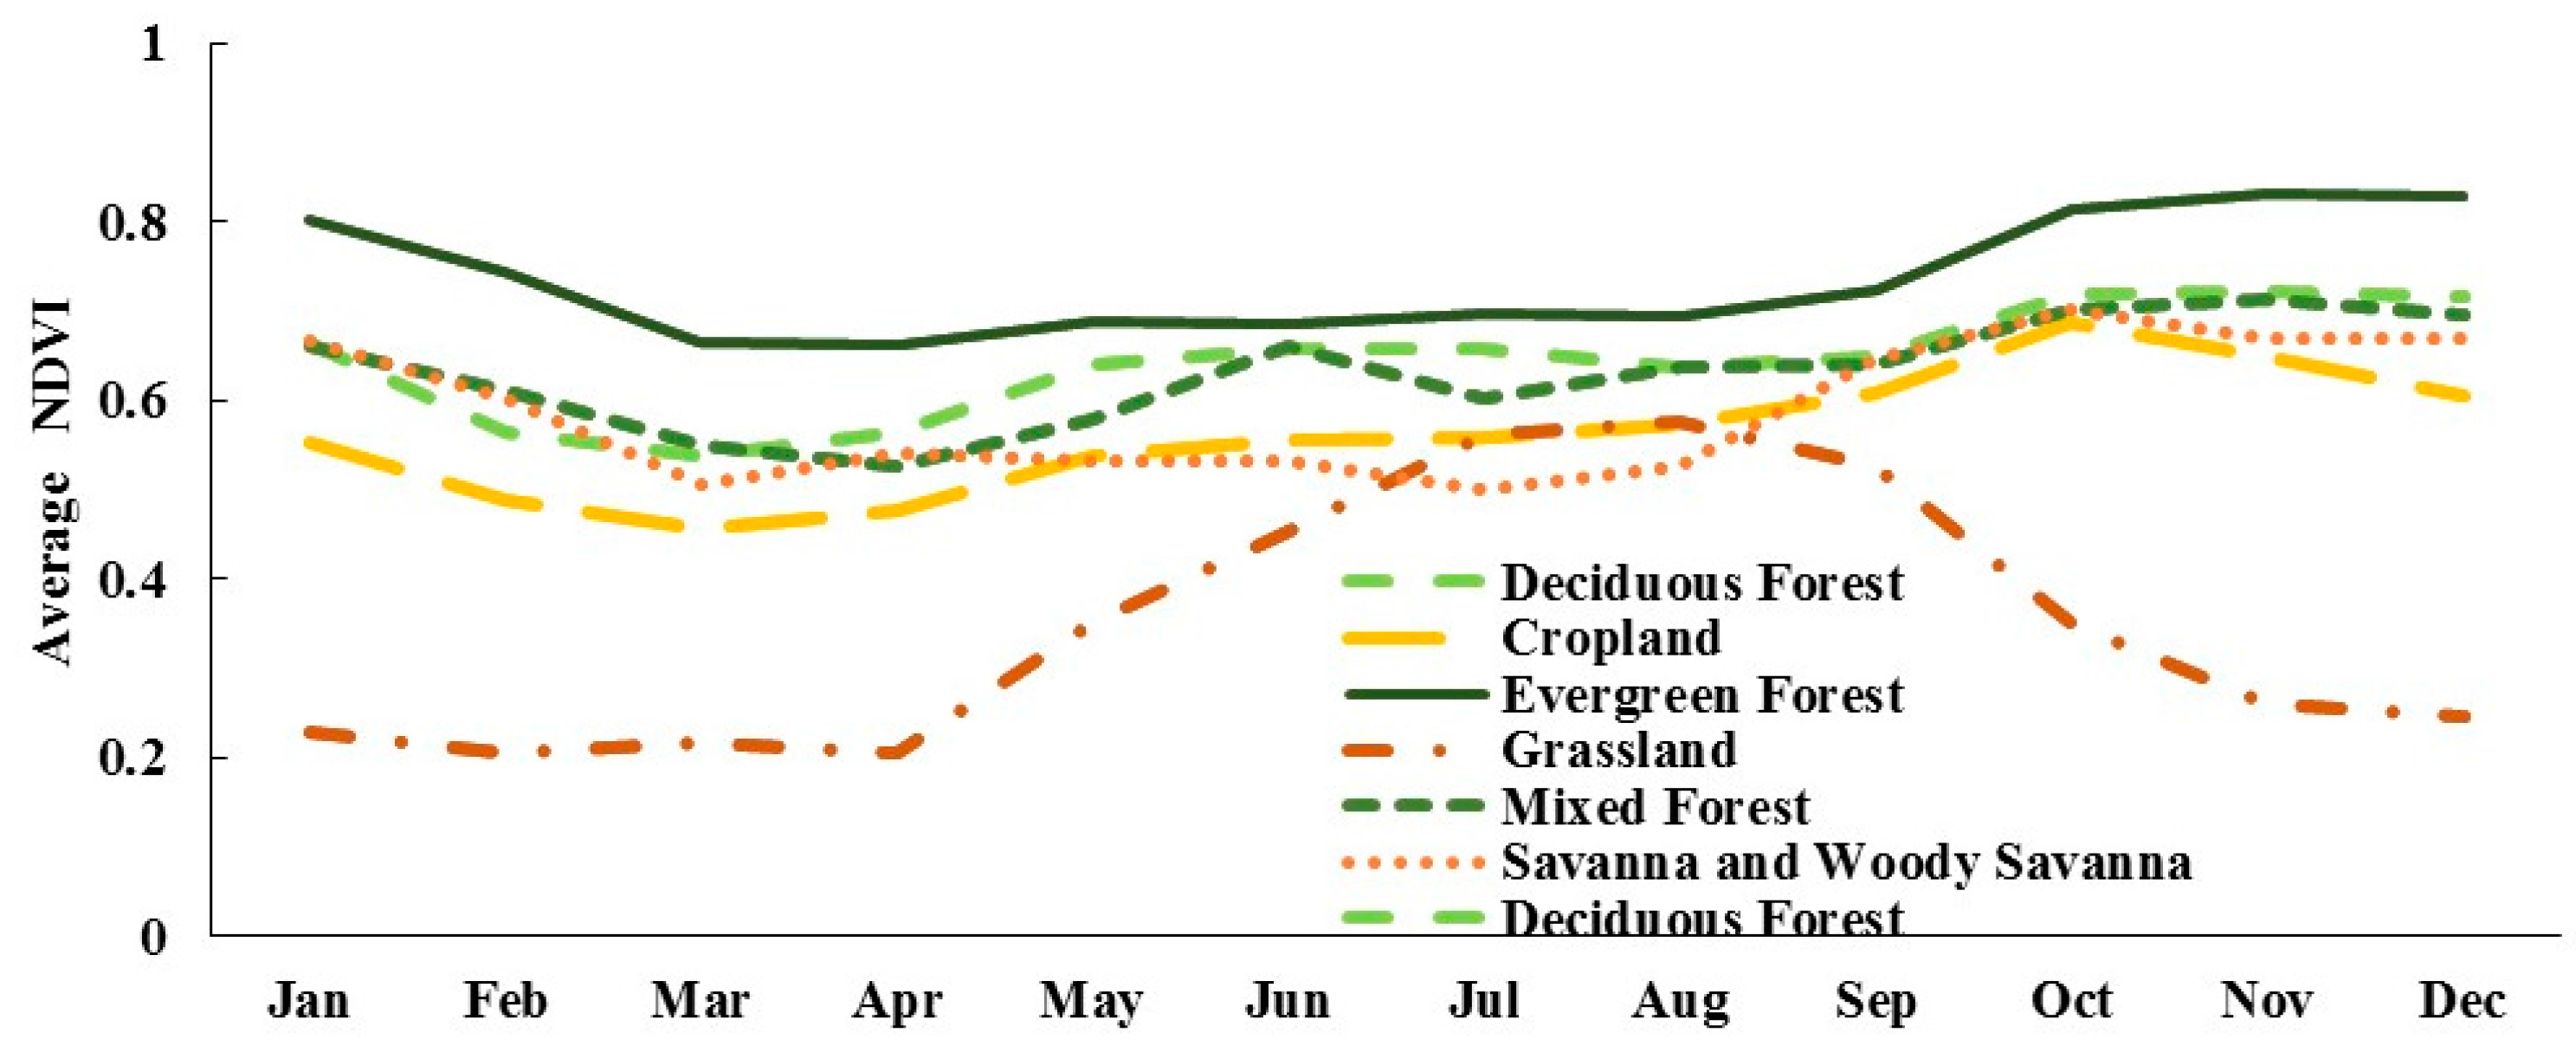
4.1. Seasonal Vegetation Dynamics

The seasonal dynamics of mean NDVI for different vegetation types, from 1982 to 2013, are shown in Figure 2. Each vegetation NDVI have specific seasonal dynamics, both in amplitude and range, in addition to a specific beginning, peak, and end of growing season. The spatial dimensions of NDVI were randomly selected, based on the dominant vegetation in each zone, such as the evergreen forest in Laos and the grassland ecosystem in the Qinghai-Tibetan Plateau in China, in order to evaluate seasonal vegetation dynamics.
The NDVI value for the evergreen forest, dominant in the lower part of the MRB, was significantly different compared with other vegetation dynamics. The monthly average NDVI of the evergreen forest was 0.74, peaking in November at 0.83 with a minimum value of 0.66 in April. The NDVI dynamic variation was relatively stable from March to October, with a slight increase from September to December, and a decrease in January to February. At the beginning of the wet season, from May to July, the evergreen forest seasonal dynamic fluctuated and increased again in September. Thavorntum and Tantemsapya [5] concluded that precipitation peaks in August for the evergreen forest, but NDVI reached a maximum around October, which is supported by this study. The evergreen forest’s seasonal NDVI dynamic remains high until January, then decreases gradually. Moreover, Garcia et al. [34] also concluded that the evergreen forest ecosystem showed the highest persistence of rainfall effects. Subsequently, NDVI is low and relatively stable from March to September in the late-dry to the late-wet season. This agrees with Van Leeuwen et al. [35], who suggested that the tropical forest shows a minimum NDVI value during the rainy season. The NDVI value for the deciduous forest was not as high as that of the evergreen forest. Monthly mean deciduous forest NDVI is 0.64. The seasonal dynamic of the deciduous forest was steady during the rainy season (May to September) before peaking during the winter season (October to December) in the lower part of the MRB. The NDVI value for the deciduous forest decreases slightly from January to March in the dry season, when trees start to shed their leaves. Leaves begin to fall one to two months after the beginning of the dry season, which begins in November and continues until the forest becomes leafless in March [36], which corresponds with the deciduous forest NDVI in the MRB. The deciduous forest’s seasonal NDVI pattern was the same as that of the mixed forest; it increases in September and drops in January with the NDVI reaching the minimum value from April to September [36]. The cropland includes single and multiple cropping systems, such as a rice paddy field, cassava, soybean, sugarcane and maize [37]. This cropland is widely distributed in Thailand, with a maximum greenness of 0.68 in October and gradually dropping in November to coincide with the harvesting period [38]. The savanna and woody savanna seasonal NDVI dynamic patterns are the same as the cropland seasonal NDVI, but starts to green up after October, at the end of the rainy season. This is probably related to the limited water and temperature; the vegetation starts to green up after soil moisture and optimum temperature are available for growth [35]. Grassland season dynamics are different compared to others, which corresponds with Yu et al. [3]; the authors concluded that the grassland ecosystem greening season is in May, and reaches the “mature” stage in July and August. NDVI then starts senescence from September to November and ends in October, which is coherent with this study. In addition to the climate factors and seasons, which might lead to significant uncertainties in the seasonal vegetation dynamics, Zhan et al. [39] suggested that elevation also had a significant influence on vegetation dynamics and distribution, while the aspect and slope show a non-significant response to NDVI dynamics.

4.2. Interannual Changes in NDVI and Climate Variables for Different Vegetation Types

Table 2 shows the annual change (Sen’s slope) based on Mann–Kendall analysis of different variables, during 1982–2013, in the MRB for different vegetation biomes.
The annual average NDVI did not show a significantly increasing trend in evergreen forest, deciduous forest, grassland, as well as savanna and woody savanna (with only a slight increase in these vegetation types) (Table 2). Nevertheless, NDVI was found to be significantly increased in cropland and mixed forest, with Sen’s slope being 0.007 and 0.010, respectively. Average temperature trends during 1982–2013 increased significantly in cropland, evergreen forest, deciduous forest mixed forest, and grassland, as well as savanna and woody savanna (as shown in Table 2). Annual average precipitation over evergreen forest increased significantly (around 8.6 mm/year). However, other vegetation types also showed a non-significant increasing trend, with the exception of mixed forest, which demonstrated a non-significant decreasing trend. The minimum temperature was raised significantly for every type of vegetation. On the other hand, only evergreen forest showed a significant increase in maximum temperature. PET increased significantly in deciduous forest, mixed forest, and grassland (as shown in Table 2), which is mostly distributed in the Tibetan Plateau and the Lancang sub-basin located in the upper part of the MRB. The other vegetation types had no significant changes in PET.
According to the Intergovernmental Panel on Climate Change (IPCC) projection, mean annual air temperature increases by 0.02–0.03 °C per year in Southeast Asia [40]. Furthermore, Lacombe et al. [41] also suggested that temperatures will increase by about 0.023 °C/year across the MRB. Our results were consistent with these previous research findings. Precipitation can show positive or negative trends across Southeast Asia [42], with a high degree of uncertainty for the different parts of the Mekong River region. This variation ranges from a few millimeters (mm) less per year up to an additional 30 millimeters per year. PET also increased by 2.9 mm/year for mixed forest and 1.4 mm/year for grassland, with a significant statistical result at the 0.05 level.

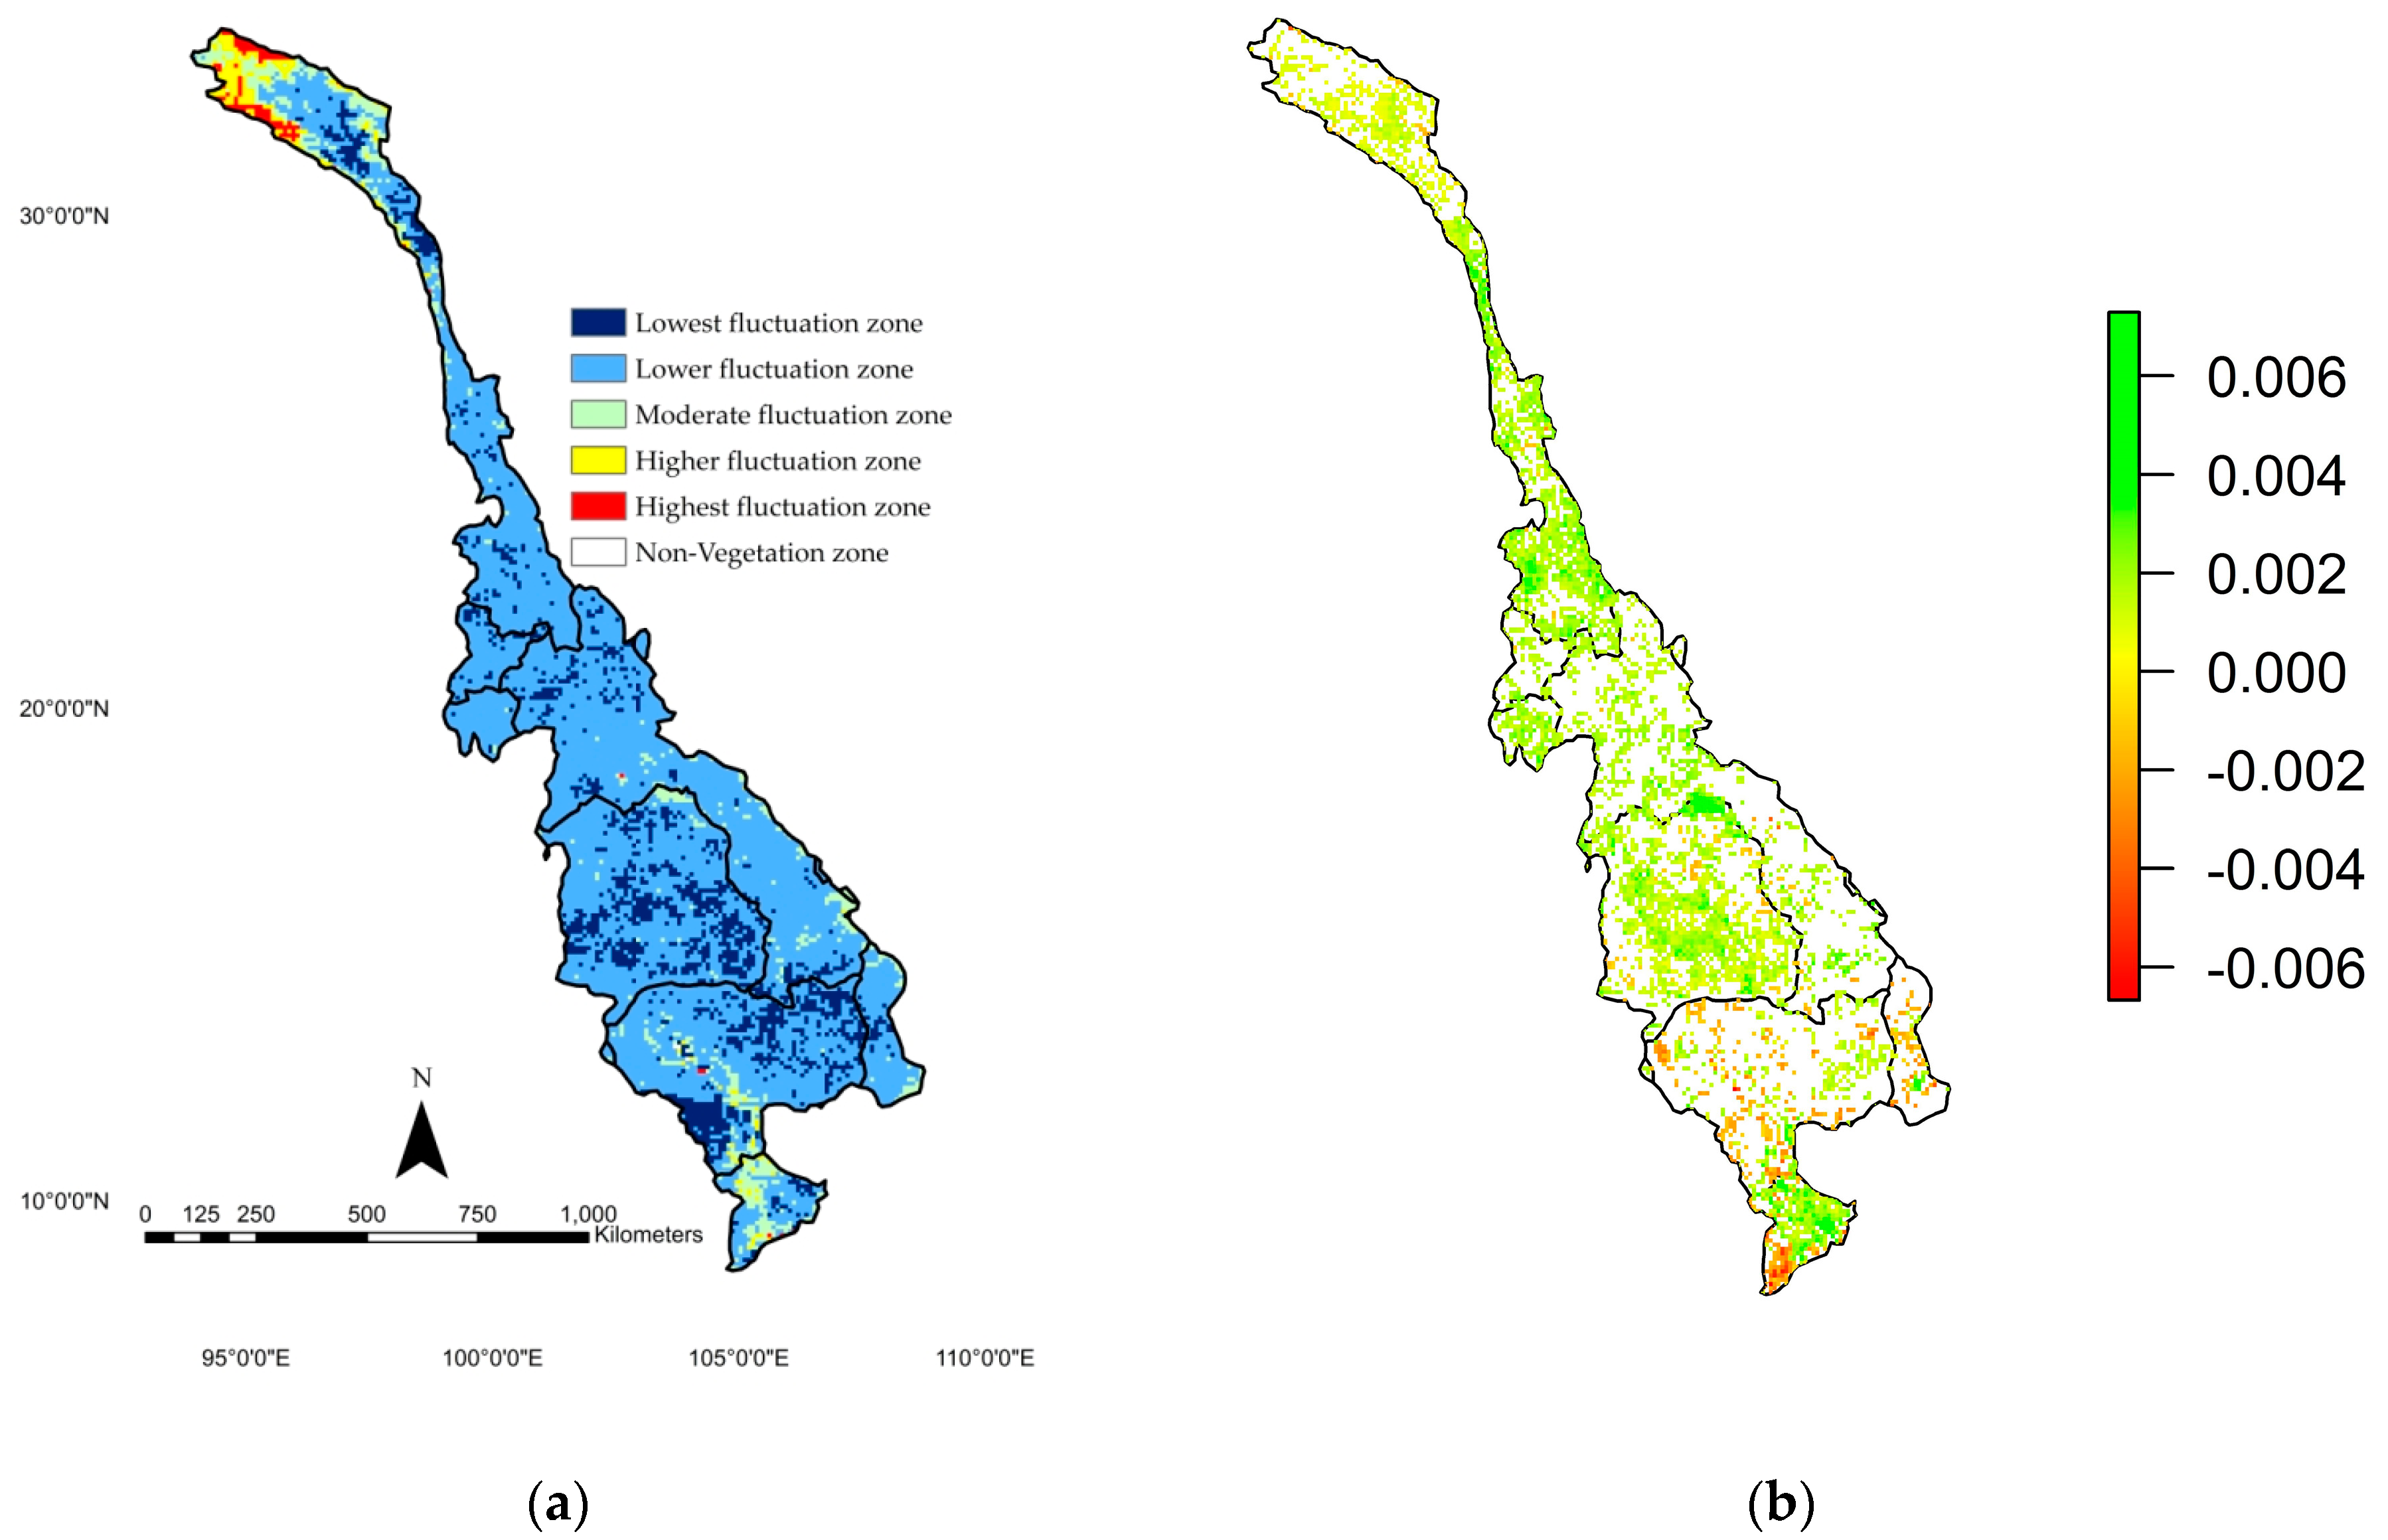
4.3. Spatial Annual NDVI Fluctuations and Trend Analyses

Based on the results from the CV analysis, we classified CV into five levels, namely the lowest and lower fluctuation, moderate fluctuation in addition to higher and the highest fluctuation (Figure 3a). The areas with the lowest NDVI fluctuations (CV = 0.00–0.10) consist of 15% of the total MRB. Areas with lower NDVI fluctuations (CV = 0.10–0.15) are widely distributed and account for 74% of the MRB, especially in the lower part of the MRB. Finally, the moderate fluctuation zone (CV = 0.15–0.20) covers around 8% of the basin. Higher fluctuation and the highest fluctuation zones cover only 2% and 1%, respectively, of the MRB area. Hence, the fluctuations in vegetation at the basin scale were steady over time, with variations occurring at the regional scale. Figure 3a illustrates that there is a clear pattern to the spatial distribution of the highest fluctuations, despite this zone only covering approximately 1% of the total basin. Land use change effect [6] and land degradation has probably caused the highest fluctuation zone to be distributed in the high lands of the Tibetan Plateau, which is mainly covered by a grassland ecosystem. Moreover, land degradation in the Tibetan Plateau is the result of warmer temperatures, variations in precipitation, melting glacier overgrazing, rat damage, and climatic heterogeneity in mountainous areas [4,43,44,45]. The lowest, lower, and moderate fluctuation zones (15%, 74%, and 8% of basin, respectively) were widely distributed in the middle, dominated by a mixed forest biome, to the lower part of the RMB, dominated by evergreen forest, deciduous forest, cropland, and savanna and woody savanna ecosystems.
Significant (p < 0.05) positive and negative annual mean NDVI trends over 30 years, across the MRB, are shown in Figure 3b. The trends were presented in NDVI units per year. Green represents positive trends, while dark red represents negative trends. The results demonstrate that the NDVI intermediately increased significantly, at around 0.002 to 0.003 per year, for many parts of the MRB; most obviously seen in South China, North and Northeastern Thailand, Myanmar, and Laos. The highest NDVI increasing slope, of approximately 0.006 per year, was shown to occur in the evergreen forest ecosystem in Laos. The NDVI greening trends in these biomes were also found by Chuai et al. [4] and Guo et al. [19]; they reported that NDVI moderately increases in forest and cultivation areas. However, a significantly decreasing NDVI trend has been found in the savanna and woody savanna ecosystems of Cambodia, which is highly related to human activities [18]. In addition, Liu et al. [46] showed a continuous browning trend in the savanna regime NDVI from 1982 to 2012. We found significantly increasing NDVI trends in some areas of grassland ecosystem in the high lands of the Qinghai-Tibetan Plateau, which are consistent with previous research [47,48].

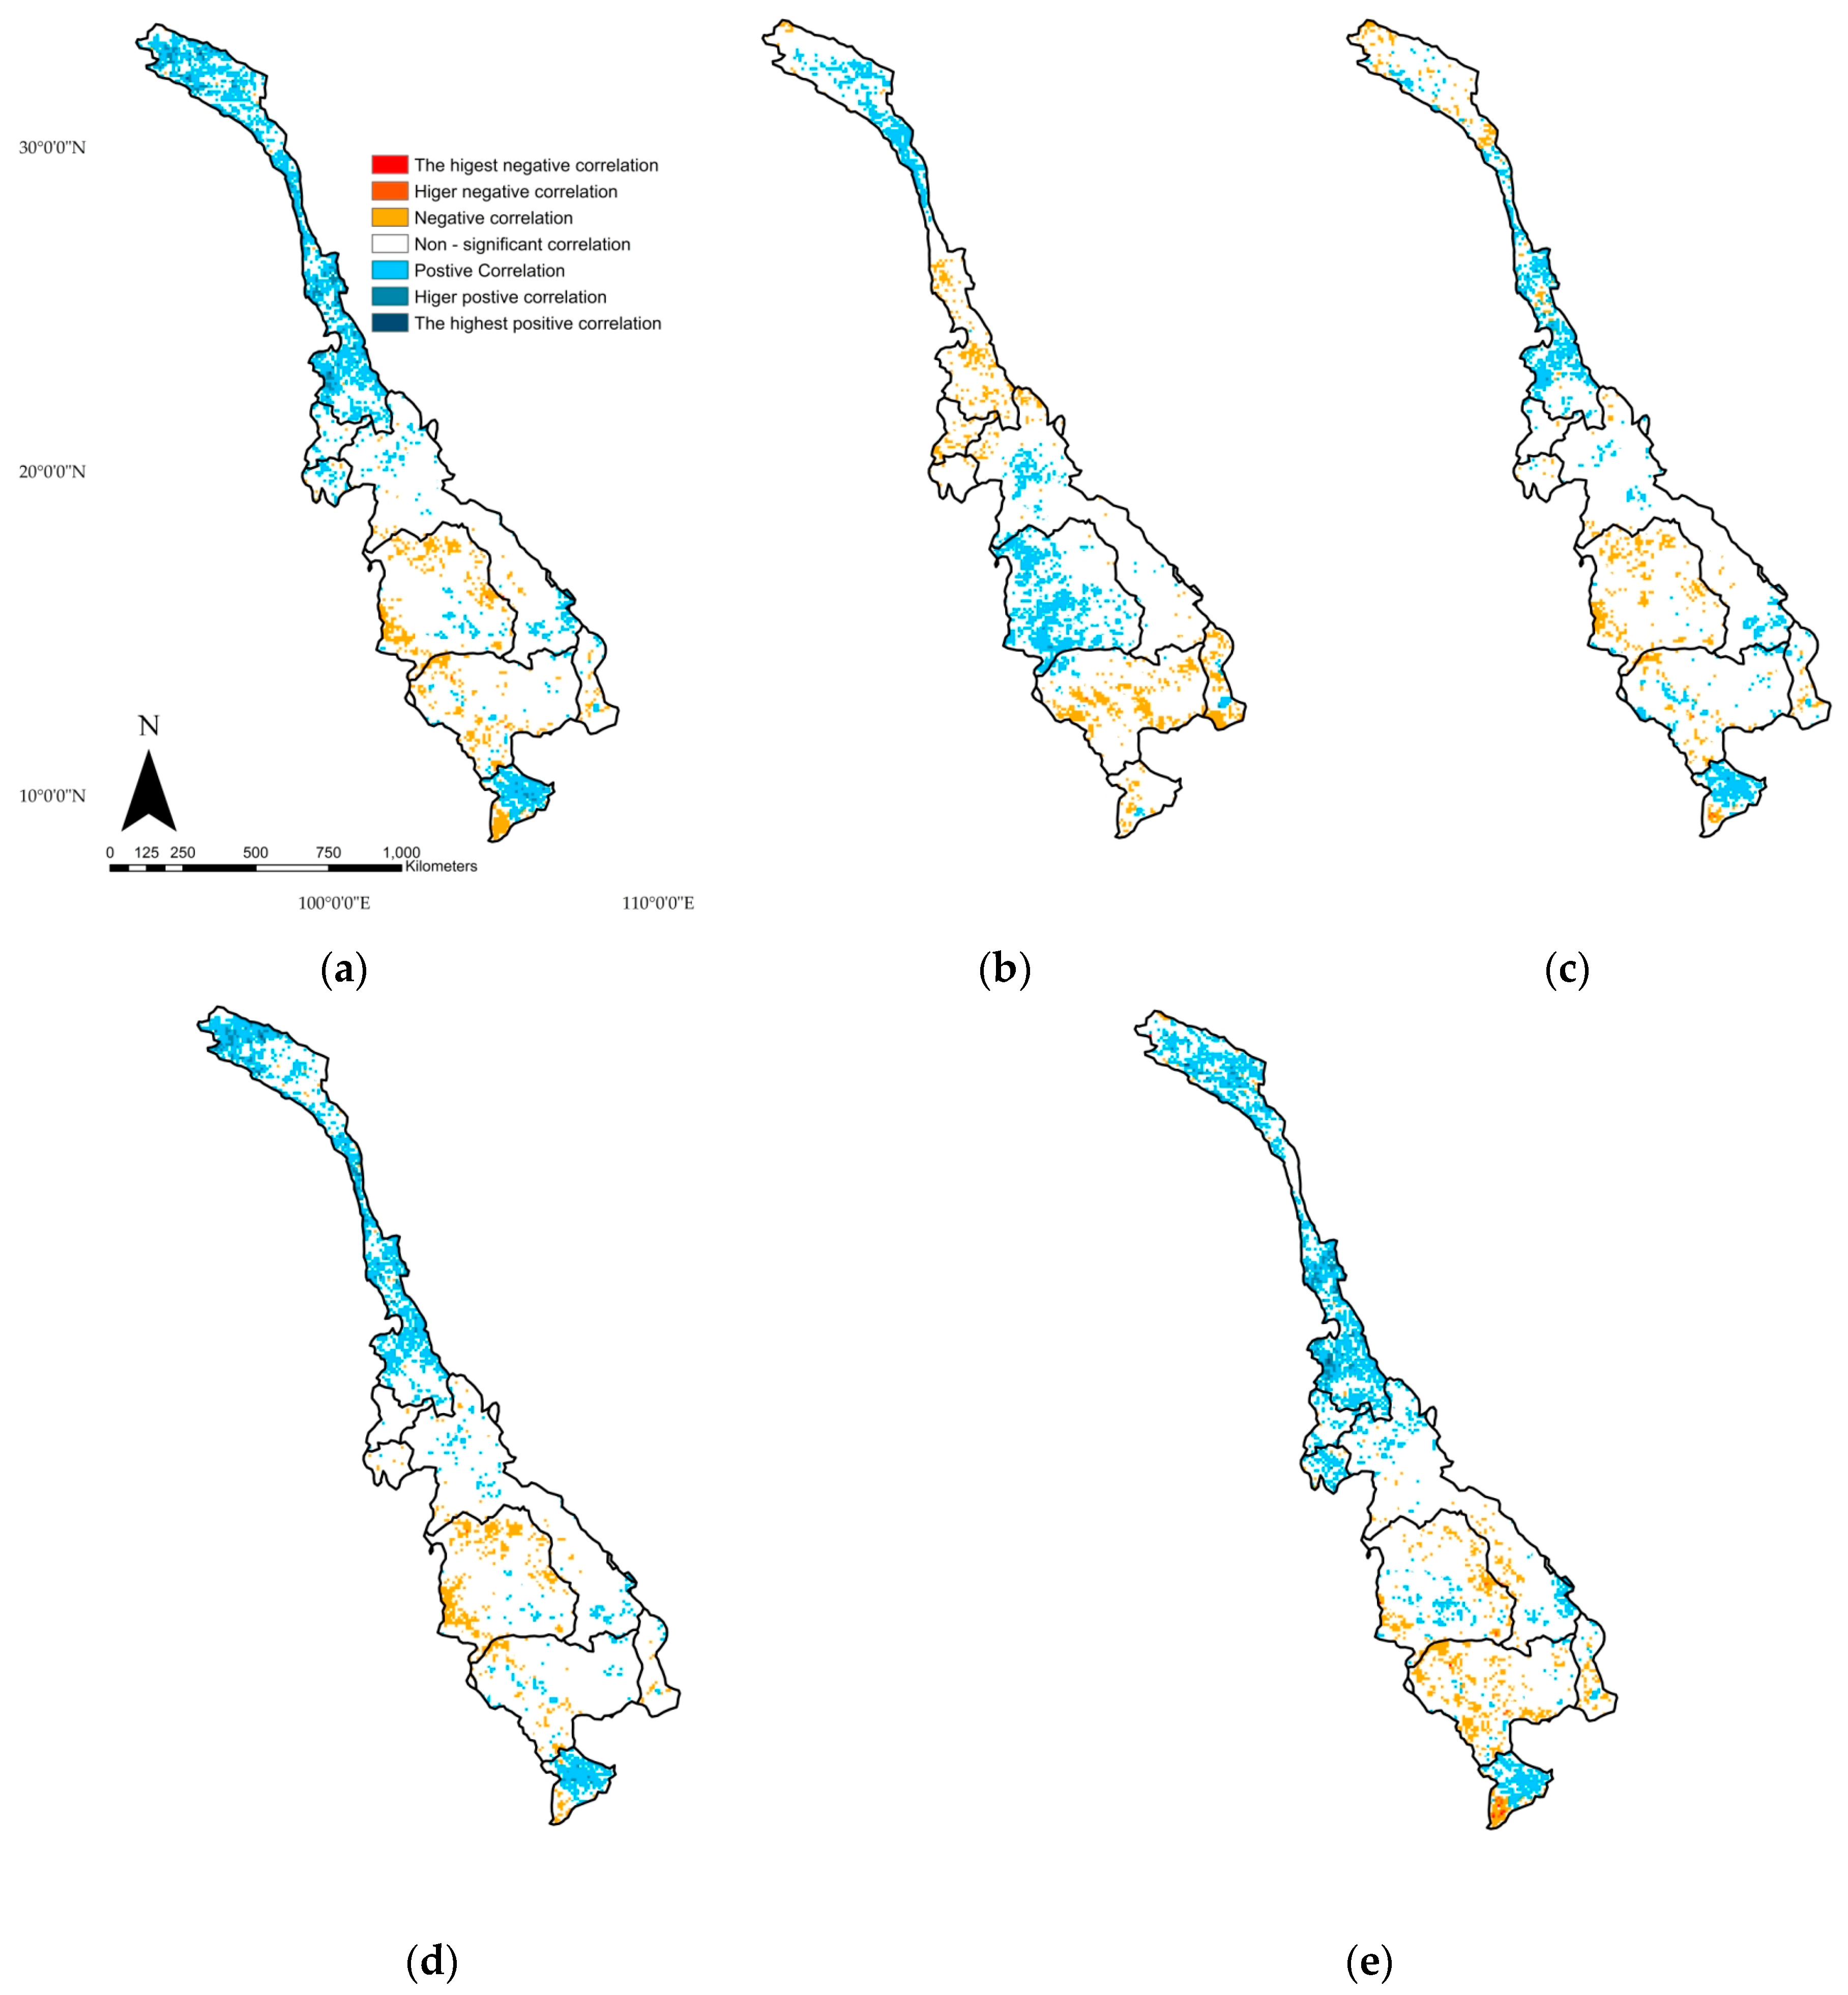
4.4. Correlation Analysis between NDVI and Climate Variables

Based on the results from the correlation analysis, each spatial correlation coefficient was categorized into six levels (Figure 4), which are the highest significant negative (r = −1.00 to –0.75), higher significant negative (r = –0.75 to –0.60), significant negative correlation (r = –0.60 to –0.30), significant positive correlation (r = 0.30 to 0.60), significant higher positive (r = 0.60 to 0.75), and the highest significant positive correlation (r = 0.75 to 1.00) coefficient, while the white area represents insignificant correlation between NDVI and climate variables (r = –0.3 to 0.3).
The spatial correlation between NDVI was positively correlated to average, maximum, and minimum temperatures in the upper part of the MRB grassland in the Qinghai-Tibetan Plateau, and the mixed forest biome in the Lancang River Basin (Figure 4a,d,e). There was a positive correlation between temperature and precipitation that was also found in the Qinghai-Tibet Plateau alpine vegetation [48]. The Lancang River Basin in China, and the headwaters of the Mekong River, experienced rising temperatures [18], which might promote the grassland’s primary production in head water, especially during the growing season. Moreover, Huang et al. [17] suggested that, while annual land surface temperature shows a weak relationship with the vegetation’s net primary production, alpine vegetation would be more sensitive to temperature during the growing season. The forest biome in the Lancang sub-basin demonstrates a positive correlation with the average, maximum, and minimum temperatures. This finding suggests that the warming effect may increase forest growth at the beginning of the growing period, while increasing minimum and maximum temperatures may reduce forest growth in the middle of the growth period [19].
In the lower part of the basin, the vegetation was mostly non-significantly correlated with average, maximum, and minimum temperatures, with the savanna and woody savanna ecosystems presenting the highest and higher negative correlations, especially in the west of Cambodia. It was clear that temperature has a negative effect on cropland, which is widely spread in Northeast Thailand. Precipitation was correlated with NDVI in grassland ecosystems in the southeast of the headwaters regions (Figure 4b), which is consistent with previous studies [17]. Mixed forest, savanna, and woody savanna biome were negatively correlated with precipitation.
In the savanna and woody savanna biome, Chamaille-Jammes et al. [11] highlighted that there is a weak relationship between interannual NDVI and precipitation, because the stability of the seasonal rainfall patterns seems to be the major contributing factor to long-term ecosystem stability. For mixed forest biomes located in cold regions, the findings for the mixed forest biome located in cold regions are consistent with those of Feng et al. [49], who concluded that forest growth tends to decrease with increasing precipitation in relatively cold regions. No correlation was found between precipitation and evergreen forest, except in the north of Laos, where precipitation was found to be positively correlated with evergreen forest and cropland in part of Northeast Thailand; this finding is also supported by Thavorntam and Mongkolsawat [5]. Moreover, they also noticed that dense vegetation cover tended to show the highest correlation with precipitation, while cropland in some parts of the Mekong Delta showed a negative correlation with precipitation due to irrigation being available during the dry season [5]. PET (Figure 4c) mostly shows the negative effect on vegetation in the headwaters, but shows a positive effect in the lower part of the Lancang sub-basin. In the lower part of the MRB, vegetation in the northeast of Thailand showed negative correlations with PET, which could imply that water (such as precipitation) might be an important factor in controlling vegetation growth in these areas. Higher temperature conditions accelerate the evaporation process, which leads to a water deficit and obstructs vegetation growth. However, this different correlation could be explained by dissimilar temporal and spatial vegetation growth conditions and the degree of human disturbance influence [4].

4.5. Climate Driving Factors of Vegetation Dynamics

Variable importance in projection (VIP) score and partial least square regression coefficient (PLSR coeff.) were used to identify the driving climatic factors and their effects on vegetation dynamics [2,3]. The conclusions are illustrated in Table 3.
For cropland, air temperature (average, minimum, and maximum temperature) was found to be an important contributing factor, compared to PET and precipitation (Table 3). Minimum and maximum temperature had negative effects on cropland NDVI, with PLSR coefficients of –0.427 and –0.442, respectively. This leads to PET having a negative impact on the cropland ecosystem, caused by the effect of rising temperatures, which initiates a decreasing crop yield, in addition to intensive human activities, such as fertilization and changing crop types [19,50,51,52,53]. Average, minimum, and maximum temperatures were important driving factors in the evergreen forest dynamic, having positive effects. Similarly, Prasad et al. [2] concluded that the Continental Index—the difference between minimum and maximum temperature—demonstrated a higher influence on the evergreen forest compared with the combined precipitation parameters and topographic parameters. Moreover, Guo et al. [19] suggested that the rising temperature may increase forest growth at the beginning of the growing period, but precipitation may decrease NDVI in the forest biome. However, the precipitation effect was not significant for the ecosystem dynamics in this study [19]. The negative effect of precipitation can provide increased cloud cover, which reduces crucial factors for forest growth, such as solar radiation and air temperature [53]. Liu et al. [54] also confirmed that in (sub) humid climate zones, vegetation shows a strong relationship with temperature and a negative correlation with precipitation. However, this is in contrast to the findings of Thavorntam and Tantemsapya [5], who showed that the negative effects of temperature in the forest types of Northeastern Thailand might be attributed to stress and different limiting factors for plants, which vary in space and climate zones. Deciduous forest was sensitive to all temperature ranges and precipitation. Average, minimum, and maximum temperatures were found to have negative effects on deciduous forest vegetation, while precipitation promotes productivity and encourages greenness. This might be due to deciduous trees needing to shed their leaves in order to prevent losing water from the stomata through evapotranspiration when temperatures rise, especially at maximum temperatures. Nevertheless, there is limited precipitation for deciduous trees to build up greenness. Precipitation solely drove the savanna and woody savanna ecosystems, with increased precipitation possibly leading to decreased greenness. However, the PLSR coefficient for this effect is very weak compared to others. This finding corresponds with previous studies [11], which suggest that the NDVI-precipitation effect becomes weaker when studied at the inter-annual scale. In addition, the stability of the seasonal effect of precipitation seems to be a controlling factor in the long-term stability of this ecosystem.
In the upper basin, driving factors for the mixed forest NDVI dynamics are (minimum) maximum temperature and PET with negative effects over the NDVI dynamics. It is, thus, clear that maximum temperature causes PET to have a negative influence on mixed forest ecosystem greenness. While temperature can contribute to a rise in NDVI, this effect might be governed by precipitation, which demonstrates a negative effect on NDVI, despite it not being vital in this model. Grassland ecosystem, maximum temperature, precipitation, and PET are crucial factors driving the NDVI dynamics. The rising effect of temperature will stimulate the evapotranspiration process. Due to this effect being significantly related to water deficiency and a dried soil layer, there is a subsequent reduction in vegetation growth. Precipitation is also a significant positive control factor, which means that water conditions is a limiting factor for vegetation growth. Evapotranspiration is a key factor in controlling grass growth [6,17]. In addition, anthropogenic activities have little influence on the grassland ecosystem, hence, precipitation is one of the main positive driving factors in this ecosystem [6].

5. Conclusions

Analysis of the relationships between NDVI and climate factors in the MRB using different statistical tools over the past three decades shows that:
(1)
The patterns of seasonal vegetation dynamics vary depending on vegetation types. The highest seasonality was shown by grassland, which is logic being annual plants, while evergreen forest was the one showing less seasonality. The average trends of NDVI seasonal dynamics were similar in the majority of vegetation types, with the main exception being grasslands, which displayed a significantly different pattern. However, there needs to be more focus on elevation and other topographic factors in future research.
(2)
NDVI, air temperature, precipitation, and PET were shown to have increasing temporal trends at all locations. Moreover, the spatial trend of NDVI confirmed that NDVI at the basin scale was found to be mostly increasing relative to the lowest and lower fluctuation levels during the last three decades.
(3)
Climate variables, air temperature, precipitation, and PET were shown to have positive correlations with vegetation in the upper part of the basin. In the lower part of the basin, evergreen forest demonstrated non-significant relationships with these variables. Cropland was only found to have a positive correlation with precipitation, while the savanna and woody savanna ecosystems were shown to have significant negative relationships with precipitation.
(4)
The climatic factors driving NDVI were dependent on vegetation types. Air temperature and PET governed the greenness of cropland, while the different types of forest show different controlling climatic factors; the evergreen forest biome is controlled by air temperature, while air temperature and precipitation are crucial for deciduous forests. The average rise in temperature drives greenness in a mixed forest. PET was important for the grassland biome in order to promote greenness, while precipitation could reduce its greenness. For savanna and woody savanna, precipitation was the sole negative contributor.

Acknowledgments

Authors would like to thank the Civil Service Commission (OCSC), Thailand, and Natural Science Foundation of China grant (41471026) for financial support.

Author Contributions

Tawatchai Na-U-Dom wrote the manuscript; Xingguo Mo and Mόnica Garcίa are the supervisors and critically revised this manuscript.

Conflicts of Interest

The authors declare no conflicts of interest in the publication of this manuscript.

References

  1. Overpeck, J.T.; Rind, D.; Goldberg, R. Climate-induced changes in forest disturbance and vegetation. Nature 1990, 343, 51–53. [Google Scholar] [CrossRef]
  2. Prasad, V.K.; Basarinath, K.V.S.; Eaturu, A. Effects of precipitation, temperature and topographic parameters on evergreen vegetation greenery in the Western Ghats, India. Int. J. Clomatol. 2008, 28, 1807–1819. [Google Scholar] [CrossRef]
  3. Yu, H.; Xu, J.; Okuto, E.; Luedeling, E. Seasonal response of grassland to climate change on the Tibetan Plateau. PLoS ONE. 2012, 7, 1–15. [Google Scholar] [CrossRef] [PubMed]
  4. Chuai, X.W.; Huang, X.J.; Wang, W.J.; Bao, G. NDVI, temperature and precipitation changes and their relationships with different vegetation types during 1998–2007 in Inner Mongolia, China. Int. J. Clomatol. 2013, 33, 1696–1706. [Google Scholar] [CrossRef]
  5. Thavorntam, W.; Tantemsapya, N. Vegetation greenness modeling in response to climate change for Northeast Thailand. J. Geogr. 2012, 23, 1052–1068. [Google Scholar] [CrossRef]
  6. Cao, R.; Jiang, W.; Yuan, L.; Wang, W.; Lv, A.; Chen, A. Inter-annual variations in vegetation and their response to climatic factors in the upper catchments of the Yellow River from 2000 to 2010. J. Geogr. 2014, 24, 963–979. [Google Scholar] [CrossRef]
  7. Chen, B.; Zhang, X.; Tao, J.; Wu, J.; Wang, J.; Shi, P.; Zhang, Y.; Yu, C. The impact of climate change and anthropogenic activities on alpine grassland over the Qinghai-Tibet Plateau. Agr. Forest. Meteorol. 2014, 189–190, 11–18. [Google Scholar] [CrossRef]
  8. Wang, H.; Chen, A.; Wang, Q.; He, B. Drought dynamics and impacts on vegetation in China from 1982 to 2011. Ecol. Eng. 2015, 75, 303–307. [Google Scholar] [CrossRef]
  9. Pettorelli, N.; Vik, J.O.; Mysterud, A.; Gaillard, J.M.; Tucker, C.J.; Stenseth, N.C. Using the satellite-derived NDVI to assess ecological responses to environmental change. Trends. Ecol. Evol. 2005, 20, 503–510. [Google Scholar] [CrossRef] [PubMed]
  10. Tucker, C.J.; Justice, C.O.; Prince, S.D. Monitoring the grasslands of the Sahel 1984–1985. Int. J. Remote Sens. 1986, 7, 1571–1581. [Google Scholar] [CrossRef]
  11. Chamaille-Jammes, S.; Fritz, H.; Murindagomo, F. Spatial patterns of the NDVI–rainfall relationship at the seasonal and interannual time scales in an African savanna. Int. J. Remote Sens. 2006, 27, 5185–5200. [Google Scholar] [CrossRef]
  12. Li, Z.; Guo, X. Detecting Climate Effects on Vegetation in Northern Mixed Prairie Using NOAA AVHRR 1-km Time-Series NDVI Data. Remote Sens. 2012, 4, 120–134. [Google Scholar] [CrossRef]
  13. Potter, C. Vegetation cover change in the Upper Kong River basin of the Sierra Nevada detected using Landsat satellite image analysis. Climatic Change. 2015, 131, 635–647. [Google Scholar] [CrossRef]
  14. Piao, S.; Mohammat, A.; Fang, J.; Cai, Q.; Feng, J. NDVI-based increase in growth of temperate grasslands and its responses to climate changes in China. Glob. Environ. Chang. 2006, 16, 340–348. [Google Scholar] [CrossRef]
  15. Tucker, C.J.; Slayback, D.A.; Pinzon, J.E.; Los, S.O.; Myneni, R.B.; Taylor, M.G. Higher northern latitude normalized difference vegetation index and growing season trends from 1982 to 1999. Int. J. Biometeorol. 2001, 45, 184–190. [Google Scholar] [CrossRef] [PubMed]
  16. Bogaert, J.; Zhou, L.; Tucker, C.J.; Myneni, R.B.; Ceulemans, R. Evidence fora persistent and extensive greening trend in Eurasia inferred from satellite vegetation index data. J. Geophys. Res.: Atmos. 2002, 107, 1–14. [Google Scholar] [CrossRef]
  17. Huang, C.; Li, Y.; Liu, G.; Zhang, H.; Liu, Q. Recent climate variability and its impact on precipitation, temperature, and vegetation dynamics in the Lancang River headwater area of China. Int. J. Remote Sens. 2014, 38, 2822–2834. [Google Scholar] [CrossRef]
  18. Zhang, B.; Zhang, L.; Guo, H.; Leinenkugel, P.; Zhou, Y.; Li, L.; Shen, Q. Drought impact on vegetation productivity in the Lower Mekong Basin. Int. J. Remote Sens. 2014, 35, 2835–2856. [Google Scholar] [CrossRef]
  19. Guo, L.; Wu, S.; Zhao, D.; Yin, Y.; Leng, G.; Zhang, Q. NDVI-based vegetation change in Inner Mongolia from 1982 to 2006 and its relationship to climate at biome scale. Adv. Meteoro. 2014. [Google Scholar] [CrossRef]
  20. Mekong River Commission (MRC). Overview of the Hydrology of the Mekong Basin; Mekong River Commission: Vientiane, Laos, 2005; pp. 12–14. [Google Scholar]
  21. Kite, G. Modelling the Mekong: Hydrological simulation for environmental impact studies. J. Hydrol. 2001, 335, 1–13. [Google Scholar] [CrossRef]
  22. Friedl, M.A.; Sulla-Menashe, D.; Tan, B.; Schneider, A.; Ramankutty, N.; Sibley, A.; Huang, X. MODIS collection 5 global land cover: Algorithm refinements and characterization of new dataset. Remote Sens. Environ. 2010, 114, 168–182. [Google Scholar] [CrossRef]
  23. Tucker, C.J.; Pinzon, J.E.; Brown, M.E.; Slayback, D.A.; Pak, E.W.; Mahoney, R.; Vermote, E.F.; El Saleous, N. An extended AVHRR 8-km NDVI dataset compatible with MODIS and SPOT vegetation NDVI data. Int. J. Remote Sens. 2005, 26, 4485–4498. [Google Scholar] [CrossRef]
  24. Chen, J.; Jönsson, P.; Tamura, M.; Gu, Z.; Matsushita, B.; Eklundh, L. A simple methods for reconstructing a high-quality NDVI time series data set based on the Savitzky-Golay filter. Remote Sens. Environ. 2004, 91, 332–344. [Google Scholar] [CrossRef]
  25. Geographical Data Analysis and Modeling, R Packages Version 2.5-8. Available online: https://cran.r-project.org/web/packages/raster/ (accessed on 2 July 2016).
  26. Harris, I.; Jones, T.; Osborn, T.; Lister, D.H. Update high-resolution grids of monthly climatic observation —the CRU TS 3.10 Dataset. Int. J. Climatol. 2013, 34, 623–642. [Google Scholar] [CrossRef] [Green Version]
  27. Milich, L.; Weiss, E. GAC NDVI interannual coefficient of variation (CoV) images: Ground truth sampling of the Sahel along north-south transects. Int. J. Remote Sens. 2000, 21, 235–260. [Google Scholar] [CrossRef]
  28. Kendall, M.G. Rank Correlation Methods, 4th ed.; Oxford University Press: London, UK, 1975. [Google Scholar]
  29. Sen, P.K. Estimate of the regression coefficient based on Kendall’s Tau. J. Am. Stat. Assoc. 1968, 63, 379–1389. [Google Scholar] [CrossRef]
  30. Fensholt, R.; Langanke, T.; Rasmussen, K.; Reenbreg, A.; Prince, S.D.; Tucker, C.; Scholes, R.J.; Le, Q.B.; Bondeau, A.; Eastman, R.; et al. Greenness in semi-arid areas across the globe 1981–2007—An Earth Observing Satellite based analysis of trends and drivers. Remote Sens. Environ. 2012, 121, 144–158. [Google Scholar] [CrossRef]
  31. Wold, H. The Fixed-Point Approach to Interdependent System; Elsevier Science Ltd.: Amsterdam, The Netherlands, 1981. [Google Scholar]
  32. Wold, H. Partial least squares. In Encyclopedia of Statistical Sciences; Kotz, S., Johnson, N.L., Eds.; John Wiley and Sons: New York, NY, USA, 1985. [Google Scholar]
  33. Kottek, M.; Grieser, J.; Beck, C.; Rudolf, B.; Rubel, F. World Map of the Köppen-Geiger climate classification updated. Meteorol. Z. 2006, 15, 259–263. [Google Scholar]
  34. Garcίa, M.; Litago, J.; Palacios-Orueta, A.; Pinzόn, J.E.; Ustin, S.L. Short-term propagation of rainfall perturbation on terrestrial ecosystems in the central California. Appl. Veg. Sci. 2010, 13, 146–162. [Google Scholar] [CrossRef]
  35. Van Leeuwen, W.J. D.; Hartfield, K.; Miranda, M.; Meza, F.J. Trends and ENSO/AAO driven variability in NDVI derived productivity and phenology alongside the Andes Mountains. Remote Sens. 2013, 5, 117–1203. [Google Scholar] [CrossRef]
  36. Rundell, P.W. Vegetation in the Mekong Basin. In The Mekong: Biophysical Environment of an International River Basin; Cambel, I.C., Ed.; Academic Press: Amsterdam, The Netherland, 2009. [Google Scholar]
  37. Vaiphasa, C.; Piamduaytham, S.; Viphasa, T.; Skidmore, A.K. A Normalized Difference Vegetation index (NDVI) Time-series of idle agriculture lands: A preliminary study. Eng. J. 2011, 15, 9–16. [Google Scholar] [CrossRef]
  38. Chitpaiboon, C. Farmer’s Livelihood and the Existence of Agriculture Sector in Bang Pla Ma District, Suphan Buri Province. Master’s Thesis, Kasetsart University, Bangkok, Thailand, 31 May 2013. [Google Scholar]
  39. Zhan, Z.Z.; Liu, B.B.; Li, H.M.; Wu, W.; Zhong, B. The Relationship between NDVI and Terrain factors. Procedia. Environ. Sci. 2012, 12, 765–771. [Google Scholar] [CrossRef]
  40. Christensen, J.H.; Hewitson, B.; Busuioc, A.; Chen, A.; Gao, X.; Held, I.; Jones, R.; Kolli, R.K.; Kwon, W.T.; Laprise, R.; et al. Regional climate projections. In Climate Change 2007: The Physical Science Basis. Contribution of Working Group I to the Fourth Assessment Report of the Intergovernmental Panel on Climate Change; Solomon, S., Qin, D., Manning, M., Chen, A., Marquis, M., Averyt, K.B., Tignor, M., Miller, H.L., Eds.; Cambridge University Press: Cambridge, UK, 2007. [Google Scholar]
  41. Lacombe, G.; Hoanh, C.T.; Smakhtin, V. Multi-year variability or unidirectional trends? Mapping long-term precipitation and temperature changes in continental Southeast Asia using PRECIS regional climate model. Clim. Chang. 2012, 113, 258–299. [Google Scholar] [CrossRef]
  42. Future Climate in World Regions: An Intercomparison of Model-Based Projections for the New IPCC Emissions Scenarios. Available online: http://www.ipcc-data.org/documents/scatter_plot_report.pdf (accessed on 15 August 2016).
  43. Liang, S.; Chen, J.; Jin, X.; Wan, L.; Gong, B. Regularity of vegetation coverage changes in the Tibetan plateau over the last 21 years. Adv. Earth Sci. 2007, 22, 33–38. [Google Scholar]
  44. Ding, M.; Zhang, Y.; Liu, L.; Zhang, W.; Wang, Z.; Bai, W. The relationship between NDVI and precipitation on the Tibetan Plateau. J. Geogr. 2007, 17, 259–268. [Google Scholar] [CrossRef]
  45. Cui, X.; Graf, H.F. Recent land cover changes on the Tibetan Plateau: A review. Clim. Chang. 2009, 94, 47–61. [Google Scholar] [CrossRef]
  46. Liu, Y.; Li, Y.; Li, S.; Motesharrei, S. Spatial and Temporal Patterns of Global NDVI Trends: Correlations with Climate and Human Factors. Remote Sens. 2015, 7, 13233–13250. [Google Scholar] [CrossRef]
  47. Peng, J.; Liu, Z.; Liu, Y.; Wu, J.; Han, Y. Trend analysis of vegetation dynamics in Qinghai-Tibet Plateau using Hurst Exponent. Ecol. Indic. 2012, 14, 28–39. [Google Scholar] [CrossRef]
  48. Liu, S.; Yan, D.; Shi, X.; Wang, G.; Yuan, Z.; Yin, J. Grassland NDVI response to climate change factors in different vegetation regionalization in China. In Proceedings of International Symposium GRMSE 2013, Wuhan, China, 8–11 November 2013.
  49. Fang, J.; Piao, S.; Zhou, L.; He, J.; Wei, F.; Myneni, R.B.; Tacker, C.J.; Tan, K. Precipitation patterns alter growth of temperate vegetation. Geophys. Res. Lett. 2005, 32, L21411. [Google Scholar] [CrossRef]
  50. Tao, F.; Yokosuka, M.; Xu, Y.; Hayashi, Y.; Zhang, Z. Climate changes and trends in phenology and yields of field crops in China, 1981–2000. Agr. Forest Meteorol. 2006, 138, 82–92. [Google Scholar] [CrossRef]
  51. Lobell, D.B.; Field, C.B. Global scale climate crop-yield relationship and the impact of recent warming. Environ. Res. Lett. 2007, 2, 014002. [Google Scholar] [CrossRef]
  52. Schlenker, W.; Roberts, M.J. Nonlinear temperature effects indicate severe damages to U.S. crop yields under climate change. PNAS 2009, 106, 15594–15598. [Google Scholar] [CrossRef] [PubMed]
  53. Mao, D.; Wang, Z.; Luo, L.; Ren, C. Integrating AVHRR and MODIS data to monitor NDVI changes and their relationship with climatic parameters in Northeast China. Int. J. Appl. Earth Obs. Geoinf. 2012, 18, 528–536. [Google Scholar] [CrossRef]
  54. Liu, Y.; Wang, F.; Guo, M.; Tani, H.; Matsuoka, N.; Matsumura, S. Spatial and Temporal relationship among NDVI, Climate factors and Land cover change in the North Asia from1982 to 2009. GISci. Remote Sens. 2013, 48, 371–393. [Google Scholar] [CrossRef]
Figure 1. (a) The location, (b) land cover, (c) climatology precipitation (mm/y), and (d) temperature (°C) in the Mekong River Basin (MRB).
Environments 04 00017 g001
Figure 2. Seasonal vegetation dynamics from 1982 to 2013.
Environments 04 00017 g002
Figure 3. (a) Spatial distribution of level of annual NDVI fluctuation and (b) spatial distribution of NDVI annual trend analysis (NDVI point/year) while insignificant pixels (p > 0.05) are marked out.
Environments 04 00017 g003
Figure 4. (a) The spatial distribution of the correlation level of NDVI with temperature, (b) precipitation, (c) PET, and (d) maximum and (e) minimum temperature in the Mekong River Basin. Insignificant pixels (p > 0.05) are marked out.
Environments 04 00017 g004
Table 1. Dominating vegetation types for each climate zone, based on the Köppen-Geiger climate classification [33].
Vegetation TypesClimate Zone
CroplandAw
Evergreen forestCwa
Deciduous forestAw
Savanna and woody savannaAw
Mixed forestCwb
GrasslandET
Aw = Equatorial savanna with dry winter climate, Cwa = Humid subtropical climate, Cwb = Subtropical Oceanic highland climate, and ET = Tundra climate.
Table 2. Sen’s slope and Mann–Kendall test of NDVI (Normalized Difference Vegetation Index), T (average temperature), TMN (minimum temperature), TMX (maximum temperature), Prec (precipitation) and PET (potential evapotranspiration) for six different vegetation type, from 1982 to 2013, in the Mekong River Basin.
Vegetation TypesNDVITTMNTMXPrecPET
Cropland0.007 *0.017 *0.020 *0.0143.5120.997
Evergreen forest0.0020.021 *0.026 *0.020 *8.627 *1.272
Deciduous forest0.0040.022 *0.025 *0.014 *5.3771.481 *
Mixed forest0.010 *0.037 *0.039 *0.036 *−1.5762.861 *
Grassland0.0020.031 *0.033 *0.028 *0.1161.381 *
Savanna and woody savanna0.0030.020 *0.027 *0.015 *0.015 *1.515 *
* Represents the significance at the p < 0.05 level.
Table 3. Variable Importance in Projection (VIP) score and Partial Least Square Regression coefficient (PLSR coeff.) for six vegetation types using Normalized Difference Vegetation Index (NDVI) as a predicted variable and climatic factors, which are average temperature (T), minimum temperature (TMN), maximum temperature (TMX), precipitation (Prec) and potential evapotranspiration (PET), as a predictor, where VIP score’s threshold = 0.8; numbers in bold represent the VIP score, which is >0.8 and PLSR coeff..
Vegetation TypesTTMNTMXPrecPET
VIP score,
PLSR coeff.
VIP score,
PLSR coeff.
VIP score,
PLSR coeff.
VIP score,
PLSR coeff.
VIP score,
PLSR coeff.
Cropland1.174, 0.7901.140, –0.4271.160, –0.4420.277, 0.00020.950, –0.0006
Evergreen forest1.372, 0.3441.489, 0.5340.872, 0.0190.144, –0.4810.347, –0.464
Deciduous forest1.077, –0.1300.935, –0.0771.168, –0.1781.065, 0.3480.685, 0.0009
Mixed forest1.095, 0.4521.088, –0.2961.101, –0.1290.672, –0.0030.977, –0.012
Grassland0.768, –0.1170.486, –0.0210.833, –0.0910.914, 0.0161.626, –0.056
Savanna and woody savanna0.470, 1.2710.656, –0.5400.416, –0.7421.898, –0.00080.756, –0.0031

