Article

Rapid Urban Growth in the Kathmandu Valley, Nepal: Monitoring Land Use Land Cover Dynamics of a Himalayan City with Landsat Imageries

1
School of Geographical Sciences and Urban Planning, Arizona State University, Tempe, AZ 85287, USA
2
School of Sustainability, Arizona State University, Tempe, AZ 85287, USA
3
School for the Future of Innovation in Society, Arizona State University, Tempe, AZ 85287, USA
*
Author to whom correspondence should be addressed.
Submission received: 11 September 2017 / Revised: 3 October 2017 / Accepted: 7 October 2017 / Published: 8 October 2017
(This article belongs to the Special Issue Sustainable Territorial Management)

Abstract

:
The Kathmandu Valley of Nepal epitomizes the growing urbanization trend spreading across the Himalayan foothills. This metropolitan valley has experienced a significant transformation of its landscapes in the last four decades resulting in substantial land use and land cover (LULC) change; however, no major systematic analysis of the urbanization trend and LULC has been conducted on this valley since 2000. When considering the importance of using LULC change as a window to study the broader changes in socio-ecological systems of this valley, our study first detected LULC change trajectories of this valley using four Landsat images of the year 1989, 1999, 2009, and 2016, and then analyzed the detected change in the light of a set of proximate causes and factors driving those changes. A pixel-based hybrid classification (unsupervised followed by supervised) approach was employed to classify these images into five LULC categories and analyze the LULC trajectories detected from them. Our results show that urban area expanded up to 412% in last three decades and the most of this expansion occurred with the conversions of 31% agricultural land. The majority of the urban expansion happened during 1989–2009, and it is still growing along the major roads in a concentric pattern, significantly altering the cityscape of the valley. The centrality feature of Kathmandu valley and the massive surge in rural-to-urban migration are identified as the primary proximate causes of the fast expansion of built-up areas and rapid conversions of agricultural areas.

Graphical Abstract

1. Introduction

The entire Himalayan region has been undergoing significant socio-economic changes in the last five decades [1,2]. However, the pace and ways some major cities in the foothills of Himalayas have transformed in the recent decades are unprecedented, raising sustainability concerns [3,4]. The Kathmandu Valley (KV) epitomizes this extraordinary urban growth occurring in the Himalayas. Located in the central hills of Nepal Himalayas, Kathmandu is the capital city of Nepal, and it combines with the Lalitpur and Bhaktapur metropolitan areas, along with several other smaller cities and towns to form the KV as a cosmopolitan and sprawling valley. This valley has been experiencing several new environmental challenges in the recent decades, such as traffic congestion, air pollution, declining water table, and loss of open space [5,6]. The impacts of rapid urbanization in the Himalayan cities, particularly sprawl and other types of pell-mell urban growth, go beyond the urban footprints [7]. Monitoring of land use and land cover (LULC) in these cities, therefore, is not only a pragmatic way to detect and quantify landscape-level transformation, but also a window to understanding the complex social-ecological relationships in the region characterized by its fragility and sensitivity to hazards and disaster, such as earthquakes, landslides.
Nepal is recorded as one of the top ten fastest urbanizing countries in the world [8]. The 2011 census recorded the population of the KV alone at one million [9] and is projected to double by 2030 [8]. The population growth in newly developed peri-urban areas is significantly higher when compared to the historic urban core of the valley. According to Muzzini & Aparicio [10], in 2011, annual population growth was high in the peripheral municipalities of Kirtipur (5%) and Madhyapur Thimi (5.7%). The growth of population and the rapid expansion of built-up area in recent decades have caused a substantial LULC change in KV. With 3.94% urban growth rate between 2010 and 2014, the KV is going through significant transformation of its landscapes in recent years [8] making it important to understand the dynamics of LULC change processes, including their interactions with local and regional environmental change.
Despite such rapid growth in population and urban area (interchangeably used as built-up area), only a few LULC change studies have been conducted on KV to date. For instance, Haack and Rafter [11] analyzed the land use changes that occurred between 1978 and 2000 using GIS tools and found around 450% growth of urban areas in these years. In another study, Haack [1] showed the similar trend of urban expansion by comparing maps from different years in the period of 1955 and 2000. More recently, Thapa and Murayama [6] analyzed LULC change patterns of the KV between the period of 1967 and 2000. They found that the urban growth increased particularly after the 1980s. Rimal [12] reported similar findings analyzing the urban growth pattern between 1976 and 2009. Thapa & Murayama [13] projected that the urban area will continue to increase along the major roads. While these studies highlighted the land change trajectories of the KV from the 1980s to the 2000s, much of the new conversions of agricultural land to housing development is left for speculation. When considering the massive expansion of urban areas and simultaneous diminution of agricultural lands that occurred especially during the first decade of 21st century, a systematic assessment of the LULC change patterns is crucial, as it would also help to interpret and contextualize much of the new urbanization patterns taking place in the Himalayan region. Our objective in this paper, hence, is to examine the LULC change dynamics in the period of 1989–2016 using Landsat imageries and pixel-based analysis methods and highlight the value of monitoring the urban growth of Himalayan cities to foster dialogue in the management of urban growth.

2. Study Area

Located between 27°36’ and 27°48’ N, between 85°12’ and 85°31’ E, the KV is a rapidly urbanizing mountain basin in the Himalayas. Surrounded by the Himalayan mountain range, the valley of Kathmandu is comprised of three districts: Kathmandu, Lalitpur, and Bhaktapur, together with expanding an area of 899 km2 [14]. The generally flat floor of the valley is at the average elevation of 1300 m surrounded by mountains that are 1900–2800 m tall [11], except for a narrow winding outlet of the Bagmati River towards the south, three mountain passes of about 1500 m altitude on the east and west of the valley. This valley is a tertiary structural basin that is covered by fluvial and lacustrine sediments and encircled by mountains on all sides [14]. The KV, therefore, can be pictured as a bowl-shaped depression with an elevated basin and a plateau with a rim. More than 20% of the KV has slopes >20°, and half of the area has >5° slopes [6]. The valley floor has two types of landforms- alluvial plains and elevated river terraces [15] and is known for growing cereals and vegetables. The climate of the KV is influenced by several factors, including the south Asian monsoon affecting precipitation and wind direction. The valley receives more than 80% of its annual rainfall during the four summer months—June through September. This is followed by a clear, sunny fall, cold winter, dry spring, and humid summer. The annual average rainfall and temperature in the valley are 1407 mm and 18.1 °C, respectively.
Administratively, the KV is divided into five municipal areas: Kathmandu, Lalitpur, Kirtipur, Madhyapur Thimi, and Bhaktapur, and several small village development committees (VDCs). With the history and culture dating back 2000 years, the cities within the KV rank among the oldest human settlements in the central Himalayas. The KV shares the characteristics with many other rapidly urbanizing cities in the region. These include, unregulated urban development, inadequate enforcement of land use policies, poorly maintained city infrastructures, the massive influx of people from surrounding rural areas and hinterlands, land speculation, excessive pressure of commercial activities, and gaps in supply and demand for basic services. The previous studies i.e., [1,6,11,12,14] indicated that the urban growth was happening in the central KV area and the mountainous areas were sparsely populated patches of agricultural settlements and mixed forests. As a result, disregarding the forested steep slopes (>20°) we focused our study on the central KV comprising an area of 422.84 km2 (Figure 1).

3. Methods

LULC change detection becomes a key research priority with multi-directional impacts on both natural and human systems [16]. Among many techniques of change detection, remote sensing is the most commonly used technique because of its cost-effectiveness and timesaving characteristics [17]. In this study, we used pixel-based approach to detect LULC change pattern. Lu et al. [18] and Tewkesbury et al. [19] provided an exhaustive list of pixel-based change detection methods. Of all these methods pre- and post-classification comparisons have widely been used owing to their comparative advantages, see [19,20,21,22,23,24]. In the pre-classification techniques, LULC changes are detected through the differences in the pixel reflectance values between dates of interest; however, these techniques are not efficient in showing the nature of change [18,25]. On the other hand, post-classification comparison provides a complete matrix for change detection, which makes it the widely most used change detection techniques [19,23,26]. For this reason, we selected post-classification comparison method to understand the nature and pattern of change. The accuracy of the LULC change in this technique largely depends on the individual accuracy of each classification [18].

3.1. Satellite Data

We used four Landsat images of the year 1989, 1999, 2009, and 2016 in this study (Table 1). These scenes were acquired from the freely available Landsat archive of United States Geological Survey (USGS) (http://earthexplorer.usgs.gov/). The KV is located at path 141, row 041 in worldwide reference system type 2 (WRS2). All of these scenes were already georeferenced to the Universal Transverse Mercator (UTM) map projection (Zone 45N) with WGS84 datum and ellipsoid. The acquisition qualities of these images were the highest (09, meaning no quality issues/errors detected). The cloud cover was insignificant in 2009 and 2016 images. The 1989 and 1999 images have considerable cloud cover, however. The cloud cover was on the western edge of the Landsat scene while our study area was located at the center of the scene. Therefore, there was no visible cloud cover over our study area. Yet, we did atmospheric correction for haze removal (see Section 3.2).

3.2. Image Pre-Processing

Satellite image preprocessing is essential before analyzing it to avoid data distortion or manipulation. Preprocessing is also needed to establish direct linkage between data and biophysical phenomena [21]. Our image preprocessing steps include scan-line corrector (SLC) gap filling, radiometric correction, and image enhancement.
The SLC, which compensates the forward motion of Landsat 7, permanently failed in May 2003. As a result of that, Landsat ETM+ scenes have zigzagged pattern gaps on both sides, which cause around 20% loss of data [27]. These unscanned data could be replaced by data in the overlap portion of adjacent scenes (i.e., lateral overlapping) or by subsequent passes over the same scene (i.e., images of the same area from other dates), with the result that every location would be observed eventually [28]. In this study, the gap filling for 2009 and 2016 Landsat ETM+ images were obtained overlapping the adjacent scenes of the same time.
Atmospheric correction and topographic normalization are required to improve the classification results [29,30]. Atmospheric correction primarily includes the removal of haze, which originates from fractions of water vapor, fog, dust, smoke, or other minute atmospheric particles [31]. The topographic normalization is important for mountainous areas such as KV, because the presence of slopes can cause variations in illumination of identical features [32,33]. We used Atmospheric and Topographic CORrection (ATCOR) feature in ERDAS Imagine for haze removal and topographic normalization [34,35]. ATCOR is used to eliminate atmospheric noise and illumination effects to retrieve physical parameters of the earth’s surface, such as surface reflectance. As our study area is a valley land with slight variation in topography, we used ATCOR3, which requires average elevation of the study area for the analysis. We took the average elevation of KV as 1377 m, obtained from ASTER Global DEM with 30 m spatial resolution. The de-hazing algorithm of ATCOR is useful to turn a hazy image into neat one, and the topographic correction results in the output of true reflectance values [36]. Image enhancement is the modification of pixel values to improve visual interpretation by increasing the distinction between features [37]. One of the most commonly used methods- histogram equalization (HE) was used in this study. The main idea of HE-based methods is to re-assign the intensity values of pixels to make the intensity distribution uniform to the utmost extent [38].

3.3. Classification Procedure

In pixel-based image classification, a combination of both supervised and unsupervised classification provides a more accurate land use classification scheme [39]. In this study, we used hybrid classification approach to derive five major land use classes, to be consistent with the classes commonly identified for Nepal (Table 2). Our hybrid approach comprises of unsupervised classification of images followed by supervised classification.
The hybrid classification of land uses in this study started with an unsupervised Iterative Self-Organizing Data Analysis (ISODATA) clustering into 75 clusters. Hyperclustering, which uses a much higher number of clusters than the desired classes [40] was chosen because the exact number of spectral classes in the data set was unknown yet [41]. These clusters were labeled as urban area, agricultural area, forest, bare ground, and river based on the Google Earth observation and other land use maps (see [6,11]) of the study site. Spectrally similar classes of the identical land use type were merged. The comprehensive set of the spectral class signature was used in the second stage as training data for supervised classification [42]. Next, we selected at least 100 training samples for each class. These spectral signatures were considered satisfactory only when the confusion among the land use was minimal [43]. We then conducted supervised classification using the maximum likelihood classifier (MLC) algorithm. The classification provided thematic raster layers, which were later used for post-classification change detection.

4. Results and Discussion

4.1. Classification Accuracy Assessment

Atmospheric and topographic disturbances are the two of many factors that could affect the accuracy of LULC change detection in mountain regions. The validity of the classification can be determined by accuracy assessment [44]. In this study, the accuracy of each classified image was assessed by a set of 450 points selected through stratified random sampling with at least 50 points for each class. We took at least 90 points for agricultural and built-up category, as they comprise most of our study area. Error matrix for cross-tabulation of the mapped class vs. reference class was used to assess classification accuracy. Overall accuracy, kappa coefficient, tau coefficient, producer’s, and user’s accuracy were derived from the error matrix. The summary of accuracy assessment is provided in Table 3.

4.2. LULC Change Trajectories in the KV

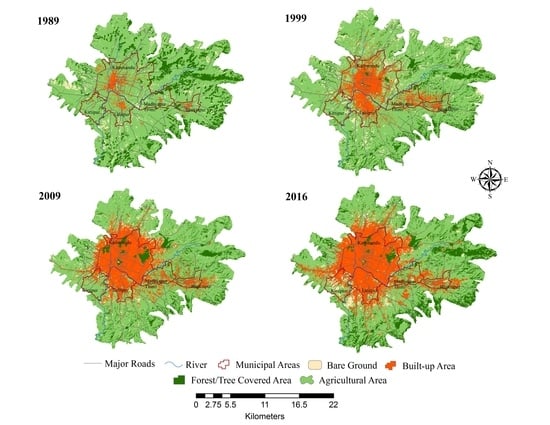
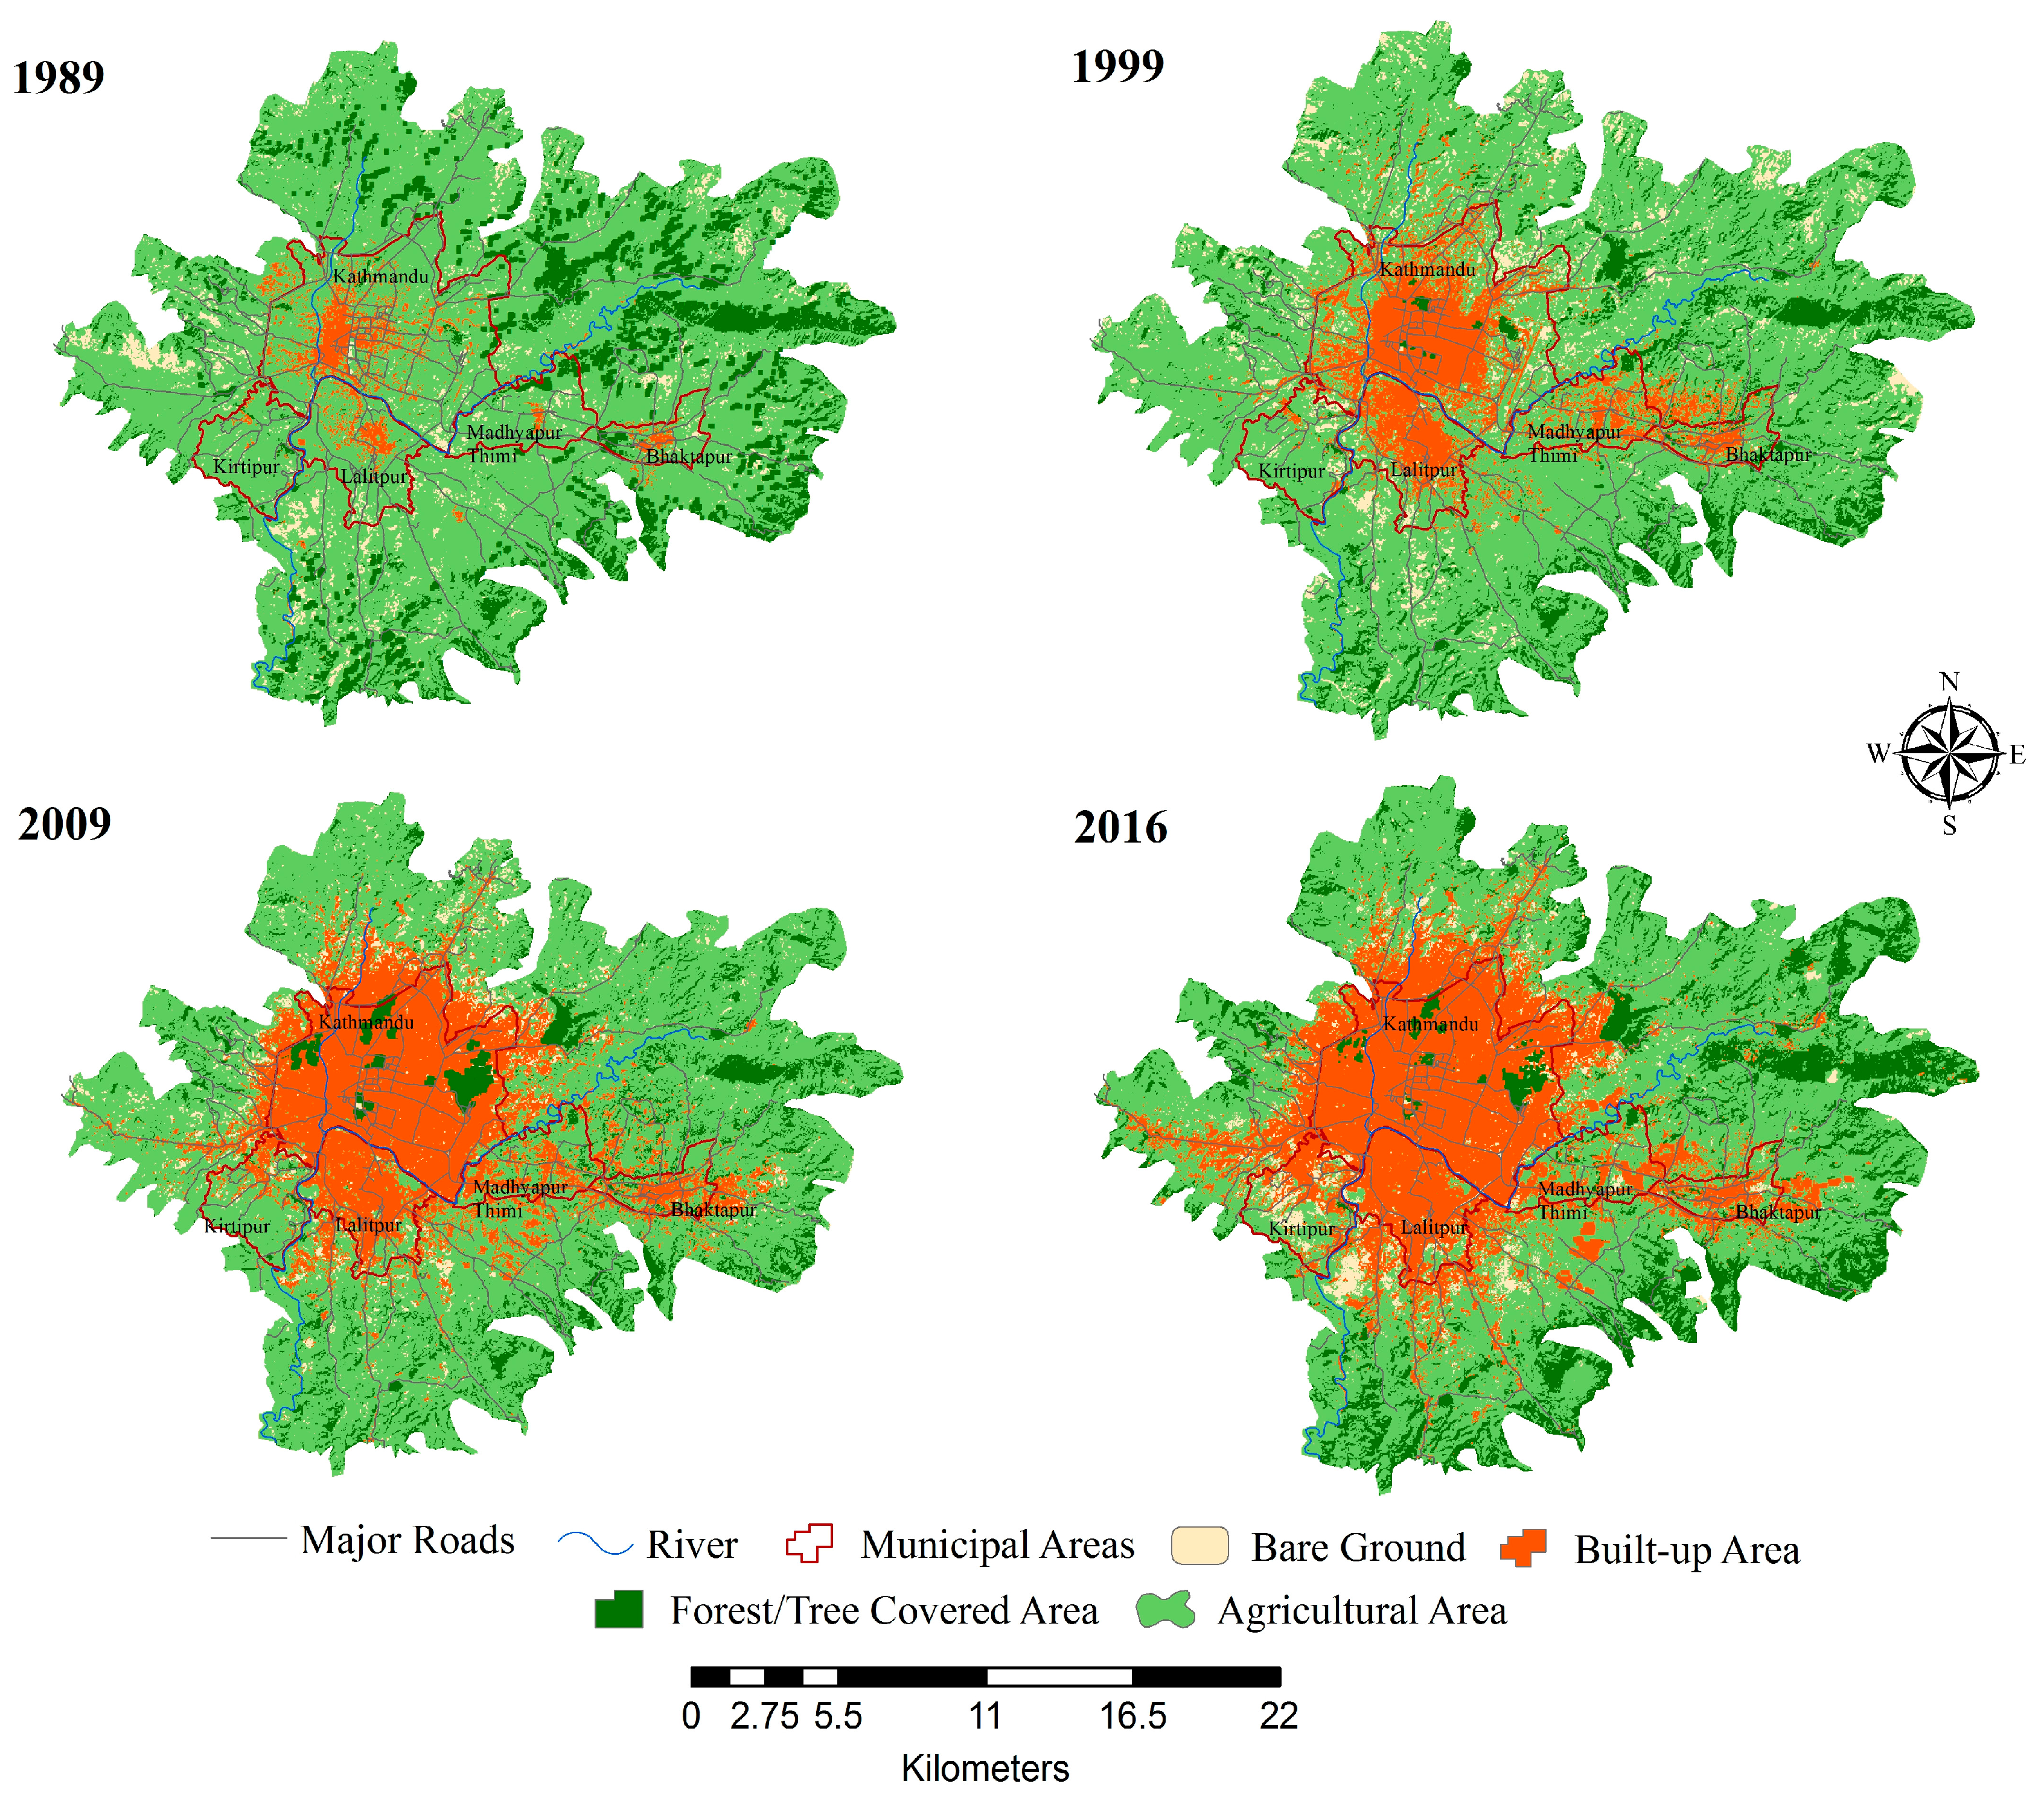
Until the 1980s, the urban areas (interchangeably used as built-up areas) of KV were limited within the confines of the historic settlements of the five municipalities. The outward expansion of the urban area began in the early 1990s and accelerated at the turn of the 20th century. In the 2000s, the built-up areas continued to expand further along the major roads that link the outskirts of the five municipalities and there is no sign that it is going to stop anytime in the near future, as more complex road networks are being planned for the future. Most of the newly expended built-up areas are replacing agricultural lands that once were considered to be the most fertile and productive in the country.
Table 4 summarizes the LULC change trends from 1989 through 2016 obtained from the classified images. From 1989 to 2016, built-up area increases from 2153 to 11,019 hectares (ha)—an increase of 412% is a very significant change, because much of the new developments occurred as an expansion of the existing city cores (Figure 2). At present, built-up area comprises about 26% of the study site, whereas agricultural area diminished at a rate of 1.8% per year resulting in a total 32% loss during the period of 1989–2016. Currently, the extent of the agricultural area is around 55% of the central KV compared to 82% in 1989 (Table 4). The rate of conversions of agricultural land to other types of land uses remains high throughout the study period (see details in Section 4.3). The loss of agricultural land in the KV resembles the worldwide trend of the urban conversions of agricultural lands reported elsewhere [45,46,47], but much is unknown about how these conversions will affect fragile ecosystems of this mountainous valley, including with the loss of green space, sealing of soil, disturbance to stream corridors, and alteration of agro-ecological services (e.g., water retention, vegetation, air circulation).
The forested or tree covered area comprises a small portion of the central KV, which include urban parks (e.g., Bhandarkhal, Boudha), forest resorts (e.g., Mrigasthali), forest reserves (e.g., Gokarna), and some forest patches on the steep slopes. Forest patches in the central KV are well maintained and only observed a marginal loss in last four decades. Covering around 4% area of the central KV, bare grounds are scattered largely at the outskirts of the Kathmandu city. The use of these privately-owned lands depends on the location of these lands. The bare grounds proximate to hilly areas are used for agriculture, whereas, the bare grounds located at the outskirts of the city are mostly cleared up to expand the built-up area.

4.3. LULC Change Pattern

To further explore the LULC change pattern, we created confusion matrices for 1989–2016, 1989–1999, 1999–2009, and 2009–2016 changes (see Table 5, Table 6, Table 7 and Table 8). In all of the tables, unchanged pixels are located along the major diagonal of the matrix. Conversion values were sorted by area and listed in descending order [48].
The results of 
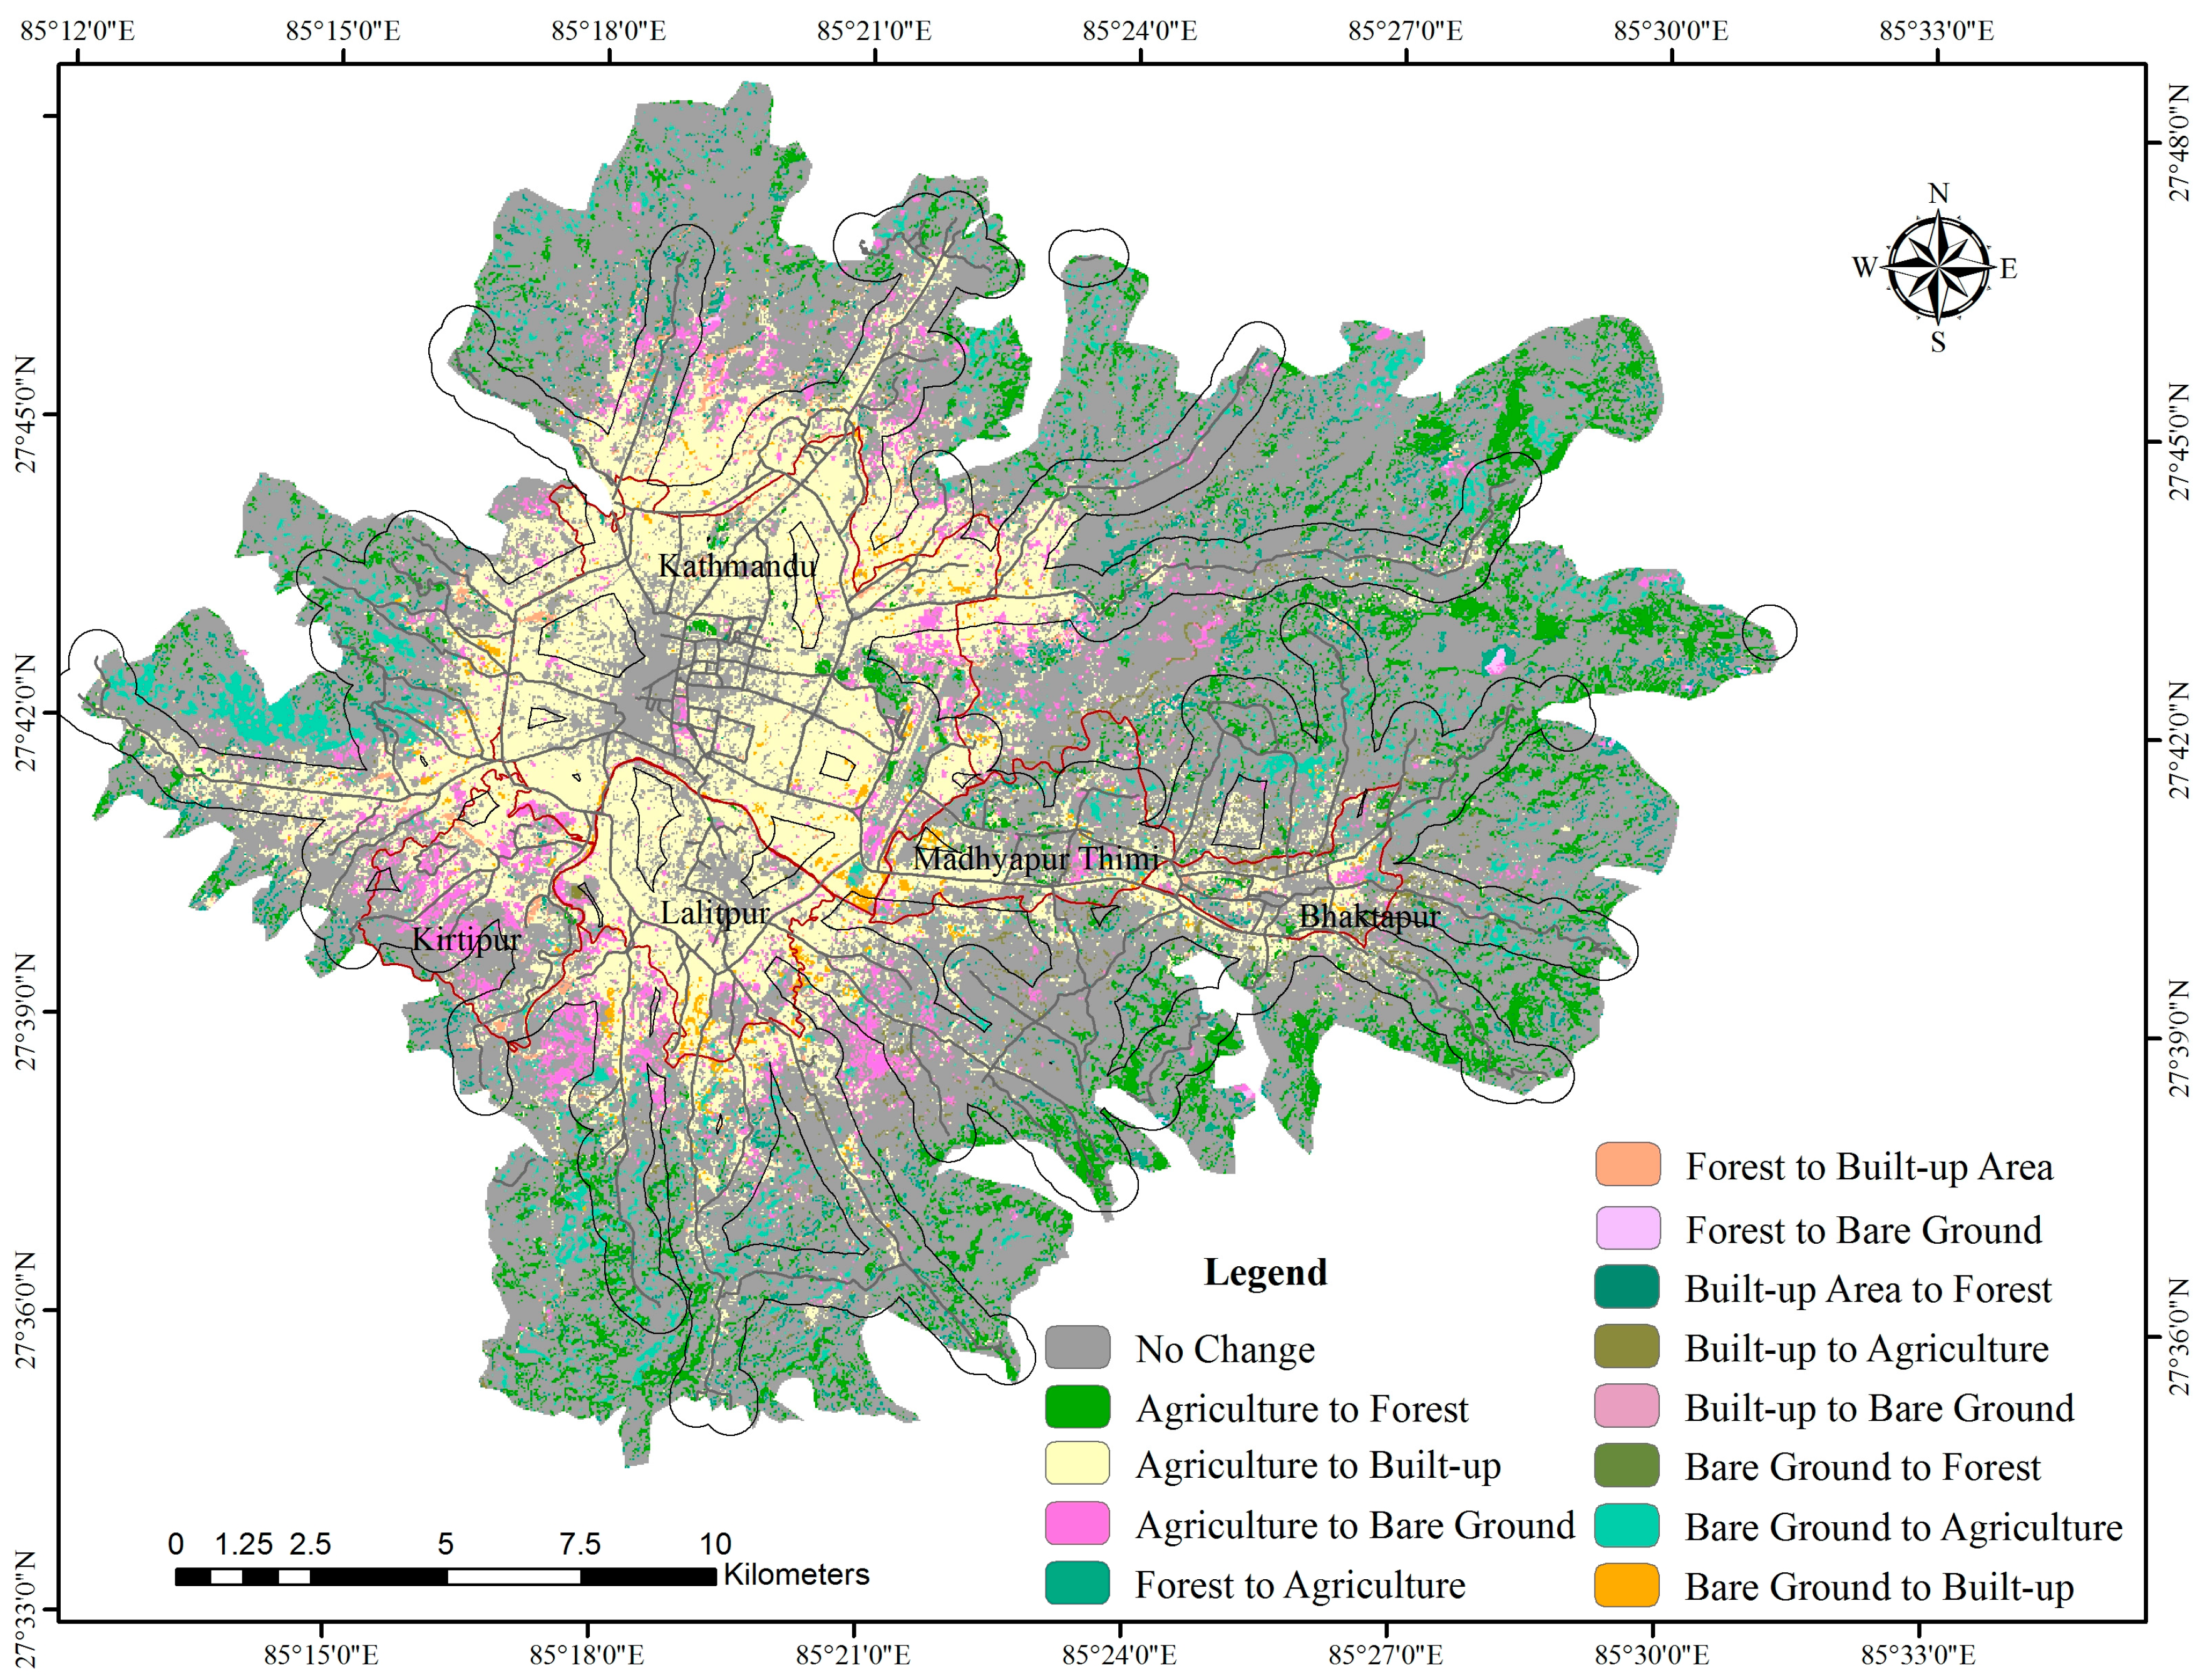
Table 5 indicate that the increase in the built-up area mainly came from the conversion of agricultural land to urban area in this 27-year study period, 1989–2016. Figure 2 and Figure 3 show the transition among land use classes in the period of 1989–2016. The built-up area expanded radially towards all direction at the rate of 14.70% per annum. The conversion to built-up area mostly happened within 500 m of major roads in KV (see Figure 2). The conversion of active agricultural land to bare ground or perennial fallows at the urban fringes shows a booming housing market during this period. This type of conversion is the initial step of urban expansion, which subsequently opens up the areas for housing developments. Of the 34,000 ha of agricultural land in 1989, around 26% (8880 ha) has been converted into built-up area within 2016. This result supports the fact that there was a huge surge in the rural-to-urban migration in the KV between the mid-1990s to the late 2000s—the proximate causes are discussed in Section 4.4.
Table 5 and Figure 2 also show some conversions of agricultural lands to forest areas occurring at the outer margins of our study area that are adjacent to the densely forested areas. Although more precise ground validation is needed, this trend indicates the discontinuation of agricultural activities on marginal, steep-sloped lands could pave the way for shrublands and secondary forests (see Figure 2). Similarly, approximately 18% (742 ha) tree covered area has been converted into agricultural lands, and most of these changes occurred in the peri-urban areas with lower elevation and slopes. It is not clear exactly what contributed to this change. It is important to note that this conversion took place in the areas far from the city area. It is also important to note that there has been a minimal change in tree-covered areas within the city limit (see Figure 3, for instance). The shifting from fallow to agricultural is seasonal, largely driven by monsoon rainfall patterns, local economy, and the availability of agricultural labor. The water area occupies very little space of the valley and has not been changed much in last three decades.
During the ten years between 1989 and 1999, the built-up area increased by about 120%, whereby significant expansion took place along the major roads such as local roads, service roads, and access roads that link the outlying towns with the five municipalities (see Figure 2 and Figure 3). The Kathmandu and Lalitpur municipalities experienced substantial growth in the built-up areas. The built-up areas were further expanded into the Madhyapur Thimi and Bhaktapur municipalities, and also in the southern parts of Duwakot and Jhaukhel VDCs. This growth of built-up area was primarily obtained by converting agricultural lands. Around 10% of the agricultural lands were converted into built-up areas in this period (see Table 6). Our analysis also reveals that as distance increases away from these major roads, the built-up areas tend to be less dense with the presence of open space and agriculture land. In other words, households select the locations that reduce their travel time and hence the concentration of settlement along the 500 m of major road networks.
The most aggressive form of urban growth in the KV happened between the period 1999 and 2009, which also coincides with the booming period of the real estate market largely fueled by the influx of migrants from the countryside displaced by political turmoil and/or by stagnant growth in agricultural sector. During this period (1999–2009), the KV saw 117% growth in built-up areas. This expansion came at the expense of 18% agricultural lands (see Table 7). The majority of this expansion occurred in Kathmandu and Lalitpur municipal areas, and for the first time in history, entire areas of these municipalities became urbanized (see Figure 3). The built-up area further stretched to eastward VDCs (i.e., Tathali, Sudal) expanding further beyond the Bhaktapur municipal boundary. In this decade, new built-up areas were established in the southeastern VDCs (e.g., Balkot, Tikathali, Sirutar, Lubhu), and along the major roads connecting the valley to the rest of the country. During this period, the valley also observed a substantial loss of forest cover whereby about 36% of the tree-covered area were cleared up for agriculture purpose. The rapid growth of built-up areas pushed the farmers to clear up the forest and expand agriculture on the foothills (see Figure 3). Overall, this fast growth of built-up areas during 1989–2009 can be attributed to the spike in real estate market, massive urban in-migration compounded by political instability in the countryside.
For the period between 2009 and 2016, two major LULC changes are worth noting: (1) forest area has been in a relatively stable condition in the central KV and is slowly beginning to expand in the outer margins, and (2) the aggressive urban growth of the 1999–2009 period has somewhat slowed down in the last ten years. The further expansion of forest areas in the KV outskirts, particularly in the northwestern part is notable; however, it is unclear which proximate causes are driving this change. One potential cause is that this area covers the Shivpuri Nagarjun National Park, which was formerly a watershed and wildlife reserve, but it was upgraded to a national park status in 2002 to more aggressively protect the forest areas and watershed vital to the water supply of the KV. Although the ground verification is needed, the areas in higher elevation and slopes that are adjacent to these forest areas are likely to have gained forest coverage. There are also some community forests located near those forest patches, where communities are taking more active roles in managing forest resources. One could argue that except for the protected forests, most forest patches are heavily fragmented, which is often consistent with reported cases of land fragmentation in the peri-urban area or urban fringes (see [49,50]).
Our analysis also reveals that urban growth has seen a slight slowdown in certain parts of the valley in recent years. Between 2009 and 2016, the built-up area increased only about 8% (see Table 8). The most noticeable growth was in Kirtipur municipality and the built-up areas in the KV were mostly expanding only along the major roads, radially growing outward from Kathmandu metropolitan area. Thapa & Murayama [13] predicted such outward urban growth and in-filling of existing urban areas. The built-up areas of some of the fastest growing areas, such as Madhyapur Thimi and Bhaktapur municipal areas ceased to expand in this period (see Figure 3). Overall, our results show that the KV cityscape has changed dramatically between 1989 and 2016. Because of the aggressive urban growth experienced since the mid-1990s to the late 2000s, the KV is showing a concentric pattern of urbanization. It is worthwhile to note that there were five distinct municipalities with distinct urban boundaries and plenty of open or green space between them until the late 1980s; however, those municipalities have since coalesced into a large metropolitan area where agricultural lands and open spaces were aggressively converted to residential areas to accommodate growing demands for housing and other urban infrastructures.

4.4. Key Drivers of LULC Change in KV

The results of the LULC change detection clearly establish that this valley has experienced an unprecedented level of urban growth in the last three decades. The final quarter of the 20th century witnessed a rapid expansion of the KV, reflecting the trend of urban growth dominant in the Himalayan region and elsewhere in South Asia [4]. This trend transformed the KV composed of the network of small towns—each with their own place-based identities and sophisticated architectural heritage—into a metropolis of ‘concrete jungle’, struggling to preserve its historical identity and ecosystem services [5]. Based on a careful review of the existing literature and expert knowledge, two of the co-authors have several years of working experience in Nepal, we identified that several proximate causes that have directly contributed to this transformation, including (a) rural-urban migration, (b) economic centrality, (c) socio-political factors, and (d) booming real estate market. All of these are arguably related to government policies (or the lack thereof).

4.4.1. Rural-Urban Migration

The KV has been experiencing rapid population growth particularly since the 1980s. Being the home of 22.3% Nepal’s urban population, KV is the fastest growing urban agglomeration in South Asia [8]. The highest contribution of this growth comes from rural to urban migration, which in turn is driven by the economic opportunities available in the capital relative to the rural areas. For instance, during the 1990s as high as 40% population growth happened due to urban in-migration [51]. Currently, the net inflow of migrants accounts for 36% of KV populations [52]. Hailed from the remote rural areas they mostly migrate because of economic reasons (i.e., better livelihood opportunities) and educational purpose. However, rural push factors play a dominant role in urban in-migration too [10]. Extreme poverty, lack of economic opportunities, low living standard, and an absence of basic amenities in the rural areas are some of the many push factors. Moreover, the civil conflict escalated the migration in recent decades [53]. While farmlands in conflict-affected areas were facing labor shortage, the displaced people also became the driver of LULC change in the KV.

4.4.2. Economic Centrality

The KV is also the administrative and economic hub of the country with a growing middle class [54]. The relatively flat topography, transportation accessibility, economic opportunities, and political and policy factors have consolidated the centrality feature of KV [1,10,11,14]. Among all of these factors, economic centrality is considered as the prime factor of rapid land use change. With the concentration of social services—primarily the growth of higher education and healthcare industry--and growing economic opportunities in tourism and other service sectors, the capital city has remained the most preferred destination for seeking jobs, income generation opportunities, and residence. This was further compounded by limited investment opportunities elsewhere in the country and/or other economic sectors in the cities. Similarly, the entire largest manufacturing cluster is concentrated in the KV, which provides as much as 40% manufacturing employment and 41% nonfarm and service employment [52]. Manufacturing employment per square kilometer is above 600 in the Kathmandu city area [55], the highest in the country, which in turn has attracted people to change their occupations from farming to manufacturing. In addition, centralization of government offices, the growth of foreign aid and tourism, and construction of access roads connecting the KV with the rest of Nepal have further propagated the economic centrality. This capital-centric development model (or urban primacy) that is typical of several low to middle-income countries has been one of the main drivers of LULC change in KV. The KV is Nepal’s gateway to tourists, whereby 90 percent of tourists enter the country [56], as the valley also has the rich cultural heritage including the seven designated world heritage sites. Tourism is also a key component of the valley’s economy [57], putting pressure on agriculture land to build facilities for continued flow of tourists and a growing middle class further away from the city core.

4.4.3. Socio-Political Factors

There has also been a huge influx of internally displaced people to the valley due to the decade-long civil unrest that began in the mid-1990s [58]. While triggering the socio-political crisis, the conflict disrupted local economic activities by frequent strikes, closures of businesses, extortion, and threats. More than 500,000 people believed to have been displaced during the insurgency period [56]. Nepal’s urban centers, especially KV, had to absorb the influx of these migrants. As a capital city, Kathmandu is naturally the political and administrative center of the country, and it also became a safe refuge for those internally displaced people during the political turmoil period of 1996 to 2008. Overall, the KV is the hub for all important socio-economic sectors in the country: tourism, finance, industry, education, transportation, and healthcare.

4.4.4. Real Estate Boom

Nepal in general and KV more specifically, experienced a real estate boom in the recent decades, especially between the mid-1990s to the late 2000s. According to Nepal Land and Housing Association, the land price in the KV risen by 300% since 2003, one of the key drivers of LULC change. Land ownership in the KV can be divided into private, Guthi (religious trust), government, and public. With more than 90 percent of cultivated lands and 61 percent of registered lands, private land ownership is a dominant form of tenure arrangement in the valley [59]. This means that there is little government control over land and housing in the KV, and the absence of real land-acquisition laws in practice, the state has not effectively regulated in the booming real estate market. During the fiscal year of 2008–2009 close to 185,000 people and firms bought new land and housing in the valley [60]. While there is no accurate data of how real estate agencies are currently involved in the land market, our interactions with local government officials reveal that there are as much as 150 real estate agencies and about a dozen of housing companies involved in land acquisitions, pooling, and housing in the KV. The increasing number of middle-class families in the KV is demanding new modern facilities such as, housing sub-divisions and colonies with modern amenities (e.g., private parking, modern grocery stores, restaurants) in the suburbs further contributing the LULC change in the fringe areas of the valley.
These key proximate causes of LULCC detected in KV are obviously interlinked and quite complex, but it is safe to argue that the economic centrality and urban population growth swelled primarily by the rural-to-urban migration played the major role in the rapid urban growth of the KV. It is essentially the large differences in economic opportunities between the KV and the rest of the country that resulted in a growing influx of people from rural areas to the KV.

5. Conclusions

Land change trajectories of the KV detected in this study represent a quintessential urbanization trend that is sweeping across the Himalaya region and beyond; this trend is a form of the “urban primacy model” in which a city—typically the capital—controls the flow of all economic and financial transactions, industrial production, and most importantly the governance of a country [4]. The most striking change in the KV is that agriculturally productive peri-urban areas are now being encroached upon by rapid housing development that is expanding outward in a typical concentric zone fashion. The built-up area is expanding rapidly mostly at the cost of agricultural lands. In last three decades, built-up areas increased by 412%, while agricultural land encountered a 31% loss. This change has transformed not only the physical landscapes of the valley, but it also has altered the ecosystem services provided by agricultural lands and open space. Our results on the urban growth rate support the main conclusion of Haack & Rafter [11], who found a 450% urban growth between 1978 and 2000—the urban growth in KV continued to be rapid and largely uncontrolled. Also, our findings of the outward expansion of city area along the major roads confirm the result of Thapa & Murayama [13].
The growth of settlements in the KV is generally spontaneous, with little intervention on the part of government authorities. The current existing land use policy (or constitutional provision) does not allow the government to impose any kind of restriction on the use of private property. Rapid urban expansion coupled with unmanaged settlement development has led to various socio-environmental challenges. The principal reason for such unmanaged developments in the KV is due to ineffective land use, zoning, and land sub-division policy. Additionally, the uncontrolled urban growth of KV during the last three decades due to the reasons discussed above has resulted in severe infrastructure deficits—the KV simply has inadequate infrastructure to support the massive surge in population growth seen in the last four decades. Unplanned urban growth can lead to a loss of open spaces that adversely impacts the urban environment. Given that the KV is projected to grow bigger in the future, failure to formulate sustainable urban development strategies and implement effectively could create severe socio-environmental consequences, including stagnant economic productivity, poor infrastructures, low quality of life, and rise in urban divide. From the perspective of holistic urban management, this may be a major hindrance in the future that needs urgent attention from government and other stakeholders.
This trend clearly shows the need to study the sustainability implications of urban sprawl in this fragile, mountainous landscape. How long can a mountainous valley like Kathmandu sustain the urban growth rate it has experienced the last four decades? It is particularly urgent to examine the impacts of the conversion of agricultural land to the built environment, socio-ecological significance of disappearing open space, fragmentation of habitats and important biological corridors, changes in urban food and diet system, rising urban divide, increasing pollution levels, and most importantly, the governance of urban growth (or the lack thereof).

Acknowledgements

The authors are thankful to Sanjoy Roy, GIS expert at the International Union for Conservation of Nature (IUCN) Bangladesh, and Tasnuba Jerin, PhD student at the Department of Geography, University of Kentucky for their suggestions and assistances. Finally, we thank the three anonymous reviewers for their useful suggestions.

Author Contributions

Milan Shrestha (MS) conceived the plan; MS and Asif Ishtiaque (AI) designed the experiments; AI performed the experiments and analyzed the data; AI, MS, and Netra Chhetri wrote the paper.

Conflicts of Interest

The authors declare no conflict of interest.

References

  1. Haack, B. A history and analysis of mapping urban expansion in the Kathmandu valley, Nepal. Cartogr. J. 2009, 46, 233–241. [Google Scholar] [CrossRef]
  2. Tiwari, P.C.; Joshi, B. Urban Growth in Himalaya: Environmental Impacts and Developmental Opportunities. Mt. Res. Initiat. Newsl. 2012, 7, 29–32. [Google Scholar]
  3. Goodall, S.K. Rural-to-urban migration and urbanization in Leh, Ladakh: A case study of three nomadic pastoral communities. Mt. Res. Dev. 2004, 24, 220–227. [Google Scholar] [CrossRef]
  4. UN-HABITAT. State of the World’s Cities 2012/2013: Prosperity of Cities; Routledge: Abingdon, UK, 2013. [Google Scholar]
  5. Haack, B.N.; Khatiwada, G. Rice and bricks: Environmental issues and mapping of the unusual crop rotation pattern in the Kathmandu Valley, Nepal. Environ. Manag. 2007, 39, 774–782. [Google Scholar] [CrossRef] [PubMed]
  6. Thapa, R.B.; Murayama, Y. Examining spatiotemporal urbanization patterns in Kathmandu Valley, Nepal: Remote sensing and spatial metrics approaches. Remote Sens. 2009, 1, 534–556. [Google Scholar] [CrossRef]
  7. Joshi, B.; Tiwari, P.C. Land-use changes and their impact on water resources in Himalaya. In Environmental Deterioration and Human Health; Springer: Dordrecht, The Netherlands, 2014; pp. 389–399. [Google Scholar]
  8. UNDESA (United Nations, Department of Economic and Social Affairs). World Urbanization Prospects. The 2014 Revision; UNDESA: New York, NY, USA, 2015. [Google Scholar]
  9. CBS (Central Bureau of Statistics). National Population and Housing Census 2001; Government of Nepal: Kathmandu, Nepal, 2012.
  10. Muzzini, E.; Aparicio, G. Urban Growth and Spatial Transition in Nepal: An Initial Assessment; The World Bank: Washington, DC, USA, 2013. [Google Scholar]
  11. Haack, B.N.; Rafter, A. Urban growth analysis and modeling in the Kathmandu Valley, Nepal. Habitat Int. 2006, 30, 1056–1065. [Google Scholar] [CrossRef]
  12. Rimal, B. Application of Remote Sensing and GIS, Land use/land cover change in Kathmandu. J. Theor. Appl. Inf. Technol. 2011, 23, 80–86. [Google Scholar]
  13. Thapa, R.B.; Murayama, Y. Urban growth modeling of Kathmandu metropolitan region, Nepal. Comput. Environ. Urban Syst. 2011, 35, 25–34. [Google Scholar] [CrossRef]
  14. Thapa, R.B.; Murayama, Y. Drivers of urban growth in the Kathmandu valley, Nepal: Examining the efficacy of the analytic hierarchy process. Appl. Geogr. 2010, 30, 70–83. [Google Scholar] [CrossRef]
  15. ICIMOD (International Centre for International Mountain Development). Economic and Environmental Development Planning for the Bagmati Zone; ICIMOD: Kathmandu, Nepal, 1993; Volume 3, p. 85. [Google Scholar]
  16. Turner, B.L.; Lambin, E.F.; Reenberg, A. The emergence of land change science for global environmental change and sustainability. Proc. Natl. Acad. Sci. USA 2007, 104, 20666–20671. [Google Scholar] [CrossRef] [PubMed]
  17. Lambin, E.F.; Geist, H.J.; Lepers, E. Dynamics of land-use and land-cover change in tropical regions. Annu. Rev. Environ. Resources 2003, 28, 205–241. [Google Scholar] [CrossRef]
  18. Lu, D.; Mausel, P.; Brondizio, E.; Moran, E. Change detection techniques. Int. J. Remote Sens. 2004, 25, 2365–2401. [Google Scholar] [CrossRef]
  19. Tewkesbury, A.P.; Comber, A.J.; Tate, N.J.; Lamb, A.; Fisher, P.F. A critical synthesis of remotely sensed optical image change detection techniques. Remote Sens. Environ. 2015, 160, 1–14. [Google Scholar] [CrossRef]
  20. Singh, A. Review article digital change detection techniques using remotely-sensed data. Int. J. Remote Sens. 1989, 10, 989–1003. [Google Scholar] [CrossRef]
  21. Coppin, P.; Jonckheere, I.; Nackaerts, K.; Muys, B.; Lambin, E. Digital change detection methods in ecosystem monitoring: A review. Int. J. Remote Sens. 2004, 25, 1565–1596. [Google Scholar] [CrossRef]
  22. Dewan, A.M.; Yamaguchi, Y. Land use and land cover change in Greater Dhaka, Bangladesh: Using remote sensing to promote sustainable urbanization. Appl. Geogr. 2009, 29, 390–401. [Google Scholar] [CrossRef]
  23. Hussain, M.; Chen, D.; Cheng, A.; Wei, H.; Stanley, D. Change detection from remotely sensed images: From pixel-based to object-based approaches. ISPRS J. Photogramm. Remote Sens. 2013, 80, 91–106. [Google Scholar] [CrossRef]
  24. Mahmud, M.S.; Haider, F.; Ishtiaque, A.; Masrur, A. Remote sensing & GIS based spatio-temporal change analysis of Wetland in Dhaka City, Bangladesh. J. Water Resour. Prot. 2011, 3, 781–787. [Google Scholar]
  25. Ridd, M.K.; Liu, J. A comparison of four algorithms for change detection in an urban environment. Remote Sens. Environ. 1998, 63, 95–100. [Google Scholar] [CrossRef]
  26. Gómez, C.; White, J.C.; Wulder, M.A. Optical remotely sensed time series data for land cover classification: A review. ISPRS J. Photogramm. Remote Sens. 2016, 116, 55–72. [Google Scholar] [CrossRef]
  27. Pringle, M.J.; Schmidt, M.; Muir, J.S. Geostatistical interpolation of SLC-off Landsat ETM+ images. ISPRS J. Photogramm. Remote Sens. 2009, 64, 654–664. [Google Scholar]
  28. USGS (United States Geological Survey). Preliminary Assessment of the Value of Landsat 7 ETM+ Data following Scan Line Corrector Malfunction. Available online: https://landsat.usgs.gov/documents/SLC_off_Scientific_Usability.pdf (accessed on 16 July 2013).
  29. Song, C.; Woodcock, C.E.; Seto, K.C.; Lenney, M.P.; Macomber, S.A. Classification and change detection using Landsat TM data: When and how to correct atmospheric effects? Remote Sens. Environ. 2001, 75, 230–244. [Google Scholar] [CrossRef]
  30. Hale, S.R.; Rock, B.N. Impact of topographic normalization on land-cover classification accuracy. Photogramm. Eng. Remote Sens. 2003, 69, 785–791. [Google Scholar] [CrossRef]
  31. Makarau, A.; Richter, R.; Müller, R.; Reinartz, P. Haze detection and removal in remotely sensed multispectral imagery. IEEE Trans. Geosci. Remote Sens. 2014, 52, 5895–5905. [Google Scholar] [CrossRef]
  32. Tan, B.; Masek, J.G.; Wolfe, R.; Gao, F.; Huang, C.; Vermote, E.F.; Ederer, G. Improved forest change detection with terrain illumination corrected Landsat images. Remote Sens. Environ. 2013, 136, 469–483. [Google Scholar] [CrossRef]
  33. Vanonckelen, S.; Lhermitte, S.; Van Rompaey, A. The effect of atmospheric and topographic correction methods on land cover classification accuracy. Int. J. Appl. Earth Observ. Geoinf. 2013, 24, 9–21. [Google Scholar] [CrossRef]
  34. Richter, R.; Schläpfer, D. Geo-atmospheric processing of airborne imaging spectrometry data. Part 2: atmospheric/topographic correction. Int. J. Remote Sens. 2002, 23, 2631–2649. [Google Scholar] [CrossRef]
  35. Richter, R.; Schläpfer, D. Atmospheric/Topographic Correction for Satellite Imagery. DLR-IB. 2005. Available online: http://www.rese.ch/pdf/atcor3_manual.pdf (accessed on 11 September 2017).
  36. Richter, R. Atmospheric/Topographic Correction from Satellite Imagery (ATCOR 2/3 User Guide, Version 8); DLR-German Aerospace Center: Wessling, Germany, 2011. [Google Scholar]
  37. Lillesand, T.; Kiefer, R.W.; Chipman, J. Remote Sensing and Image Interpretation; John Wiley & Sons: New York, NY, USA, 2014. [Google Scholar]
  38. Cheng, H.D.; Shi, X.J. A simple and effective histogram equalization approach to image enhancement. Digit. Signal Process. 2004, 14, 158–170. [Google Scholar] [CrossRef]
  39. Rozenstein, O.; Karnieli, A. Comparison of methods for land-use classification incorporating remote sensing and GIS inputs. Appl. Geogr. 2011, 31, 533–544. [Google Scholar] [CrossRef]
  40. Bauer, M.E.; Burk, T.E.; Ek, A.R.; Coppin, P.R.; Lime, S.D.; Walsh, T.A. Satellite inventory of Minnesota forest resources. Photogramm. Eng. Remote Sens. 1994, 60, 287–298. [Google Scholar]
  41. Cihlar, J. Land cover mapping of large areas from satellites: Status and research priorities. Int. J. Remote Sens. 2000, 21, 1093–1114. [Google Scholar] [CrossRef]
  42. Kuemmerle, T.; Radeloff, V.C.; Perzanowski, K.; Hostert, P. Cross-border comparison of land cover and landscape pattern in Eastern Europe using a hybrid classification technique. Remote Sens. Environ. 2006, 103, 449–464. [Google Scholar] [CrossRef]
  43. Gao, J.; Liu, Y. Determination of land degradation causes in Tongyu County, Northeast China via land cover change detection. Int. J. Appl. Earth Observ. Geoinf. 2010, 12, 9–16. [Google Scholar] [CrossRef]
  44. Congalton, R.G.; Green, K. A Practical Look at the Sources of Confusion in Error Matrix Generation. Photogramm. Eng. Remote Sens. 1993, 59, 641–644. [Google Scholar]
  45. Sun, C.; Wu, Z.F.; Lv, Z.Q.; Yao, N.; Wei, J.B. Quantifying different types of urban growth and the change dynamic in Guangzhou using multi-temporal remote sensing data. Int. J. Appl. Earth Observ. Geoinf. 2013, 21, 409–417. [Google Scholar] [CrossRef]
  46. Pandey, B.; Seto, K.C. Urbanization and agricultural land loss in India: Comparing satellite estimates with census data. J. Environ. Manag. 2015, 148, 53–66. [Google Scholar] [CrossRef] [PubMed]
  47. Hegazy, I.R.; Kaloop, M.R. Monitoring urban growth and land use change detection with GIS and remote sensing techniques in Daqahlia governorate Egypt. Int. J. Sustain. Built Environ. 2015, 4, 117–124. [Google Scholar] [CrossRef]
  48. Yuan, F.; Sawaya, K.E.; Loeffelholz, B.C.; Bauer, M.E. Land cover classification and change analysis of the Twin Cities (Minnesota) Metropolitan Area by multitemporal Landsat remote sensing. Remote Sens. Environ. 2005, 98, 317–328. [Google Scholar] [CrossRef]
  49. Irwin, E.G.; Bockstael, N.E. The evolution of urban sprawl: Evidence of spatial heterogeneity and increasing land fragmentation. Proc. Natl. Acad. Sci. USA 2007, 104, 20672–20677. [Google Scholar] [CrossRef] [PubMed]
  50. Shrestha, M.K.; York, A.M.; Boone, C.G.; Zhang, S. Land fragmentation due to rapid urbanization in the Phoenix Metropolitan Area: Analyzing the spatiotemporal patterns and drivers. Appl. Geogr. 2012, 32, 522–531. [Google Scholar] [CrossRef]
  51. ADB (Asian Development Bank). Unleashing Economic Growth: Region-Based Urban Strategy for Nepal; ADB: Manila, Philippines, 2010. [Google Scholar]
  52. CBS (Central Bureau of Statistics). Report on the National Labor Force Survey 2008; Government of Nepal: Kathmandu, Nepal, 2009.
  53. Nathalie, W.; Pradhan, M.S. Political Conflict and Migration: How Has Violence and Political Stability Affected Migration Patterns in Nepal? Presented at the Third Annual Himalayan Research Policy Conference, Madison, WI, USA, 16 October 2008. [Google Scholar]
  54. Liechty, M. Suitably Modern: Making Middle-Class Culture in Kathmandu; Martin Chautari: Kathmandu, Nepal, 2008. [Google Scholar]
  55. CBS (Central Bureau of Statistics). Nepal—Census of Manufacturing Establishments 2006–2007; Government of Nepal: Kathmandu, Nepal, 2007.
  56. Shrestha, B. The Land Development Boom in Kathamndu Valley, CDS/CIRAD/ILC. 2011. Available online: http://www.landcoalition.org/sites/default/files/documents/resources/CDS_Nepal_web_11.03.11.pdf (accessed on 18 January 2017).
  57. Pant, P.R.; Dangol, D. “Kathmandu Valley Profile”, Briefing Paper. Prepared for Governance and Infrastructure Development Challenges in the Kathmandu Valley. 2009. Available online: https://www.eastwestcenter.org/fileadmin/resources/seminars/Urbanization_Seminar/Kathmandu_Valley_Brief_for_EWC___KMC_Workshop__Feb_2009_.pdf (accessed on 11–13 February 2009).
  58. Bohra-Mishra, P.; Massey, D.S. Individual decisions to migrate during civil conflict. Demography 2011, 48, 401–424. [Google Scholar] [CrossRef] [PubMed]
  59. USAID (United States Agency for International Development). Kathmandu Valley: Urban Land Policy Study; PADCO (Planning & Development Collaborative International): Washington, DC, USA, 1986.
  60. Sharma, M.M. Realty Business Grows Across Major Cities Migration by Choice, Force Spurs Transactions. Republica. 2009. Available online: http://www.myrepublica.com/portal/index.php?action=news_details&news_id=10666 (accessed on 18 January 2017).
Figure 1. The Kathmandu valley study area.
Environments 04 00072 g001
Figure 2. Land use land cover change analysis of Kathmandu valley (1989–2016). The roads are buffered to 500 m to show as evidence that conversion of agricultural lands to built-up areas is particularly happening along the major roads.
Environments 04 00072 g002
Figure 3. Land use land cover maps of Kathmandu Valley (for the analysis, the roads are merged into “built-up area” category. However, in this figure the major roads are shown as a separate layer to understand the pattern of land use land cover change).
Environments 04 00072 g003
Table 1. Details of the Landsat images used in this study.
Acquisition YearAcquisition DateSensorAcquisition QualityCloud Cover
19892 DecemberLandsat TM098.14%
199928 JanuaryLandsat TM0924.66%
200916 FebruaryLandsat ETM+090.20%
20164 FebruaryLandsat ETM+090.26%
Table 2. Land use/land cover classes.
Land Use/Cover ClassLand Uses and Land Covers Included in Class
Urban/Built-up areaStructures of all types: residential, industrial, commercial, airports, and roads/highways
Agricultural areaCroplands and temporary grasslands used for agriculture
Forest/Tree covered areaForest, parks and permanent tree covered area
Bare ground (BG)Vacant lands, open area, and fallow lands
RiverRiver
Table 3. Summary of classification accuracies (in %).
LULC Class1989199920092016
Producer’sUser’sProducer’sUser’sProducer’sUser’sProducer’sUser’s
Built-up Area10088.24100.091.8998.0885.099.0391.89
Agriculture80.4990.8381.3786.4681.4883.8189.3886.52
Forest94.7492.3197.5395.1895.8997.2296.3095.12
BG86.5481.8275.4783.3386.2185.7185.2589.66
River98.2395.00100.00100.0097.5090.8998.6095.00
Overall Accuracy88.1288.2286.2788.69
Kappa Coefficient0.850.850.820.85
Tau Coefficient (Equal probability)0.850.850.830.86
LULC: land use and land cover.
Table 4. Summary of land use land cover change in the period of 1989–2016 (areas are presented in hectares).
LULC Class1989199920092016
Area%Area%Area%Area%
Built-up Area2153.795.104712.8811.1510,216.2024.1611,020.6226.06
Agriculture34,057.4080.5431,069.2073.4827,007.3763.8723,387.0655.30
Forest4138.569.794172.769.893627.998.586227.3714.73
BG1854.544.392252.75.341355.133.211576.733.73
River80.000.1976.800.1874.500.1873.000.17
Total42,284.30100.0042,284.30100.0042,284.30100.0042,284.30100.00
Table 5. Land use land cover change matrix (1989–2016). (Areas are presented in hectares.)
LULC Class2016
Built-Up AreaAgricultureForestBGWaterTotal
1989Built-up Area1541.79378.18210.3323.490.02153.79
Agriculture8880.3920,973.1029071296.900.034,057.39
Forest262.26742.323100.2333.750.04138.56
BG334.981289.169.81220.590.01854.54
River1.204.300.001.5073.0080.00
Total11,020.6223,387.066227.371576.7373.0042,284.30
Table 6. Land use land cover change matrix (1989–1999). (Areas are presented in hectares.)
LULC Class1999
Built-Up AreaAgricultureForestBGWaterTotal
1989Built-up Area1249.38675.54216.968.910.002153.79
Agriculture3240.1827,823.601166.851819.080.0034,057.4
Forest158.581184.222787.3311.430.004138.56
Fallow land63.541376.101.62413.280.001854.54
River1.202.000.000.0076.8080.00
Total4712.8831,069.204172.762252.7076.8042204.3
Table 7. Land use land cover change matrix (1999–2009). (Areas are presented in hectares.)
LULC Class2009
Built-Up AreaAgricultureForestBGWaterTotal
1999Built-up Area3978.27615.96100.0817.370.004712.88
Agriculture5627.8823,590.29959.76889.290.0031069.22
Forest92.881507.952564.67.290.004172.76
Fallow land517.141290.873.51441.180.002252.70
River0.002.300.000.0074.5076.80
Total10,216.1727,007.373627.991355.1374.542,204.36
Table 8. Land use land cover change matrix (2009–2016). (Areas are presented in hectares.)
LULC Class2016
Built-Up AreaAgricultureForestBGWaterTotal
2009Built-up Area8192.701598.466.69358.380.0010,216.17
Agriculture2397.7820,345.243386.8875.160.0027,007.37
Forest145.53693.542770.7018.180.003627.99
Fallow land283.41745.653.06323.010.001355.13
River0.000.000.001.5073.0074.50
Total11,019.4223,382.836227.291574.7373.0042,204.27

