Holistic Assessment of Carbon Capture and Utilization Value Chains
by
 ,
,
Tryfonas Pieri
1,*, 
Alexandros Nikitas
2,
Arturo Castillo-Castillo
3 and
Athanasios Angelis-Dimakis
1 1
School of Applied Sciences, University of Huddersfield, Huddersfield HD1 3DH, UK
2
Huddersfield Business School, University of Huddersfield, Huddersfield HD1 3DH, UK
3
Faculty of Natural Sciences, Centre for Environmental Policy, Imperial College London, South Kensington, London SW7 2AX, UK
*
Author to whom correspondence should be addressed.
Environments 2018, 5(10), 108; https://0-doi-org.brum.beds.ac.uk/10.3390/environments5100108
Submission received: 4 July 2018
/
Revised: 20 September 2018
/
Accepted: 22 September 2018
/
Published: 25 September 2018
(This article belongs to the Special Issue Environmental Science and Technologies for the Management of Natural Ecosystems and the Sustainable Development of Urban Areas)
Abstract
:Carbon capture and utilization (CCU) is recognized by the European Union, along with carbon, capture and storage (CCS), as one of the main tools towards global warming mitigation. It has, thus, been extensively studied by various researchers around the world. The majority of the papers published so far focus on the individual stages of a CCU value chain (carbon capture, separation, purification, transportation, and transformation/utilization). However, a holistic approach, taking into account the matching and the interaction between these stages, is also necessary in order to optimize and develop technically and economically feasible CCU value chains. The objective of this contribution is to present the most important studies that are related to the individual stages of CCU and to perform a critical review of the major existing methods, algorithms and tools that focus on the simulation or optimization of CCU value chains. The key research gaps will be identified and examined in order to lay the foundation for the development of a methodology towards the holistic assessment of CCU value chains.
1. Introduction
Effects such as the melting of glaciers, rise in sea level, forests dying, and climate change are indications of global warming, which is caused by the release of heat trapping gases (greenhouse gases) to the atmosphere, with carbon dioxide (CO2) being by far the major contributor. The CO2 atmospheric levels have been continuously increasing between 1950 and 2017, have now reached at approximately 400 ppm the highest CO2 level ever recorded [1], and they are expected to continue increasing if people and businesses keep burning fossil fuels at the same rates as now.
In order to respond to these environmental pressures, in 2011 the European Union (EU) announced that the main target set in the Roadmap for 2050 is to gradually reduce the overall levels of the Greenhouse Gas Emissions (GHG) by 80% below the 1990 values (40% by 2030 and 60% by 2040) [2]. Towards that end, the European Commission’s 2011 Energy Roadmap has identified the three main pillars for supporting the transition to a low carbon economy: (a) wider implementation of renewable energy sources, (b) promotion of low carbon energy supply options (e.g., nuclear power or conventional fossil fuels supported by carbon capture), and (c) implementation of energy saving measures [3].
The major mechanisms put in place by EU to ensure that the targets will be met are (a) the EU Emissions Trading System (EU-ETS) which enables the trading of emission rights and covers 45% of EU’s greenhouse gas emissions coming from large-scale facilities in the power and industry sectors and (b) the national emissions reduction targets, which cover 55% of EU’s greenhouse gas emissions coming from houses, agriculture, waste, and transport. Renewable energy targets are promoted through the Renewable Energy Directive [4], designed to reflect each country’s starting point. Similarly, energy efficiency targets can be reached by following the Energy Efficiency Plan and Energy Efficiency Directive [5,6].
Achieving the milestones set means that (a) EU’s energy security will improve by the reduced dependence on imported energy sources making Europe more competitive; (b) advanced green growth will be effectively promoted; and, (c) more jobs will be created. The governance process will be improved as targets are met and the Energy Union is promoted as a cohesive system [7].
1.1. Carbon Capture as a Mitigation Option
As previously mentioned, carbon capture, either in the form of carbon capture and storage (CCS) or carbon capture and utilization (CCU), is one of the alternative instruments to achieve the emissions reduction targets, since energy production still relies heavily on fossil fuels. In addition, there are other industrial sources of CO2 emissions other than power generation, which cannot be mitigated by using more renewable energy sources or improving efficiencies. This means that CCS and CCU are able to decrease CO2 emissions in areas where the other measures have minor or no application.
CCS is the process of capturing and storing anthropogenic CO2 emissions underground as a way of reducing the amount of CO2 that is released in the atmosphere. CO2 can be transported via pipelines and stored in deep saline formations, coalbeds, mature and depleted oil or gas fields. Over the last 40 years, during enhanced oil recovery operation, CO2 was being stored underground as a consequence [8]. Although such operations have traditionally focused on optimizing oil production and not the storage per se, technologies that are used in EOR have facilitated the development and the wider implementation of CCS, especially in terms of CO2 transport and injection. Similarly, carbon capture and utilization shares the same initial steps, but instead of storing CO2 underground, CO2 is converted into commercial products, so additional research is required to render the whole chain technically and economically feasible [9].
1.2. Carbon, Capture and Utilization
A CCU value chain can be described by six major steps (Figure 1). The first step is the carbon source characterization, including data, such as its location, the CO2 output flowrate, the CO2 purity, and the type of output stream. The second step is the CO2 capture process, where CO2 is separated from the output stream using an appropriate technology based on the type of stream. Following the separation, purification, and compression take place based on the type of transportation and the required purity of the receiver. The fifth step is the transportation of CO2 to the receiver. The type of transportation is determined by the stream characteristics (i.e., flowrate, purity), the distance between source and sink, and other regional characteristics. The final step is utilization; where CO2 is delivered to the receiver at the required purity and flowrate and converted to the final product.
The technical characteristics of all six steps have been extensively studied in the literature. However, in order to be able to identify and eventually develop a viable CCU value chain, the economic characteristics of each component should be also analyzed. Moreover, the value chain should be assessed as a whole, by adopting a systemic approach and taking into account the interdependencies among its different components. The objective of this paper is to present the most important and relevant literature for these three aspects of developing a CCU value chain (technical characteristics, economic characteristics, value chain modelling), identify the existing research gaps, and lay the foundation for the development of a novel methodological framework for the holistic assessment of CCU value chains.
2. Technical Characteristics of a CCU Value Chain
2.1. Carbon Source Characterization
An initial attempt to characterize the carbon sources was performed by IPPC [10] through presenting the profile (purity and available quantity) of the major worldwide large CO2 stationary sources. Patricio et al. [11] presented an extensive list of CO2 sources and linked them to the type of industrial activity and the corresponding NACE code that these emissions might be produced by. They also listed the potential impurities in each stream as well as the typical magnitude of flow. Zakkour and Cook [12] emphasized on the high purity sources (>80% CO2), and briefly summarized the level of industrial activity in each sector. Fennel et al. [13] have also presented a detailed list of industrial and power generation sectors, focusing on the CO2 partial pressure and the cost thatis associated with its removal from the gas stream.
Regarding sources classification based on purity, there are no nationally or internationally agreed boundaries. Jin et al. [14] have classified CO2 sources in four different categories (High > 90%, Secondary High 50–90%, Moderate 20–50%, and Low < 20%). The Centre for Low Carbon Futures [15] has also classified CO2 sources in four categories (High > 90%, Secondary Highest: 50–90%, Moderate Level: 20–50%, Low < 20%) based on the impact of the CO2 concentration on the energy requirements and the corresponding cost for separating CO2 from the gas stream, whereas Angelis-Dimakis and Castillo [16] have proposed three classification bins (High > 90%, Moderate 20–90%, and Low < 20%). The overlapping of CO2 in the proposed categories and the inconsistencies among researchers makes the purpose of the categorization of sources and using the categories to optimize CCU value chains unclear and not very useful.
This short literature account showed that sources have distinctive characteristics in the way that CO2 is produced and it can be further categorized into three new categories that facilitate the matching with carbon capture technologies [17]. The three proposed categories are (a) high purity CO2 streams that come from sources that directly produce an output stream of 96–100% CO2 purity, (b) CO2 from syngas production, and (c) CO2 produced from the combustion of fuels.
2.2. Carbon Capture
Carbon capture is the most extensively studied component of the CCU value chain, especially since it is also a stage common to CCS. The objective of this paper is not to perform a detailed literature review, as there are many available either with a more chemical engineering approach [9,10,18,19] or from an industrial/commercial perspective [15,20].
There are also several research papers that provide a list of all possible CO2 capture options along with detailed process descriptions of each one [9,11,21,22,23,24]. Our focus will be to identify the most widely used technologies and to emphasize the characteristics that can be related to the carbon sources towards the implementation of a CCU value chain.
Carbon capture technologies are classified in terms of CO2 separation from the stream in the following three categories [9,22,25,26,27,28,29]:
- Post-combustion carbon capture, when separation takes place after combustion. This process involves CO2 capture from the exhaust gases after the combustion of fossil fuels. The most common separation technique in this category is separation by chemical absorption.
- Pre-combustion carbon capture, when separation takes place before combustion. This process involves CO2 capture from streams containing H2 and CO2 that usually result from natural gas reforming and the produced syngas reacts with H2 through a water gas shift reaction to produce the mixture of H2 and CO2. The most common separation technique in this category would be separation by physical sorbents.
- Oxy-fuel combustion carbon capture, when the combustion is performed while using pure oxygen. This is essentially the same with post combustion carbon capture, but in this case, a lot of impurities can be avoided due to oxygen being pure (21% of air is oxygen), therefore the product would be a high purity CO2 stream.
Spigarelli and Kawatra [21] also classified the carbon capture technologies in high, medium, and low pressure technologies, in terms of CO2 partial pressure, as expressed by the share of the carbon dioxide in the flue gas stream (30–70%, 35%, and 3–20%, respectively). However, these classification schemes do not facilitate the identification, formulation, and optimization of the value chains, since the objective is to be able to match the CO2 sources with carbon capture technologies that are compatible and process the output stream of the source efficiently. The categorization based on the CO2 partial pressure makes matching difficult, since both the categorization of sources based on purity and carbon capture technologies are unclear. For that purpose, three new categories are proposed in terms of the type of stream that a technology can process and the commercially applicable technologies are matched to the carbon sources categories presented in Section 2.2, based on already published work. These three categories are: (a) general gas conditioning, including the removal of common impurities, such as NOx, SOx, dust, and water; (b) absorption with chemical solvents or combustion using pure oxygen; and, (c) absorption with physical solvents. The results are presented in Table 1, where each source is sorted according to purity and is matched to a separation technology.
2.3. Carbon Purification
Purification in the context of carbon capture and utilization includes the separation of CO2 during carbon capture, followed by dehydration and compression that prepares the gas stream, for transportation and utilization [33,34,35,36]. It is an important step, as it can affect the downstream components of the value chain (its technical characteristics, design parameters, and, by extension, the cost). Wetenhall [37] and Ivan [38] identified and analyzed the effect of impurities on equipment during transportation such as corrosion, altering of physical properties, phase behavior, density and viscosity, which, in extent, affect transportation conditions and design parameters. Their work showed that the addition of impurities to the mixture increases the required pressure (critical pressure) to keep the mixture in the supercritical phase (required phase for transportation), the addition of H2S, SO2, and NO2 increases viscosity and decreases density compromising pipeline capacity and the presence of H2S, SO3, and NO2, but mainly water causes corrosion.
Since some sources have relatively high CO2 purity, a dilemma arises as to if it is necessary to purify the CO2 stream. In some occasions, where receivers do not require high CO2 purity, it might be acceptable to avoid the purification step; however, although capital costs would decrease because of less equipment required, in the long term, the running costs will increase because of damage that is caused to equipment from corrosion and higher required compression due to changes in phase behavior. On the other hand, including purification in all occasions would significantly increase capital costs, but running costs would be much lower. In addition, all streams would have high CO2 purity, thus satisfying all receivers, and facilitating the creation of a CCU hub by mixing all streams and centrally distributing CO2. Thus, purification is recommended as a mandatory step of all CCU value chains, independent of the purity specifications of the source and the receiver.
The level of purification that needs to be achieved mainly depends on the technical limitation of the equipment that is involved in conjunction with health and safety considerations. The “Dynamis” project, presented recommendations for the composition limits of gas streams containing mainly CO2 for CCS, primarily from a transport point of view and to a certain extent, for storage [39]. The study examined oxyfuel, pre- and post-combustion electricity production processes utilising different types of coal and Natural Gas Combined Cycle Gas Turbines to cover a wide range of possible impurities [32]. After considering the safety and toxicity of impurities, avoidance of free water formation, avoidance of hydrate formation, avoidance of corrosion, reduction of CO2 volume, a list of recommendations for the concentrations of various impurities was compiled [39]. Based on that report, the maximum concentrations of some of the key impurities are H2O 500 ppm, H2S 200 ppm, SOx 100 ppm, NOx 100 ppm, and the minimum concentration of CO2 is 95.5%.
2.4. Carbon Transportation
Transportation of captured CO2 can be achieved either by using pipelines, truck tankers, or railroad tankers (inland transportation), or by using ships (sea transportation). Each type has its own advantages and disadvantages, and if used effectively, it can contribute to the optimization of CCU value chains. Inland transportation using pipelines is the most favored type of transportation, because it can handle large flowrates effectively, but it becomes an economically challenging method for low flowrates. On the contrary, truck tankers and railroad tankers are more useful for handling small quantities and they have lower capital costs.
Pipeline transportation takes place in the liquid or supercritical state at pressures above 50 and 80 MPa respectively and temperatures around 0 °C [38]. When CO2 is transported by ship, it is usually in the liquid phase (on the saturation line, with pressure a few bars higher than the atmospheric and temperature a few degrees below the ambient). Aspelund et al. [40] have concluded that the most efficient way to transport CO2 is as a cryogenic liquid and the optimum conditions are 6.5 bar and −51.2 °C. When CO2 is transported via truck tankers, it should be in liquid state at 1.7 MPa pressure and −30 °C [41]. Although the volumes are very small when compared to what could be required, cryogenic vessels of the size of 2 to 30 tonnes are available to suit customer requirements. CO2 transportation by railroad tankers takes place in liquid state at 2.6 MPa pressure in specially developed tanks [41].
2.5. Carbon Utilization
The final step of a CCU value chain is carbon utilization. At this stage, captured CO2 that has been purified to the desired level arrives at the receiver. The main characteristics that need to be specified for each receiver in the context of developing, implementing and optimizing a CCU value chain are two: (a) the minimum CO2 purity and (b) the magnitude of flow that is required by each receiver. Additional information such as upper limits in the composition of certain impurities found in captured CO2 that are not compatible with the process of each receiver and modifications that might be necessary for the receiver to accept captured CO2, can affect the optimization decisions.
An extensive list of current and future receivers was presented by the Global CCS Institute [42]. The end-uses can be classified in four different categories: (a) direct use, (b) mineral carbonation, (c) fuels production, and (d) chemicals production. Patricio et al. [11] have compiled a very detailed table with the required magnitude of flow of all the existing and emerging CO2 uses, as well as further quantitative characteristics and the potential collaborators from an industrial symbiosis point of view. In this paper, the previously published table is further enhanced with a few more carbon receivers, as well as qualitative values for the purity requirements of each receiver (Table 2). The following sections give a few more details.
2.5.1. Direct Use
Carbon dioxide can be used in various processes in the food industry, including cooling while grinding powders, as an inert to prevent food spoilage and in packaging applications, when used both in modified and controlled atmosphere packaging. The specifications in these applications are such that purity must be greater than 99%, moisture content less than 52 vppm, CO less than 10 vppm, total hydrocarbons less than 50 vppm, oil less than 10 ppmw, and pass a test for acidity and red substances [43]. CO2 is also used in beverage carbonation [44], in coffee decaffeination as an extraction solvent (supercritical CO2) [45], and wine making, as a seal gas to prevent oxidation of the wine during maturation [42].
Another important consumer of CO2 is metal industry, where CO2 can be used for chilling parts for shrink fitting, hardening of sand cores, and moulds, as a shrouding gas to prevent oxidation in a welding process, or in a minority of basic oxygen furnaces as a bottom stirring agent or for dust suppression [46]. Other industrial direct uses of CO2, include pulp and paper processing (where it is used to reduce pH during pulp washing operations) [47], water treatment (where it is used for the re-mineralization of water following reverse osmosis and for pH control) [43], printed circuit board manufacture (as a cleaning fluid) [48], and power generation (in the supercritical form as a power cycle working fluid) [42]. It can be also used in pneumatic applications, in fire extinguishers and in industrial fire protection systems [46], and in refrigeration units (especially larger industrial air conditioning and refrigeration systems) [49] as the working fluid, replacing other more toxic refrigerant gases [50]. Finally, carbon dioxide is considered as a key instrument in commercial greenhouses towards increasing production. A usual practice is to utilize CO2 in the form of exhaust gases from the heating system/combined heat and power generator of the greenhouse or to use pure liquid CO2 [51].
2.5.2. Mineral Carbonation
Mildly concentrated CO2 is contacted with a mineral-loaded alkaline waste stream (either solid or liquid) and it precipitates out as mineral carbonate (limestone/dolomite equivalent precipitates). The resulting product can be further processed to form an aggregate equivalent product for the construction industry. There are numerous sources of industrial waste that can be used in the mineral carbonation process, such as: metallurgic slags, incineration ashes, mining tailings, asbestos containing materials, and oil shale processing materials [52]. There are several variants of mineralization, such as baking soda production (where CO2 is contacted with sodium rich brine), concrete curing (where a flue gas stream is used in the cement curing process in order to sequester CO2 in manufactured concrete products), and bauxite residue (“red mud”) treatment (where CO2 is added to the highly alkaline bauxite residue slurry) [42].
2.5.3. Fuels Production
A variety of fuels can be produced while using a captured CO2 stream as feedstock. CO2 methanol can be produced using a concentrated CO2 source and H2 as feedstock. The electrolysis of water produces H2, which can be then mixed with CO2 and compressed [44]. Similarly, formic acid can be produced through electrochemical reduction of CO2, by combining a concentrated stream of captured CO2 and water [55]. Moreover, power-to-gas technology involves the transformation of electricity to synthetic natural gas, using the surplus electricity from renewable power sources in order to produce methane. A completely different application is the use of CO2 as a nutrient/external carbon source in algae cultivation, which can then be used for a wide variety of products, including biofuels and other chemicals [56].
2.5.4. Chemicals Production
Carbon and oxygen are both key elements in organic chemistry. Consequently, there is a wide range of chemicals that can at least theoretically use CO2 as a feedstock for production, including organic acids, alcohols, esters, and sugars. The practicality of CO2 as a feedstock will vary significantly based on the current production routes. The dominant potential demand, which is based on current markets, could come from acetic acid, which has a current global market of ~6 Mtpa and it can be produced by direct catalysis of CO2 and methane [42]. Urea can be also produced when carbon dioxide reacts with ammonia. The reaction is catalyst free and there are no requirements for CO2 quality [57]. Urea production using CO2 is a mature, but, at the same time, saturated market.
Finally, a more recent synthesis that has been examined is the combination of captured CO2 with traditional feedstocks in order to produce polymers [42]. More specifically, the use of CO2 as feedstock for production of polycarbonates, such as polypropylene carbonate (PPC) and polyethylene carbonate (PEC), or as a feedstock in the polymerization of urethanes, to produce polyurethanes, has been examined and piloted by several companies.
3. Economic Characteristics of a CCU Value Chain
The economic characteristics of the individual components of a CCU value chain have not been extensively studied. As it can be seen from the analysis that follows, most of the studies have been performed in the context of CCS (rather than CCU), and thus the majority of them focus on carbon capture (primarily) and carbon transportation. However, there are no studies estimating the potential costs that are linked with carbon utilization (due to either retrofitting/modifying an existing plant in order to receive recycled CO2 or installing a new plant).
3.1. Carbon Capture
The carbon separation costs are usually presented in literature either per type of source or per type of technology used (i.e., pre-combustion, post-combustion, and oxy-fuel combustion). The separation costs are further divided to fuel, operating and maintenance, and capital costs, and are usually expressed in terms of levelized cost of capture and cost of CO2 avoidance. In the case of power plants, the costs are also usually presented in terms of levelized cost of electricity.
Kuramochi et al. [58] presented a review of economic studies and comparison of carbon capture technologies for the major industrial sectors. According to their analysis, it is not easy to identify which technology will be widely implemented in the future and suggested that a combination of industrial plants and power plants would lead more easily to economically viable carbon separation projects. The reported costs for the iron and steel sector vary between 40–65 €/tCO2 (depending on the process and the capture technology). For the cement sector, the selected technology was post-combustion capture with reported costs above 65 €/tCO2 avoided. For the petroleum industry, the selected technology was oxyfuel capture with reported costs at 50–60 €/tCO2.
Leeson et al. [49] have performed a similar and more recent review of the main industrial sectors, as well as high-purity sources of CO2, but with an emphasis on CCS, and the outputs vary slightly when compared to [58]. The reported costs for the iron and steel industry range from $50 to 90/tCO2 avoided (using post combustion chemical absorption), for the petroleum refineries have an average value of $98/tCO2 avoided, and for the cement industry, a mean cost of $39.4/tCO2 avoided using oxy-combustion with calcium looping, which showed better results when compared to post-combustion amine scrubbing. For the high purity sources, the mean values varied from $10 to $41.6/tCO2 avoided based on the actual process examined. Although the analysis was focusing on CCS deployment, the main conclusions can be also applied in CCU.
Kuramochi et al. [50] have also reviewed and compared the techno-economic performance of carbon capture technologies that are applied in alternative distributed energy systems (including all of the stages involved, such as capture, compression, distributed transport using a pipeline) and took into account all the different parameters (fuel type, energy plant type, capacity factor, energy prices, and interest rate). The reported costs ranged from 30 to 150 €/tCO2 avoided depending on the capacity of the power plant (with an estimate that these values might drop between 4–9% in the mid and long term). Finally, Element Energy [59] presented a detailed techno economic study for retrofit deployment of different CO2 capture technologies in the same four sectors, with a UK focus, reporting an average cost of 60 €/tCO2, 75 €/tCO2, 65 €/tCO2, and 10 €/tCO2 for the iron and steel, cement, petroleum industries, and high purity sources, respectively.
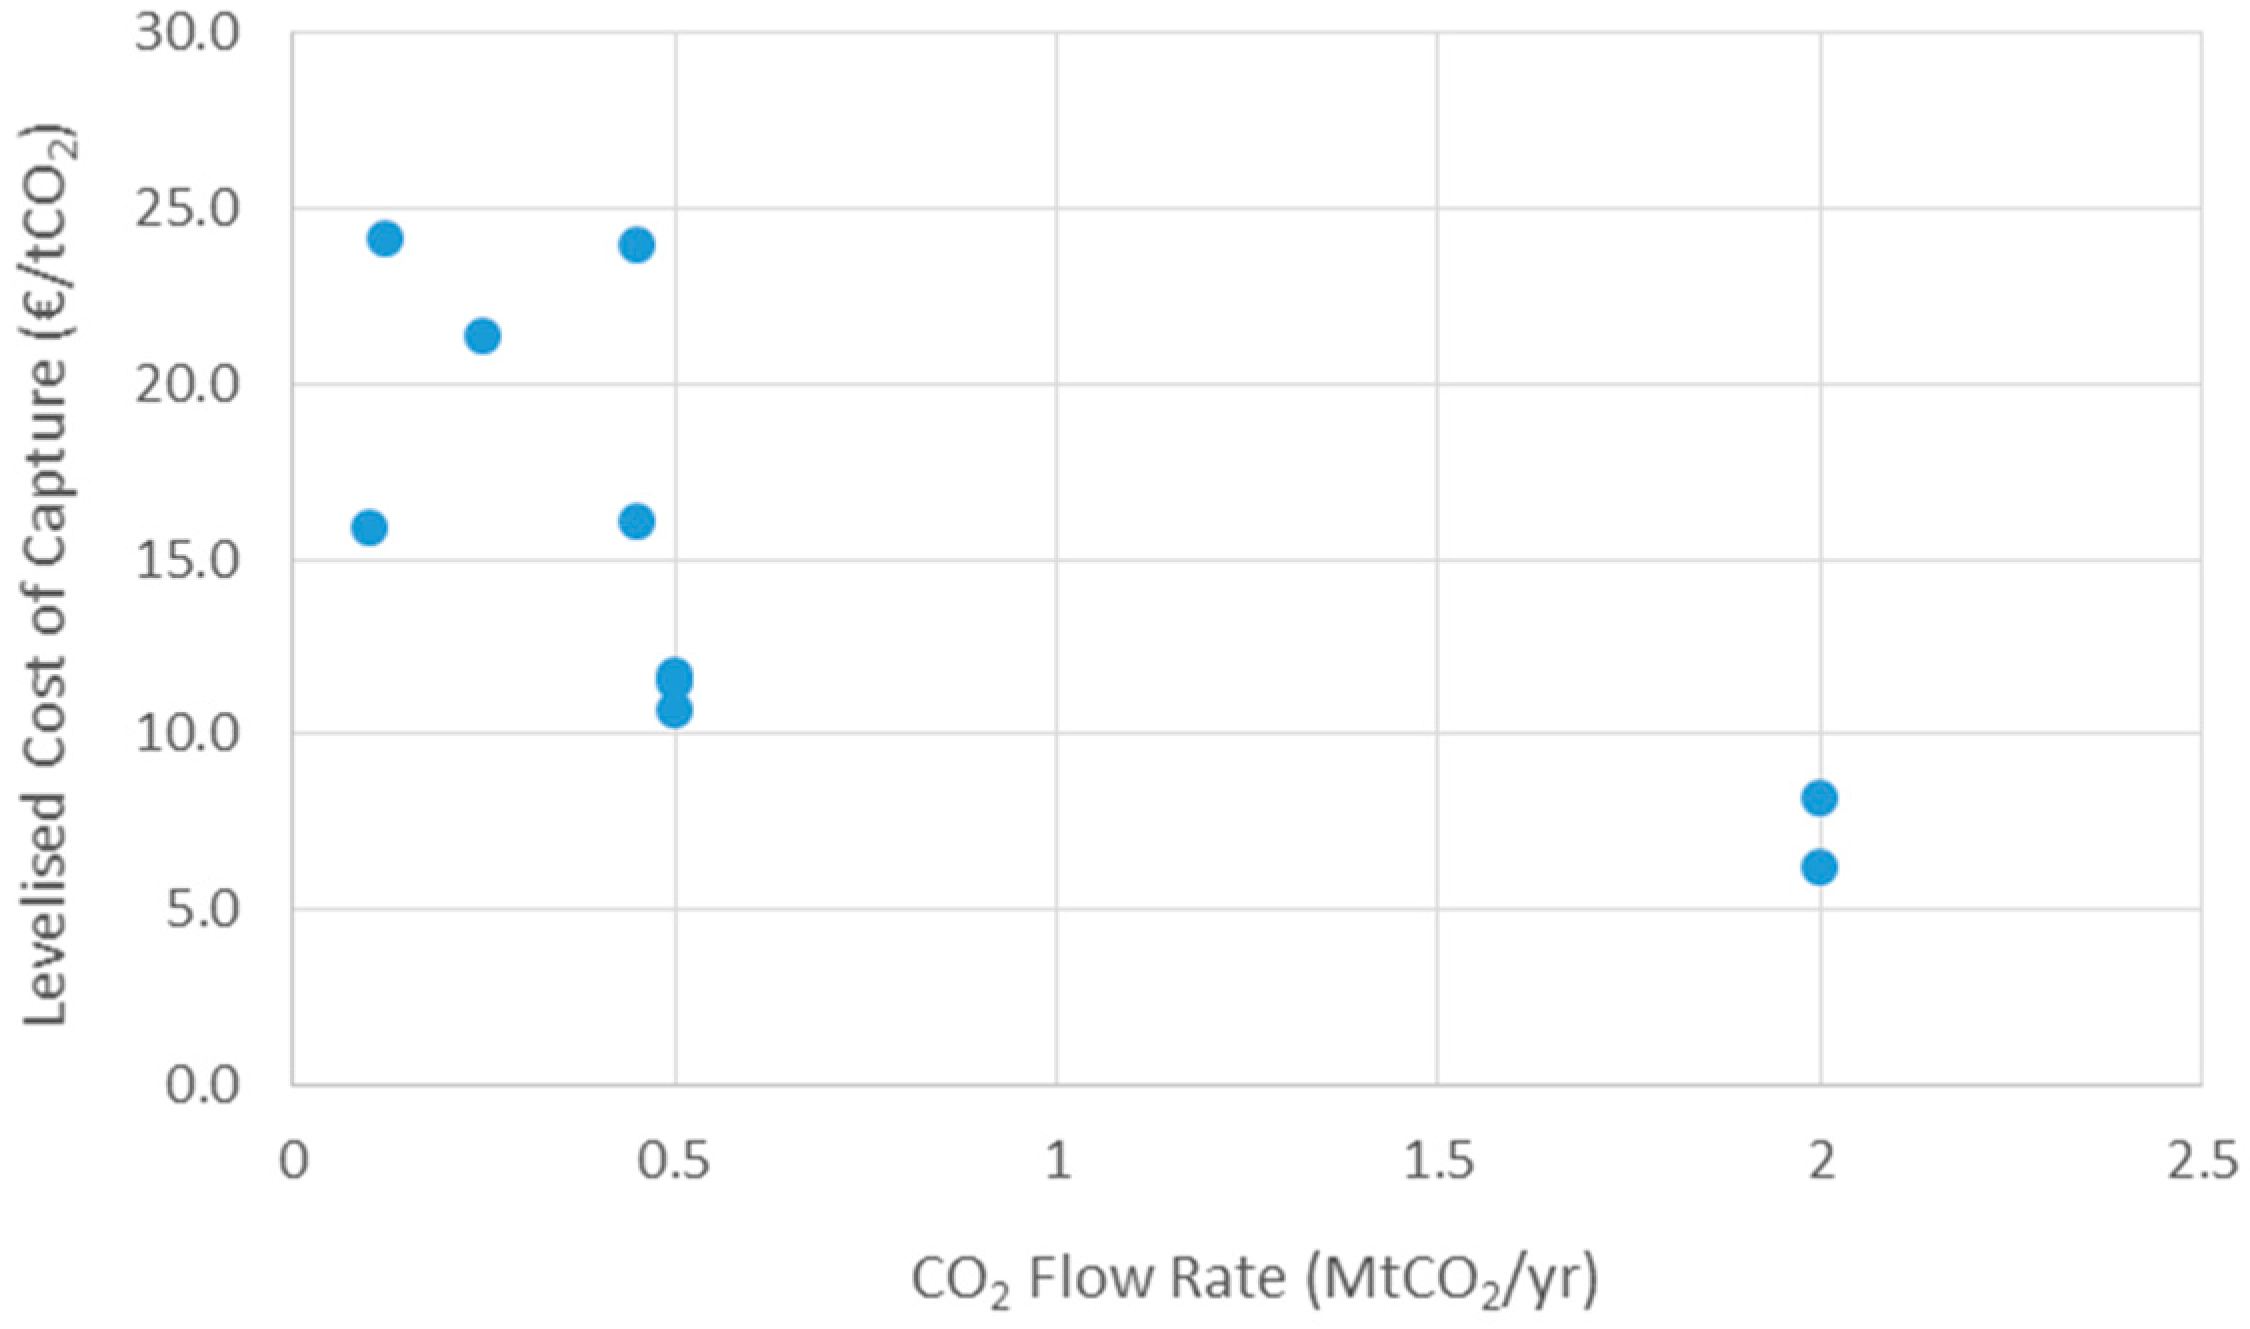
Apart from the above-mentioned review papers and reports, there have been a few more published papers that emphasize on one type of carbon source. For the cement industry, Namzul Hassan et al. [60] performed a techno-economic study for the installation of a post-combustion carbon capture in an existing cement plant, estimating the average cost at $51/tCO2 using chemical absorption. Barker et al. [61] reviewed all the possible carbon capture technologies that could be applied in a cement industry and estimated the relevant costs at 40 €/tCO2 avoided by using oxyfuel technology, and substantially higher (107 €/tCO2) while using post combustion capture for a flow of 1 MtCO2 per year. An overview of the estimated collected capture cost for the cement industry and the corresponding flow rate of flue gas stream are presented in Figure 2. A similar figure (Figure 3) can be also drawn for the high purity sources, using data from [62,63], although it should be mentioned that the process is not the same but only the output is a high purity (>95%) CO2 stream in all nine cases.
For the other important industrial CO2 sources, there were not enough published papers that would allow the authors to perform a similar analysis. For the power plants, the situation is slightly different, since there are various types of plants and not enough data for each one of them. In addition, the range of possible CO2 flow rate is much bigger, as it can exceed 10 MtCO2/year. Moreover, the reported costs are often presented in terms of levelized cost of electricity (per MWh of electricity produced), making the comparison more difficult. However, a few indicative papers are mentioned to showcase the range in the cost of CO2 capture.
Kolstad and Young [64] presented a report dedicated on assessing costs of various carbon capture technologies used for emissions in a brown coal fired power plant in Australia, in the context of the three technologies proposed by literature, (i.e., post-combustion, pre-combustion and oxy-fuel combustion). Various alternative configurations are proposed, data for retrofitting costs, pipeline transport, and storage are included in their analysis and the estimated capture cost varies from $30 to $90/tCO2 avoided. Borgert and Rubin [65] presented a model for oxyfuel coal power plants and calculated the CO2 avoidance cost (ranging from $45 to $75 per tCO2 avoided) and the effects on transport costs with varying outlet CO2 purity and O2 purity.
Davison et al. [63] studied power plants, as well as hydrogen co-production plants, and estimated the total plant cost, total capital requirement, levelized cost of electricity and CO2 avoidance costs. The reported costs vary between 60–65 €/tCO2 for pulverized coal plants and between 95–100 €/tCO2 for IGCC plants. Rubin et al. [66] summarized various published studies regarding the cost of post, pre, and oxy-combustion carbon capture technologies applied on different types of power plants. The estimated capture cost ranges from $58–121/tCO2 for post combustion in NGCC power plants, $28–41/tCO2 for pre-combustion in IGCC power plants using bituminous coal and $42–87/tCO2 for pre-combustion in IGCC power plants using supercritical pulverized coal.
Based on our review, a major gap in the literature review is a comparative analysis of all the existing studies in order to estimate the capture cost as a function of the industrial source, stream purity, and the magnitude of flow.
3.2. Carbon Transportation
IPCC [10] has initially attempted to estimate the cost of various transportation options in in the context of captured carbon dioxide. Onshore and offshore pipelines, as well as ship transportation, are included in the analysis, which is complemented by cost information regarding the design of CO2 ship carriers, the required liquefaction facilities and an overall comparison of all three options. It has been estimated that the transportation cost may vary between $1–5/tCO2 for every 250 km, depending on the flow rate of the pipeline. Kuramochi et al. [58] have reported slightly higher values. The total cost, including compression and transportation, has been estimated to approximately 10 €/tCO2 transported for short distances and large quantities (<500 tCO2/day) and may increase to more than 50 €/tCO2 transported for low quantities. Borgert and Rubin [64] have estimated the transportation cost for an oxy-fuel power plant at approximately $2.5/tCO2/150 km. Similarly, Morgan and Grant [67] have reported a cost for onshore pipelined of about $1–3/tCO2/160 km.
Zero Emissions Platform [31] has produced two different studies regarding the cost of transporting CO2. In the first one, performed as part of CCS demonstration projects, the transportation cost of captured CO2 from coal or natural gas-fired power plants while using onshore pipeline, offshore pipeline, and ship for varying transportation has been estimated. The second one is focused entirely on carbon transportation and several likely alternative real-life transport networks are described. It has been determined that pipeline costs are mainly determined by CAPEX and are proportional to the distance covered, thus benefiting from economies of scale and use in full capacity. On contrary, ship and truck transport have relatively lower CAPEX and they are less dependent on distance and on scale of transport. The combination of pipelines and ship transportation towards the creation of offshore networks could be in most cases the most cost-effective solution, especially in the early development of clusters. It has been estimated that the cost for onshore and offshore pipeline transportation ranges from 1.5–5.4 €/tCO2/180 km and 6–20.4 €/tCO2/500 km, respectively.
Knoope et al. [68] reviewed and evaluated several cost models that are available in literature, regarding CO2 transportation using pipelines (including the required booster station), but only reported and compared the overall investment cost and not the cost per tCO2 transported. The models reviewed take into account many factors, such as carbon steel grade, inlet pressure, region of implementation, terrain, corridor factor, mass flowrate, and distance of transportation for both onshore and offshore applications. Mallon et al. [69] estimated the overall investment cost for different carbon sources in order to compare the reported costs at varying pipeline diameters. They also present the CAPEX costs from two different sources for varying pipeline diameters and lengths.
Aspelund et al. [35] presented the first study with real life data in order to identify the best transportation option for an approximate distance of 1500 km, including all of the steps involved in the transportation of CO2 using ships (liquefaction, gas conditioning, loading system, offshore unloading system, ship design). The total costs were estimated in the range of $20–30/tCO2 for volumes larger than 2 MtCO2 per year. Brownsort [70] reviewed and compared eight different studies in terms of the total lifetime costs of the ship transportation system (expressed as specific cost per unit of CO2 transported), including compression and liquefaction. The reported transportation cost ranges from $12–58/tCO2, depending on the distance and the quantity transported. Kjarstad et al. [71] investigated alternative CO2 transport options in the Nordic region by calculating transportation costs for both ships (13–22 €/tCO2) and pipelines (4–25 €/tCO2) at varying flowrates and distances. Weihs et al. [72] used the Integrated Carbon Capture and Storage Economics Model and estimated the CO2 transportation costs for shipping pure CO2 and for transporting CO2 using ship, onshore pipelines, shallow offshore pipelines, and deep offshore pipelines in terms of CAPEX and OPEX, as well as the levelized costs of CO2 transportation under various flowrates. Pipelines prove to be more economical ($10–15/tCO2/1000 km) in shorter distances (<500 km) when compared to ships ($20–25/tCO2/1000 km). However, this is reversed in longer distances (>1500 km), with the two values being $50–70/tCO2/1000 km and $40/tCO2/1000 km for pipelines and ships, respectively.
Table 3 summarizes the main characteristics of the reviewed papers. It is apparent that pipelines and ships are the most common and widely applied methods (with pipelines being preferable in shorter distances and ships in longer distance—where applicable), whereas road and rail transportation are rarely considered in real cases and/or in longer distances.
4. Existing Optimization Models and Algorithms
The identification and implementation of novel value chain based on CCU requires both the study of each stage of the value chain separately and the assessment of the entire system as a whole in order to assess the interrelationships among the different components and the way that these affect the technical and economic feasibility of the system.
Several attempts have been made to either optimize each stage of the value chain or model/optimize the entire system, focusing on CCS. These have been recently reviewed by Tapia et al. [73] and they have been classified in three different categories (mathematical programming, pinch analysis, and miscellaneous tools). Our objective is to summarize the papers on the integrated assessment of CCU value chains exclusively and identify the major research gaps.
Hasan et al. [74] developed a Mixed Integer Linear Programming (MILP) model for a CCU network, capturing anthropogenic CO2 emissions for Enhanced Oil Recovery (EOR) in the United States. They also presented an overview (including the challenges) of CCS and CCU, a multiscale framework for CCS and CCU and proposals for CCS and CCU supply chain networks in the United States (US). Hassiba et al. [75] studied the integration of carbon sources, with different storage and utilization options in an industrial context in order to achieve emissions reduction at a minimum cost, using heat and carbon integration techniques. Agrali et al. [76] developed a MILP model for economic optimization that assesses whether CCS, CCU, a combination of them, or no carbon capture at all is a more viable option for fossil-fired power plants that operate under a cap and trade system. The model considers pipelines and a limited range of sources and receivers. It was applied in Turkey considering two power plants, one utilization point, and two storage sites.
Pérez-Fortes et al. [77] performed a techno economic analysis on a European level to assess two alternative carbon utilization options (methanol synthesis and fly ash aqueous carbonation), with CO2 captured from a conventional power plant and by using process flow modelling for the estimation of all the relevant technical and economic values. Duraccio et al. [78] attempted a techno economic analysis on a smaller scale (an Italian industrial district) and assessed alternative capture technologies in order to develop a CCU value chain between a power plant (which acted as the source) and a sugar factory (which acted as the sink). Similarly, Reiter and Lindorfer [79] assessed the economic performance of various different carbon sources (taking into account capture cost and CO2 penalty) in order to identify the best option for the development of power to gas (P2G) industry in Austria. Their analysis concluded that there is surplus of CO2, capable of providing the necessary input, and the best sources available are CO2 bioethanol and biogas upgrading facilities.
Karjunen et al. [80] also studied the development of power-to-gas value chains in Finland using biogenic carbon sources. They used a node-based material balance tool, which monitors the carbon flow across the energy systems and estimated all the CCU related costs. Patricio et al. [81] developed a methodological approach to identify European regions with potential in developing CCU value chain networks, while using material flow analysis. The approach is broken down in three major steps; (a) assessment of the regional utilization potential for nine selected technologies, selected based on the Technology Readiness Level; (b) assessment of regional CO2 availability; and, (c) matching based on geographical criteria on a national and regional level. The same approach has been applied with more detail in one of the previously identified regions (in Sweden), and a number of technically feasible value chains was proposed [11]. von der Assen et al. [82] have mapped the available medium and high flow CO2 sources in Europe and identified the best regions in Europe for the development of CCU projects that are based on the minimization of the environmental impacts of CO2 supply, by using the environmental-merit-order curves. Table 4 summarizes the key characteristics of the abovementioned CCU modeling tools and algorithms.
5. Conclusions and Suggestions for Future Work
It is apparent from the literature review that the individual components of a CCU value chain have been extensively studied. The technical characteristics of all five stages (source, capture, purification, transportation, and utilization) have been modeled and optimized and there are clear classification schemes, where appropriate. Regarding the economic characteristics, a detailed and extended analysis have been performed and published only for the capture and transportation stages. This is mainly due to the fact that the research was mostly driven by CCS. Thus, it is necessary to estimate the incurred cost for the major utilization options, since this will play a significant role in the assessment of the entire value chain. This cost might be either due to retrofitting/modifying an existing carbon receiver in order to receive recycled CO2 or represent the installation cost of a new plant. Moreover, a critical review of the capture and transportation cost related research papers would be useful, in order to assess the impact of economies of scale in these processes and to estimate how the cost has been reduced over the course of the last ten years due to technological progress.
Regarding the optimization of the entire value chain, it can be observed that only a few relevant journal articles have been published, and each one approaches the problem from a different perspective. Most of these attempts focus on a limited number of the potential CO2 sources and usually a very limited number of receivers. Several research papers have been developed in the context of CCS, and thus the developed algorithms cannot be applied in a straightforward way to a CCU value chain. The majority of the published studies focuses only on the economic assessment of the carbon reuse scheme, based on either the total cost of the project or the economic performance of the carbon source. However, the success of such business models depends on multiple stakeholders with conflicting interests and the economic performance of each one of them and the system as whole should be assessed.
Finally, in almost all cases, the assessment of the environmental and the social impacts of the CCU value chains are neglected. There have been a few studies assessing the environmental impact of carbon capture technologies individually (using life cycle assessment) and one study that examines the environmental performance of the system as a whole. Social impact assessment has been completely ignored, something common for all the industrial symbiosis schemes. However, in order to pass from the first steps of the development of a CCU value chain (opportunity identification and opportunity assessment) to the latter ones (barrier removal and commercialization), apart from the maturity of the technologies involved, a holistic view of the system should be adopted that will be able to examine the performance of all the stakeholders that are involved and all the components of sustainability.
Author Contributions
Conceptualization, T.P. and A.A.-D.; Investigation, T.P.; Writing-Original Draft Preparation, T.P. and A.A.-D.; Writing-Review & Editing, A.A.-D., A.C.-C. and A.N.; Supervision, A.A.-D.
Funding
This research received no external funding.
Acknowledgments
Tryfonas Pieri would like to thank the University of Huddersfield for funding his PhD studies.
Conflicts of Interest
The authors declare no conflict of interest.
References
- NASA. Available online: https://climate.nasa.gov/climate_resources/24/ (accessed on 31 May 2018).
- European Commission. Communication from the Commission to the European Parliament, the Council, the European Economic and Social Committee and the Committee of the Regions, A Roadmap for Moving to a Competitive Low Carbon Economy in 2050. 2011. Available online: https://eur-lex.europa.eu/legal-content/EN/TXT/HTML/?uri=CELEX:52011DC0112&from=GA (accessed on 31 May 2018).
- European Commission. 2050 Energy Strategy. Available online: https://ec.europa.eu/energy/en/topics/energy-strategy-and-energy-union/2050-energy-strategy (accessed on 13 September 2018).
- European Commission. Directive 2009/28/EC—Promoting the Use of Energy from Renewable Sources. Available online: https://eur-lex.europa.eu/legal-content/EN/TXT/?uri=LEGISSUM:en0009 (accessed on 13 September 2018).
- European Commission. 2020 Climate & Energy Package. Available online: https://ec.europa.eu/clima/policies/strategies/2020_en#tab-0-0 (accessed on 13 September 2018).
- European Commission. Energy Efficiency Directive. Available online: https://ec.europa.eu/energy/en/topics/energy-efficiency/energy-efficiency-directive (accessed on 13 September 2018).
- European Commission. Energy Efficiency. Available online: https://ec.europa.eu/energy/en/topics/energy-efficiency (accessed on 13 September 2018).
- Global CCS Institute. Understanding CCS—Storage. Available online: https://www.globalccsinstitute.com/understanding-ccs/how-ccs-works-storage (accessed on 13 September 2018).
- Cuellar-Franca, R.M.; Azapagic, A. Carbon capture, storage and utilization technologies: A critical analysis and comparison of their life cycle environmental impacts. J. CO2 Util. 2015, 9, 82–102. [Google Scholar] [CrossRef]
- IPCC. IPCC Special Report on Carbon Dioxide Capture and Storage. In Prepared by Working Group III of the Intergovernmental Panel on Climate Change; Metz, B., Davidson, O., de Coninck, H.C., Loos, M., Meyer, L.A., Eds.; Cambridge University Press: Cambridge, UK; New York, NY, USA, 2005. [Google Scholar]
- Patricio, J.; Angelis Dimakis, A.; Castillo-Castillo, A.; Kalmykova, Y.; Rosado, L. Method to identify opportunities for CCU at a regional level—Matching sources and receivers. J. CO2 Util. 2017, 22, 330–345. [Google Scholar] [CrossRef]
- Zakkour, P.; Cook, G. CCS Roadmap for Industry: High-Purity CO2 Sources; Carbon counts: London, UK, 2010. [Google Scholar]
- Fennell, P.S.; Florin, N.; Napp, T.; Hills, T. CCS from Industrial Sources. Sustain. Technol. Syst. Policies 2012. [Google Scholar] [CrossRef] [Green Version]
- Jin, H.; Gao, L.; Li, S.; van Sembeek, E.; Porter, R.; Mikunda, T.; Dijkstra, J.W.; de Coninck, H.; Jansen, D. Supporting Early Carbon Capture Utilization and Storage Development in Non-Power Industrial Sectors, Shaanxi Province, China; Report No. 12; The Centre for Low Carbon Futures: Birmingham, UK, 2012. [Google Scholar]
- CLCF. Carbon Capture and Utilization in the Green Economy: Using CO2 to Manufacture Fuel, Chemicals and Materials; The Centre for Low Carbon Futures: New York, NY, USA, 2011; ISBN 978-0-9572588-1-5. [Google Scholar]
- Angelis-Dimakis, A.; Castillo-Castillo, A. Enabling new values chains for CO2 reuse. In Proceedings of the 13th International Conference on Protection and Restoration of the Environment, Mykonos, Greece, 3–8 July 2016; Kungolos, A., Ed.; Grafima Publications: Thessaloniki, Greece, 2016; pp. 489–496, ISBN 978-960-6865-94-7. [Google Scholar]
- D’Amore, F.; Bezzo, F. Economic optimization of European supply chains for CO2 capture, transport and sequestration. Int. J. Greenh. Gas Control 2017, 65, 99–116. [Google Scholar] [CrossRef]
- Boot-Handford, M.E.; Abanades, J.C.; Anthony, E.J.; Blunt, M.J.; Brandani, S.; Mac Dowell, N.; Fernandez, J.R.; Ferrari, M.C.; Gross, R.; Hallett, J.P.; et al. Carbon capture and storage update. Energy Environ. Sci. 2014, 7, 130–189. [Google Scholar] [CrossRef]
- Leung, D.Y.C.; Caramanna, G.; Maroto-Valer, M.M. An overview of current status of carbon dioxide capture and storage technologies. Renew. Sustain. Energy Rev. 2014, 39, 426–443. [Google Scholar] [CrossRef] [Green Version]
- GCCSI. The Global Status of CCS; Global CCS Institute: Canberra, Australia, 2011. [Google Scholar]
- Spigarelli, B.P.; Kawatra, K.S. Opportunities and challenges in carbon dioxide capture. J. CO2 Util. 2013, 1, 69–87. [Google Scholar] [CrossRef]
- Muller, C. CO2 Capture and Storage CCS and the Industry of Carbon-Based Resources; ETH Zurich: Sonneggstrasse, Switzerland, 2017. [Google Scholar]
- Creamer, A.E.; Gao, B. Carbon Dioxide Capture: An Effective Way to Combat Global Warming, 1st ed.; Springer International Publishing: Berlin, Germany, 2015; pp. 17–24. ISBN 978-3-319-17009-1. [Google Scholar]
- Lyngfelt, A. Chemical Looping Reforming a and s; Department of Energy and Environmenta Chalmers University of Technology: Goteborg, Sweden, 2007. [Google Scholar]
- Wong, S. Module 2 CO2 capture: Post Combustions Flue Gas Separation. Retrieved from Global CCS Institute. Available online: https://hub.globalccsinstitute.com/publications/building-capacity-co2-capture-and-storage-apec-region-training-manual-policy-makers-and-practitioners/module-2-co2-capture-post-combustion-flue-gas-separation (accessed on 31 May 2018).
- Rubin, E.S.; Mantripragada, H.; Marks, A.; Vesteeg, P.; Kitchin, J. The outlook for improved carbon capture technology. Prog. Energy Combust. Sci. 2011, 38, 630–671. [Google Scholar] [CrossRef]
- Jansen, D.; Gazzani, M.; Manzolini, G.; van Dijk, E. Pre-combustion CO2 capture. Int. J. Greenh. Gas Control 2015, 40, 167–187. [Google Scholar] [CrossRef]
- Toftegaard, M.B.; Brix, J.; Jensen, P.A.; Glarborg, P.; Jensen, A.D. Oxy-fuel combustion of solid fuels. Prog. Energy Combust. 2010, 36, 581–625. [Google Scholar] [CrossRef]
- Kolster, C.; Mechleri, E.; Krevor, S.; Dowell, N.M. The role of CO2 purification and transport networks in carbon capture and storage cost reduction. Int. J. Greenh. Gas Control 2015, 58, 127–141. [Google Scholar] [CrossRef]
- Porter, R.T.; Fairweather, M.; Pourkashanian, M.; Wooley, R.M. The range and level of impurities in CO2 streams from different carbon capture sources. Int. J. Greenh. Gas Control 2015, 36, 161–174. [Google Scholar] [CrossRef]
- ZEP. The Costs of CO2 Capture, Transport and Storage-Post-Demonstration CCS in the EU; European Technology Platform for Zero Emission Fossil Fuel Power Plants: Brussels, Belgium, 2011. [Google Scholar]
- Summary of CO2 Stream Composition. Retrieved from Global CCS Institute. Available online: https://hub.globalccsinstitute.com/publications/hazard-analysis-offshore-carbon-capture-platforms-and-offshore-pipelines/e6-summary-co2-stream-composition (accessed on 31 May 2018).
- Abbas, Z.; Mezher, T.; Abu-Zahra, M. CO2 purification. Part I: Purification requirement review and the selection of impurities deep removal technologies. Int. J. Greenh. Gas Control 2013, 16, 324–334. [Google Scholar] [CrossRef]
- Abbas, Z.; Mezher, T.; Abu-Zahra, M. CO2 purification. Part II: Techno-economic evaluation of oxygen and water deep removal processes. Int. J. Greenh. Gas. Control 2013, 16, 335–341. [Google Scholar] [CrossRef]
- Aspelund, A.; Jordal, K. Gas conditioning—The interface between CO2 capture and transport. Int. J. Greenh. Gas Control 2007, 1, 343–354. [Google Scholar] [CrossRef]
- Lee, J.Y.; Keener, T.C.; Yang, Y.J. Potential flue gas impurities in carbon dioxide streams separated from coal-fired power plants. J. Air Waste Manag. Assoc. 2009, 59, 725–732. [Google Scholar] [CrossRef] [PubMed]
- Wetenhall, B. The effect of CO2 Purity on the development of pipeline Networks for carbon capture and storage schemes. Int. J. Greenh. Gas Control 2014, 30, 197–211. [Google Scholar] [CrossRef] [Green Version]
- Ivan, S. Corrosion of pipelines used for CO2 transport in CCS: Is it a real problem? Int. J. Greenh. Gas Control 2011, 5, 749–756. [Google Scholar]
- De Visser, E.; Hendriks, C.; Barrio, M.; Mølnvik, M.J.; de Koeijer, G.; Liljemark, S.; Le Gallo, Y. Dynamis CO2 quality recommendations. Int. J. Greenh. Gas Control 2008, 2, 478–484. [Google Scholar] [CrossRef]
- Aspelund, A.; Molnvik, M.J.; De Koeijer, G. Ship Transport of CO2: Technical Solutions and analysis of Costs, Energy Utilization, Exergy efficiency and CO2 Emissions. Chem. Eng. Res. Des. 2006, 84, 847–855. [Google Scholar] [CrossRef]
- Wong, S. Module 4 CO2 Compression and Transportation to Storage Site. Retrieved from Global CCS Institute. Available online: https://hub.globalccsinstitute.com/publications/building-capacity-co2-capture-and-storage-apec-region-training-manual-policy-makers-and-practitioners/module-4-co2-compression-and-transportation-storage-site (accessed on 31 May 2018).
- Global CCS Institute. Accelerating the Uptake of CCS: Industrial Use of Captured Carbon Dioxide; Parsons Brickerhoff: New York, NY, USA, 2011. [Google Scholar]
- Girdon, P.; Gloger, C.; Gonzalez, D.; Henneqiun, J.; Krinninger, K.; de Lorenzi, L.; Wilyman, P. Minimum Specifications for Food Gas Applications; European Industrial Gases Association AISBL: Brussels, Belgium, 2006. [Google Scholar]
- Linde. Available online: http://www.linde-gas.com/en/processes/freezing_and_cooling/metal_cooling/index.html (accessed on 4 July 2018).
- AHDB Horticulture. Available online: https://horticulture.ahdb.org.uk/sources-co2 (accessed on 4 July 2018).
- AWS Committee on Filler Metals. Specification for Welding Shielding Gases; American Welding Society: Miami, FL, USA, 1997. [Google Scholar]
- Linde. Gas Applications for the Pulp and Paper Industry; Linde North America Inc.: New York, NY, USA, 2012. [Google Scholar]
- R&D Magazine. Available online: https://www.rdmag.com/article/2013/06/cleaning-electronics-manufacturing (accessed on 13 September 2018).
- Leeson, D.; Mac Dowell, N.; Shah, N.; Petit, C.; Fennell, P.S. A Techno-economic analysis and systematic review of carbon capture and storage (CCS) applied to the iron and steel, cement, oil refining and pulp and paper industries, as well as other high purity source. Int. J. Greenh. Gas Control 2017, 61, 71–84. [Google Scholar] [CrossRef]
- Kuramochi, T.; Ramírez, A.; Turkenburg, W.; Faaij, Y. Techno-economic prospects for CO2 capture from distributed energy systems. Renew. Sustain. Energy Rev. 2013, 19, 328–347. [Google Scholar] [CrossRef]
- Vermeulen, P.C.M. Alternative sources of CO2 for the greenhouse horticulture. In Proceedings of the 2nd International Symposium on Energy Challenges and Mechanics (ECM2), Aberdeen, UK, 19–21 August 2014. [Google Scholar]
- Bodor, M.; Santos, R.M.; Van Gerven, T.; Vlad, M. Recent developments and perspectives on the treatment of industrial wastes by mineral carbonation—A review. Cent. Eur. J. Eng. 2013, 3, 566–584. [Google Scholar] [CrossRef]
- Global CCS Institute. CCS for Iron and Steel Production. Available online: https://www.globalccsinstitute.com/insights/authors/dennisvanpuyvelde/2013/08/23/ccs-iron-and-steel-production (accessed on 31 May 2018).
- Rutberg, P.G.; Kuznetsov, V.A.; Bratsev, A.N.; Popov, V.E.; Shtengel, S.V.; Ufimtsev, A.A. Use of carbon dioxide in the chemical synthesis technologies, plasma gasification and carbon production. Mater. Sci. Eng. 2011, 19, 012003. [Google Scholar] [CrossRef] [Green Version]
- Agarwal, A.S.; Zhai, Y.; Hill, D.; Sridhar, N. The Electrochemical Reduction of Carbon Dioxide to Formate/Formic Acid: Engineering and Economic Feasibility. ChemSusChem 2011, 4, 1301–1310. [Google Scholar] [CrossRef] [PubMed]
- Posten, C.; Schaub, G. Microalgae and terrestrial biomass as source for fuels—A process view. J. Biotechnol. 2009, 142, 64–69. [Google Scholar] [CrossRef] [PubMed]
- Ritter, J.; Ebner, A. State-of-the-Art Adsorption and Membrane Separation Processes for Hydrogen Production in the Chemical and Petrochemical Industries. Sep. Sci. Technol. 2007, 42, 1123–1193. [Google Scholar] [CrossRef]
- Kuramochi, K.; Ramírez, A.; Turkenburg, W.; Faaij, A. Comparative assessment of CO2 capture technologies for carbon-intensive industrial processes. Prog. Energy Combust. 2012, 38, 87–112. [Google Scholar] [CrossRef]
- Energy, Element, and Carbon Counts. Demonstrating CO2 Capture in the UK Cement, Chemicals, Iron and Steel and Oil Refining Sectors by 2025: A Techno-Economic Study; PSCE, Imperial College, and University of Sheffield: Cambridge, UK, 2014. [Google Scholar]
- Nazmul Hassan, S.M.; Douglas, P.; Croiset, E. Techno-Economic Study of CO2 Capture from an Existing Cement Plant Using MEA Scrubbing. Int. J. Green Energy 2007, 4, 197–220. [Google Scholar] [CrossRef]
- Barker, D.J.; Turner, S.A.; Napier-Moore, P.A.; Clark, M.; Davison, J.E. CO2 Capture in the Cement Industry. Energy Procedia 2009, 1, 87–94. [Google Scholar] [CrossRef]
- EEL. The Costs of Carbon Capture and Storage (CCS) for UK Industry—A High Level Review; Element Energy Ltd.: Cambridge, UK, 2013. [Google Scholar]
- Davison, J.; Mancuso, L.; Ferrari, N. Costs of CO2 capture technologies in coal fired power and hydrogen plants. Energy Procedia 2014, 63, 7598–7607. [Google Scholar] [CrossRef]
- Kolstad, C.; Young, D. Cost Analysis of Carbon Capture and Storage for the Latrobe Valley; University of California: Santa Barbara, CA, USA, 2010. [Google Scholar]
- Borgert, K.J.; Rubin, E.S. Oxyfuel combustion: Technical and economic considerations for the development of carbon capture from pulverized coal power plants. Energy Procedia 2013, 37, 1291–1300. [Google Scholar] [CrossRef]
- Rubin, E.; Davison, J.; Herzog, H. The cost of CO2 capture and storage. Int. J. Greenh. Gas Control 2015, 40, 378–400. [Google Scholar] [CrossRef]
- Morgan, D.; Grant, T. FE/NETL CO2 Transport Cost Model: Model Overview, Presentation, DOE/NETL-2014/1668; US Dept. of Energy, National Energy, Technology Laboratory: Pittsburgh, PA, USA, 2014.
- Knoope, M.M.J.; Ramirez, A.; Faiij, A.P. A state of the art review of techno-economic models predicting the costs of CO2 pipeline transport. Int. J. Greenh. Gas Control 2013, 16, 241–270. [Google Scholar] [CrossRef]
- Mallon, W.; Buit, L.; van Wingerden, J.; Lemmens, H.; Eldrup, N.H. Costs of CO2 transportation infrastructures. Energy Procedia 2013, 37, 2969–2980. [Google Scholar] [CrossRef]
- Brownsort, P. Ship Transport of CO2 for Enhanced Oil Recovery—Literature Survey; Scottish Carbon Capture & Storage: Edinburgh, UK, 2015. [Google Scholar]
- Kjarstad, J.; Skagestad, R.; Eldrup, N.H.; Johnsson, F. Ship transport—A low cost and low risk CO2 transport option in the Nordic countries. Int. J. Greenh. Gas Control 2016, 54, 168–184. [Google Scholar] [CrossRef]
- Weihs, G.F.; Kumar, K.; Wiley, D.E. Understanding the economic feasibility of ship transport of CO2 within the CCS chain. Energy Procedia 2014, 63, 2630–2637. [Google Scholar] [CrossRef]
- Tapia, J.F.; Lee, J.Y.; Ooi, R.; Foo, D.; Tan, R. A review of optimization and decision-making models for the planning of CO2 capture, utilization and storage (CCUS) systems. Sustain. Prod. Consum. 2018, 13, 1–15. [Google Scholar] [CrossRef]
- Hasan, F.; First, E.; Boukouvala, F.; Floudas, C. A multi-scale framework for CO2 capture, utilization, and sequestration: CCUS and CCU. Comput. Chem. Eng. 2015, 81, 2–21. [Google Scholar] [CrossRef]
- Hassiba, R.; Al-Mohannadi, D.; Linke, P. Carbon dioxide and heat integration of industrial parks. J. Clean. Prod. 2017, 155, 47–56. [Google Scholar] [CrossRef]
- Agrali, S.; Uctug, F.G.; Turkmen, B.A. An optimization model for carbon capture & storage/utilization vs. carbon trading: A case study of fossil-fired power plants in Turkey. J. Environ. Manag. 2018, 215, 305–315. [Google Scholar]
- Pérez-Fortes, M.; Bocin-Dumitriu, A.; Tzimas, E. Techno-economic assessment of carbon utilization Assessment of Carbon Utilization Potential in Europe. In Chemical Engineering Transactions; AIDIC—The Italian Association of Chemical Engineering: Milano, Italy, 2014. [Google Scholar]
- Duraccio, V.; Gnoni, M.; Elia, G. Carbon capture and reuse in an industrial district: A technical and economic feasibility study. J. CO2 Util. 2015, 10, 23–29. [Google Scholar] [CrossRef]
- Reiter, G.; Lindorfer, J. Evaluating CO2 sources for power-to-gas applications—A case study for Austria. J. CO2 Util. 2015, 10, 40–49. [Google Scholar] [CrossRef]
- Karjunen, H.; Tynjälä, T.; Hyppänen, T. A method for assessing infrastructure for CO2 utilization: A case study of Finland. Appl. Energy 2017, 205, 33–43. [Google Scholar] [CrossRef]
- Patricio, J.; Angelis-Dimakis, A.; Castillo-Castillo, A.; Kalmykova, Y.; Rosado, L. Region prioritization for the development of carbon capture and utilization technologies. J. CO2 Util. 2017, 17, 50–59. [Google Scholar] [CrossRef]
- Von der Assen, N.; Müller, L.J.; Steingrube, A.; Voll, P.; Bardow, A. Selecting CO2 sources for CO2 utilization by environmental-merit-order curves. Environ. Sci. Technol. 2016, 50, 1093–1101. [Google Scholar] [CrossRef] [PubMed]
Figure 1.
The six steps of a carbon capture and utilization (CCU) value chain.

Figure 2.
Levelized cost of capture (in €/tCO2) for the cement industry (using data from [50,59,60,61,62]).
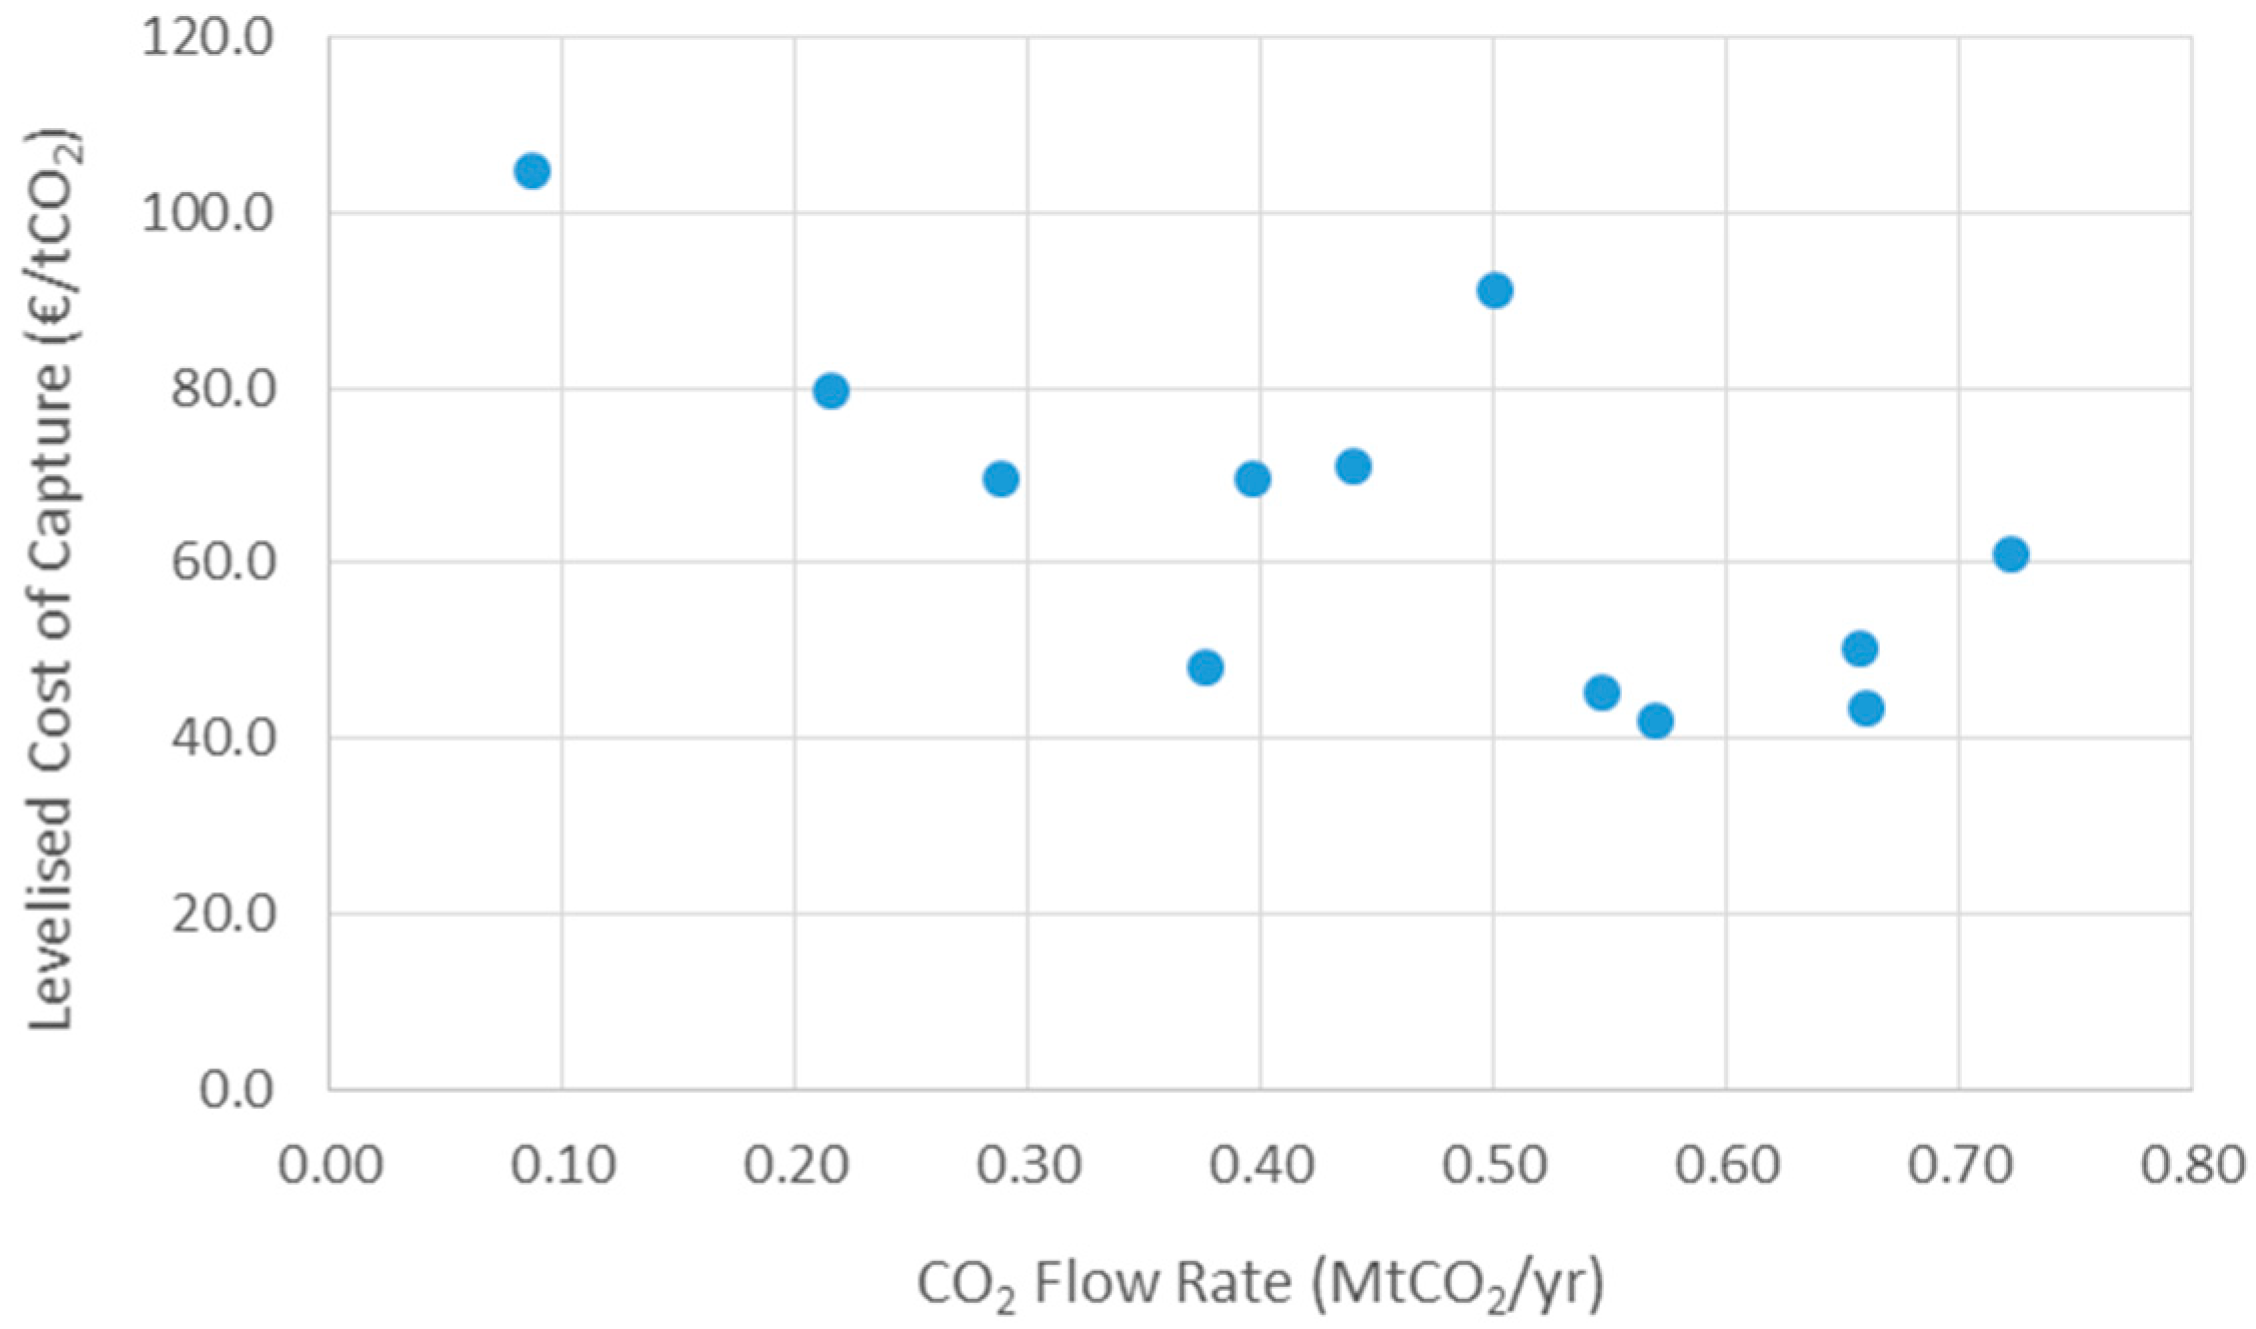
Figure 3.
Levelized cost of capture (in €/tCO2) for the high purity sources, using data from [62,63].


Table 1.
Matching carbon sources and carbon separation technologies (with information from [9,11,12,30,31,32]).
| Source CO2 Purity | |||
|---|---|---|---|
| Technique | High CO2 % | Medium CO2 % | Low CO2 % |
| General Gas Conditioning | Fermentation processes | ||
| Beer (100%) | |||
| Wine (100%) | |||
| Bioethanol (100%) | |||
| Biogas production (99%) | |||
| Refineries gas sweetening (96–99%) | |||
| Absorption with Chemical Solvents or Combustion using pure oxygen | Iron and steel Industries | Pulp industry | |
| Recovery boiler (13%) | |||
| Corex (30%) | Paper industry | ||
| Energy production (13%) | |||
| TGRBF (22–38%) | Power generation | ||
| Oil fired boilers (11–13%) | |||
| Blast furnace (22%) | Coal fired boilers (11%) | ||
| Natural gas fired boilers (7–10%) | |||
| Lime production | Incineration of waste (10%) | ||
| Glass industries (10%) | |||
| Combustion of fuels in lime kilns (24–32%) | Aluminium production (3–10%) | ||
| Polyethylene production | |||
| Cement industries | Cracker furnaces (5%) | ||
| Gas turbines (3–4%) | |||
| Cement kilns (22%) | Carbon black manufacturing (2–5%) | ||
| Oil refineries (8–24%) | Brick dryers and kilns (1.5–4%) | ||
| Absorption with Physical Solvents | Hydrogen production (100%) | Integrated gasification combined cycles (12–14%) | |
| Ammonia production | |||
| Haber-Bosch process (30–99%) | |||
| Ethylene oxide production (30–100%) | |||
| Natural gas processing (2–70%) | |||
Table 2.
Quality requirements of existing and emerging carbon dioxide (CO2) uses.
| CO2 Receiver | Required Purity | TRL [11] | Reference |
|---|---|---|---|
| Direct Use | |||
| Beverage carbonation | High > 99.0% | 9 | [43] |
| Wine making | High > 99.0% | 9 | [43] |
| Food processing, preservation and packaging | High > 99.0% | 9 | [43] |
| Coffee decaffeination | High > 99.0% | 9 | [43] |
| Supercritical CO2 as a solvent | High > 99.0% | 9 | [43] |
| Steel manufacture | High | 9 | [53] |
| Metal working | High | 9 | [44] |
| Welding | High > 99.8% | [46] | |
| Pulp and paper processing | High | [47] | |
| Water treatment | High > 99% | [43] | |
| Electronics | Supercritical phase | [48] | |
| Power generation (as power cycle working fluid) | [42] | ||
| Pneumatics | 9 | [45] | |
| Fire suppression technology | High > 99.5% | 9 | |
| Refrigerant gas | High > 95.5% | 9 | [43] |
| Horticulture | High | 9 | [45] |
| Pharmaceutical processes | High > 99.5% | [43] | |
| Mineral Carbonation | |||
| Calcium carbonate and magnesium carbonate | Medium-Low | 7–8 | [42] |
| CO2 concrete curing | Medium-Low | 7–8 | [42] |
| Baking soda (sodium bicarbonate) | Medium-Low | [42] | |
| Bauxite residue treatment (“red mud”) | High | 7–9 | [42] |
| Fuels Production | |||
| Renewable methanol | High | 7–8 | [42] |
| Formic acid | High | [42] | |
| Algae cultivation | Medium-Low | 4–7 | [42] |
| CO2 injection to conventional methanol synthesis | High | [42] | |
| Genetically engineered micro-organisms | High > 99.5% | [45] | |
| Enhanced oil recovery (EOR) | High 95.0% | 9 | [45] |
| Enhanced coal bed methane recovery (ECBM) | High-Medium-low | 7 | [42] |
| Chemicals Production | |||
| Urea yield boosting | High | 9 | [42] |
| Polymer processing | High | 7 | [42] |
| Chemical synthesis (excludes polymers and fuels) | High | 6–8 | [54] |
TRL: Technology Readiness Level.
Table 3.
Type of transportation examined in previous published studies.
| Reference | Pipelines Offshore | Pipelines Onshore | Ships | Truck Tankers | Railroad Tankers |
|---|---|---|---|---|---|
| [66] | Yes | Yes | No | No | No |
| [10] | Yes | Yes | Yes | No | No |
| [35] | No | No | Yes | No | No |
| [31] | Yes | Yes | Yes | Yes | No |
| [68] | Yes | Yes | No | No | No |
| [69] | Yes | Yes | Yes | No | No |
| [72] | Yes | Yes | No | No | No |
| [70] | No | No | Yes | No | No |
| [71] | No | Yes | No | No | No |
Table 4.
Main characteristics of the published CCU modeling approaches.
| Reference | CCU/CCS | Type of Receivers | Approach | Application | Economic Assessment | Environmental Impact Assessment | Social Impact Assessment |
|---|---|---|---|---|---|---|---|
| [74] | Both | EOR only | Optimization (MILP) | USA | Yes | No | No |
| [75] | Both | Three Selected | Optimization (Pinch) | Qatar | Yes | No | No |
| [76] | Both | EOR only | Optimization (MILP) | Turkey | Yes | No | No |
| [77] | CCU | Two Selected | Techno economic Analysis | Europe | Yes | No | No |
| [78] | CCU | Sugar Production | Techno economic Analysis | Industrial District | Yes | No | No |
| [79] | CCU | P2G | Techno economic Analysis | Austria | Yes | No | No |
| [80] | CCU | P2G | Simulation (Node Modelling) | Finland | Yes | No | No |
| [11] | CCU | Five Selected | Simulation (MFA) | Regional | Yes | No | |
| [81] | CCU | Nine Selected | Simulation (MFA) | Europe | Yes | No | No |
| [82] | CCU | - | Environmental Merit-Order | Europe | No | Yes | No |
CCU: carbon capture and utilization. CCS: carbon capture and storage. MILP: Mixed Integer Linear Programming. MFA: Material Flow Analysis
© 2018 by the authors. Licensee MDPI, Basel, Switzerland. This article is an open access article distributed under the terms and conditions of the Creative Commons Attribution (CC BY) license (http://creativecommons.org/licenses/by/4.0/).
Share and Cite
MDPI and ACS Style
Pieri, T.; Nikitas, A.; Castillo-Castillo, A.; Angelis-Dimakis, A. Holistic Assessment of Carbon Capture and Utilization Value Chains. Environments 2018, 5, 108. https://0-doi-org.brum.beds.ac.uk/10.3390/environments5100108
AMA Style
Pieri T, Nikitas A, Castillo-Castillo A, Angelis-Dimakis A. Holistic Assessment of Carbon Capture and Utilization Value Chains. Environments. 2018; 5(10):108. https://0-doi-org.brum.beds.ac.uk/10.3390/environments5100108
Chicago/Turabian StylePieri, Tryfonas, Alexandros Nikitas, Arturo Castillo-Castillo, and Athanasios Angelis-Dimakis. 2018. "Holistic Assessment of Carbon Capture and Utilization Value Chains" Environments 5, no. 10: 108. https://0-doi-org.brum.beds.ac.uk/10.3390/environments5100108
Note that from the first issue of 2016, this journal uses article numbers instead of page numbers. See further details here.