Contamination of Plants from Amazonia by Environmental Pollution


1
Department of Chemistry, Biology and Biotechnology, University of Perugia, Via Elce di Sotto 8, 06123 Perugia, Italy
2
Department of Civil and Environmental Engineering, University of Perugia, Via G.Duranti 93, 06125 Perugia, Italy
*
Author to whom correspondence should be addressed.
Environments 2018, 5(3), 33; https://0-doi-org.brum.beds.ac.uk/10.3390/environments5030033
Submission received: 9 February 2018
/
Revised: 14 February 2018
/
Accepted: 24 February 2018
/
Published: 26 February 2018
(This article belongs to the Special Issue Fate of Toxic Pollutants in the Environment)
Abstract
:Analytical data concerning the contamination on three officinal plants due to Persistent Organic Pollutants (POPs), as organochlorine pesticides, are reported and discussed. Analyzed vegetation—“Graviola” (Annona muricata), “Mullaca” (Physalis angulata) and “Balsamina” (Impatiens balsamina)—comes from the Peruvian Amazonian forest, and are well known for their numerous therapeutic properties. A portion of each vegetable sample (leaves) was submitted to extraction procedure with hexane-acetone (1:1, v/v) solution by using a continuous solid-liquid extraction. The extracts were analyzed by Gas Chromatography-Tandem Mass Spectrometry (GC-MS/MS) and Multi Reaction Monitoring (MRM) techniques. Obtained results show the presence of DDT (dichlorodiphenyltrichloroethane) and its breakdown products, as DDD (dichlorodiphenyldichloroethane) and DDE (dichlorodiphenyldichloroethylene), while the hexachlorobenzene was found only in the “Graviola” (0.041 ng/g of dry weight (d.w.) net matter). The total POPs quantities were detected in the concentration range of ppb, varying from 0.349 and 0.614 ng/g d.w. for “Mullaca” and “Graviola”, respectively, up to 1.329 ng/g d.w. in the case of “Balsamina”. Recorded concentration trace values in the case of hexachlorobenzene could be an indication of a contamination of plants due to a probable short-range atmospheric transport pollution. The DDT contamination could be due to the use of DDT against malaria during the years 1992–1997 or to a probable usage of dicoflos and rothane insecticide in the harvesting area. Our analytical determinations exclude the presence of polychlorinated biphenyls (PCBs) in all three investigated plant materials.

1. Introduction
For a long time, human activities have released, either deliberately or unintentionally, undesirable chemical compounds into the environment. The modern ever-expanding society is characterized by a massive use of materials, energy and space, which causes a continuous and significant contamination of water, soil and air ecosystems. In particular, the constant use of a large quantity of anthropogenic and persistent organic chemicals—such as herbicides, insecticides, and fungicides—has been the cause of a chronic contamination of the environment [1]. The interactions between the three environmental compartments (water, soil, and air) are closely interconnected and determine overall fate of the pollutants. These processes can leave the structure of a chemical substance unchanged or may induce various physical, photochemical and biological transformations. In all cases the pollutants can be transported from a given environmental compartment to another, or they can be transferred from a polluted site to a remote one, by short- or long-range transport phenomena throughout the atmosphere by wet and dry deposition [1,2]. In this way, due to circulation processes of the Earth’s atmosphere, the pollutants can travel for long distances before being deposited, accumulating in remote areas far from where they originated, making the problem of a global nature [3]. Such an atmospheric long-range transport involves the concepts of “global distillation” and “grasshopper effect”, i.e., migration to higher latitudes by cycles of deposition and re-volatilisation of semi-volatile compounds [4]. Similarly, latitudinal distribution of pollutants has been observed in mountainous areas as a function of altitude (regional transport). These phenomena are known as “cold trapping” [5,6]. In fact, the presence of organochlorine compounds has been revealed in the arctic ices [7] as well in the most remote snows and lakes in mountains [8]. Furthermore, the large-scale circulation of winds is responsible for longitudinal transport of pollutants by transoceanic movements along the Equatorial belt and temperate zones (i.e., from Africa to Americas [9,10]). Among the most common widespread and persistent contaminants in the environment are included organochlorine pesticides (OCPs), as lindane (γ-hexachlorocyclohexane, commonly named as γ-HCH), DDT (dichlorodiphenyltrichloroethane) and its breakdown products DDD (dichlorodiphenyldichloroethane) and DDE (dichlorodiphenyldichloroethylene), hexachlorobenzene (having a half-life of ~15 months, 2–15 and 3–7 years, respectively), and the congener family of polychlorinated biphenyls (PCBs: half-life ~2–6 years). They had been used for many years in agricultural and in industrial activities and therefore they are a class of ubiquitous organic contaminants in the environment. Because of their chemical behavior (i.e., water solubility, octanol–water partition coefficient, vapor pressure, Henry’s law constant and specific structure [11,12]) they can be transported and bioaccumulated, with toxic effects on living beings [13]. For such reasons, the OCPs and PCBs belong to the class defined as Persistent Organic Pollutants (POPs) and Persistent, Bioaccumulative and Toxics (PBTs) [14,15]. Since 2001 the production of twelve of these organochlorine compounds have been banned by the Stockholm Convention adopted at a Conference of Plenipotentiaries on 22 May 2001 in Stockholm (Sweden) in order to reduce their impact on the environment and protect human health. In 2009 the list of banned compounds was extended to include nine new substances (United Nations Environment Programme—UNEP, 2009) [16]. Nevertheless, nowadays the use of such substances continues, as for example DDT in tropical regions, because it remains one of the most effective ways to control the malaria endemic disease, in accordance with World Health Organization guidelines (WHO, 2004) [17]. Nowadays emerging countries, as China and India, are the only two producers and biggest users, together with Africa and Latin America. Nevertheless, the elimination of POPs under national and international controls minimized “primary” sources, but the organochlorine residue diffusion in ecosystems generated “secondary” sources and their transport and accumulation is a function of the air-surface exchange [18]. It is well known that vegetation can absorb organic chemicals from air being affected by a direct contamination (air-plant path). On the other hand, an indirect contamination can be possible when the absorption of pollutants occurs from soil (air-soil-plant path). The first way appears to be the most important one when the vegetation grows in uncontaminated soils [19,20,21]. In fact plant leafs have a large surface area coated with cuticular waxes, being perfect morphologic features for accumulation of lipophilic pollutants dispersed in the atmosphere. This process depends on chemical and physical behavior of each specific pollutant and on environmental conditions. In remote and unpolluted areas the endemic plants could be used as bioindicators of the toxic chemicals dispersed in the atmosphere, and the knowledge of chemical passive accumulation in the plant foliage is an interesting tool to estimate the pollution level in remote ecosystems [22,23,24]. So far few analytical studies have been done on endemic tropical plants affected by POPs contamination, and available scientific data concern the pollution on a small number of plants harvested in restricted areas of Africa, Canada, Central America and the Antarctic [6,7].
The study here presented aims to verify the possible contamination due to POPs, as organochlorine pesticides and PCBs, on three officinal plants growing in the Amazonian Forest of Peru.
2. Materials and Methods
2.1. Plants Description
In this study, the investigated officinal plants were Annona muricata, Physalis angolata and Impatiens balsamina, commonly named “Graviola”, “Mullaca” and “Balsamina”, respectively. They were originally non-cultivated wild plants, of spontaneous origin and harvested in the Amazonian rainforest whose extracts (primarily alcoholic-watery) are used as food complements and to produce herbal preparations for therapeutic use with antioxidant and anticancer activities as well as with energizing effects [25]. The Annona muricata, belonging to the Annonaceae family, is a small and evergreen tree, that grows upright reaching about 5–6 m of height, having oblong leaves of glossy dark green color without piles. The plant, which has an edible fruit, called “Guanabana” or “Cherimonia Brasilano”, is native from the tropical American region including the Amazonian rainforest, and nowadays widely propagated and also cultivated [26]. All parts of this vegetable are used in traditional medicine to treat various illness, including fever, rheumatism, and cancer, also having sedative, insecticide, and immunosuppressive activities [27,28,29]. Bioactive chemical compounds responsible for these properties would seem to be the “annonacee acetogenins”. On the other hand, the Physalis angolata and the Impatiens balsamina, are herbaceous and annual shrubs. The first one belongs to the nightshade family Solanaceae, having a dark green and oval-shaped leafs. It grows up to 1 m with small stems producing edible fruits wrapped by a layer of leaves. Nowadays such a plant is widely distributed in tropical and subtropical regions although it is native from the Americas, including the Amazon region. The phytochemistry of “Mullaca” is well known to contain glucocorticoids, physalin, and withangulatin [30,31], and its extracts are used in traditional medicine as an analgesic, anti-rheumatic, antipyretic, antinociceptive, antidiuretic, anti-inflammatory, and to treat hepatitis B, cervicitis, bacterial and mycobacteria infections, dermatitis and viral infections [32]. The “Balsamina”, grows up to 20–75 cm tall, with a thick but soft stem and leaves having lanceolate shape and toothed edge, like the Physalis angulata. It is a species native to southern Asia, India, Bangladesh, and when the plant seed capsules ripen undergo explosive dehiscence. Like the “Graviola” and “Mullaca”, “Balsamina” herbaceous shrub extracts have fungal and antimicrobial properties [33].
2.2. Chemicals and Reagents
All used reagents were of analytical grade purity. For the sample extraction and chromatographic clean up were used n-hexane and acetone purchased from Sigma-Aldrich (Deisenhofen, Germany) ≥98% and ≥99% pure, respectively. The Silica gel high purity grade (Merck Grade 7734) 60 (70–230 mesh), Extrelut 20 and Florisil (60–100 US mesh) sorbents and sodium sulphate anhydrous, used to pack chromatographic column for separation and clean up of analytical fraction, were purchased from Sigma-Aldrich (Deisenhofen, Germany).
The calibration mixture in isooctane of seven congeners (28, 52, 101, 118, 153 and 180, so called indicator PCBs) included on OSPAR list of Chemicals for Priority Action and of two standard solutions mixture containing eleven organochlorine pesticides (namely α-, β-, γ-HCH (hexachlorocyclohexane), hexachlorobenzene, heptachlor, and the isomers (o,p) and (p,p)-DDT, -DDE and -DDD), used to optimise single and tandem mass spectrometry (indicated as MS and MS/MS, respectively) and Multi Reaction Monitoring (MRM) operative conditions [34], and to quantify analytes, were supplied by Supelchrom, Milano. The internal standard used to spike samples was a solution of PCB 210 congeners in isooctane, 100 μg/mL (AccuStandard, Inc., New Haven, CT, USA).
2.3. Plants Preparation
The three officinal vegetable samples of “Graviola”, “Mullaca” and “Balsamina” has been harvested by spontaneous plants in a remote region of the “Parque Nacional Otishi” located in the “Provincia de Satipo” of the “Departamento de Junìn” (Peru) at about 600 km from Lima (east direction) in the end west side of the Amazonian rainforest, and purchased from “Carlos R. Toledano” Urb. Leoncio Prado Maz. N-5 Rimac., Lima (Peru). The harvest of such vegetables was carried out late in the spring season. The samples, consisting of about 5 kg of fresh leaves, were collected randomly over a large area of about 50 km2 from different individual plants of each species in order to pick up samples being statistically representative of the area’s vegetation.
After harvesting, the vegetation was preliminarily dried under Sunlight with the purpose to eliminate the watery part and to avoid their perishing during the transport (sea freight) from rainforest sampling site to Italy. Then all samples were stored at a constant temperature (16 °C) in the dark until the analysis. The sampling method, according to ISTISAN 97/23 report [35], being the Italian official method for the sampling and trace analysis of pesticide residues in vegetables, was used to ensure the integrity of measured contaminants. Microbiological analyses have confirmed a good preservation state of vegetables during the harvest, storage and shipping stages. We determined the following microbiological parameters according to the EFSA (European Food Safety Authority) prescriptions for officinal plants: the total bacterial population count, enumeration of yeasts and molds, Escherichia coli, determined by Europäische Norm- International Organisation for Standardisation EN ISO 6222 and ISO 9308-1 methods. The recorded values for such parameters were lower than 100 CFU (colony-forming unit)/g (for both the total bacterial population count and the enumeration of yeasts and molds) and absent/10 g (for E. coli) in all analyzed vegetable samples, according to the maximum levels recommended by EFSA.
Before the extraction process, an aliquot of 500 g of each collected sample, consisting in heterogeneous leaves for size, was submitted to “quartatura” standard procedure [35] to obtain about 100 g of representative share. In order to maximize the extractive yield of the organic fraction, these representative aliquots of leaves were mechanically ground and homogenized by ULTRA TURRAX T25, according to ISTISAN 97/23 report [35].
2.4. Extraction
About 5.5, 9.0 and 7.5 g of each powdered representative samples of “Graviola”, “Mullaca” and “Balsamina”, respectively, were submitted to liquid/solid extraction with a n-hexane-acetone (1:1, v/v) solution under reflux in a Soxhlet extractor at 40 °C for 24 h, according to standard procedure [36], after spiking the vegetable samples with an aliquot of internal standard solution (congener PCB 210), in order to estimate losses of chlorinated target compounds attributable to the used analytical method. Then the lipid extracts were reduced at 2–3 mL in a rotary evaporator and were hexane exchanged to eliminate totally the acetone residue interfering in last analytical step of clean up.
Although in the literature are several examples of analytical protocols that are faster and simpler (as for example the QuEChERS methodology [37]), we employed the ISTISAN 97/23 and 99/28 analytical procedures, being the recommended analytical reference methods for the determination of pesticides at ultra-trace levels in Italy [35,36].
2.5. Clean Up
The leaf extracts were quantitatively transferred and loaded onto a glass column (30 × 2 cm internal diameter, i.d.) filled in the order with 4 g of silica gel 60, 2 g of anhydrous sodium sulfate and finally 10 g of Extrelut 20 mixed with 7.5 mL concentrated H2SO4 (about 95% of purity). The elution of analyte fractions was completed with 150 mL of n-hexane [36]. The obtained elutes, reduced to few ml in a rotary evaporator and transferred into conical flask, were led to complete solvent evaporation under N2 gentle stream at 30 °C and resuspended with 25 µL of isooctane.
The high interfering leaf cuticle waxes, especially present in the extract of “Balsamina” sample, were removed with a Florisil SPE (Solid Phase Extraction) clean up, according to EPA (United States Environmental Protection Agency) 3620B analytical procedure [38]. Briefly, the analyte fractions of the first chromatographic column was again loaded into Florisil SPE cartridge, previously conditioned with 5 mL of n-hexane, and then eluted with a 9 mL of acetone/n-hexane (10/90; v/v) solution. Finally, 1 µL of all three vegetable extracts was analyzed.
2.6. Gas Chromatographic-Tandem Mass Spectrometry (GC-MS/MS) and Multi Reaction Monitoring (MRM) Analysis
To perform GC-MS/MS and MRM qualitative and quantitative characterization of OCPs and PCB congeners, the analyses were carried out by using a Varian Saturn mod. 2200 ion-trap mass detector (ITD-MS) linked to a Varian CP3800 gas chromatograph equipped with CP-Sil8 CB low bleed/MS capillary column (Chrompack, Middelburg, The Netherlands), 30 m × 0.25 mm i.d., 0.25 µm film thickness, directly connected to the ionizing chamber and Varian mod. 1078 split-splitless programmable injector [39,40]. The carrier gas was He (99.9999% high purity Alphagaz 2 by Air Liquide) at a constant flow rate of 1.2 mL/min. As already mentioned in Section 2.4, the purpose of our analytical determinations was the determination of organochlorine compound residues in medicinal plants to be used in pharmacological and nutraceutical preparations. For this reason, reference analytical methodologies recommended by the Italian legislation have been applied [36,37]. Therefore the injection was carried out in the splitless mode at 280 °C, and in programmable temperature splitless mode at 90 °C for 0.30 min up to 310 °C, at 180 °C/min, and then held for 15 min at 310 °C for the OCP and PCB analysis, respectively. The oven temperature was programmed as follows: (i) for the OCP separation starting from 150 °C (held for 4 min) up to 290 °C at 6 °C/min., the final temperature being held for 5 min; (ii) for the PCB separation starting from 90 °C (held for 1 min) to 130 °C at 4 °C/min, to 170 °C at 15 °C/min, to 250 °C at 2 °C/min, and finally up to 310 °C at 30 °C/min, and kept at such a temperature for 3 min [34]. In all performed analyses the used temperatures for the transfer line, manifold and analyser were 290 °C, 90 °C and 150 °C, respectively. The operative ionization energy was 70 eV and the filament emission current was 10 µA.
The experimental MS/MS conditions for each analysed OCP compounds, including the selected parent ion mass, the specific collisional-induced dissociation voltages (CID), and the type of used waveform are synoptically shown in Table 1.
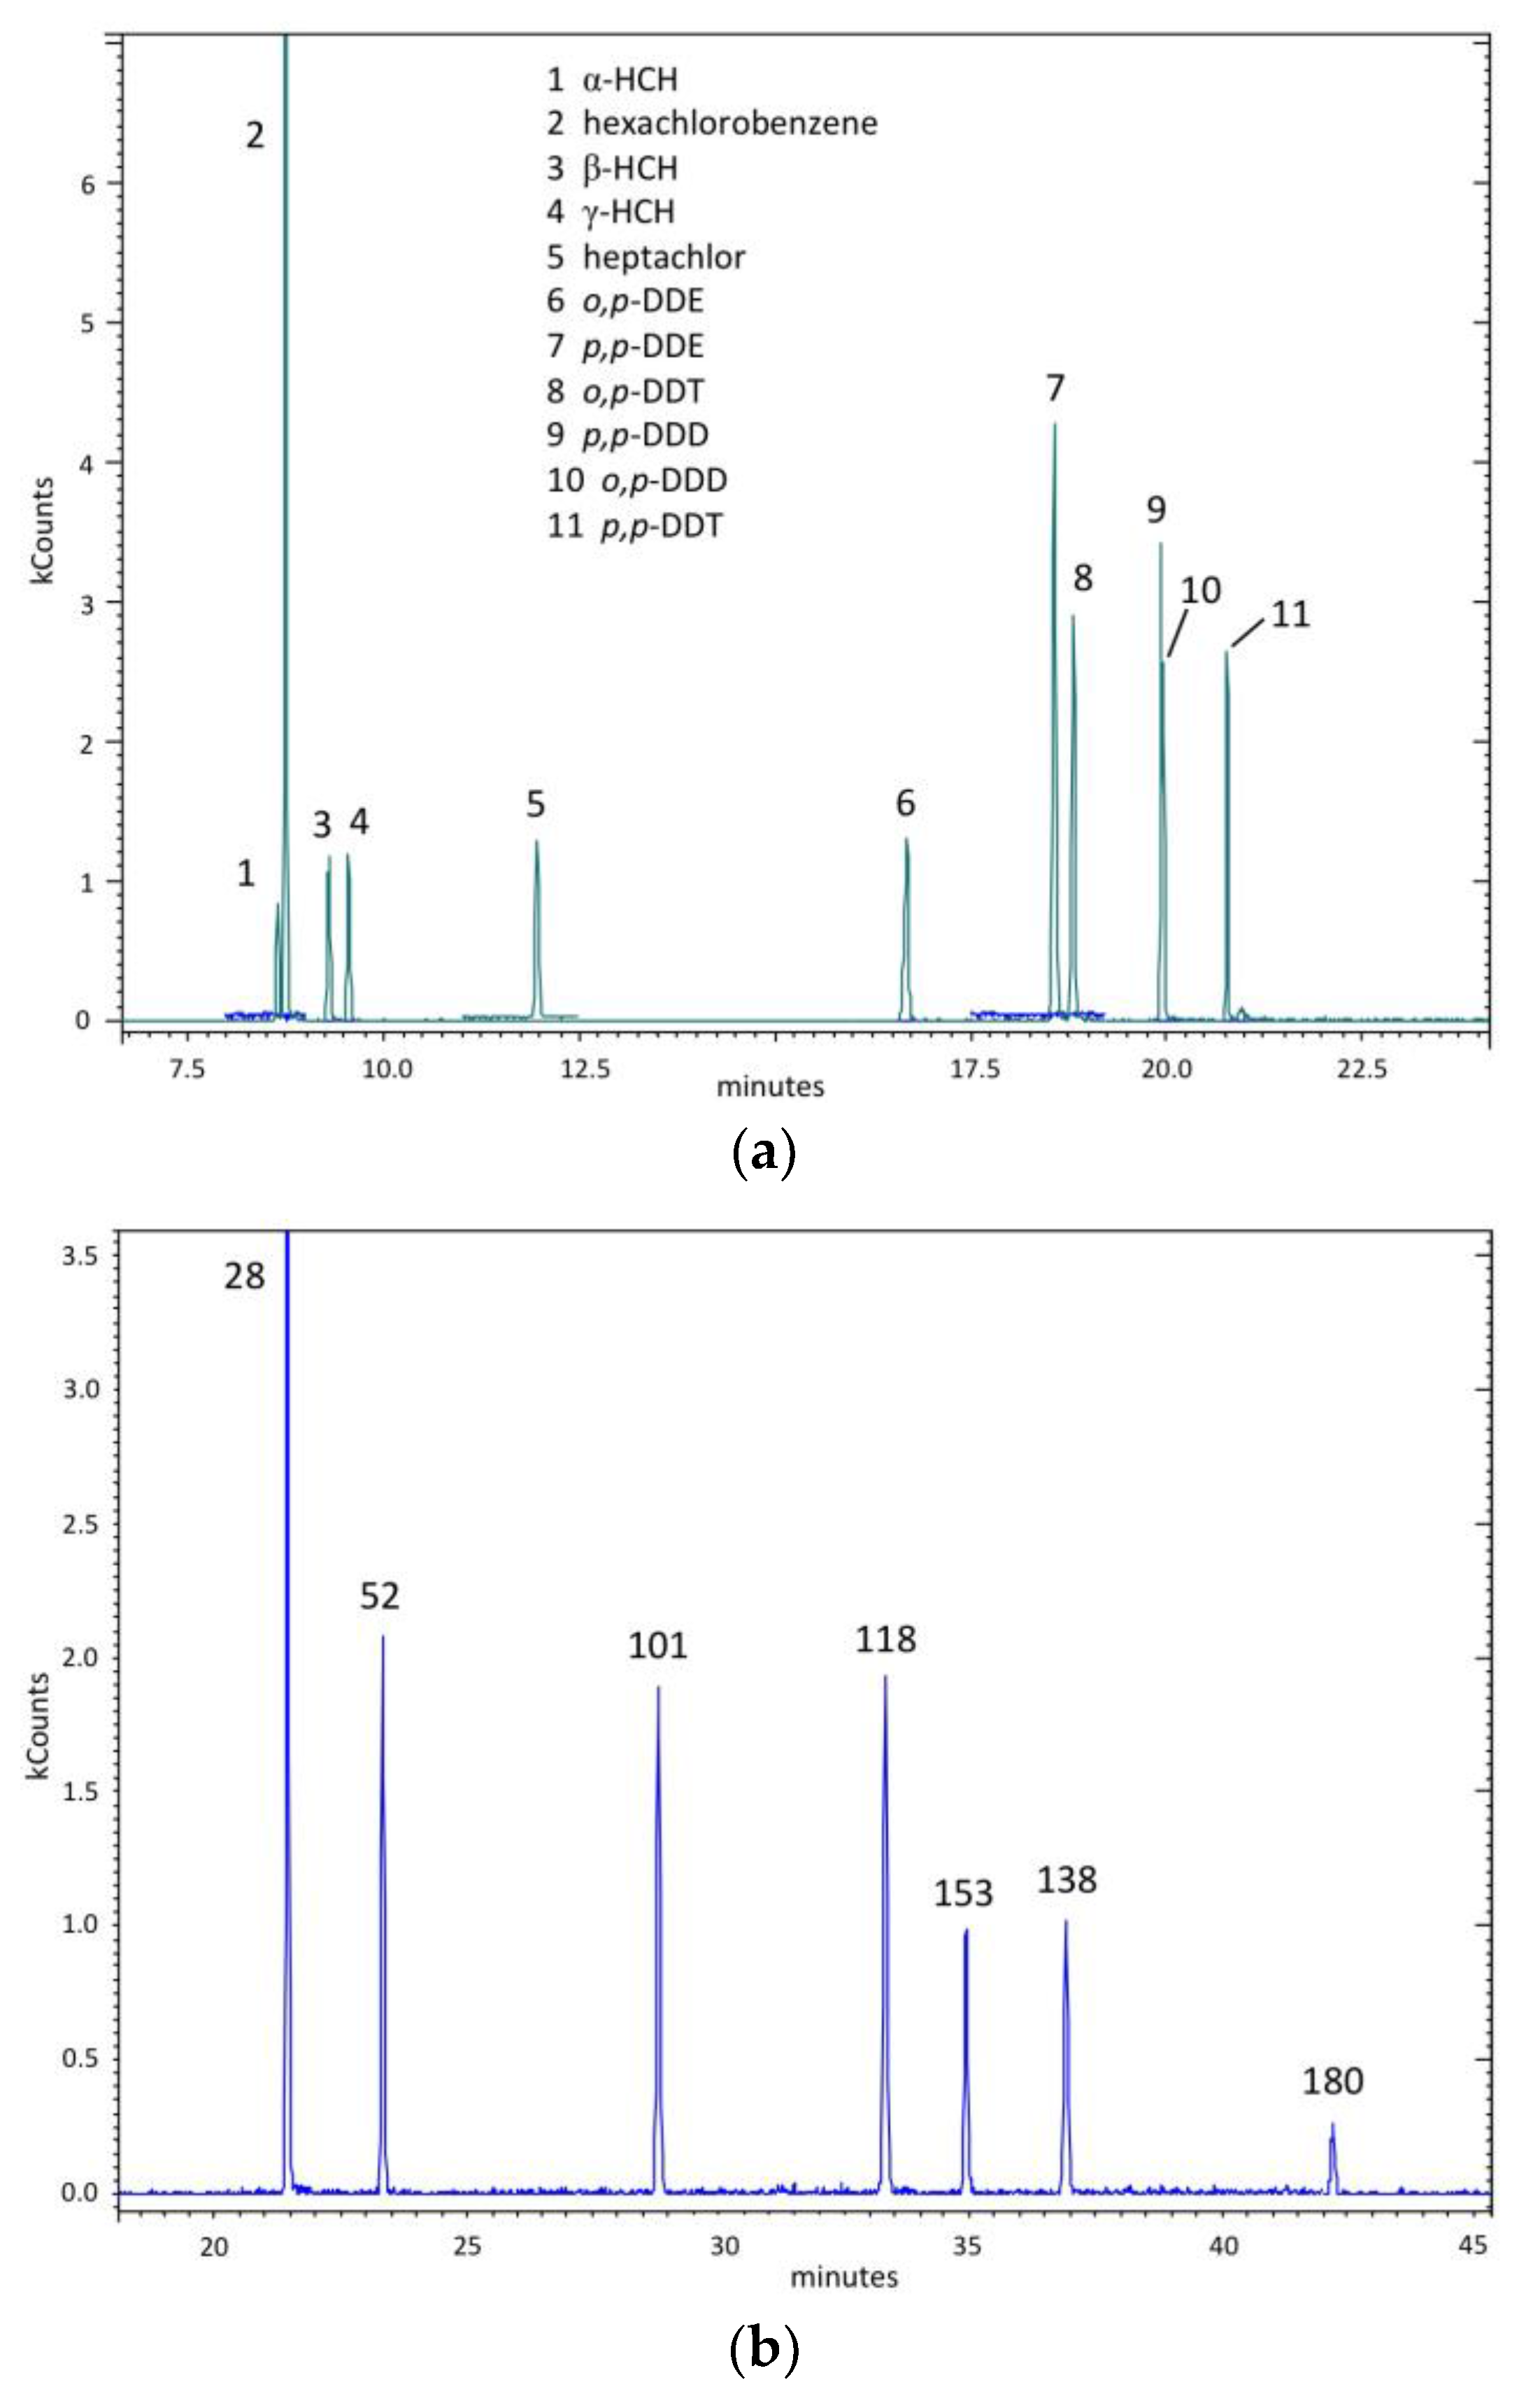
Chemical compound identification was based on matching retention times and experimental “daughter” spectra (MS/MS) of sample analytes with whose obtained from commercially standard solutions analyzed in the same instrumental conditions: a standard mixture of searched eleven organochlorine pesticides (see the Total Ion Current (TIC) profile reported in Figure 1a); and a standard mixture of searched polychlorinated biphenyls (PCB 28, 52, 101, 118, 138, and 180) (see the TIC profile shown in Figure 1b).
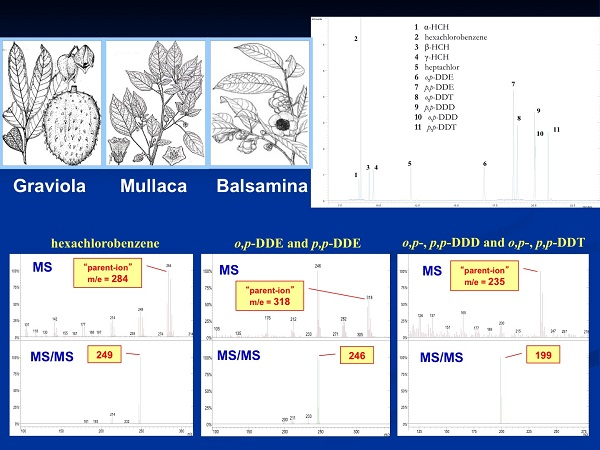
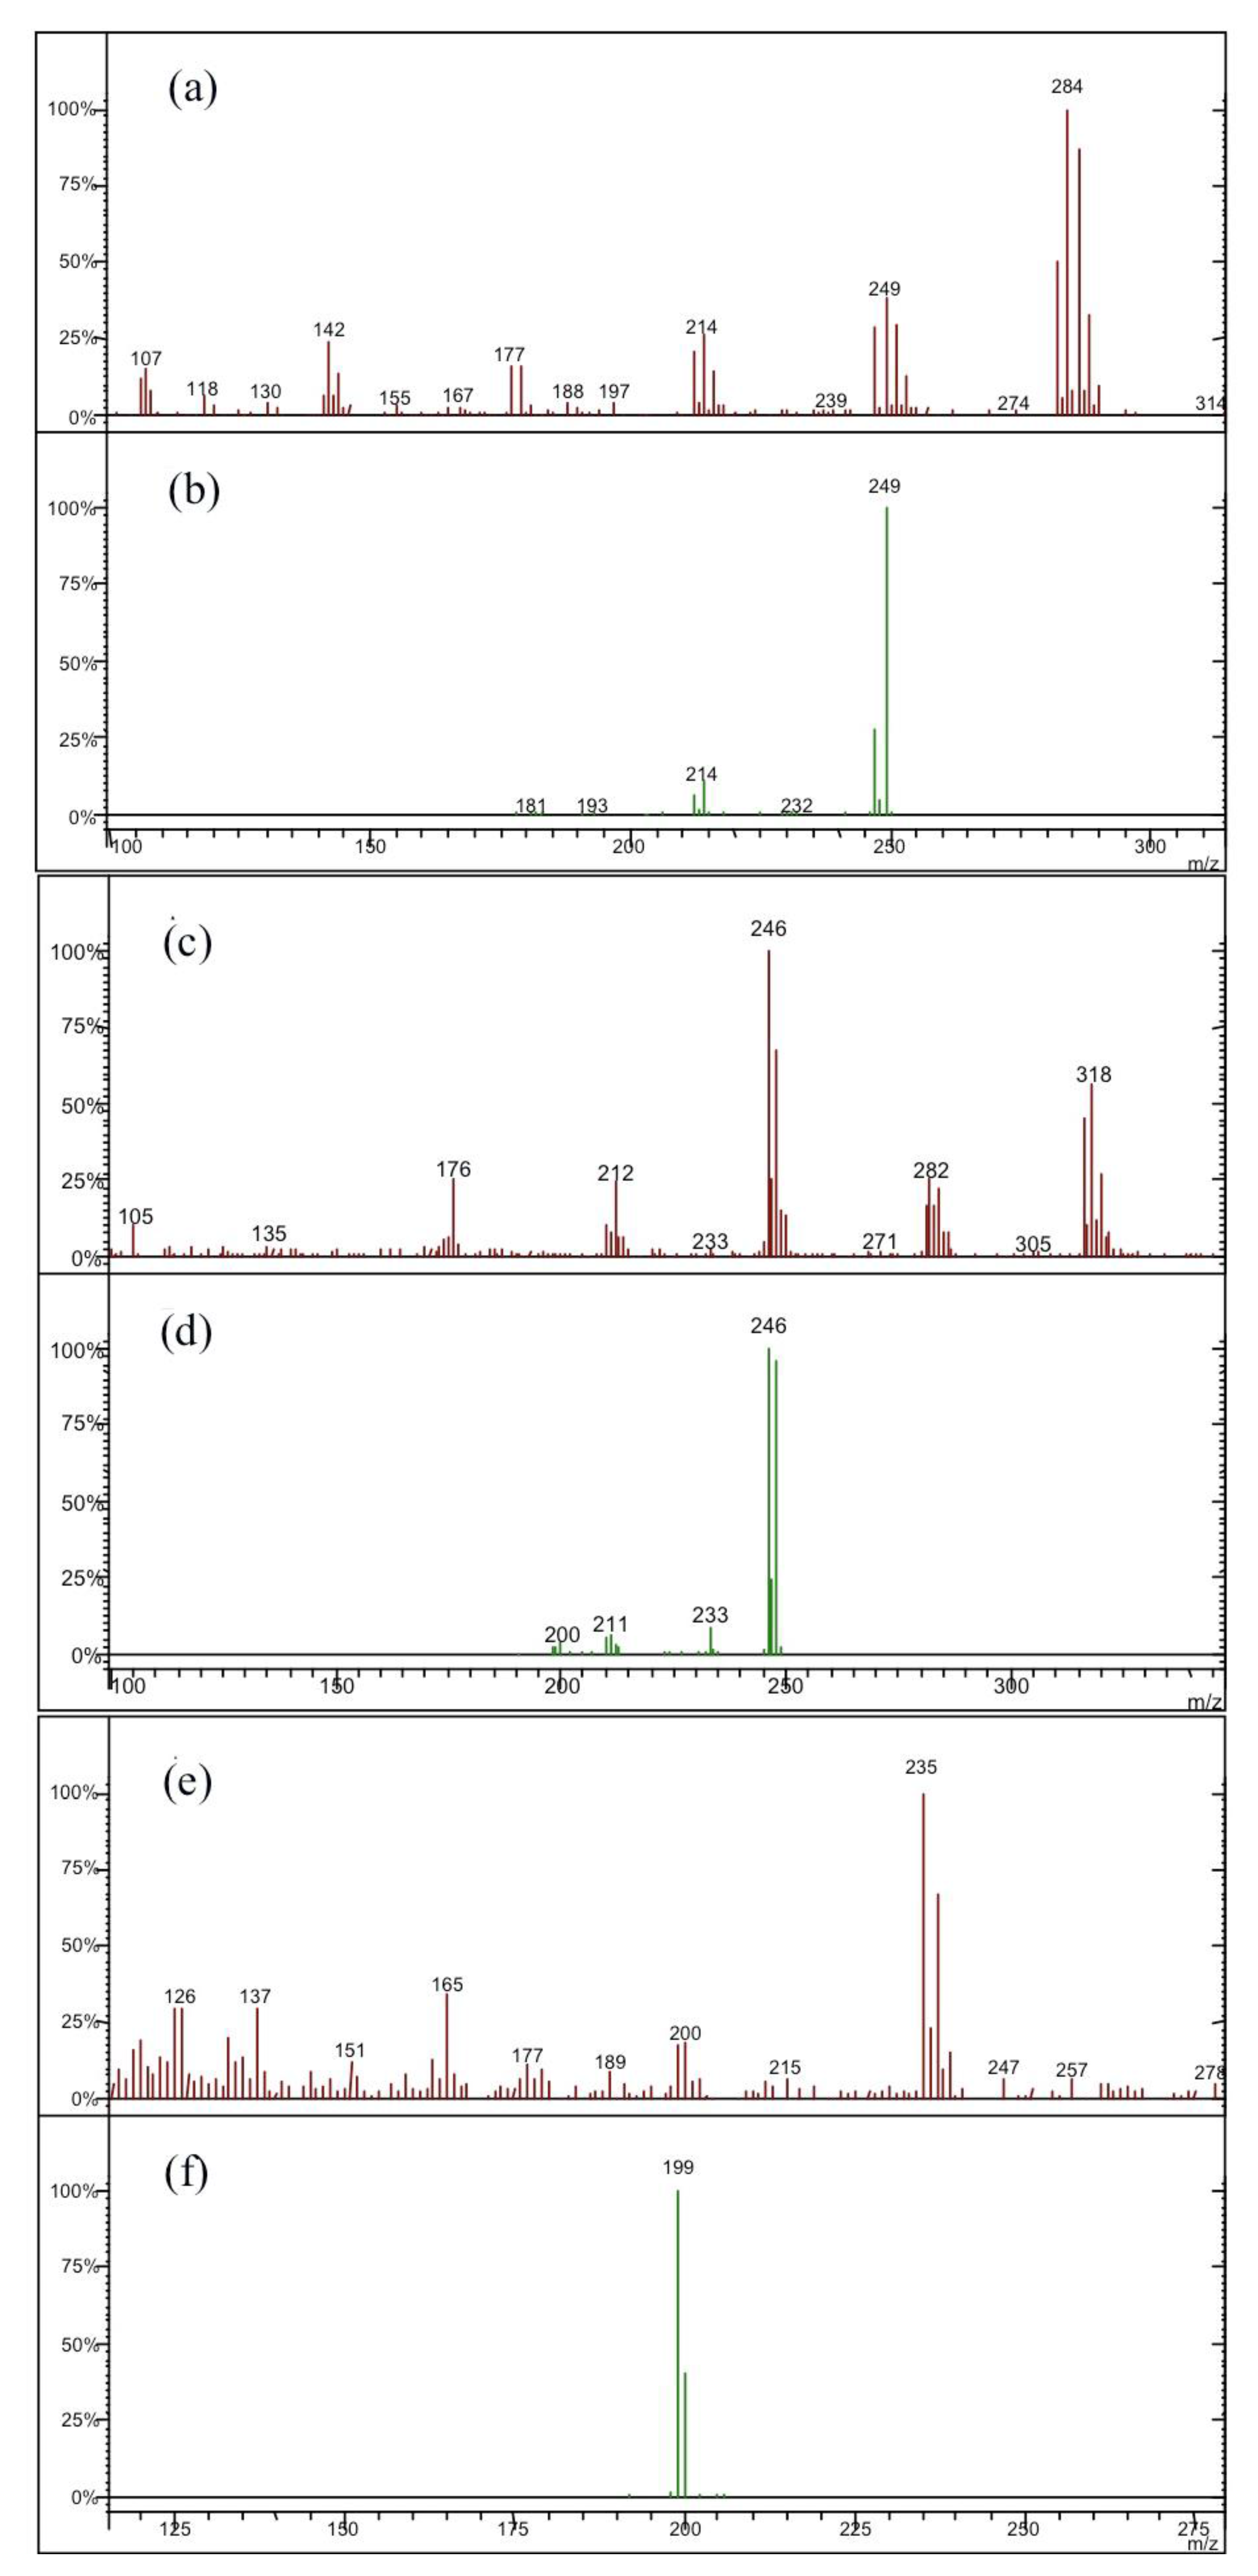
For a quantitative determination two characteristic ions for each type of analyte and internal standard were selected. As an example, and to clarify the used experimental procedure, in Figure 2 are reported the MS and MS/MS spectra for the main detected pesticides (hexacholorobenzene, o,p- and o,o-DDE; o,p- and p,p-DDD; o,p- and p,p-DDT).
The MS/MS spectra (see Figure 2b,d,f) show a simplification respect to the related MS spectra obtained in a “full scan” mode (see Figure 2a,c,e respectively), showing a profile where mass peaks are characterized by a “cluster” consisting of ion pairs differing by two m/e units. This connotative “cluster” is due to the presence of chlorine atoms in the analyzed molecule and therefore is related to the contribution of 35Cl and 37C isotopes. Concerning the o,p- DDD, p,p-DDD, o,p- and p,p-DDT isomers (see the MS/MS spectrum of Figure 2f), they are characterized by a couple of ions at m/e 199 and 200, the latter having a lower intensity. For o,p- and p,p-DDE isomers (see the MS/MS spectrum of Figure 2d), the lost of two chlorine atoms from the parent ion is found, while for the other organochlorine pesticides only one Cl atom is lost.
Moreover, for the PCB congener groups resonant CID (1 V, for all chlorinated groups) was performed on [M], [M+2] and [M+4] parent ions isolated with a 1 u.m.a. window for di-, tri/hexa- and hepta/deca-chloro PCBs, respectively [40].
2.7. Detection Criteria, Analyte Recovery and Repeatability
The detection criteria of qualitative and quantitative analysis for OCP individual compounds and PCB congeners were S/N > 3 (where S/N stands for signal to noise ratio) for limits of detection (LOD), and S/N > 3 × LOD for limits of quantification (LOQ), empirically calculated by analyzing the standard solutions at increasing concentrations. We obtained a LOQ of 0.030 ng/g of dry weight (d.w.) (for α-, β-, and γ-HCH), 0.007 ng/g d.w. (for HCB (hexachlorobenzene)), and 0.020 ng/g d.w. (for heptachlor, DDT, DDD, and DDE), as reported in Table 2.
The used analytical methods, being recognized reference methods [35,36], are already certified and validated, concerning both the repeatability and the recovery ranges, which have been confirmed by our analytical data. In fact, recovery and repeatability of the analytical procedure were tested and verified to minimize variations in accurate and precise quantification of pesticides. Six different samples of each plant were taken in triplicate, and three injections were conducted using the same sample. Recoveries as high as 90% were calculated, and reproducibility of replicate measurements agreed within ±10%, by using the procedure already used in previous papers [41,42].
3. Results and Discussion
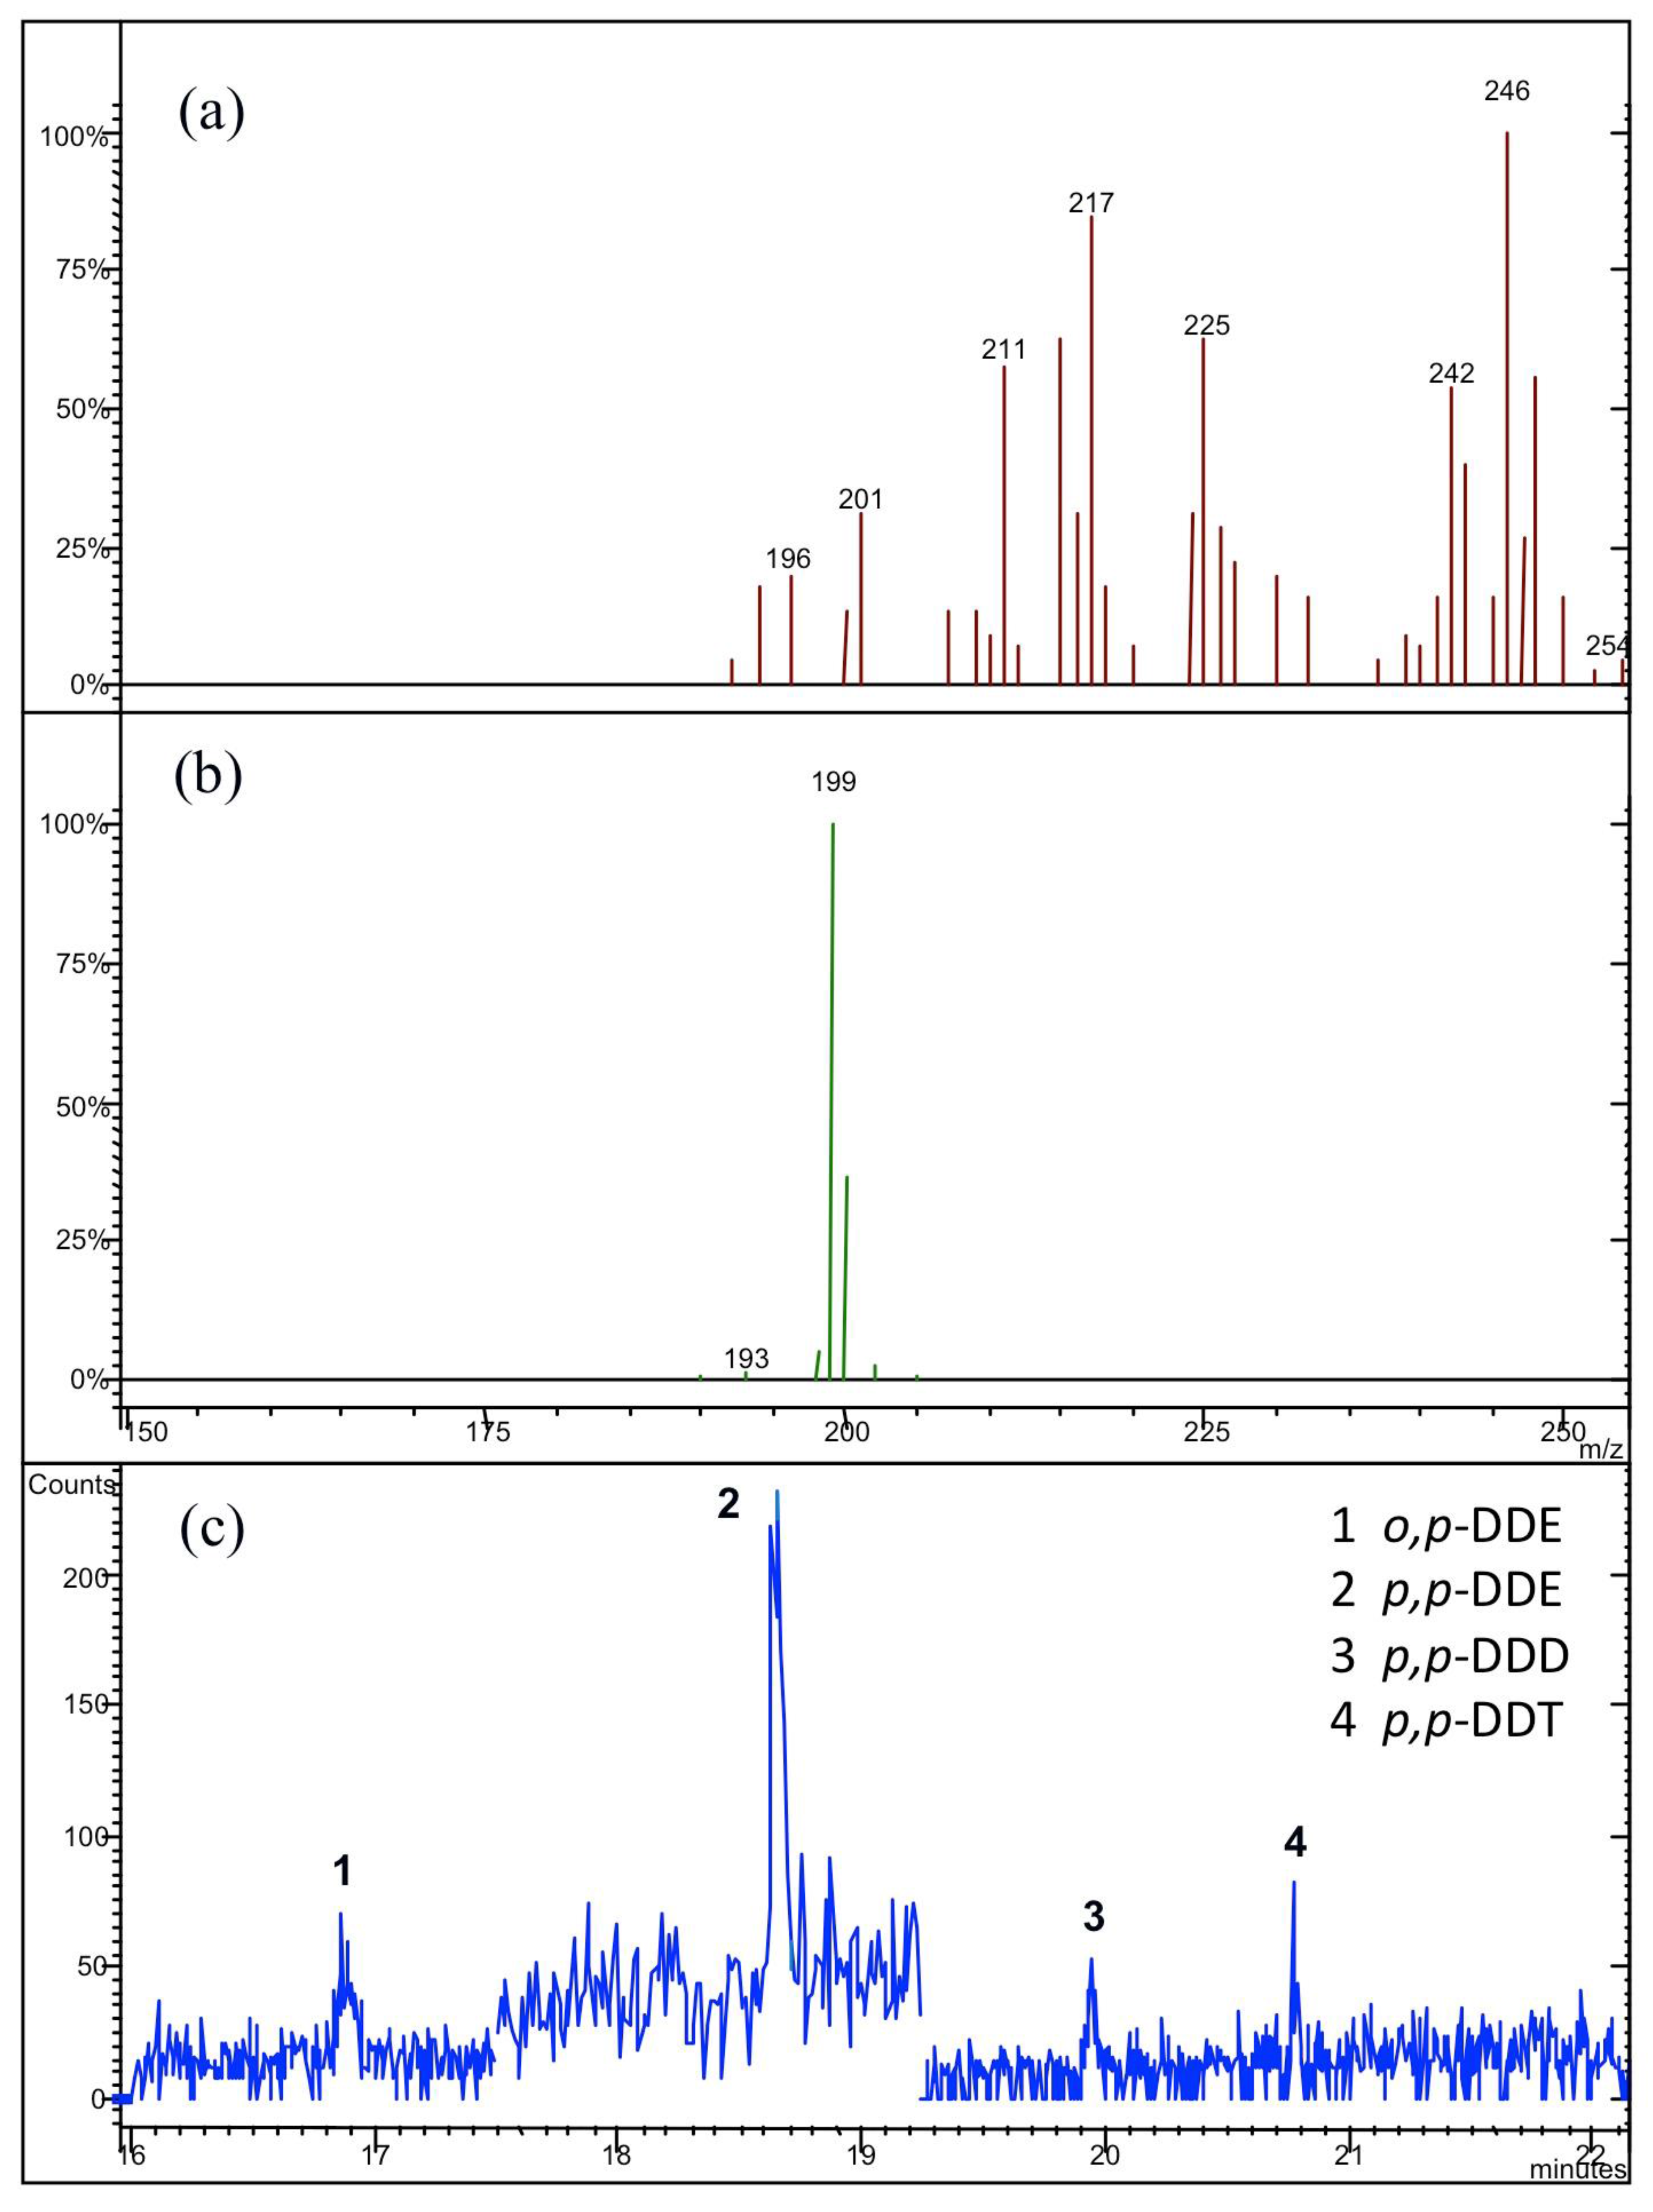
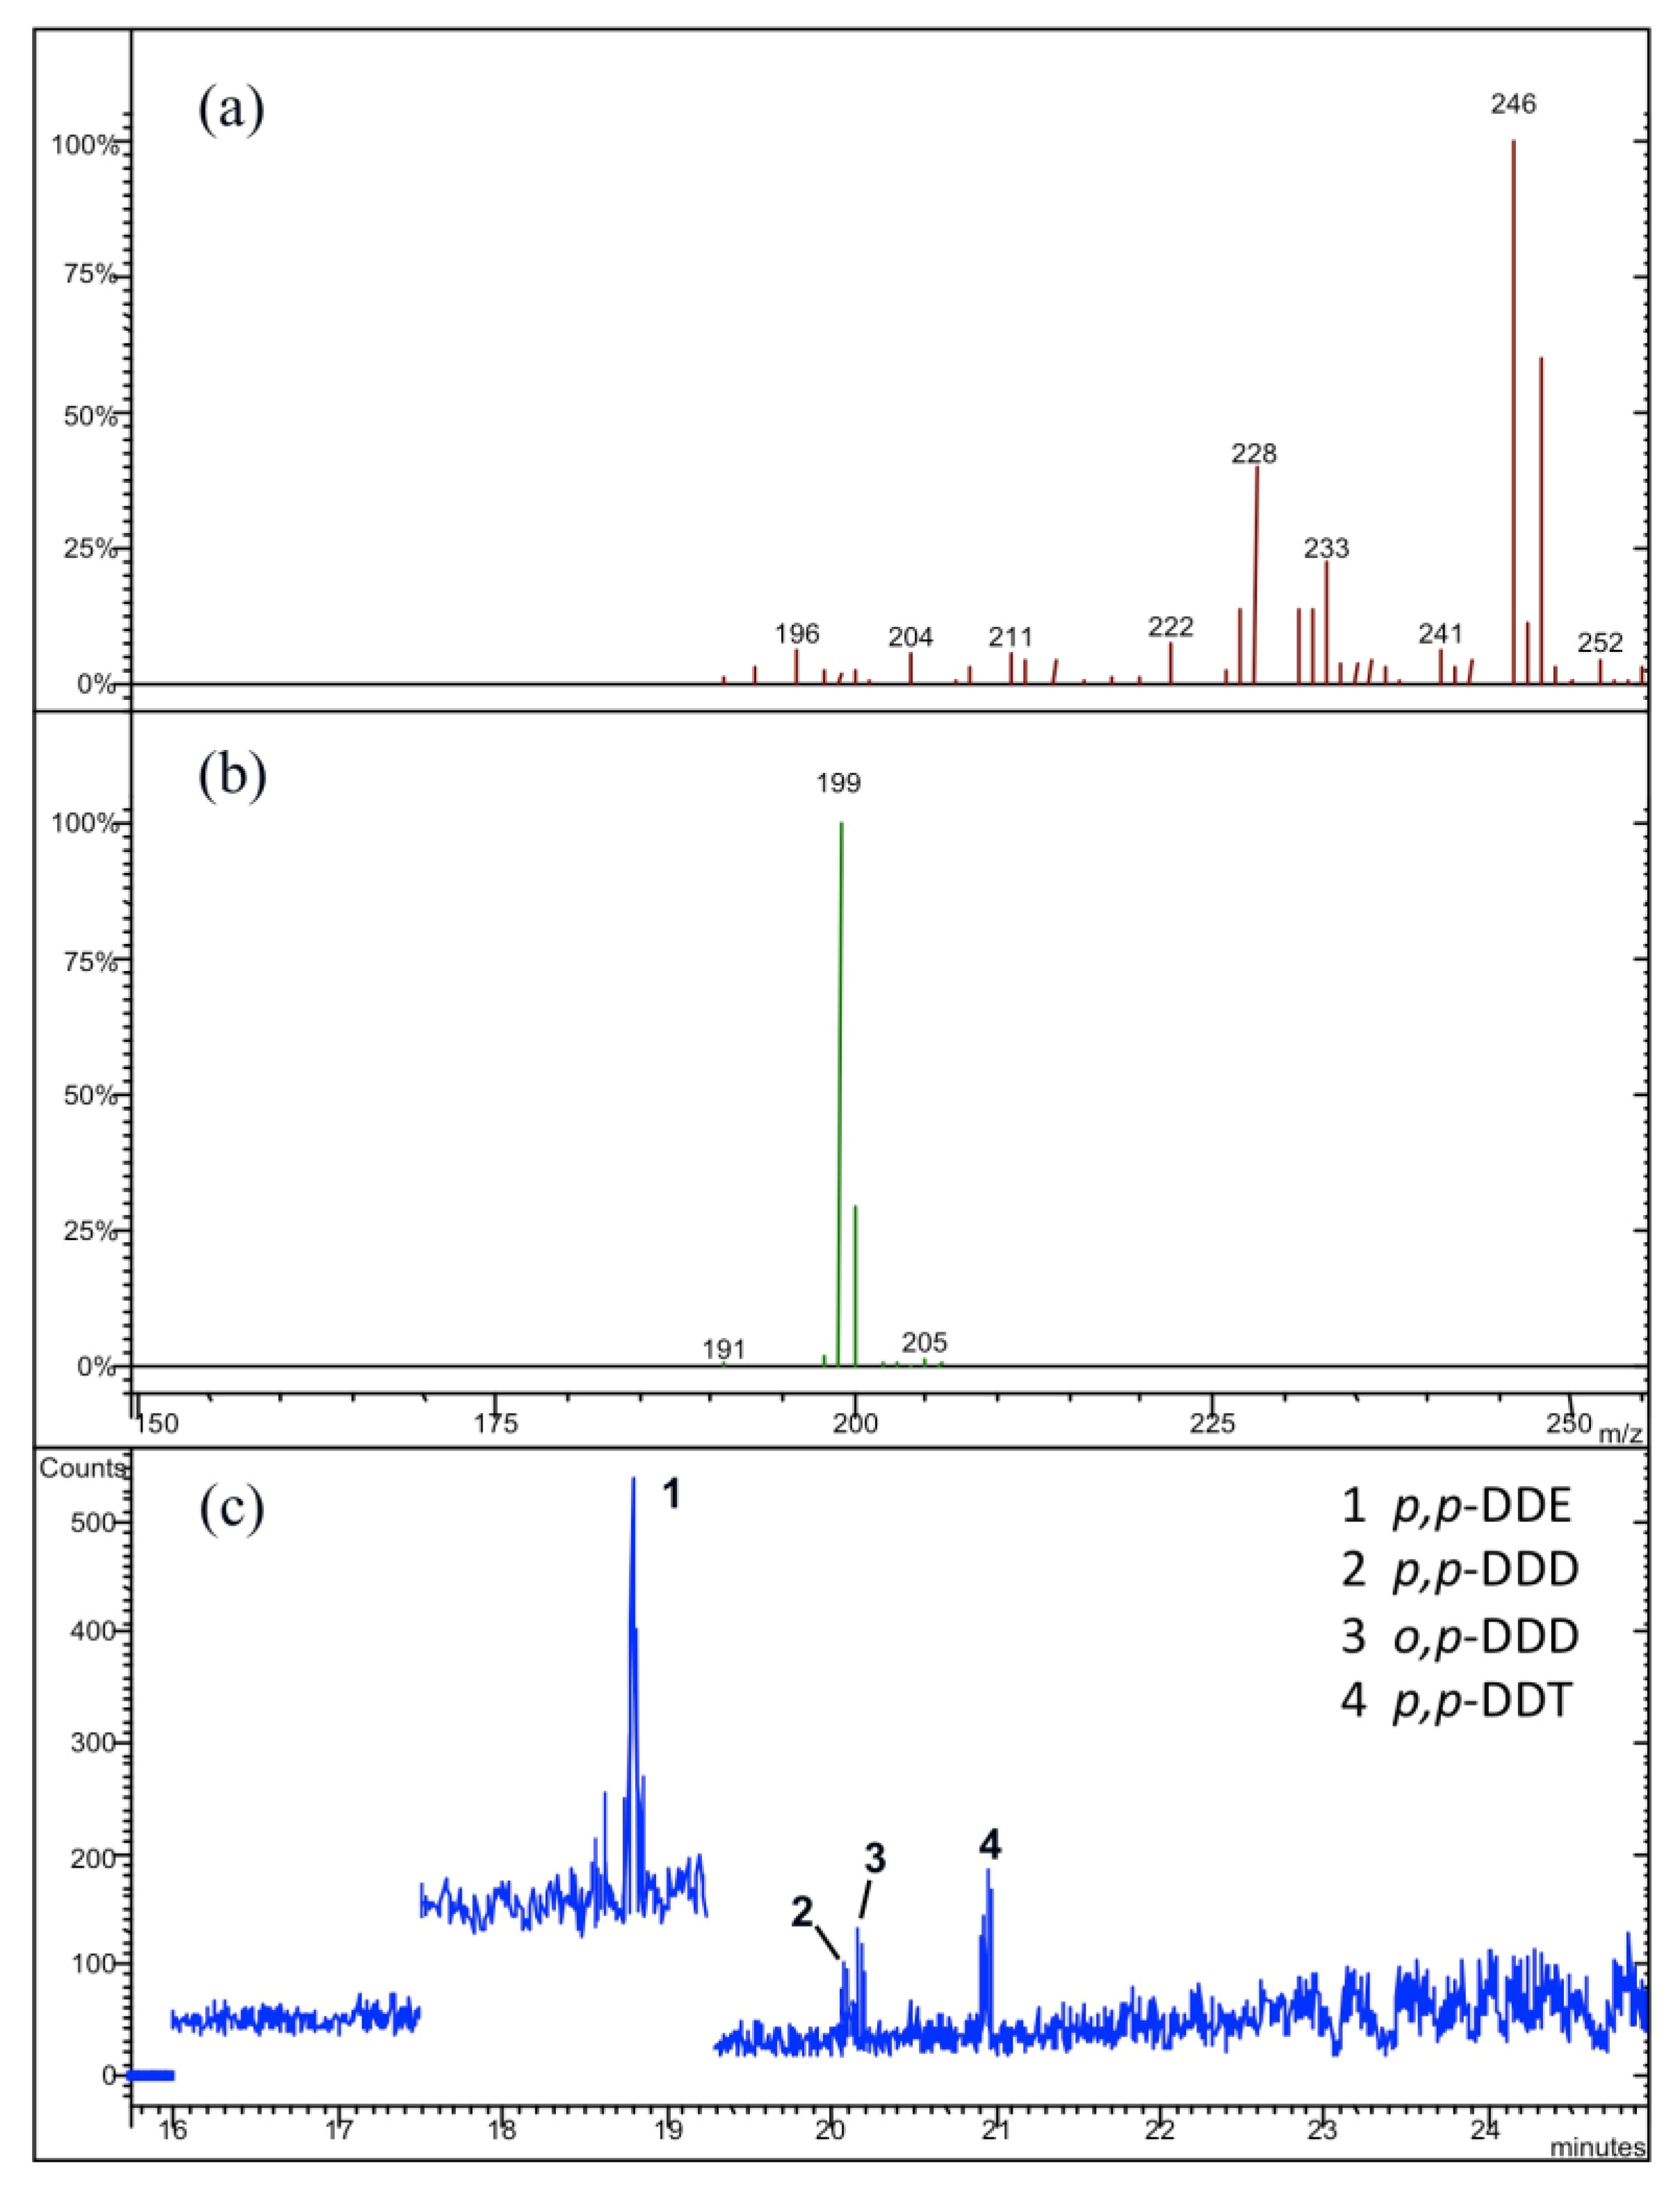
The GC-MS/MS profiles with their related MS/MS spectra are reported in Figure 3, Figure 4 and Figure 5 for the three analyzed samples of “Graviola”, “Mullaca”, and “Balsamina”, respectively. The quantitative analysis of individual profiles revealed the absence of α-, β- and γ-HCH isomers and of the heptachlor molecule in all analyzed samples. On the other hand, it was very clear the presence of both hexachlorobenzene and o,p-DDT isomer only in the sample of “Graviola” (see Figure 3). Looking at Figure 5, it is clear the presence of the o,p-DDD isomer only in the “Balsamina” sample, where no evidence of o,p-DDE was found. In the “Mullaca” sample our chromatographic profile (see Figure 4) highlighted the presence of o,p-DDE, p,p-DDE, p,p-DDD e p,p-DDT compounds.
The qualitative and quantitative results of each single investigated analyte of OCP fractions and their total amounts, for all three plants harvested in the Peruvian Amazonian rainforest, are synoptically shown in Table 2, and expressed as ng/g dry weight (d.w.). The data here reported are the average concentrations as determined by the analysis of six different samples for each analyzed plant according to the procedure described in Section 2.7 and discussed below (see Table 3).
In all analyzed plants the pesticide residues were present at a concentration level below the maximum residue level (MRL), being the highest level of a pesticide residue that is legally tolerated in food, leaf vegetables, herbs and edible flowers following the “EU Pesticides database” by the European Commission [43]: 0.5 mg/kg for the sum of DDD + DDE + DDT; 0.02 mg/kg for HCH α + β + δ isomers sum; 0.1 mg/kg for heptachlor; 0.02 mg/kg for hexachlorobenzene; 1.0 for γ-HCH (lindane). Such concentration values appear to be typical of remote and low polluted geographical areas. Global concentrations of OCPs in various plants were estimated from 0.5 to 100 ng/g d.w. [44]. Furthermore, these values are comparable with literature data recorded in 1991 and related to a pollution phenomenon in Bolivia, biomonitoring OCPs (mean recorded value of about 4 ng/g d.w.) in lichens and mosses harvested at high altitudes on the Cordillera of Andes (3800–5300 m a.s.l.) in the Pacific Ocean mountainside [44]. In the same vegetable species, grown at 200–500 m a.s.l., highest OCP levels (mean recorded value of about 120 ng/g d.w.) were found in Brazilian Amazonas rainforest, at lower latitudes but similar longitude coordinates than our sample collection area. These consistent differences in concentration confirm the direct relationship between OCP levels with altitude and “cold trapping” related phenomenon [5,6].
In particular, the three isomers of hexachlorocyclohexane (HCH), α-, β- and γ-, were not measurable in our analyzed samples. In fact, as it can be seen from Table 2, they show concentration levels below the quantification limits of the used analytical method (0.030 ng/g d.w.), as well as hexachlorobenzene (HCB) and heptachlor (0.007 and 0.020 ng/g d.w., respectively). In the study of global environmental distribution of chlorinated hydrocarbons conducted in 1991 by Calamari et al. [44] on 26 sites in all over the world, mean sum values for two of HCH isomeric forms (α-, γ-) were 1.89 ng/g d.w. in Bolivia, while a relatively higher concentration of 41.54 ng/g d.w. was observed in Amazonas rainforest. The presence in ecosystems of these isomers was due to the employ of technical products or pure γ-HCH (lindane) as an agricultural insecticide. In general, the isomers of HCHs are characterized by a relatively high volatility. The β- form is more persistent to bacterial degradation and less volatile than the α- and γ- isomers. The lindane is characterized by a half-life varying from a few months to more than 3 years [45]. The low detectability of these pollutants in the three vegetable samples analyzed in the present work could be due to their UV degradation after 30 years since 1990, and to the absence of new “fresh” atmospheric dispersion of such organochlorine compounds in the specimen collection area of the Peruvian forest. The detected low concentration levels (see Table 2) are still consistent with those recorded in other studies concerning equatorial areas, boreal and arctic regions [46]. The only exception is due to the “Graviola” plant, where the HCB concentration amounts to 0.041 ng/g d.w. (see Table 2). These results are consistent with recorded data in surrounding Bolivia and Amazonas, where Calamari et al. [44] found concentration levels of 0.18 and <0.10 ng/g d.w., respectively, and the observed correlation in altitude and slight latitudinal differences appear to be due to a global distillation phenomenon.
As is well known, HCB being a byproduct of synthesis, its presence in the environment is due to industrial production of chlorinated chemicals, including pesticides. Our recorded data of Table 2 concerning the distribution of HCB concentrations in the three analyzed plants does not seem to be consistent with a ubiquitous diffusion of this analyte in atmosphere [46,47,48]. In fact, a typical average concentration value due to ubiquitous pollution phenomena has been estimated to be in the range from 50 to 150 pg/m3 [46], all over the world. Furthermore, the persistence and degradation times in the air for HCB are particularly long (about 3 years), and this produces an almost uniform distribution of such a chemical substance in this compartment [49,50].
Volatilization from contaminated soils is the main source of HCB presence in the atmosphere and the residence time is a function of its physicochemical properties, in particular of its relatively high Henry’s law constant. The deposition pathway from the atmosphere to leaf surfaces is limited by its chemical and physical behavior, low water solubility and high vapor pressure. From our data of Table 2, it would appear that HCB contamination in “Graviola” is probably due to a direct and local soil contamination from regional emission rather than long atmospheric transport or global diffusion phenomena, which would instead foresee a widespread contamination on all analyzed plants. This hypothesis would be corroborated by the very low concentrations found (below 0.007 ng/g, being the limit of detection of the used analytical method—see Table 2) for such a pollutant in the other two examined plants. Besides, Calamari et al. have shown that HCB concentrations in plants of tropical areas are negligible as well to global level, whereas they increase moving toward cold regions [44].
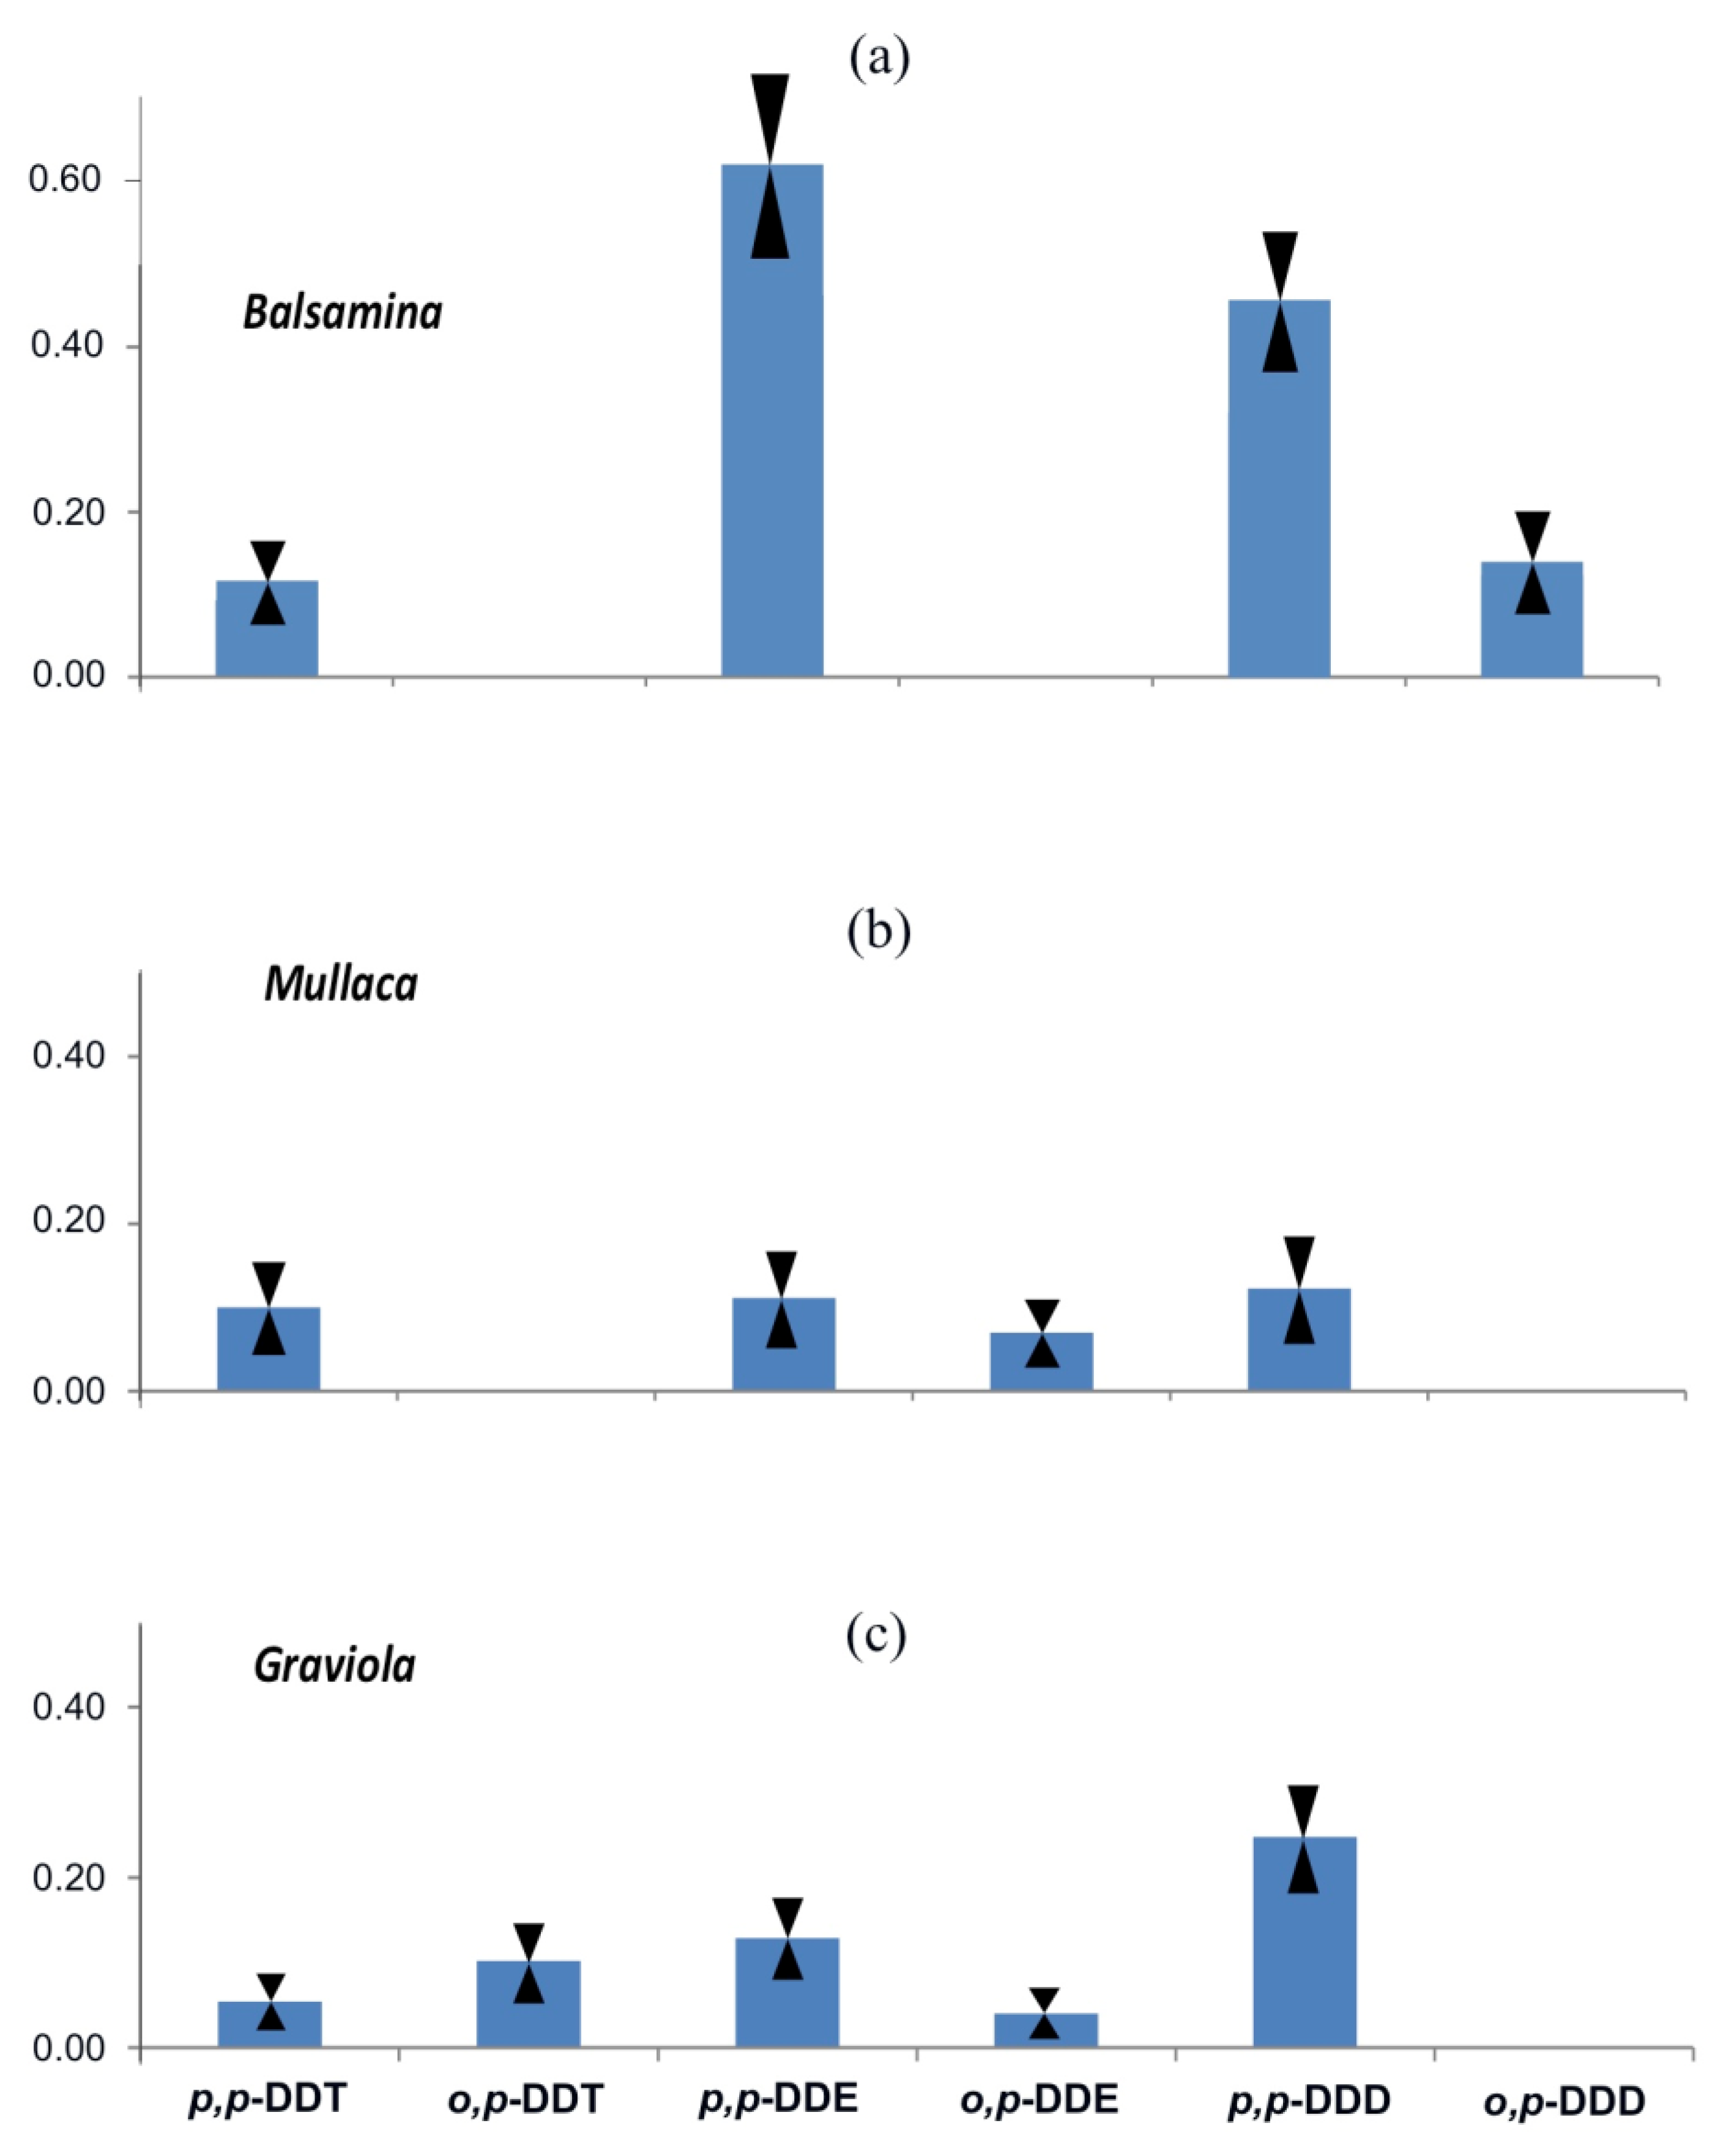
Among the twelve prevalent organochlorine compounds studied in the present work, DDT with its metabolites and PCBs are the chemical species most frequently found at high concentrations in biocoenosis. In contrast to HCB, DDT plant concentrations are highest in tropical and subtropical areas [44]. In the case of our study, the data shown in Table 2 indicate that in all investigated vegetable samples, DDT (dichlorodiphenyltrichloroethane) and its metabolite breakdown products—dichlorodiphenyldichloroethylene (DDE), dichlorodiphenyl dichloroethane (DDD)—were the most abundant OC (organochlorine) pesticides. The pattern of individual concentrations of these compounds in both isomeric forms (o,p- and p,p-) are included in the range from 0.054 to 0.124, 0.040 to 0.615 and 0.109 to 0.426 ng/g, respectively (see Table 2 and Figure 6).
The total concentration of DDTs, being the sum of the parent compound and its metabolites (see Table 2), was higher in “Balsamina” annual herbaceous shrub plant (1.329 ppb) than “Mullaca” and “Graviola” (0.349 and 0.614 ppb, respectively). The recorded differences are not very high but they are significant as demonstrated by the data of Table 3 where, as discussed in Section 2.7, six different samples of each plant were taken in triplicate with three separate chromatographic analyses for each analyzed sample. Applying the statistical Student’s t-test to the data of Table 3 we obtained a significance level of 0.01 for both Balsamima/Graviola and Balsamina/Mullaca recorded differences. This trend confirms what is already known about the direct relationship between pesticide residue levels and lipid content of plants, because the “Balsamina” is characterized by higher values of leaf waxes than the other two analyzed plants [51].
The commercial formulation of DDT pesticide generally includes several closely related compounds. The active and toxic ingredient, p,p-DDT isomer, ranges between 65% and 80% [52]. Usually, the technical grade product contains up to 30% of the o,p-isomer, and up to 4% of p,p-DDD [53]. Therefore in the ecosystems DDT is transformed into the two more stable metabolites, DDE and DDD: the first is formed by abiotic dehydrochlorination (chemical breakdown, photolysis, hydrolysis and OH hydroxyl radical attack), while the second one by biotic reductive dechlorination (microbial conversion). The use of this insecticide implies the dispersion in the environment of at least six isomeric derivatives [54]. Although most countries have adopted the Stockholm Convention, nowadays the recent DDT dispersion in the environment is mainly due to the current use of dicofol (2,2,2-trichloro-1,1-bis (4 chlorophenyl) ethanol), which contain up to 0.1% DDT as a residual trace of its production [55], and to the direct DDT dispersion for control of vectors of malaria in emerging countries. Malaria has been part of Peruvian life since at least the XVI century, and for this reason in 1946 the Rockefeller Foundation introduced DDT in Peru [56]. While this product was banned in the USA in 1992, USA pesticide manufacturers have shipped more than 300 tons of DDT to Peru [57]. In fact, at this time up to 1997 malaria was particularly virulent in the Peruvian rainforest zone [56]. The contamination of the analyzed vegetable samples of “Graviola”, “Mullaca”, and “Balsamina” here reported and discussed could be due to a direct DDT use against malaria in Peruvian areas during the period 1992–1997 (see below).
In the recorded DDT profiles (see Table 2), the predominant concentrations were the p,p-DDE for “Balsamina” (0.615 ng/g d.w.) and the same isomer of DDD for the other two plants: 0.109 and 0.248 ng/g d.w., for “Mullaca” and “Graviola”, respectively, where the lowest concentration recorded for “Mullaca” equalizes the level of p,p-DDE.
In all foliage samples small amount of DDT parent is found in the range 0.054–0.124 and <0.020–0.102 ng/g d.w., for p,p- and o,p-isomers, respectively, compared to the data obtained for corresponding DDD and DDE metabolites (see Table 2). These concentration values are consistent with those found in Bolivian plants (1.20 and 0.40 ng/g d.w.), but they are far lower than those recorded in the Amazon rainforest (52.20 and 6.50 ng/g d.w.) [44]. In has to be noted that, unlike what was found in our analyzed vegetable samples of “Graviola”, “Mullaca” and “Balsamina”, in the two cases already cited (Bolivia and Amazon rainforest [44]) the DDT parent was recorded with a predominant concentration respect to its breakdown metabolites. This would thus indicate that, in our case we are detecting a contamination due to a not recent use of such a pollutant in the regional area where the vegetation has been harvested, with very low recorded contamination levels. Moreover, Cliath and Spencer in 1972 [58] had experimentally demonstrated that the rate of the DDT to degrade into DDE is of about 70% not later than one year. Consequently, DDE was the predominant metabolite in ecosystem compartments according to its higher environmental stability. In general, DDE isomers are readily dispersed through the atmosphere respect the relative DDT parent, whereas the DDD dispersion efficiency is lower than DDT [58]. In our case, the presence of DDE and DDD in different proportions in all three analyzed plants, can be originated from distinct degradation abiotic and biotic processes, respectively, and could be ascribed to a long-range transport or to an indirect contamination coming from neighboring regions [46,47,48]. In fact, as mentioned above, it is well-known that a DDT diffusion happened in the Peruvian rainforest, by the use in the past of such an insecticide in neighbouring countries [56,57]. According to the low DDT/DDE ratio value (<0.5), as shown in Table 4, this suggests an “aged” source of DDT in “Balsamina” herbaceous plant, presumably due to the malaria control procedure during 1992–1997 five years [56], whereas freshness source of DDT in agricultural and forestry uses could be the responsible of the “Graviola” contamination. On the other hand, the “Mullaca” shrub would present for that a ratio index an intermediate situation with respect to the other two analyzed plants.
In addition, the relationship between DDD and DDE provides further information on the DDT degradation processes. It was found that, when the anaerobic process is predominant, the DDD/DDE ratio is greater than 1.0, while in aerobic degradation is DDD/DDE < 1.0 [59]. Our recorded data show that in the “Balsamina” sample the residue degradation is due to a predominant aerobic pathways (DDD/DDE < 1.0), while for the two other vegetable samples the data of Table 4 suggest a predominant anaerobic phenomenon (DDD/DDE > 1.0). To investigate historical degradation of DDT, in Table 4 was also considered the value of the (DDE + DDD)/DDTs ratio. When this ratio value is higher than 0.5 it would be related to a long-term breakdown degradation process, related to “old” pollution sources, otherwise (DDE + DDD)/DDTs < 0.5 indicate a recent pollutants dispersion in the environment [60]. The 0.8 value of such a ratio recorded for “Balsamina” (see Table 4) confirm our previous considerations according to which its DDT contamination is presumably due to the malaria control procedure performed in such areas about twenty years ago. On the other hand, the (DDE + DDD)/DDTs = 0.6 data concerning “Mullaca”, together with the dominant DDD recorded concentration respect to DDTs profile, would be an indication that the contamination of such a plant can be related to a more recent use of DDT or rothane insecticide in the harvesting area [61].
Further information may be obtained from the study of the relationship between o,p-DDT and p,p-DDT isomer concentrations in order to obtain indications concerning the more probable source of pollution. In agreement with the physicochemical properties of these molecules (the vapor pressure of o,p-DDT which is 7.5 times higher than those of the p,p-isomer; the consequently greater volatilization into atmosphere, and the slower biological degradation in a subtropical environment [62]), different fingerprint of o,p-DDT/p,p-DDT ratio values were determined from the technical product and “dicofol-type DDT” [63,64]: in multiple technical products, was found an isomeric ratio o,p-DDT/p,p-DDT ≤ 0.25. Therefore, in environmental samples, when this value is very low (as in the case of “Balsamina” and “Graviola” in Table 4), it is reasonable to assume a predominant contribution of technical DDT in the pollution phenomena responsible of the plants contamination [63]. On the other hand, when this ratio value is >1.0 (as in the case of “Graviola” in Table 4) the plant contamination would be related to a technical Dicofol use [64].
Finally, in all analyzed plants, concentration levels of the seven indicator polychlorinated biphenyls (PCBs) congeners (namely 28, 52, 101, 118, 153 and 180) were below the limit of detection of the used analytical method (0.003–0.013 ng/g d.w.), as reported in Table 5. Such data are typical of unpolluted areas and are consistent with concentration levels of other chlorinated pesticides found in the analyzed plant samples (see Table 2).
PCBs are semi-volatile organic compounds (SOCs), industrial chemicals widely used in the last century as transformer and capacitor insulating material, paints, flame retardants, and sealing materials [65]. Most of the PCBs have been used in the Northern Hemisphere, between 30° and 60° N [66], whereas the Southern Hemisphere, have been affected by very low levels of PCB emissions. Following the prohibition of PCB production (primary emissions) in 1992, re-volatilization (secondary emissions) is the main source of SOCs, in particular PCBs transported in air [66].
Therefore, the absence of these chlorinated compounds in the three Peruvian analyzed plant leaves appears to be in agreement with these findings and with modeled results obtained by Huang et al. [67]. These authors demonstrated that most emitted PCBs are deposited near their source areas by dry and wet deposition mechanisms, specifically referring for heavier PCBs (congeners with 5–6 chlorine atoms) in atmosphere (in warmer regions), whereas the mass fraction of lighter congeners increases at higher latitude (in cold regions) [67].
4. Conclusions
The present study examined the residues of twelve organochlorine pesticides accumulated in three Peruvian plants grown in the Amazon rainforest. The DDTs and their breakdown products are the predominant and quantifiable components in the residue of OCPs. The recorded total concentration levels of OCPs are an indication of a typical pollution with a trace contamination of plants growing in a remote geographical area, although involved in the past in a massive dispersion of pesticides to eradicate malarial endemic disease in neighbouring regions. The HCH isomers and PCB congeners were below the detection limit of the used analytical method, according to the global distillation hypothesis according to which lower concentrations are expected in tropical and subtropical areas. The HCB was present only in “Graviola” plant, probably due to a direct and local contamination by regional emission rather than long atmospheric transport or global diffusion phenomena. Specific indicator ratios have been used to discriminate the historical degradation of DDT. Two possible sources of DDT contamination are discussed: (i) the first one due to the use of DDT against malaria during 1992–1997 years; (ii) the second one due to a probable usage of dicoflos and rothane insecticide in the harvesting area. Finally, residues of DDT breakdown metabolites, DDE and DDD, were consistent with biotic and abiotic degradation pathways.
Further analytical efforts should be very suitable in order to perform a significant comparison between different species of endemic officinal plants of the investigated Amazonian area. Our purpose is to extend the preliminary analytical investigation here presented to a larger number of plants also taking into account for the assessment of intra- and inter-species and for temporal variability.
Acknowledgments
Financial support by the “VIS MEDICATRIX NATURAE s.r.l.”—Marradi (FI, Italy) is gratefully acknowledged by the authors.
Author Contributions
Bartolomeo Sebastiani and Stefano Falcinelli conceived, designed, performed the experiments, analyzed the data, contributed reagents/materials/analysis tools, and wrote the paper.
Conflicts of Interest
The authors declare no conflict of interest. The founding sponsors had no role in the design of the study; in the collection, analyses, or interpretation of data; in the writing of the manuscript, and in the decision to publish the results.
References
- Schwarzenbach, R.P.; Gschwend, P.M.; Imboden, D.M. Environmental Organic Chemistry, 3rd ed.; John Wiley & Sons, Inc.: Hoboken, NJ, USA, 2017; ISBN 978-1-118-76723-8. [Google Scholar]
- LRTAP Convention. Protocol to the 1979 Convention on Long-Range Transboundary Air Pollution on Persistent Organic Pollutants (POPs). 1998. Available online: http://ec.europa.eu/world/agreements/prepareCreateTreatiesWorkspace/treatiesGeneralData.do?step=0&redirect=true&treatyId=6201 (accessed on 26 October 2017).
- Tanabe, S. POPs—Need for target research on high risk stage. Mar. Pollut. Bull. 2004, 48, 609–610. [Google Scholar] [CrossRef] [PubMed]
- Wania, F.; Mackay, D. Tracking the distribution of Persistent Organic Pollutants. Environ. Sci. Technol. 1996, 30, 390A–396A. [Google Scholar] [CrossRef] [PubMed]
- Fernández, P.; Grimalt, J.O. On the Global Distribution of Persistent Organic Pollutants. Chimia 2003, 57, 514–521. [Google Scholar] [CrossRef]
- Daly, G.L.; Wania, F. Organic Contaminants in Mountains. Environ. Sci. Technol. 2005, 39, 385–398. [Google Scholar] [CrossRef] [PubMed]
- AMAP. AMAP Assessment 2002: Persistent Organic Pollutants in the Arctic; Arctic Monitoring and Assessment Programme (AMAP): Oslo, Norway, 2004; ISBN 82-7971-019-1. Available online: https://www.amap.no/documents/doc/amap-assessment-2002-persistent-organic-pollutants-in-the-arctic/96 (accessed on 26 October 2017).
- Vilanova, R.; Fernandez, P.; Martinez, C.; Grimalt, J.O. Organochlorine Pollutants in Remote Mountain Lake Waters. J. Environ. Qual. 2001, 30, 1286–1295. [Google Scholar] [CrossRef] [PubMed]
- Prospero, J.M.; Glaccum, R.A.; Nees, R.T. Atmospheric transport of soil dust from Africa to South America. Nature 1981, 289, 570–572. [Google Scholar] [CrossRef]
- Garrison, V.H.; Majewski, M.S.; Foreman, W.T.; Genualdi, S.A.; Mohammed, A.; Massey Simonich, S.L. Persistent organic contaminants in Saharan dust air masses in West Africa, Cape Verde and the eastern Caribbean. Sci. Total Environ. 2014, 468–469, 530–543. [Google Scholar] [CrossRef] [PubMed]
- McKim, J.M. Physiological and biochemical mechanisms that regulate the accumulation and toxicity of environmental chemicals in fish. In Bioavailability—Physical, Chemical and Biological Interactions; Hamelink, J.L., Landrum, P.F., Bergman, H.L., Benson, W.H., Eds.; CRC Press, Lewis Publishers: Boca Raton, FL, USA, 1994; pp. 179–202. ISBN 9781566700863. [Google Scholar]
- Mackay, D.; Fraser, A. Bioaccumulation of Persistent Organic Chemicals: Mechanisms and Models. Environ. Pollut. 2000, 110, 375–391. [Google Scholar] [CrossRef]
- World Health Organization. Some Non-Heterocyclic Polycyclic Aromatic Hydrocarbons and Some Related Exposures. In Iarc Monographs on the Evaluation of Carcinogenic Risks to Humans; World Health Organization: Geneva, Switzerland, 2010; Volume 92, Available online: http://monographs.iarc.fr/ENG/Monographs/vol92/index.php (accessed on 27 October 2017).
- Lang, V. Polichlorinated biphenyls in the environment. J. Chromatogr. A 1992, 595, 1–43. [Google Scholar] [CrossRef]
- Tanabe, S. PCB problems in the future: Foresight from current knowledge. Environ. Pollut. 1988, 50, 5–28. [Google Scholar] [CrossRef]
- United Nations Environment Programme. UNEP 2009 Annual Report. Available online: http://hdl.handle.net/20.500.11822/7824 (accessed on 24 February 2018).
- World Health Organization. WHO Position on DDT Use in Disease Vector Control under the Stockholm Convention on Persistent Organic Pollutants; World Health Organization: Geneva, Switzerland, 2004; Available online: http://apps.who.int/iris/bitstream/10665/68631/1/WHO_HTM_RBM_2004.53.pdf (accessed on 24 February 2018).
- Bidleman, T.F.; Jantunen, M.L.; Karakus, P.K.; Wong, F. Chiral persistent organic pollutants as tracers of atmospheric sources and fate: Review and prospects for investigating climate change influences. Atmos. Pollut. Res. 2012, 3, 371–382. [Google Scholar] [CrossRef]
- McLachlan, M.S.; Welsch-Pausch, K.; Tolls, J. Field Validation of a Model of the Uptake of Gaseous SOC in Lolium multiflorum (Welsh Ray Grass). J. Environ. Sci. Technol. 1995, 29, 1998–2004. [Google Scholar] [CrossRef] [PubMed]
- Welsch-Pausch, K.; McLachlan, M.S.; Umlauf, G. Determination of the Principal Pathways of Polychlorinated Dibenzo-p-dioxins and Dibenzofurans to Lolium multiflorum (Welsh Ray Grass). Environ. Sci. Technol. 1995, 29, 1090–1098. [Google Scholar] [CrossRef] [PubMed]
- Desalme, D.; Binet, P.; Bernard, N.; Gilbert, D.; Toussaint, M.-L.; Chiapusio, G. Atmospheric phenanthrene transfer and effects on two grassland species and their root symbionts: A microcosm study. Environ. Exp. Bot. 2011, 71, 146–151. [Google Scholar] [CrossRef]
- Huang, D.; Peng, P.; Xu, Y.; Deng, Y.; Deng, H. Distribution and deposition of polycyclic aromatic hydrocarbons in precipitation in Guangzhou, South China. J. Environ. Sci. 2009, 21, 654–660. [Google Scholar] [CrossRef]
- Callén, M.S.; Cruz, M.T.; López, J.M.; Mastral, A.M. PAH in airborne particulate matter. Fuel Process. Technol. 2011, 92, 176–182. [Google Scholar] [CrossRef]
- Dias, A.P.L.; Rinaldi, M.C.S.; Domingos, M. Foliar accumulation of polycyclic aromatic hydrocarbons in native tree species from the Atlantic Forest (SE—Brazil). Sci. Total Environ. 2016, 544, 175–184. [Google Scholar] [CrossRef] [PubMed]
- Najmuddin, S.U.F.S.; Romli, M.F.; Hamid, M.; Alitheen, N.B.; Rahman, N.M.A.N.A. Anti-cancer effect of Annona muricata Linn Leaves Crude Extract (AMCE) on breast cancer cell line. BMC Complement. Altern. Med. 2016, 16, 311. [Google Scholar] [CrossRef] [PubMed]
- Bermejo, A.; Figadere, B.; Zafra-Polo, M.-C.; Barrachina, I.; Estornell, E.; Diego Cortes, D. Acetogenins from Annonaceae: Recent progress in isolation, synthesis and mechanisms of action. Nat. Prod. Rep. 2005, 22, 269–303. [Google Scholar] [CrossRef] [PubMed]
- Feng, P.C.; Haynes, L.J.; Magnus, K.E.; Plimmer, J.R.; Sherrat, H.S.A. Pharmacological screening of some West Indian medicinal plants. J. Pharm. Pharmacol. 1962, 14, 556–612. [Google Scholar] [CrossRef] [PubMed]
- Zeng, P.C.; Feng, E.W.; Oberlies, N.H.; McLaughlin, J.L. Five new Monotetrahydrofuran Ring Acetogenins from the Leaves of Annona muricata. J. Nat. Prod. 1996, 59, 1035–1042. [Google Scholar] [CrossRef] [PubMed]
- Wu, F.E.; Zeng, L.; Gu, Z.-M.; Zhao, G.-X.; Zhang, Y.; Schwedler, J.T.; McLaughlin, J.L.; Sastrodihardjo, S. Muricatocins A and B, Two New Bioactive Monotetrahydrofuran Annonaceous Acetogenins from the Leaves of Annona muricata. J. Nat. Prod. 1995, 58, 902–908. [Google Scholar] [CrossRef] [PubMed]
- Soares, M.B.P.; Brustolim, D.; Santos, L.A.; Bellintani, M.C.; Paiva, F.P.; Ribeiro, Y.M.; Tomassini, T.C.B.; Ribeiro dos Santos, R. Physalins B, F and G, seco-steroids purified from Physalis angulata L., inhibit lymphocyte function and allogeneic transplant rejection. Int. Immunopharmacol. 2006, 6, 408–414. [Google Scholar] [CrossRef] [PubMed]
- Chiang, H.; Jaw, S.M.; Chen, P.M. Inhibitory effects of physalin B and physalin F on various human leukemia cells in vitro. Anticancer Res. 1992, 12, 1155–1162. [Google Scholar] [PubMed]
- Bastos, G.N.T.; Silveira, A.J.A.; Salgado, C.G.; Picanço-Diniz, D.L.W.; do Nascimento, J.L.M. Physalis angulata extract exerts anti-inflammatory effects in rats by inhibiting different pathways. J. Ethnopharmacol. 2008, 118, 246–251. [Google Scholar] [CrossRef] [PubMed]
- Thevissen, K.; François, I.E.; Sijtsma, L.; van Amerongen, A.; Schaaper, W.M.; Meloen, R.; Posthuma-Trumpie, T.; Broekaert, W.F.; Cammue, B.P. Antifungalactivity of synthetic peptides derived from Impatients balsamina antimicrobial peptides Ib-AMP1 and Ib-AMP4. Peptides 2005, 26, 1113–1119. [Google Scholar] [CrossRef] [PubMed]
- Hamelin, G.; Brochu, C.; Moore, S. Application of tandem mass spectrometry with an ion trap detector to the analysis of polychlorinated dibenzo-p-dioxins/polychlorinated dibenzofurans and polychlorinated biphenyls. Organohalogen Compd. 1995, 23, 125–130. [Google Scholar]
- Gruppo di Lavoro per i Residui di Antiparassitari della Commissione Permanente di Coordinamento Interregionale per i Problemi Relativi al Controllo Ufficiale dei Prodotti Alimentary. Metodi multiresiduo per l’analisi di residui antiparassitari in prodotti vegetali. In Rapporti ISTISAN 97/23; Istituto Superiore di Sanità: Roma, Italy, 1997; Available online: http://www.iss.it/binary/publ/cont/1123-3117_1997_23_1.1146226165.pdf (accessed on 24 February 2018).
- De Felip, E.; Miniero, R. Procedimenti analitici adottati per il rilevamento di microcontaminanti in sedimenti lagunari. In Rapporti ISTISAN 99/28; IstitutoSuperiore di Sanità: Roma, Italy, 1999. [Google Scholar]
- Anastassiades, M.; Lehotay, S.J.; Stajnbaher, D.; Schenck, F.J. Fast and easy multiresidue method employing acetonitrile extraction/partitioning and “dispersive solid-phase extraction” for the determination of pesticide residues in produce. J. AOAC Int. 2003, 86, 412–431. [Google Scholar] [PubMed]
- EPA 3620B Method by “United States Environmental Protection Agency”. Available online: http://www.cromlab.es/Articulos/Metodos/EPA/3000/3620B.PDF (accessed on 26 October 2017).
- Falcinelli, S.; Giorgini, M.; Sebastiani, B. Phytosterols and Fatty Acids analytical determination on Lodoicea maldivica fruit. In Applied Engineering Sciences; Deng, W., Ed.; Taylor & Francis Group Publishers: London, UK, 2015; Chapter 19; pp. 99–104. ISBN 978-1-138-02649-0. [Google Scholar]
- Falcinelli, S.; Malfatti, D.; Giorgini, M.; Sebastiani, B. Determination of Volatile Aroma Composition Profiles of Coco de Mèr (Lodoicea maldivica) Fruit: Analytical Study by HS-SPME and GC/MS Techniques. In ICCSA 2017, Part III, Lecture Notes in Computer Science LNCS 10406; Gervasi, O., Murgante, B., Misra, S., Borruso, G., Torre, C.M., Rocha, A.M.A.C., Taniar, D., Apduhan, B.O., Stankova, E., Cuzzocrea, A., Eds.; Springer: Cham, Switzerland, 2017; pp. 44–59. [Google Scholar] [CrossRef]
- Falcinelli, S.; Bettoni, M.; Giorgini, F.; Giorgini, M.; Sebastiani, B. Chemical Characterization of “Coco de Mer” (Lodoicea maldivica) Fruit: Phytosterols and Fatty Acids Composition. In ICCSA 2015, Part II, Lecture Notes in Computer Science LNCS 9156; Gervasi, O., Murgante, B., Misra, S., Gavrilova, M.L., Rocha, A.M.A.C., Torre, C.M., Taniar, D., Apduhan, B.O., Eds.; Springer: Cham, Switzerland, 2015; pp. 308–323. [Google Scholar] [CrossRef]
- Sebastiani, B.; Giorgini, M.; Falcinelli, S. Chemical characterization of Lodoicea maldivica fruit. Chem. Biodivers. 2017, 14, e1700109. [Google Scholar] [CrossRef] [PubMed]
- “EU Pesticides Database” by the European Commission. Available online: http://ec.europa.eu/food/plant/pesticides/eu-pesticides-database/public/ (accessed on 26 October 2017).
- Calamari, D.; Bacci, E.; Focardi, S.; Gaggi, C.; Morosini, M.; Vighi, M. Role of Plant Biomass in the Global Environmental Partitioning of Chlorinated Hydrocarbons. Environ. Sci. Technol. 1991, 25, 1489–1495. [Google Scholar] [CrossRef]
- Traina, M.E.; Urbani, E.; Rescia, M.; Mantovani, A. L’insetticida lindano: Identificazione dei rischi possibili per la riproduzione umana. In Rapporti ISTISAN 01/03; Istituto Superiore di Sanità: Roma, Italy, 2001. [Google Scholar]
- Simonich, S.L.; Hites, R.A. Global distribution of persistent organochlorine compounds. Science 1995, 269, 1851–1854. [Google Scholar] [CrossRef]
- Dachs, J.; Bayona, J.M.; Ittekkot, V.; Albaiges, J. Monsoon-driven vertical fluxes of organic pollutants in the Western Arabian Sea. Environ. Sci. Technol. 1999, 33, 3949–3956. [Google Scholar] [CrossRef]
- Pacyna, J.M.; Oehme, M. Long-range transport of some organic compounds to the Norwegian Arctic. Atmos. Environ. 1988, 22, 243–257. [Google Scholar] [CrossRef]
- Brubaker, W.W., Jr.; Hites, R.A. OH Reaction Kinetics of Gas-Phase α- and γ-Hexachlorocyclohexane and Hexachlorobenzene. Environ. Sci. Technol. 1998, 32, 766–769. [Google Scholar] [CrossRef]
- Cortes, D.R.; Basu, I.; Sweet, C.W.; Brice, K.A.; Hoff, R.M.; Hites, R.A. Temporal trends in gas-phase concentrations of chlorinated pesticides measured at the shores of the Great Lakes. Environ. Sci. Technol. 1998, 32, 1920–1927. [Google Scholar] [CrossRef]
- Miglioranza, K.S.B.; Aizpún de Moreno, J.E.; Moreno, V.J.; Osterrieth, M.L.; Escalante, A.H. Fate of organochlorine pesticides in soils and terrestrial biota of ‘‘Los Padres’’ pond watershed, Argentina. Environ. Poll. 1999, 105, 91–99. [Google Scholar] [CrossRef]
- Tsutsui, K.; Ubuka, T.; Kanda, S.; Oka, Y.; Osugi, T.; Ukena, K.; Tachibana, T.; Sakamoto, T.; Amano, M.; Ando, H.; et al. Handbook of Hormones Comparative Endocrinology for Basic and Clinical Research, 1st ed.; Takei, Y., Ando, H., Tsutsui, K., Eds.; Elsevier: Amsterdam, The Netherlands, 2015; ISBN 978-0-12-801028-0. [Google Scholar]
- UNEP/IOC/IAEA. Sampling of Selected Marine Organisms and Sample Preparation for the Analysis of Chlorinated Hydrocarbons; United Nations Environment Programme: Nairobi, Kenya, 1991. [Google Scholar]
- Hellou, J.; Lebeuf, M.; Rudi, M. Review on DDT and metabolites in birds and mammals of aquatic ecosystems. Environ. Rev. 2013, 21, 53–69. [Google Scholar] [CrossRef]
- Bosch, C.; Grimalt, J.O.; Fernández, P. Enantiomeric fraction and isomeric composition to assess sources of DDT residues in soils. Chemosphere 2015, 138, 40–46. [Google Scholar] [CrossRef] [PubMed]
- Griffing, S.M.; Gamboa, D.; Udhayakumar, V. The history of 20th century malaria control in Peru. Malar. J. 2013, 12, 303. [Google Scholar] [CrossRef] [PubMed]
- Brennan, T. Globalization and Its Terrors: Daily Life in the West, 1st ed.; ROUTLEDGE Psychology Press, Taylor & Francis Group: Abingdon, UK, 2003; ISBN 978-0415285223. [Google Scholar]
- Cliath, M.M.; Spencer, W.F. Dissipation of pesticides from soil by volatilization of degradation products. I. Lindane and DDT. Environ. Sci. Technol. 1972, 6, 910–914. [Google Scholar] [CrossRef]
- Da, C.; Liu, G.; Tang, Q.; Li, J. Distribution, sources, and ecological risks of organochlorine pesticides in surface sediments from the Yellow River Estuary, China. Environ. Sci. Process. Impacts 2013, 15, 2288–2296. [Google Scholar] [CrossRef] [PubMed]
- Doong, R.; Sun, Y.; Liao, P.; Peng, C.; Wu, S. Distribution and fate of organochlorine pesticide residues in sediments from the selected rivers in Taiwan. Chemosphere 2002, 48, 237–246. [Google Scholar] [CrossRef]
- Bekvar, N.; Lotufo, G.R. DDT and Other Organohalogen Pesticides in Aquatic Organisms. University of Nebraska; Lincoln DigitalCommons@University of Nebraska: Lincoln, NE, USA, 2011; Available online: http://digitalcommons.unl.edu/cgi/viewcontent.cgi?article=1247&context=usepapapers (accessed on 27 October 2017).
- Mishra, M.; Kumar, B.; Singh, S.K.; Goel, G.; Gaur, R.; Prakash, D.; Kumar, S.; Sharma, C.S. Hexachlorohexane (HCH) & Dichlorodimethyltrichloroethane (DDT) in soils from Northern Uttar Pradesh, India. Eur. J. Exp. Biol. 2011, 1, 162–168. [Google Scholar]
- Manaca, M.N.; Grimalt, J.O.; Garí, M.; Sacarlal, J.; Sunyer, J.; Gonzalez, R.; Dobaño, C.; Menendez, C.; Alonso, P.L. Assessment of exposure to DDT and metabolites after indoor residual spraying through the analysis of thatch material from rural African dwellings. Environ. Sci. Pollut. Res. Int. 2012, 19, 756–762. [Google Scholar] [CrossRef] [PubMed]
- Qiu, X.; Zhu, T.; Yao, B.; Hu, S. Contribution of Dicofol to the current DDT pollution in China. Environ. Sci. Technol. 2005, 39, 4385–4390. [Google Scholar] [CrossRef] [PubMed]
- Breivik, K.; Sweetman, A.; Pacyna, J.M.; Jones, K.C. Towards a global historical emission inventory for selected PCB congeners—A mass balance approach: 1. Global production and consumption. Sci. Total Environ. 2002, 290, 181–198. [Google Scholar] [CrossRef]
- Schuster, J.K.; Gioia, R.; Sweetman, A.J.; Jones, K.C. Temporal trends and controlling factors for polychlorinated biphenyls in the UK atmosphere (1991–2008). Environ. Sci. Technol. 2010, 44, 8068–8074. [Google Scholar] [CrossRef] [PubMed]
- Huang, P.; Gong, S.L.; Zhao, T.L.; Neary, L.; Barrie, L.A. GEM/POPs: A global 3-D dynamic model for semi-volatile persistent organic pollutants; Part 2: Global transports and budgets of PCBs. Atmos. Chem. Phys. 2007, 7, 4015–4025. [Google Scholar] [CrossRef]
Figure 1.
The GC-MSMS (Gas Chromatographic-Tandem Mass Spectrometry) profile of used standard solutions: (a) The standard mixture of searched eleven organochlorine pesticides (see text); (b) The standard mixture of searched (PCB (polychlorinated biphenyls) 28, 52, 101, 118, 138, 153 and 180—see text).

Figure 2.
Mass spectra (MS) and related tandem mass spectra (MS/MS) for the main detected organochlorine pesticides: (a) MS and (b) MS/MS spectra of hexachlorobenzene; (c) MS and (d) MS/MS spectra of o,p- and p,p-DDE (dichlorodiphenyldichloroethylene); (e) MS and (f) MS/MS spectra of o,p-DDD (dichlorodiphenyldichloroethane), p,p-DDD, o,p-DDT (dichlorodiphenyltrichloroethane) and p,p-DDT.

Figure 3.
(a) The relative MS/MS spectra for the hexachlorobenzene, and (b) for p,p-DDD, o,p-DDT and p,p-DDT; (c) the typical GC-MS/MS profile obtained in our analytical determinations for the “Graviola” samples.
Figure 3.
(a) The relative MS/MS spectra for the hexachlorobenzene, and (b) for p,p-DDD, o,p-DDT and p,p-DDT; (c) the typical GC-MS/MS profile obtained in our analytical determinations for the “Graviola” samples.
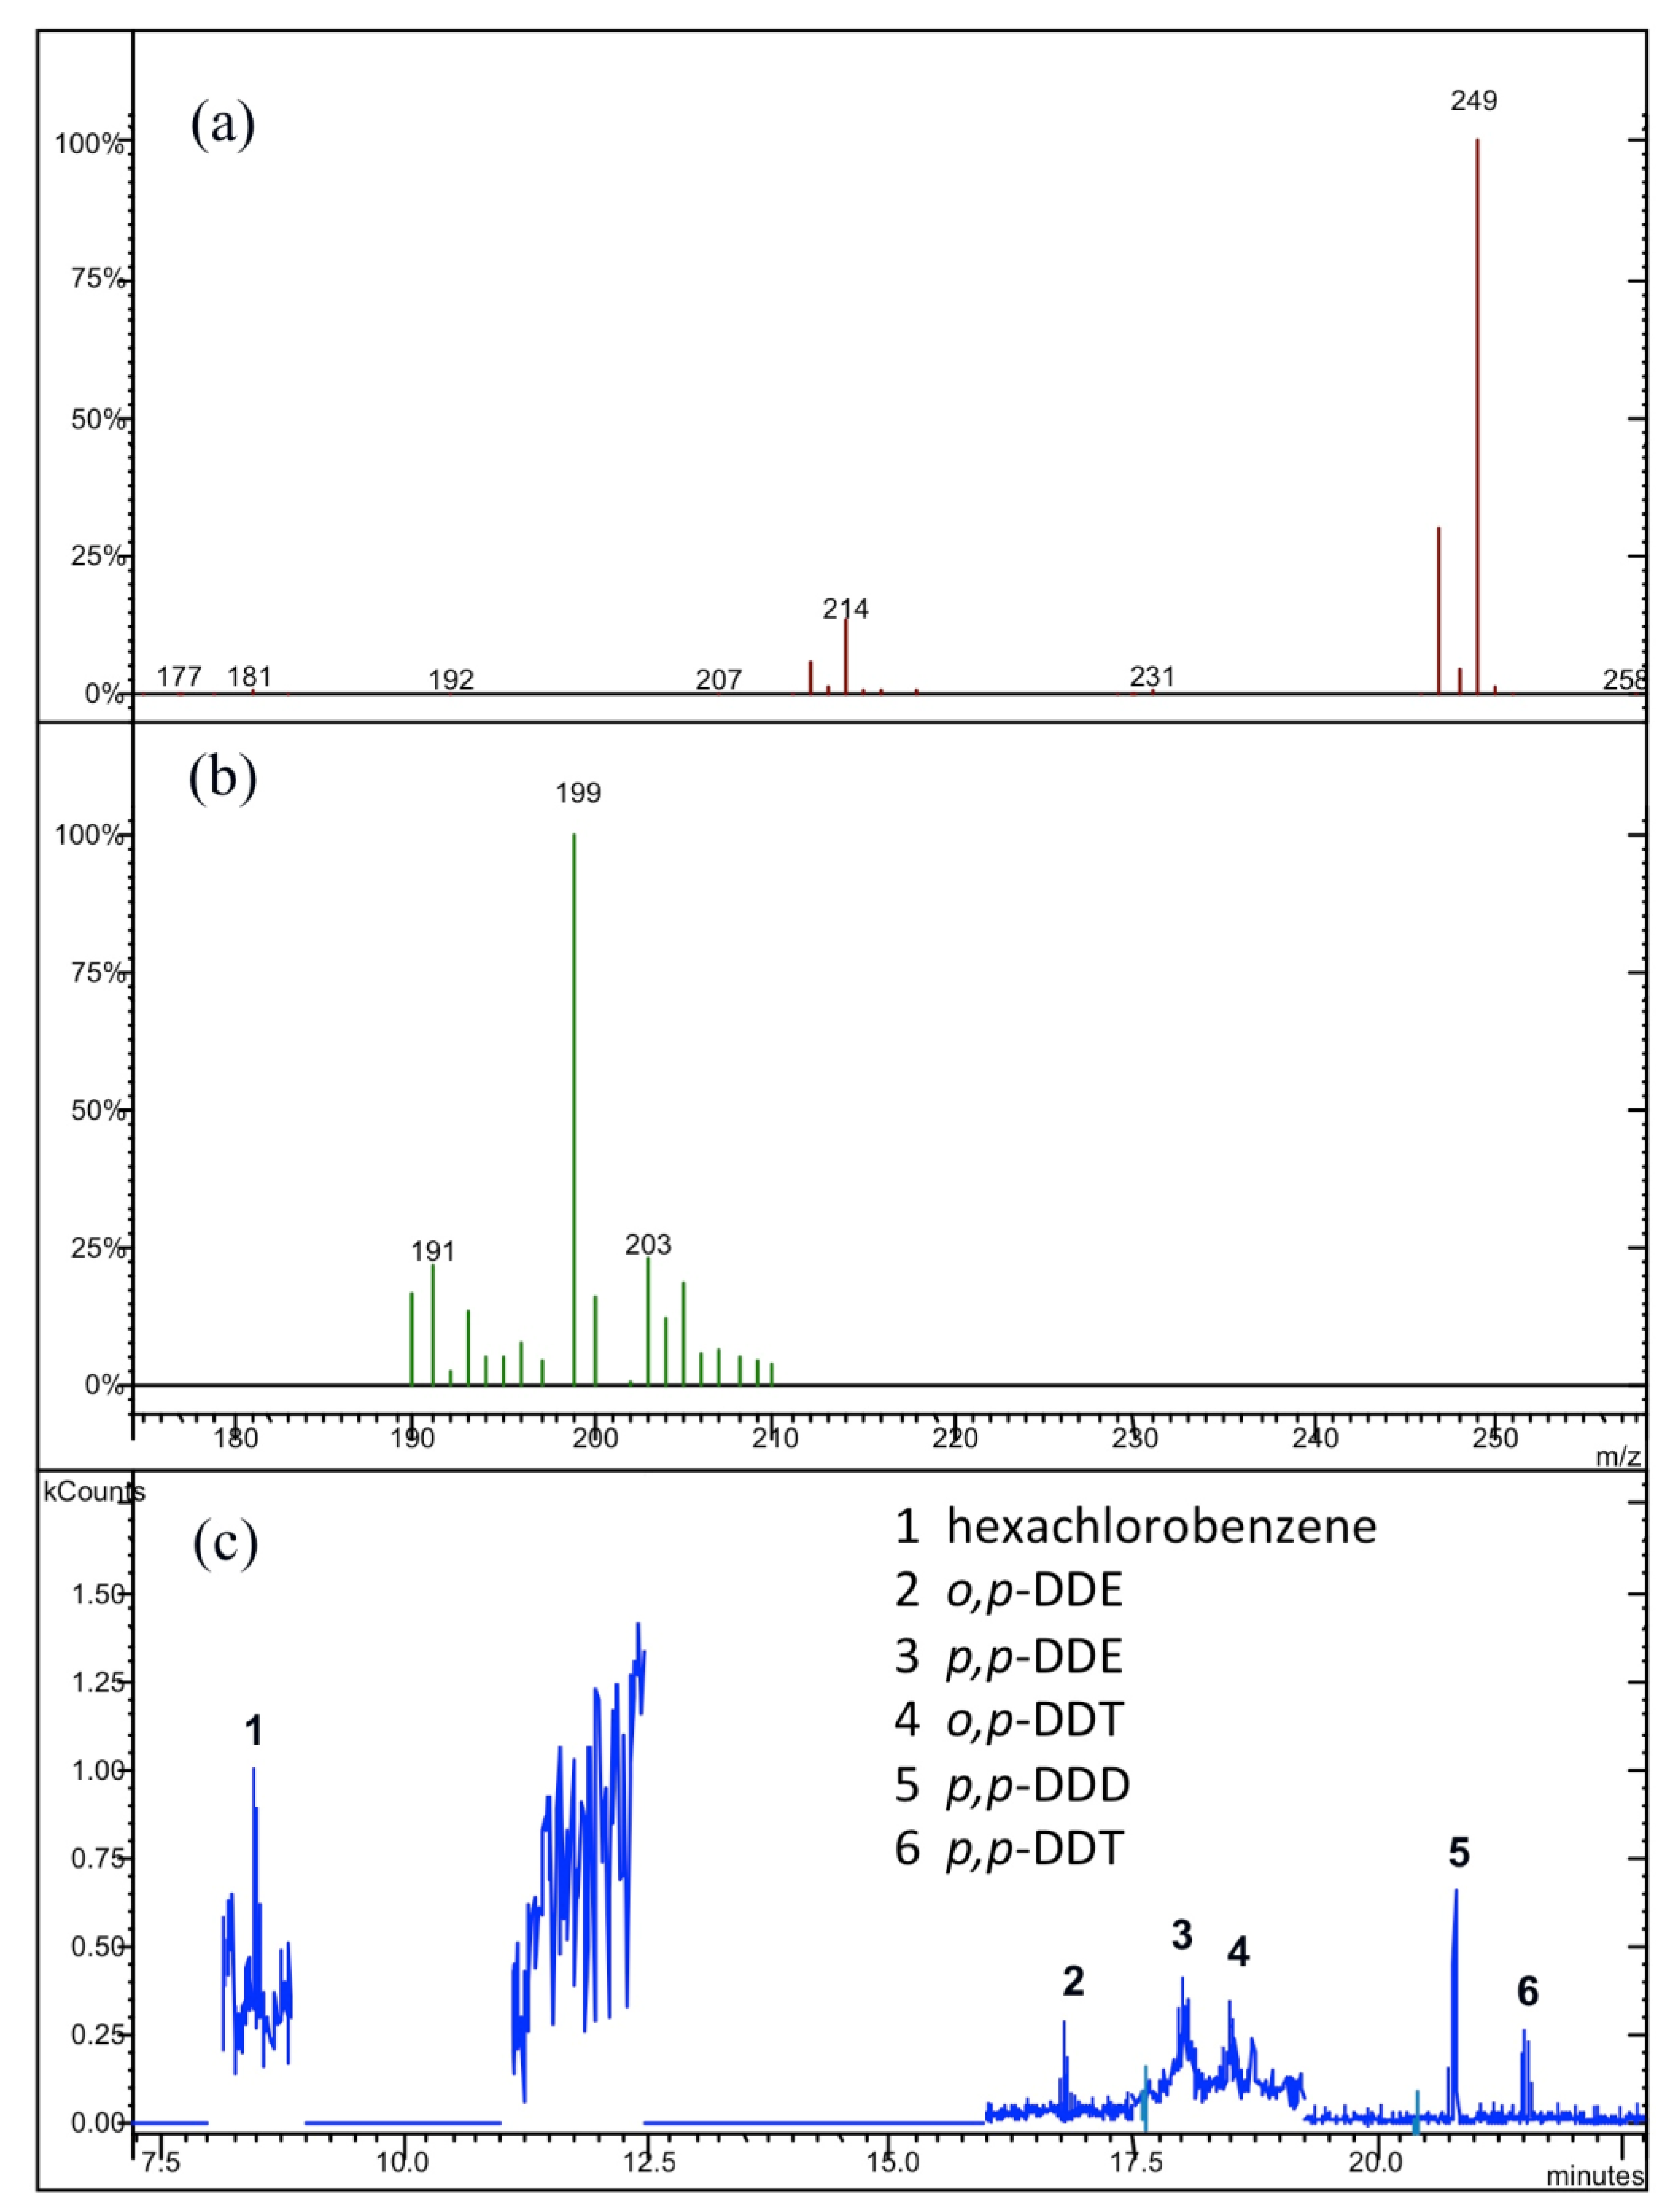
Figure 4.
(a) The relative MS/MS spectra for o,p- DDE and p,p-DDE, and (b) for p,p-DDD, and p,p-DDT; (c) the typical GC-MS/MS profile obtained in our analytical determinations for the “Mullaca” samples.
Figure 4.
(a) The relative MS/MS spectra for o,p- DDE and p,p-DDE, and (b) for p,p-DDD, and p,p-DDT; (c) the typical GC-MS/MS profile obtained in our analytical determinations for the “Mullaca” samples.

Figure 5.
(a) The relative MS/MS spectra for p,p-DDE, and (b) for o,p-DDD, p,p-DDD, and p,p-DDT; (c) the typical GC-MS/MS profile obtained in our analytical determinations for the “Balsamina” samples.
Figure 5.
(a) The relative MS/MS spectra for p,p-DDE, and (b) for o,p-DDD, p,p-DDD, and p,p-DDT; (c) the typical GC-MS/MS profile obtained in our analytical determinations for the “Balsamina” samples.

Figure 6.
The relative concentration (ng/g d.w.) of DDT and its breakdown products distribution profiles in analysed plants: (a) “Balsamina”, (b) “Mullaca”, and (c) “Graviola”. In the Figure are reported (as reversed triangles) the error bars evaluated as standard deviations.
Figure 6.
The relative concentration (ng/g d.w.) of DDT and its breakdown products distribution profiles in analysed plants: (a) “Balsamina”, (b) “Mullaca”, and (c) “Graviola”. In the Figure are reported (as reversed triangles) the error bars evaluated as standard deviations.


Table 1.
The used MS/MS operative conditions for each selected mass of analyzed organochlorine pesticides. Resonant CID 1 (1 V, for all chlorinated groups) was performed on [M-Cl2], [M-CH2Cl2], [M-CCl3], [M-C5H5Cl] and [M+2] parent ions isolated with a 1 u.m.a. window.
Table 1.
The used MS/MS operative conditions for each selected mass of analyzed organochlorine pesticides. Resonant CID 1 (1 V, for all chlorinated groups) was performed on [M-Cl2], [M-CH2Cl2], [M-CCl3], [M-C5H5Cl] and [M+2] parent ions isolated with a 1 u.m.a. window.
| Compound | Parent Ion Mass | Window (u.m.a.) | Waveform | CID 1 (V) |
|---|---|---|---|---|
| α-HCH 2 | 219 [M-Cl2] | 1 | Resonant | 0.75 |
| β-HCH | ||||
| γ-HCH (lindane) | ||||
| hexachlorobenzene | 284 [M+2] | 1 | Resonant | 2.00 |
| heptachlor | 272 [M-C5H5Cl] | 1 | Resonant | 1.00 |
| o,p-DDE 3 | 318 [M+2] | 1 | Resonant | 2.00 |
| p,p-DDE | ||||
| o,p-DDD 4 | 235 [M-CH2Cl2] | 1 | Resonant | 1.50 |
| p,p-DDD | ||||
| o,p-DDT 5 | 235 [M-CCl3] | 1 | Resonant | 1.50 |
| p,p-DDT |
1 CID (V) = Collisional Induced Dissociation voltages; 2 HCH = hexachlorocyclohexane; 3 DDE = dichlorodiphenyldichloroethylene; 4 DDD = dichlorodiphenyldichloroethane; 5 DDT: dichlorodiphenyltrichloroethane.
Table 2.
The individual constituents’ concentration (expressed as ng/g d.w. 1) of the fraction of organochlorine pesticides, and the value of their total sum, searched in analyzed plant samples. The reported values are the average concentrations as determined by the analysis of six different samples for each analyzed plant (see also Table 3).
| Compound | Graviola (ng/g d.w. 1) | Mullaca (ng/g d.w. 1) | Balsamina (ng/g d.w. 1) |
|---|---|---|---|
| α-HCH 2 | <0.030 | <0.030 | <0.030 |
| β-HCH 2 | <0.030 | <0.030 | <0.030 |
| γ-HCH 2 (lindane) | <0.030 | <0.030 | <0.030 |
| hexachlorobenzene | 0.041 | <0.007 | <0.007 |
| heptachlor | <0.020 | <0.020 | <0.020 |
| o,p-DDE | 0.040 | 0.062 | <0.030 |
| p,p-DDE | 0.129 | 0.093 | 0.615 |
| o,p-DDD | <0.020 | <0.020 | 0.164 |
| p,p-DDD | 0.248 | 0.109 | 0.426 |
| o,p-DDT | 0.102 | <0.020 | <0.020 |
| p,p-DDT | 0.054 | 0.085 | 0.124 |
| Total | 0.614 | 0.349 | 1.329 |
1 d.w. = dry weight; 2 HCH = hexachlorocyclohexane.
Table 3.
The total concentration (expressed as ng/g d.w. 1) of DDTs (sum of the parent compound and its metabolites DDT + DDD + DDE) found in the six different analyzed samples of each investigated plant. The reported data are the average concentration values between three different chromatographic analyses for each analyzed sample.
| Sample | Graviola (ng/g d.w. 1) | Mullaca (ng/g d.w. 1) | Balsamina (ng/g d.w. 1) |
|---|---|---|---|
| 1 | 0.449 | 0.651 | 1.373 |
| 2 | 0.920 | 0.220 | 0.970 |
| 3 | 0.584 | 0.291 | 1.525 |
| 4 | 0.532 | 0.502 | 1.458 |
| 5 | 0.446 | 0.108 | 0.787 |
| 6 | 0.753 | 0.322 | 1.861 |
| Averaged value 2 | 0.614 ± 0.171 | 0.349 ± 0.180 | 1.329 ± 0.357 |
1 d.w. = dry weight; 2 The error has been evaluated as standard deviation.
Table 4.
Indicative indices of isomeric forms of o,p-, p,p-DDT parent and its single or sum metabolites (p,p-DDE, p,p-DDD).
Table 4.
Indicative indices of isomeric forms of o,p-, p,p-DDT parent and its single or sum metabolites (p,p-DDE, p,p-DDD).
| Compound Ratio | Graviola | Mullaca | Balsamina |
|---|---|---|---|
| DDT/DDE | 0.9 | 0.5 | 0.2 |
| DDD/DDE | 1.9 | 1.2 | 0.7 |
| (DDE + DDD)/DDTs | 0.7 | 0.6 | 0.8 |
| o,p-DDT/p,p-DDT | 1.9 | 0 | 0 |
Table 5.
The lowest concentration limit (experimentally determined—see text) of the used analytical method (expressed as ng/g d.w.) for each of the congeneric polychlorinated biphenyls (PCB 28, 52, 101, 118, 138, 153 and 180), searched in analyzed plant samples.
Table 5.
The lowest concentration limit (experimentally determined—see text) of the used analytical method (expressed as ng/g d.w.) for each of the congeneric polychlorinated biphenyls (PCB 28, 52, 101, 118, 138, 153 and 180), searched in analyzed plant samples.
| Compound | Graviola (ng/g d.w.) | Mullaca (ng/g d.w.) | Balsamina (ng/g d.w.) |
|---|---|---|---|
| TCB 28 | <0.004 | <0.004 | <0.004 |
| TeCB 52 | <0.003 | <0.003 | <0.003 |
| PeCB 101-118 | <0.006 | <0.006 | <0.006 |
| HxCB 138-153 | <0.013 | <0.013 | <0.013 |
| HpCB 180 | <0.011 | <0.011 | <0.011 |
TCB = trichlorobiphenyl; TeCB = tetrachlorobiphenyl; PeCB = pentachlorobiphenyl; HxCB = hexachlorobiphenyl; HpCB = heptachlorobiphenyl; d.w. = dry weight.
© 2018 by the authors. Licensee MDPI, Basel, Switzerland. This article is an open access article distributed under the terms and conditions of the Creative Commons Attribution (CC BY) license (http://creativecommons.org/licenses/by/4.0/).
Share and Cite
MDPI and ACS Style
Sebastiani, B.; Falcinelli, S. Contamination of Plants from Amazonia by Environmental Pollution. Environments 2018, 5, 33. https://0-doi-org.brum.beds.ac.uk/10.3390/environments5030033
AMA Style
Sebastiani B, Falcinelli S. Contamination of Plants from Amazonia by Environmental Pollution. Environments. 2018; 5(3):33. https://0-doi-org.brum.beds.ac.uk/10.3390/environments5030033
Chicago/Turabian StyleSebastiani, Bartolomeo, and Stefano Falcinelli. 2018. "Contamination of Plants from Amazonia by Environmental Pollution" Environments 5, no. 3: 33. https://0-doi-org.brum.beds.ac.uk/10.3390/environments5030033
Note that from the first issue of 2016, this journal uses article numbers instead of page numbers. See further details here.