A Method to Estimate Students’ Exposure to Road Traffic Noise Events
†


1
Department of Industrial Engineering, University of Florence, 50125 Florence, Italy
2
Formerly CNR-Institute of Acoustics and Sensors O.M. Corbino, 00133 Rome, Italy
3
Regional Agency for the Environmental Protection of Tuscany, 50144 Florence, Italy
*
Author to whom correspondence should be addressed.
†
This paper is a revised and extended version of that presented at the 22th congress on Sound and Vibration held in London.
Environments 2018, 5(3), 39; https://0-doi-org.brum.beds.ac.uk/10.3390/environments5030039
Submission received: 24 January 2018
/
Revised: 27 February 2018
/
Accepted: 1 March 2018
/
Published: 5 March 2018
(This article belongs to the Special Issue Sound Environments)
Abstract
:The correlation between exposure to traffic noise and students’ performance and annoyance has been investigated in literature mainly considering the relationship between indoor equivalent A-weighted sound pressure level (LAeq) and students’ cognitive impairment. Annoyance is frequently related to the effect of short-duration noise events characterized by high sound pressure levels, such as those due to aircraft fly-over and pass-by of buses, heavy trucks, motorcycles, or street sweepers. These noise events are often described, over specific measurement periods, in terms of maximum A-weighted sound pressure level, LAmax, or statistical levels, such as LA1 or LA10. This aspect is not considered in the noise maps drawn in accordance with the European Environmental Noise Directive, as they provide the LAeq only, determined over day, evening, and night periods. In this paper, students’ exposure to road traffic noise is analyzed by means of regression equations obtained by the authors between LAeq and A-weighted maximum and statistical levels due to road traffic noise. The traffic noise of 28 urban streets was monitored during the opening period of Italian schools. A method is described to estimate students’ exposure to noise from data made available on noise maps by the municipalities of metropolitan areas. The application of this method to the case study of Florence shows that almost 60% of students from municipal primary and lower secondary schools could be exposed to the maximum sound pressure level (SPL) inside the classroom greater than 55 dB(A) every hour, probably exceeding the typical background noise in classrooms by more than 10 dB.
1. Introduction
Since the 1970s, many researchers have analyzed how chronic noise exposure affects the cognitive processes [1,2,3,4,5,6,7,8,9,10,11,12]. Researchers found that the disturbance caused by occasional noisy events such as overflying aircraft, pass-by trains, heavy trucks, motorcycles, street sweepers, or sirens may affect adults and children disproportionately compared to their contribution to the overall noise environment [10,11]. For this reason, it is important to analyze the presence of this type of noise event, especially related to road traffic, which is usually the more common noise source near schools [13].
In the World Health Organization’s 2011 report (chapter 3, “Environmental noise and cognitive impairment in children”), noise-related cognitive impairment is defined as the “reduction in cognitive ability in school-age children that occurs while the noise exposure persists and will persist for some time after the cessation of the noise exposure” [14]. The evaluation of the noise effects on cognition can be projected onto a dose–effect curve, where the main noise descriptors, such as LAeq (or Ldn), maximum (LAmax) or statistical levels (LA1 or LA10) are related to each other. Lercher et al. [15] studied the reaction to noise in a group of primary school children selected from a large, representative sample of children living in the lower Inn Valley of Tyrol, Austria. The noise sources were rail and road traffic and one-half of the sample lived in quiet neighborhoods (LA1 = 57 dB(A) and Ldn = 46 dB(A)), while the remaining half lived in high noise areas (LA1 = 74 dB(A) and Ldn = 62 dB(A)). The most important conclusion was that even relatively modest-level exposures to noise may have detrimental effects on the cognitive systems of young children. Thus, the sound events characterized by short-duration high levels, such as the exposure to medium or high LAeq levels in at-school and out-of-school environments, may be important.
Other studies showed that the reaction of students to environmental noise varies as a function of their age [11]. Hygge et al. [16,17] found that the strongest effects of noise for recall and recognition of the text were for children aged 13–14 years. In particular, about 10% of the children had a cognitive reduction with LAeq level equal to 42.5 dB(A), and further, language-based abilities, such as reading, understanding, and recalling, were the most vulnerable of the noise-sensitive cognitive functions.
In another study, carried out on a sample of 142 primary schools in central London, Dockrell and Shield [11,18] studied the correlations between outdoor LAeq, LAmax, LA90 levels and the score obtained by children in aptitude tests. They found that the children’s levels of annoyance were related to the maximum noise levels recorded outside the schools. Moreover, there was a hierarchy of sounds that was found to be annoying, since trains, motorbikes, trucks and sirens were rated as the most annoying, while trees were rated as the least annoying. They also found that younger primary school children are more affected by ambient and background levels of external noise, while the performance of older primary school children is more closely related to maximum noise levels. This suggests that the performance of older children (11 years old) is affected by the noise of individual events such as sirens, buses, street sweepers, lorries, or motorbikes passing the schools. Outdoor noise levels are related to indoor noise through facade sound insulation and indoor reverberation time, as described by the standard ISO 12354-3 [19]. In many countries, the acoustic performances of school facades are monitored very strictly to guarantee a comfortable acoustic indoor environment. An overview of the limit values for acoustic performances of school facades in some European and South American countries is given in [20].
In Italy, acoustic requirements for school facades are very strict and are described by the national decrees of December 1997 [21] and January 2017 [22] and by the national standard UNI 11367 [23,24]. Previous studies of the authors [25,26] have shown that facade acoustic performances of typical Italian schools are significantly lower than the limit values set by Italian laws. When considering the outdoor traffic noise in terms of equivalent level, the intrusion of noise from outside does not appear to be a critical issue, since indoor levels due to traffic noise are usually below the limit values.
This assumption is confirmed by the analysis carried out in this paper, where the equivalent indoor sound pressure level (SPL) of a school’s sample has been analyzed; the results show that this level does not exceed the limit values stated by the Italian legislation.
On the other hand, maximum sound levels due to short-duration outdoor noise events that are usually not limited by national legislations may interfere with the teacher’s speech, especially at lower frequencies. Thus, it does not seem appropriate to fix the limit values only in terms of the indoor or outdoor equivalent SPL as in the case of many national or WHO [27] regulations. Therefore, the aim of this study is to focus the attention on short-duration noise events and to define a method to analyze, on a statistical basis, their maximum SPLs that could largely exceed the equivalent SPL. Anyway, it is difficult to give specific indications for the amplitude of these events, since the maximum SPL due to a vehicle pass-by depends not only on its distance from the facade, but also on its speed, the way of driving, the type of road surface, and other parameters. Some studies and guidelines [28,29,30] propose to assess the noise impact of new roads, evaluating the percentage of measuring intervals, each lasting 15 min or 1 h, for which it is LAFmax(interval) − LAeq(interval) > 15 dB in the night period. Another study [31] shows that maximum levels due to vehicle pass-by (LAFmax) have a very broadened frequency distribution for each vehicle class (passenger cars, non-articulated trucks, articulated trucks, motorcycles). In particular, the standard deviation has its minimum value for cars passing at 80 km/h (sd 3.5 dB) and the maximum value for articulated trucks travelling at 100 km/h (sd 9.0 dB), with a significant overlapping of the distributions of each vehicle class.
In this paper, we propose a method to correlate maximum and statistical A-weighted sound pressure levels to the equivalent levels used in urban noise maps with the aim of analyzing, on a statistical basis, the exposure of school children to short-duration traffic noise levels in urban areas. The results of this analysis are applied to the case study of the primary and lower secondary schools of the municipality of Florence, where the percentage of students exposed to various ranges of statistical and maximum indoor levels is analyzed. These results are a contribution for further studies concerning the relationship between outdoor traffic noise levels and students’ cognitive impairment.
2. Material and Methods
Statistical analysis of students’ exposure to urban traffic noise is based on the study of the following relevant items:
- selection of the appropriate noise indicators to describe the effect of the short-duration noise events (LAmax and LA1);
- analysis of the correlation between these indicators and the equivalent levels Lden and Ld used in the Environmental Noise Directive (END) maps [32], available for each town with more than 100,000 inhabitants (2nd phase of END implementation);
- analysis of the methodology used to calculate the noise levels in the END maps (with or without inclusion of sound reflection by the facades) and hypothesis for the calculation of noise levels at facades not directly exposed to traffic (internal courts, secondary roads, etc., for which facade level values are not shown on the maps);
- methodology to estimate the indoor sound levels in classrooms;
- methodology to determine the number of students involved for each school.
In this paper, the first two items are treated with a rigorous method while the calculation of the students’ exposure to short-duration noise events is referred to in the case study of the town of Florence, where it is possible to refer to field measurements and to specific hypothesis for the noise levels and the facade sound insulation of each school.
2.1. Selection of Acoustic Indicators Used to Describe Short-Duration Noise Events
Many statistic acoustic parameters can be used to describe the effect of a short-duration noise event, but for the purposes of this study, only the A-weighted maximum sound pressure level, LAmax, and the statistical level, LA1, have been considered. Indeed, these two parameters are of interest for the analysis of acoustic annoyance in schools and also in other types of environment. For instance, LAmax was used in some studies to analyze the effect on children’s performances at school. Shield and Dockrell [9] found that LAmax showed the highest correlation with school performances (measured as standardized assessment test scores) of children aged 7 and 11 years. However, as LAmax represents the SPL of a single noise event that occurs once during the measurement interval, it could be inappropriate to correlate this descriptor with students’ performance and annoyance.
The statistical level LA1 is the SPL exceeded for 1% of the measurement time. With reference to time intervals of 1 hour, LA1 is the SPL exceeded for a total duration of 36 s, and, therefore, it may be more properly associated with the acoustic annoyance than LAmax.
The values of both LAmax and LA1 depend on the time interval of the measurement. Indeed, LAmax usually increases as the time interval of the measurement is larger, while the statistical level LA1 is less dependent on this interval.
Thus, the correlation between these two descriptors and the equivalent level also depends on the time interval of the measurement.
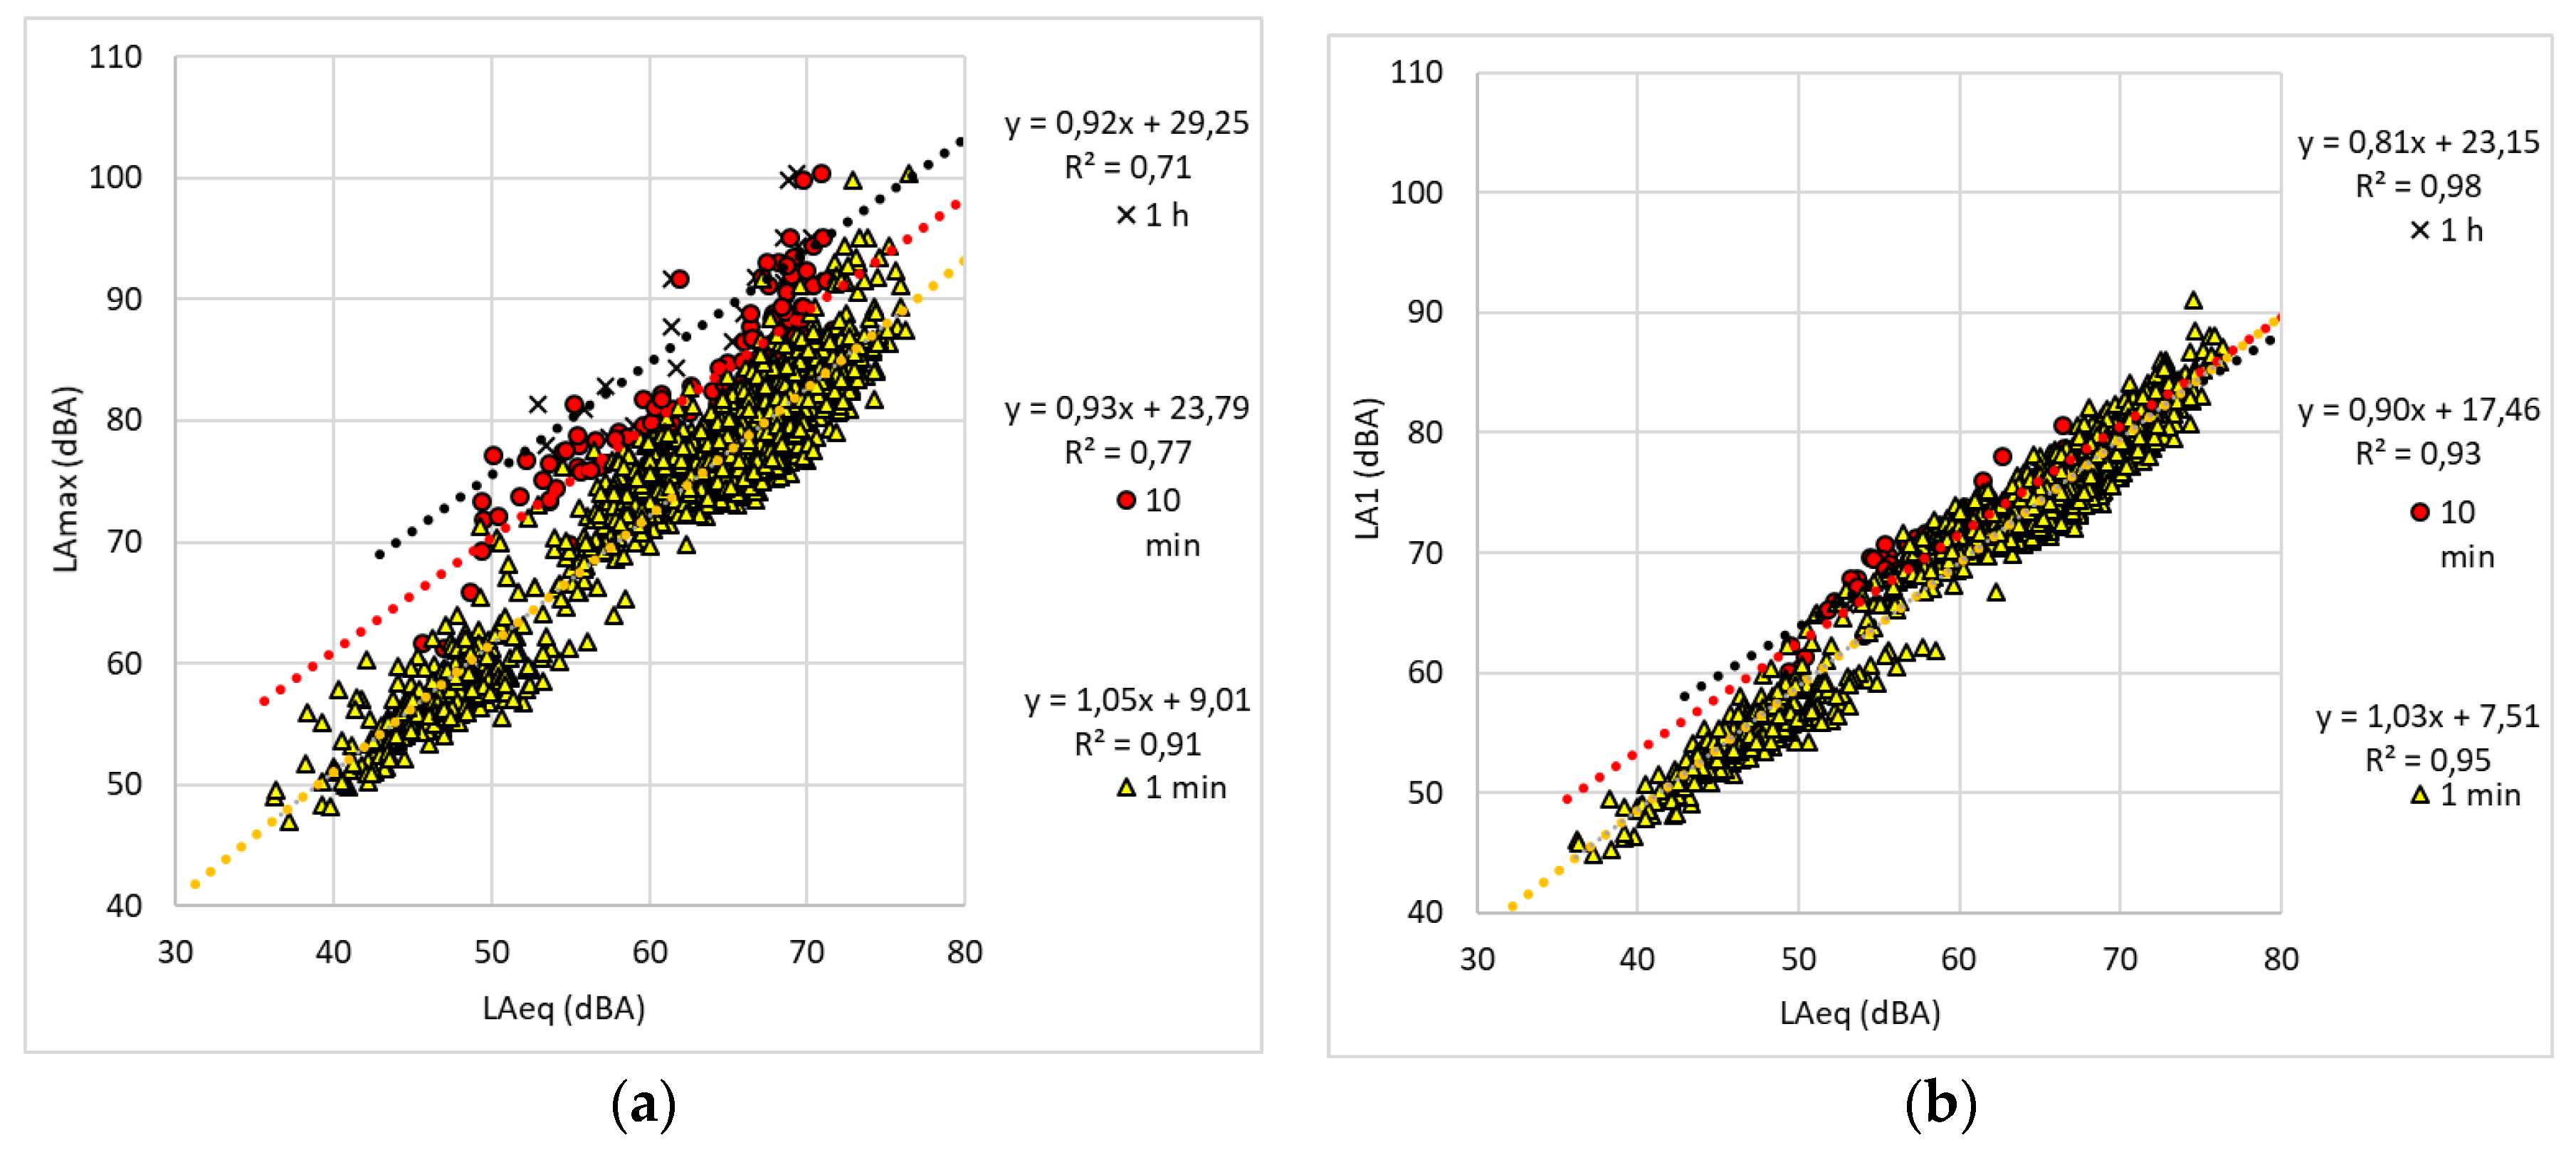
Figure 1 shows, as an example, the linear regression between LAmax (a) and LA1 (b) and LAeq measured in a single street at different time intervals (1 h, 10 min and 1 min). LA1 is slightly influenced by the time interval duration, especially for LAeq values above 60 dB(A), while LAmax is strongly influenced by the time interval length and shows greater values when the time interval is longest (1 h).
In the present study, noise levels have been analyzed with reference to time intervals of 1 h for the following reasons:
- this time interval is the basic unit of lesson length;
- the typical sampling duration of road traffic noise measurements is 1 h;
- in Italy, the attention environmental noise values are expressed as LAeq levels, referring to the time of 1 h [33];
- the highest value of correlation R2 between LA1 and LAeq is for this time interval (Figure 1b).
2.2. Noise Level at School Facades: Correlation between Lden, Day-Time Laeqd Level and School-Time Laeq,8–17h Level
In this study, the correlation between A-weighted maximum, statistical, and equivalent levels is based on the experimental data taken in 28 urban roads continuously monitored in four Italian cities.
The dataset includes roads in various urban contexts and with different traffic flows, both leading to a range of day-time (6–20 h) equivalent level LAeq from about 60 to 75 dB(A).
For each street, measurements were carried out at fixed distances from the carriageway and at the height of about 4–6 m from the pavement, in order to minimize the effect of specific local noise such as chatter, closures of car doors, and other noises. The duration of each measurement was at least 24 h, excluding weekends and holidays.
For each street, the linear regressions between hourly values of LAmax, LA1, and LAeq have been analyzed with reference to the day-time period as defined in Italy, from 6 to 20 h [34], in accordance with the European Environmental Noise Directive [32].
According to the European Environmental Noise Directive [32], for agglomerations with a population greater than 100,000 inhabitants, Member States have to draw noise maps of day-evening-night equivalent levels Lden for road traffic noise. Thus, in order to use this large amount of data, it would be helpful to establish a relationship between Lden and the hourly equivalent level, LAeqh, used in this study.
The dataset of hourly equivalent level, LAeqh, taken in this study, is formed of 768 values. To obtain a statistically more robust relationship, another larger dataset was referred to, formed of 26,808 hourly LAeqh values (1117 time series of 24 h each) collected by continuous monitoring of urban road traffic noise in 38 Italian towns of different sizes.
When the opening hours of the school are unknown, the day-time equivalent level LAeqd,6–20h can be considered.
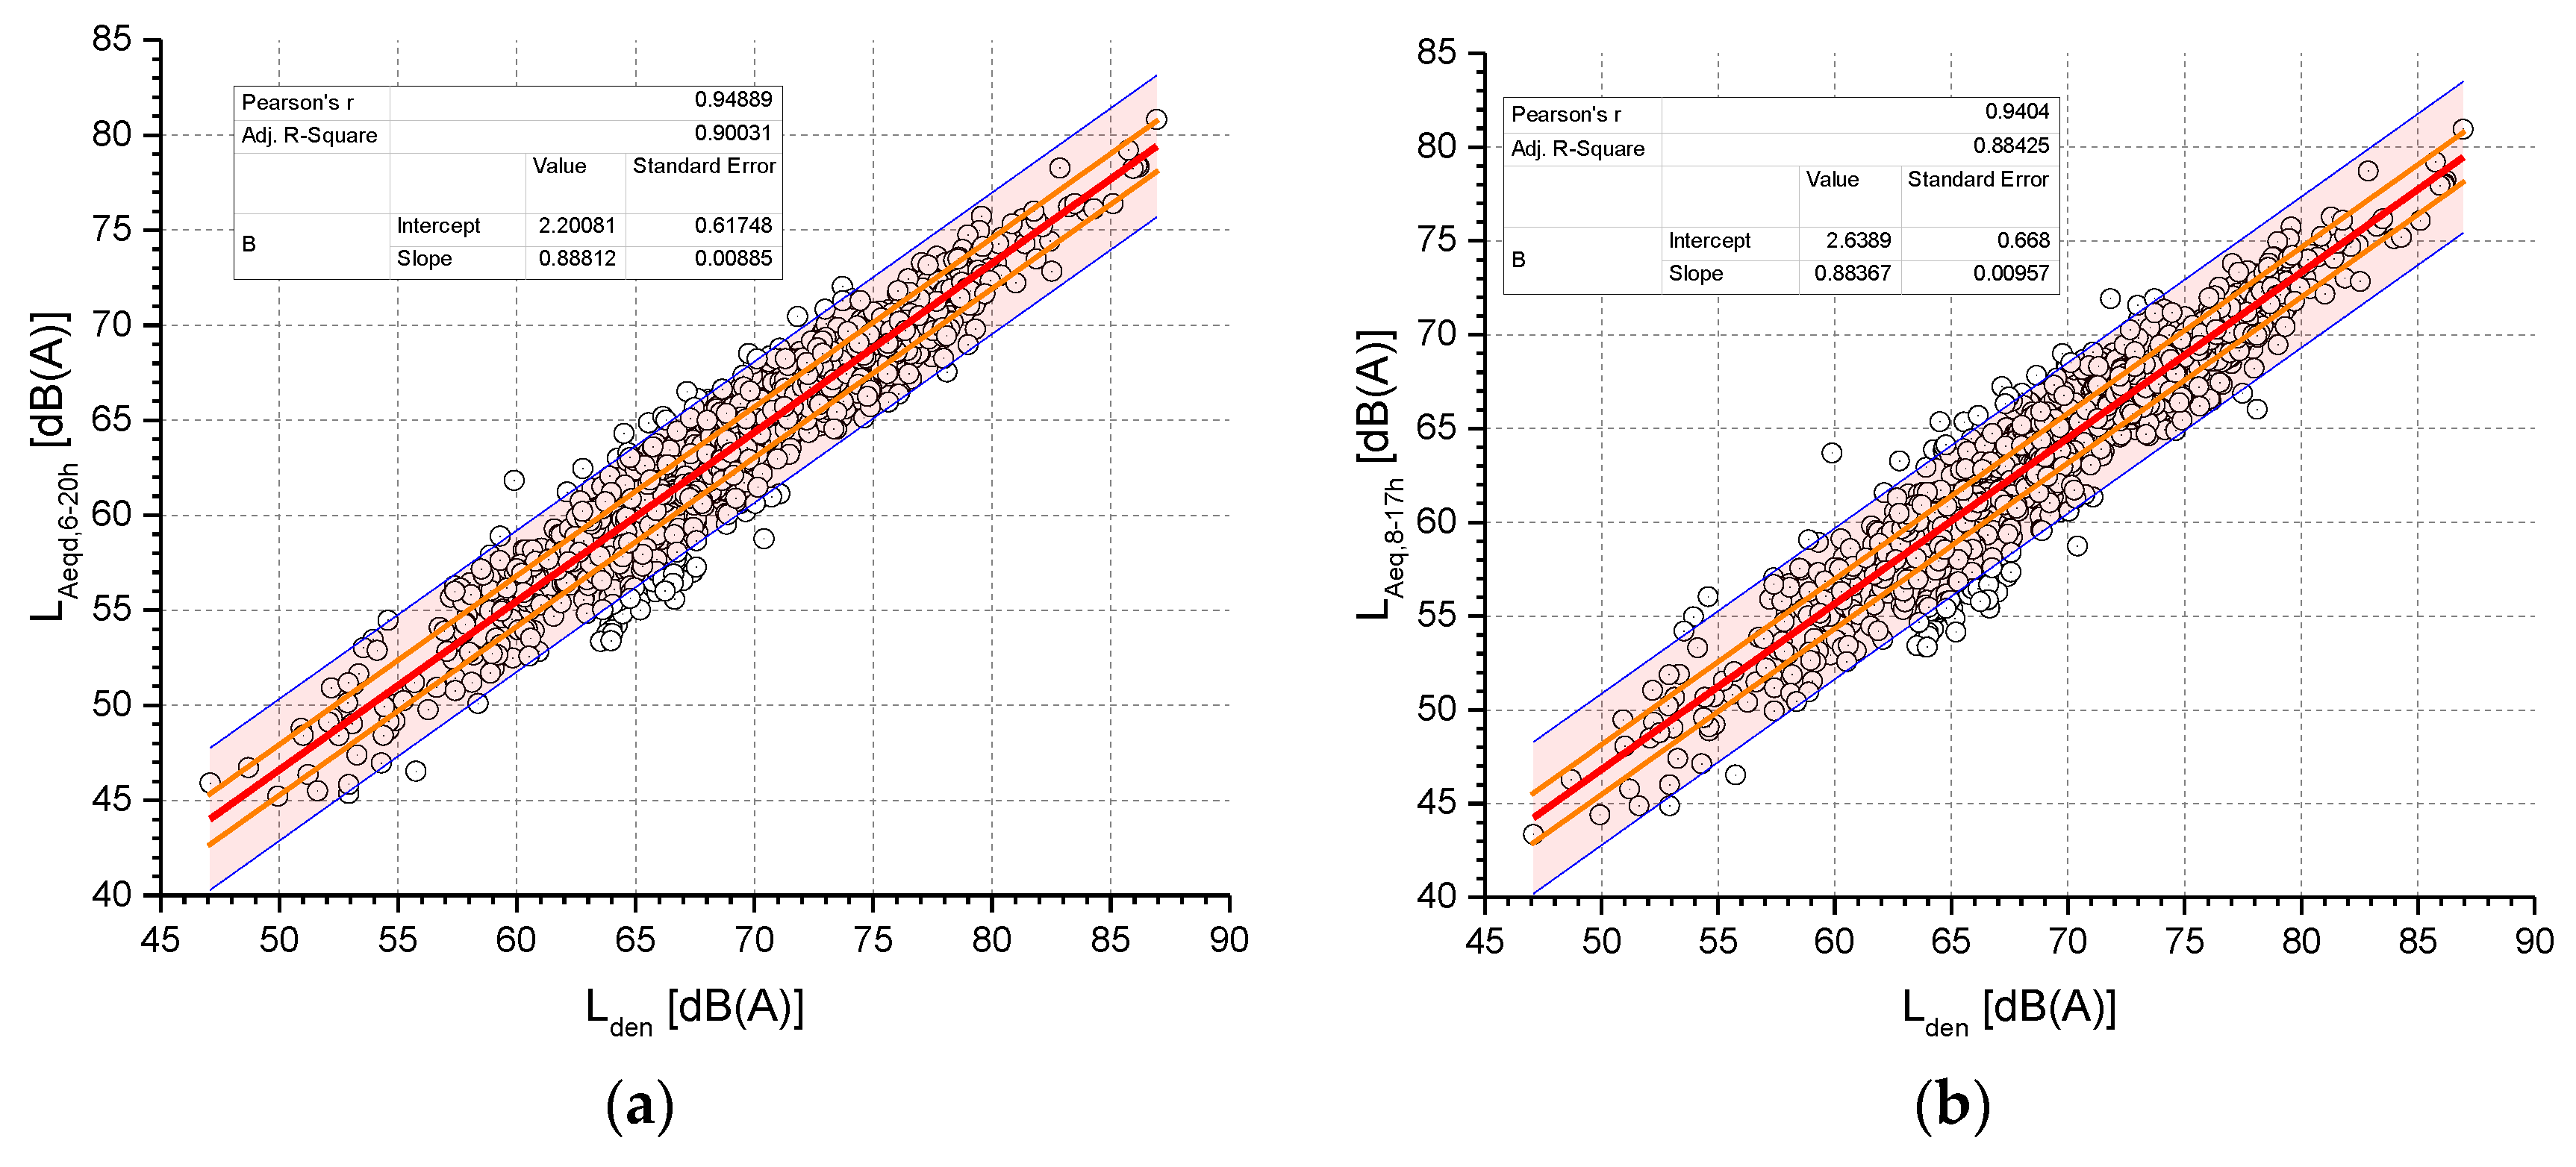
The linear regression on the 1117 pair values of Lden and LAeqd,6–20h provides Equation (1) which gives an estimate of LAeqd from Lden with a standard deviation of the error of ±1.89 dB and a coefficient of determination R2 = 0.900 as shown in Figure 2a, where the prediction bands at the 95% confidence level are also plotted (blue lines). The median value of the error is −0.1 dB and for 55.8% of the observations in the dataset, the error is within the range ±1.5 dB (orange lines in Figure 2a).
Considering that the opening hours of the schools in Italy are usually from 8 to 17 h, Equation (2) provides the estimate of the LAeq,8–17h equivalent level from Lden with a standard deviation of the error of ±2.05 dB and a coefficient of determination R2 = 0.884, as shown in Figure 2b, where the prediction bands at the 95% confidence level are also plotted (blue lines). The median value of the error is −0.1 dB and for 53.8% of the observations in the dataset, the error is within the range ±1.5 dB (orange lines in Figure 2b).
In the above two equations, Lden is determined for the incident sound; that is, the reflection from the back facade is excluded.
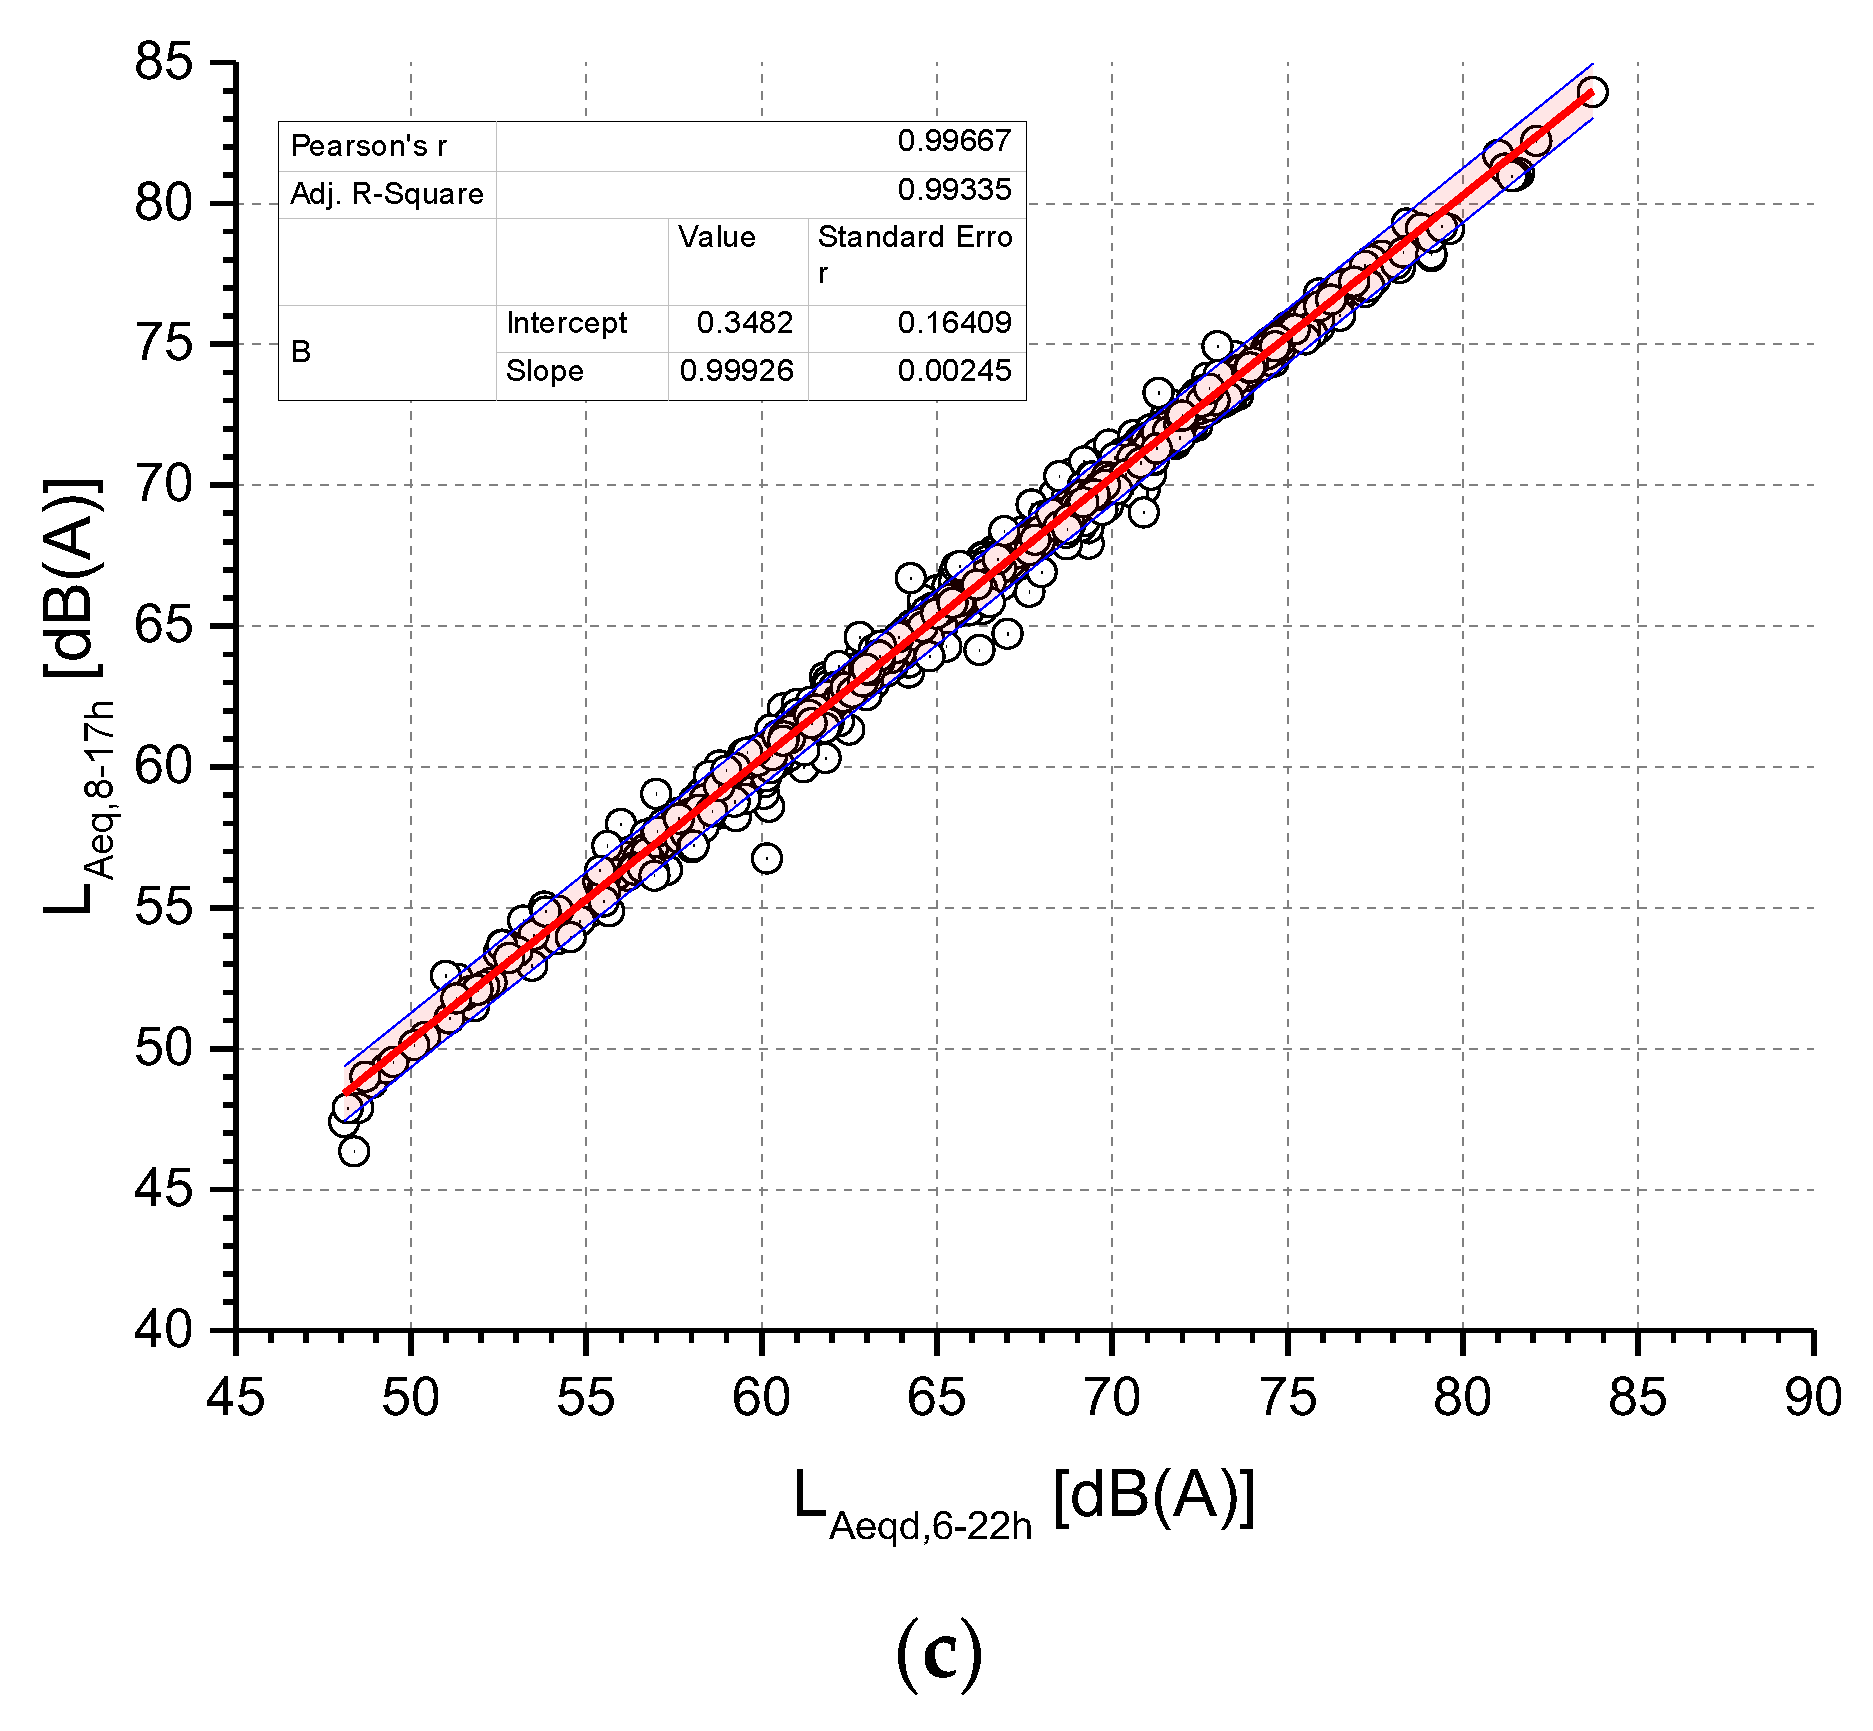
According to Italian legislation, the day-time equivalent level Laeqd, available in some noise maps refers to the period 6–22 h and includes the sound reflection from the back facade. Thus, an additional equation has been determined by linear fitting in order to provide the estimate of the LAeq,8–17h equivalent level from LAeqd,6–22h. The results are plotted in Figure 2c and the equation is as follows:
providing an estimate of LAeq,8–17h with a standard deviation of the error of ±0.5 dB and a coefficient of determination R2 = 0.993 as shown in Figure 2c, where the prediction bands at the 95% confidence level are also plotted (blue lines). The median value of the error is 0.0 dB and for 98.5% of the observations in the dataset, the error is within the range ±1.5 dB.
Comparing the three equations, it is evident that Equation (3) provides more accurate results than the other two equations.
2.3. Environmental Noise Directive Maps
The equivalent A-weighted sound pressure level of road traffic noise on the most exposed building facade can be derived from European noise maps for agglomerations, using Equation (1), Equation (2) or Equation (3).
The European indicator Lden is calculated at 4 m above the ground without including the reflection of the building facade, so as to consider only incident noise in agreement with the END. Therefore, the effective facade sound level, i.e., including the reflection, can be obtained by adding 3 dB to the values calculated with Equation (1) or Equation (2); this is the sound level that must be used with the standardized facade level difference to estimate the indoor sound level (see Section 2.4).
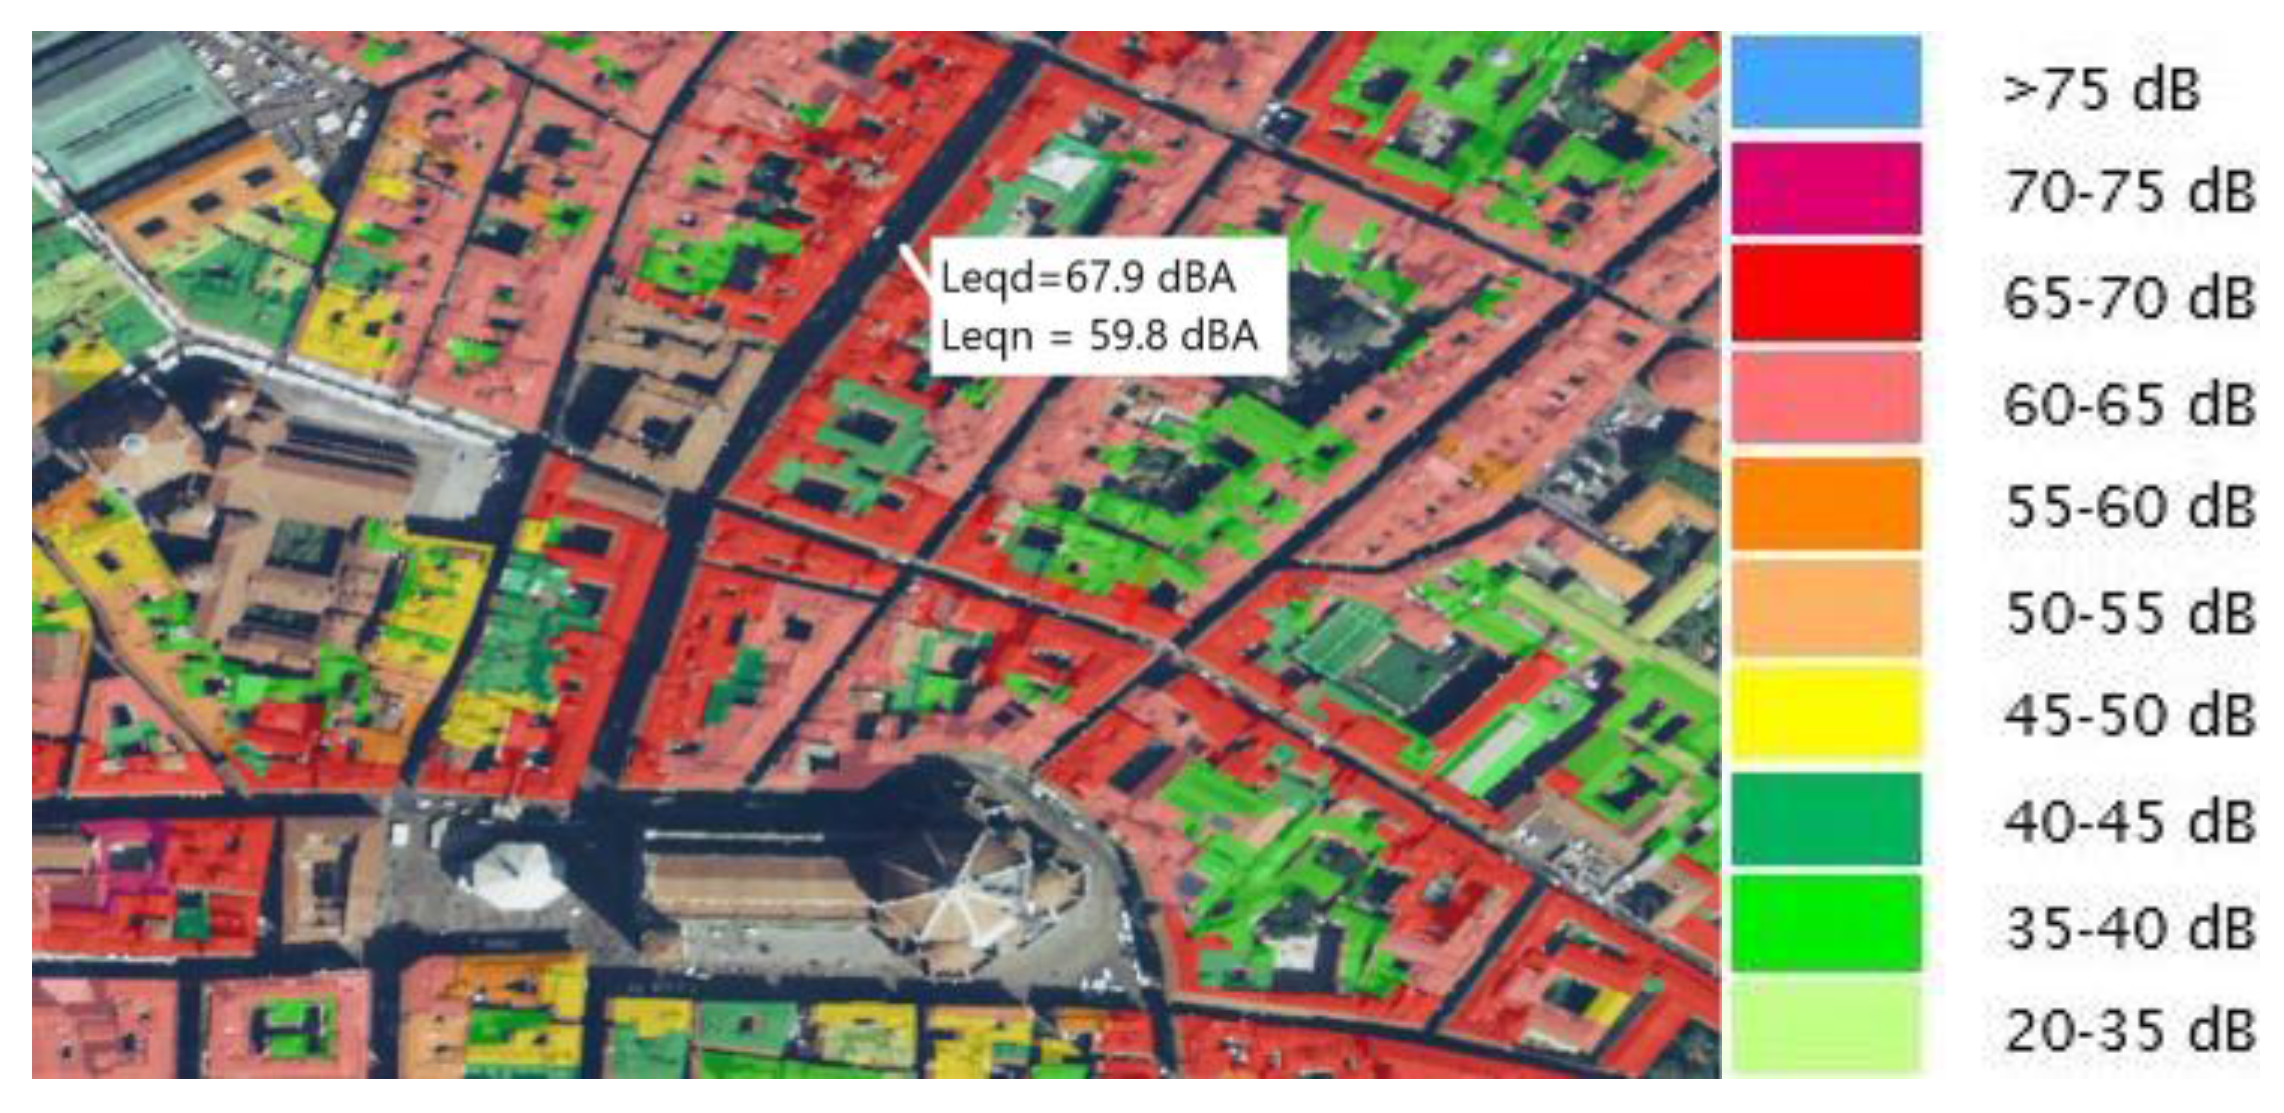
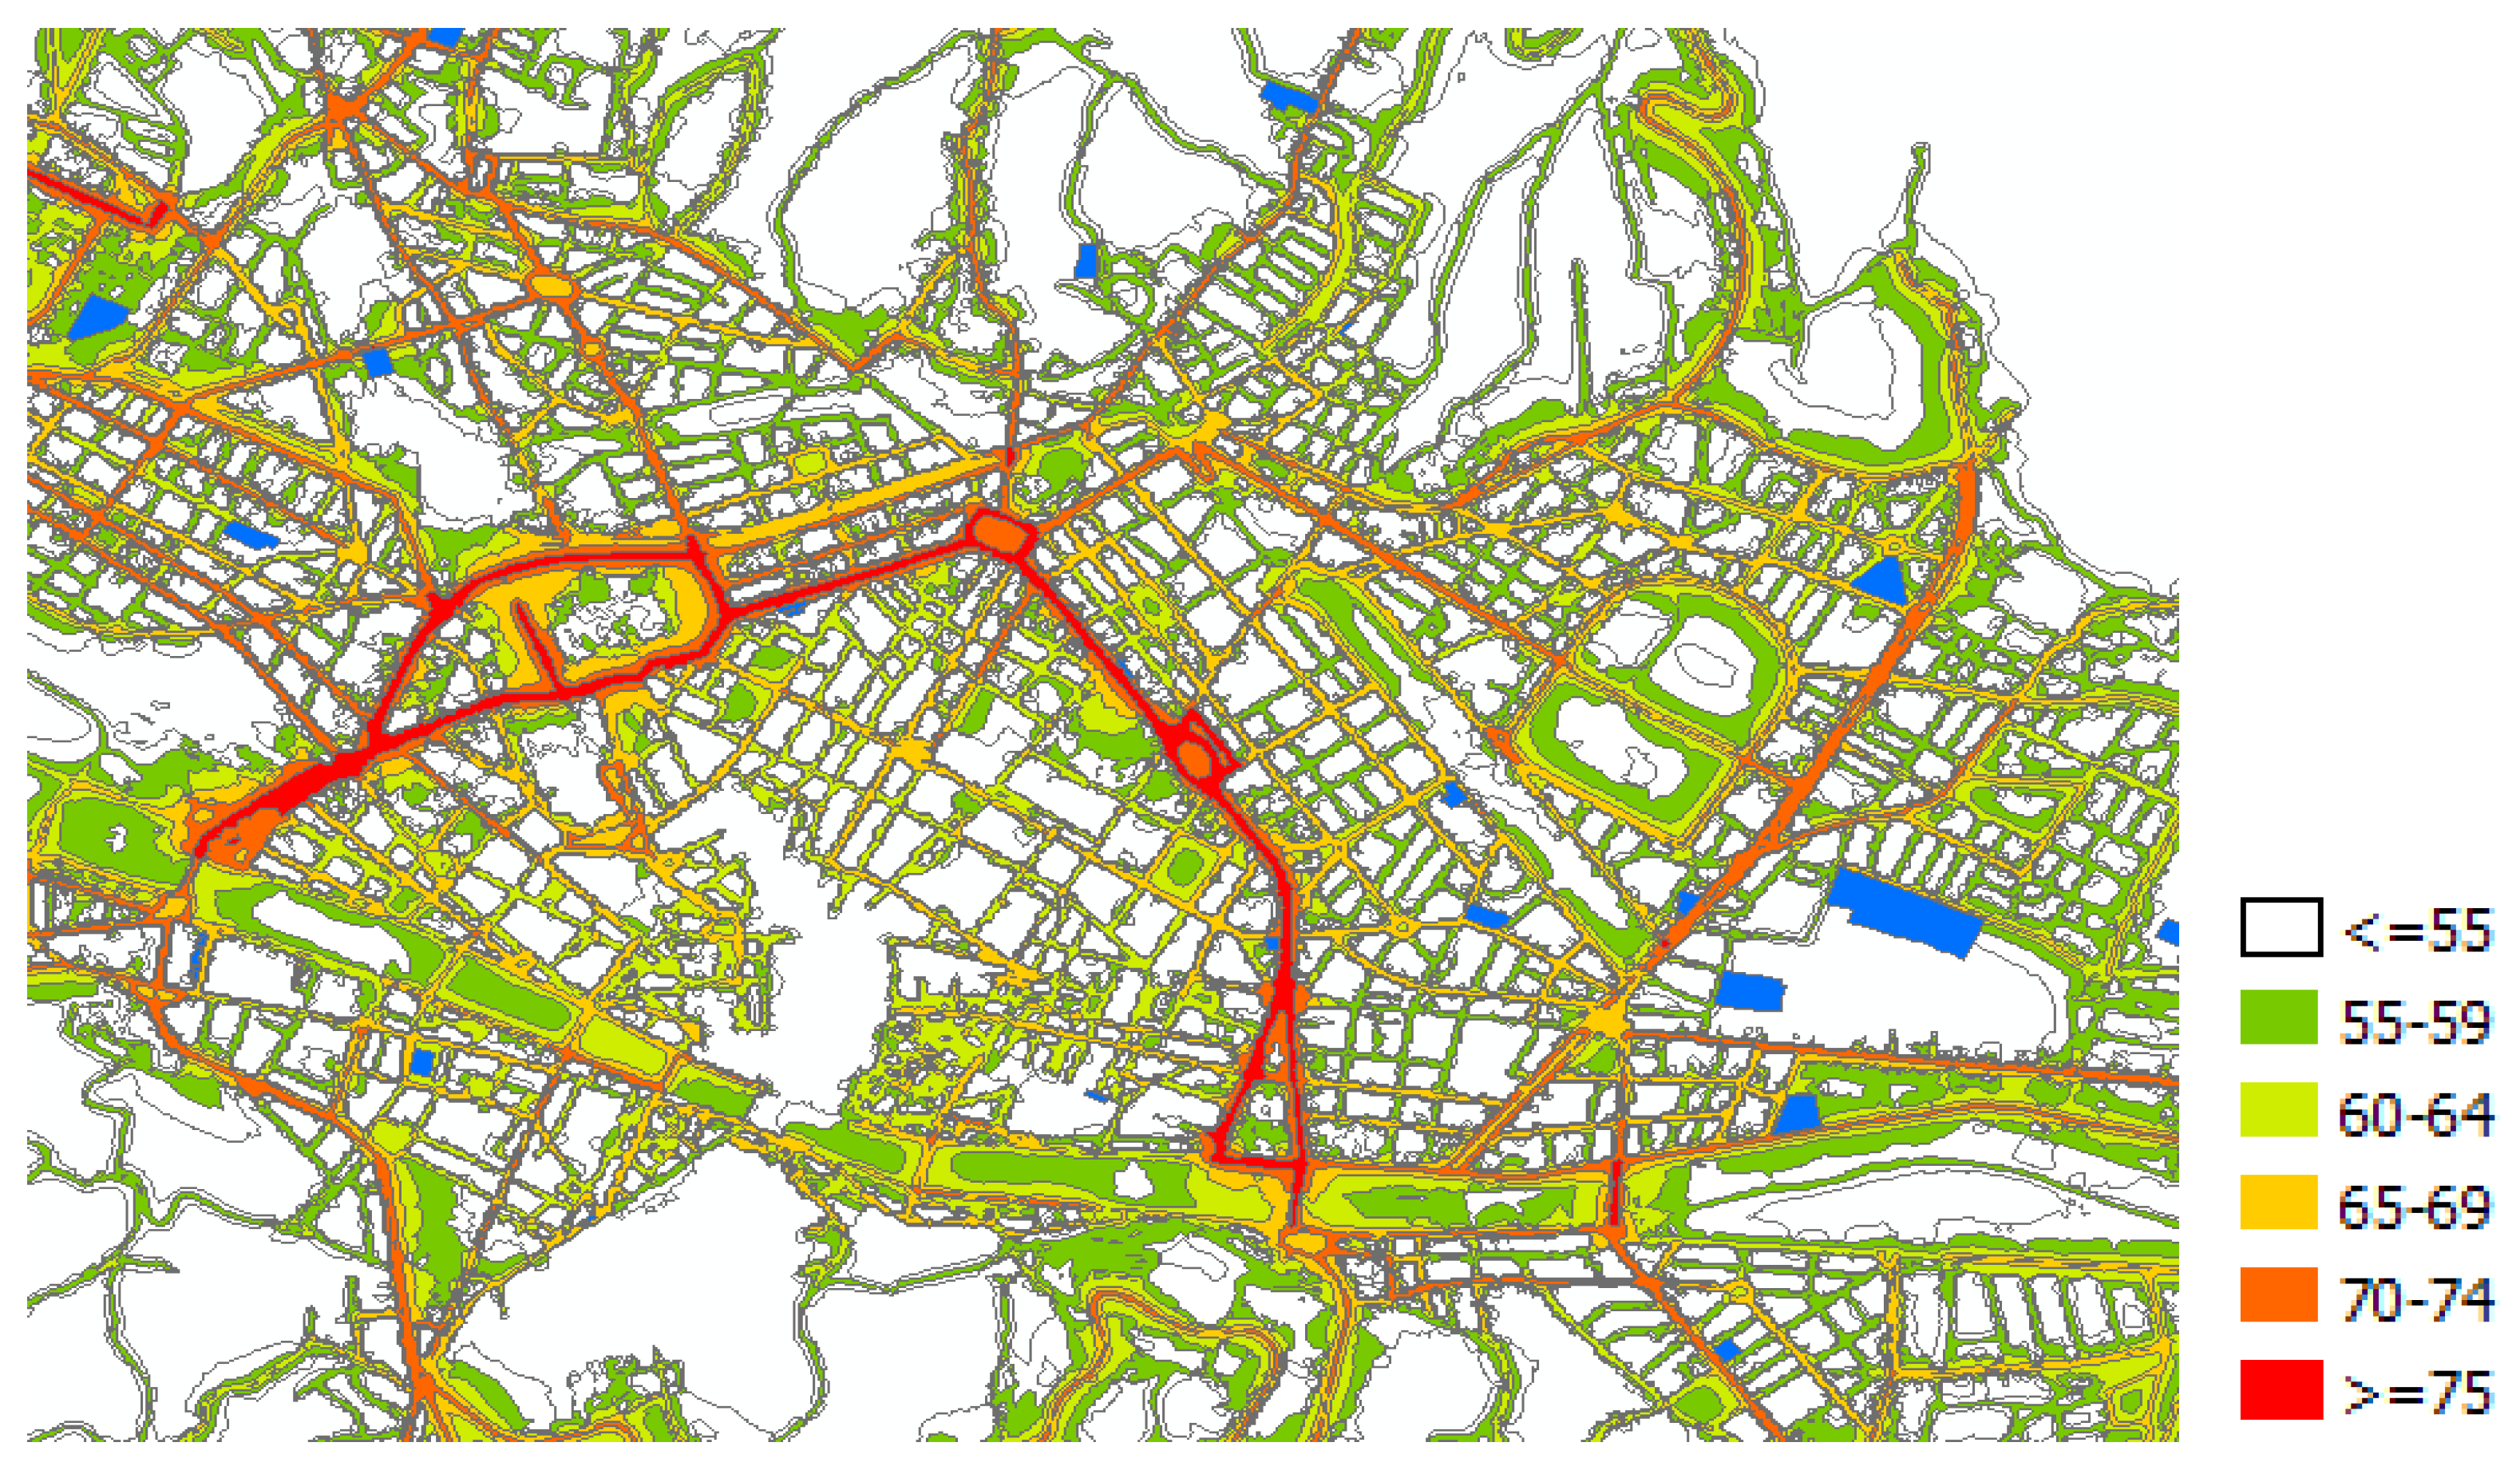
In many cases, precise values on the building facade are not available, and colored maps showing level curves in 5 dB steps are provided (Figure 3). In these cases, Lden on the different facades of the school could be evaluated by interpolating the maps.
In the case of Florence, an interactive noise map is available on the web [35]; it provides two kinds of information, i.e., the colored map of the agglomeration and the precise value of the Italian noise indicator (LAeqd,6–22h) on the most exposed building facade (Figure 3). The latter is calculated at 4 m above the ground, as for Lden, but it includes the facade reflection; therefore, Equation (3) can be directly used for this indicator without adding 3 dB as is the case of Equation (1) and Equation (2).
Figure 3 shows the road traffic noise map of the center of Florence, near the dome.
In the following estimations, outdoor sound level on the most exposed school building facade is calculated by inserting the LAeqd,6–22h values derived from the END map of Florence in Equation (3).
2.4. Indoor Noise Level Estimation
Indoor sound pressure level estimation, L2A, due to sound coming from outdoors can be obtained by means of Equation (4), based on annex E of EN ISO 12354-3 [19].
where:
L1,2mA is the A weighted outdoor sound pressure level in front of the facade (dB) as obtained from noise maps and referring to the time interval of 6–20 h or 8–17 h by means of Equation (1), Equation (2) or Equation (3);
D2m,nT,w is the standardized facade level difference of the school measured according to ISO 16283-3 [36] or estimated according to EN ISO 12354-3 [19] (dB);
ctr is the spectrum adaptation term for traffic noise as described by ISO 717-1 [37] (dB);
T is the reverberation time in the receiving classroom measured according to ISO 16283-3 [36] or estimated according to EN 12354-6 [38] (s);
T0 is the reference reverberation time (0.5 s).
Under the hypothesis of diffuse field in the indoor environment, the calculated value of the indoor sound pressure level (L2) may be considered as the unoccupied ambient noise level due to traffic noise.
The main problem in using Equation (4) is the determination of the facade sound insulation of each facade of the school buildings.
As a preliminary step, for the application of the proposed methodology to the case study analyzed, we will refer to average values of facade sound insulation, spectrum adaptation term, and reverberation time obtained in previous studies [39]. In particular, the following values of these descriptors, which referred to measurements carried out in over 100 classrooms, have been considered for the analysis of the indoor levels:
where T(500–1000 Hz) is the average value of the reverberation time between the octave bands of 500 and 1000 Hz.
D2m,nT,w = 31.1 (dB); ctr = −2.1 (dB); T(500–1000 Hz) = 1.3 (s)
2.5. Determination of the Number of Students Potentially Involved for Each School
The information about the number of students present in each school is usually collected by local municipalities or by the Ministry of Education.
In Italy, the government carried out a census of all schools of various levels (pre-schools, primary schools, lower and upper secondary schools) in order to determine whether or not they needed to be improved. Only nurseries and universities were left out of this investigation.
Globally, more than 42,000 buildings (of which 33,800 are active), distributed across all Italian Regions, have been examined.
The results of this census are available online [39,40] and mainly refer to general aspects of the school buildings, such as year of construction, property, dimensions, kind of building structure and windows typology, and number of students.
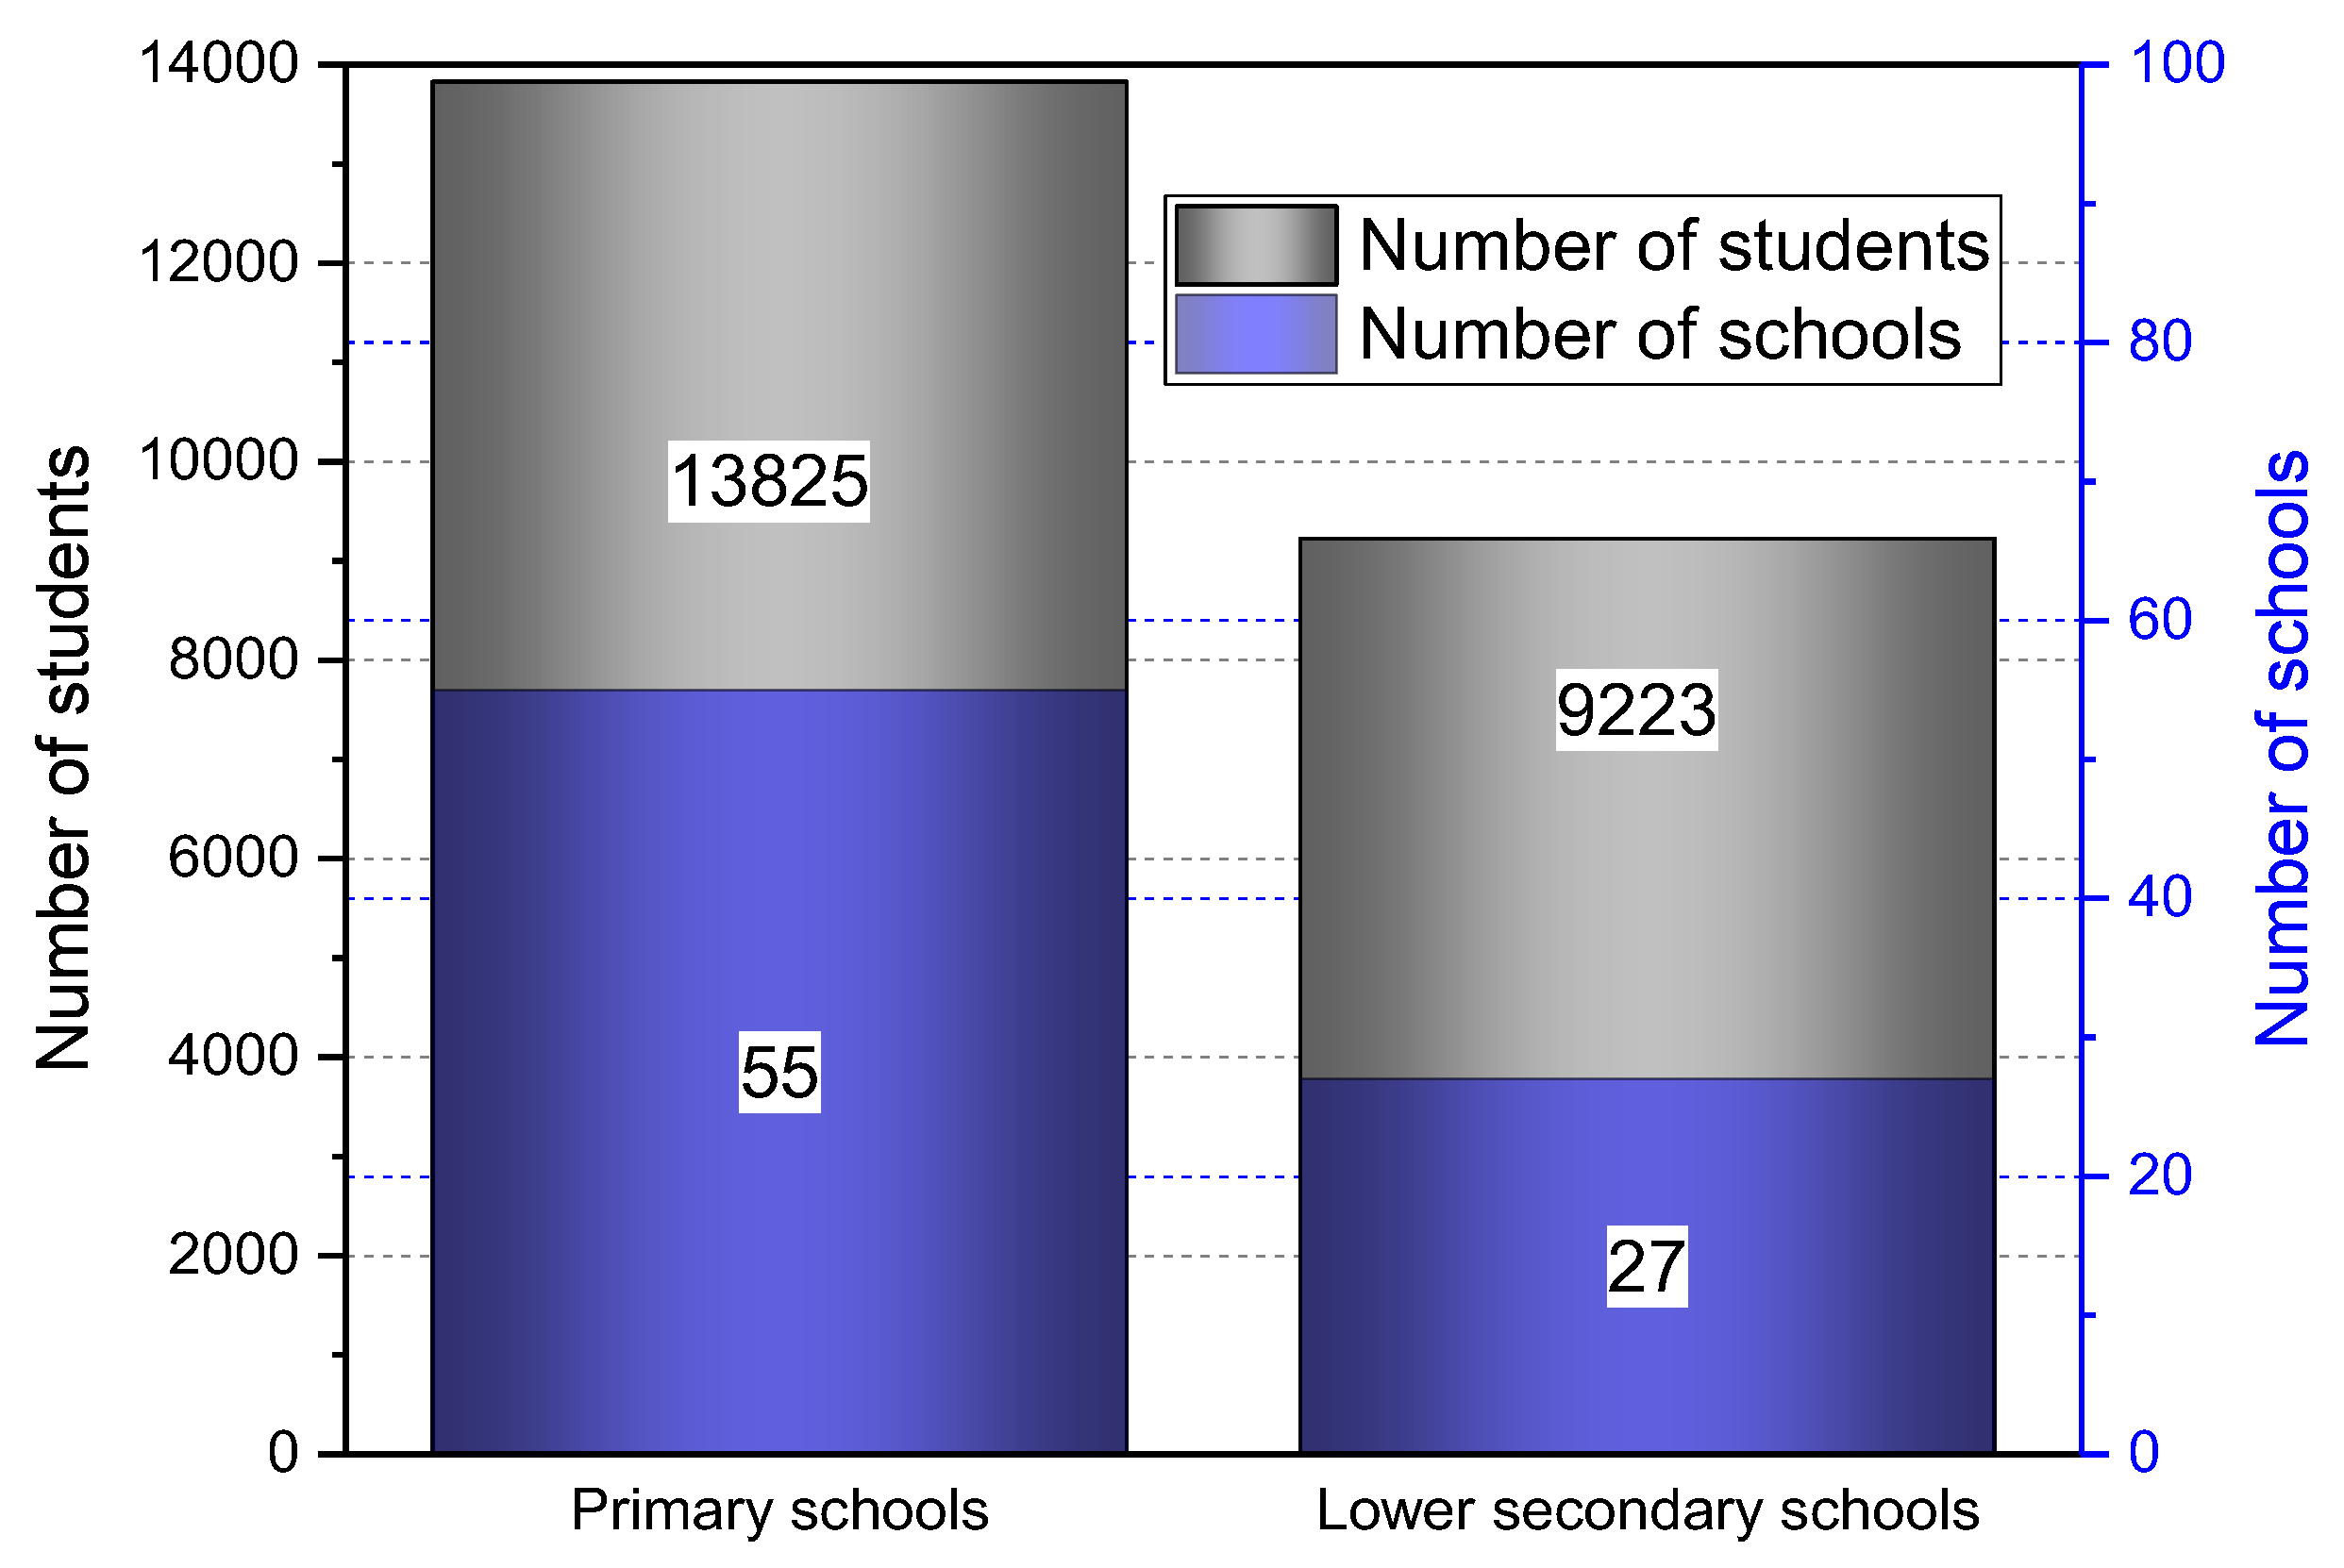
Figure 4 shows, as an example, the number of schools and of students in the municipality of Florence, divided by primary and lower secondary schools.
These data are useful to calculate how many students are exposed to traffic noise by knowing or calculating the SPL in front of the facade of each school. It would be important to know the distribution of classrooms and students in relation to the different school facades since probably one or more facades are partially protected from the noise coming from the main road.
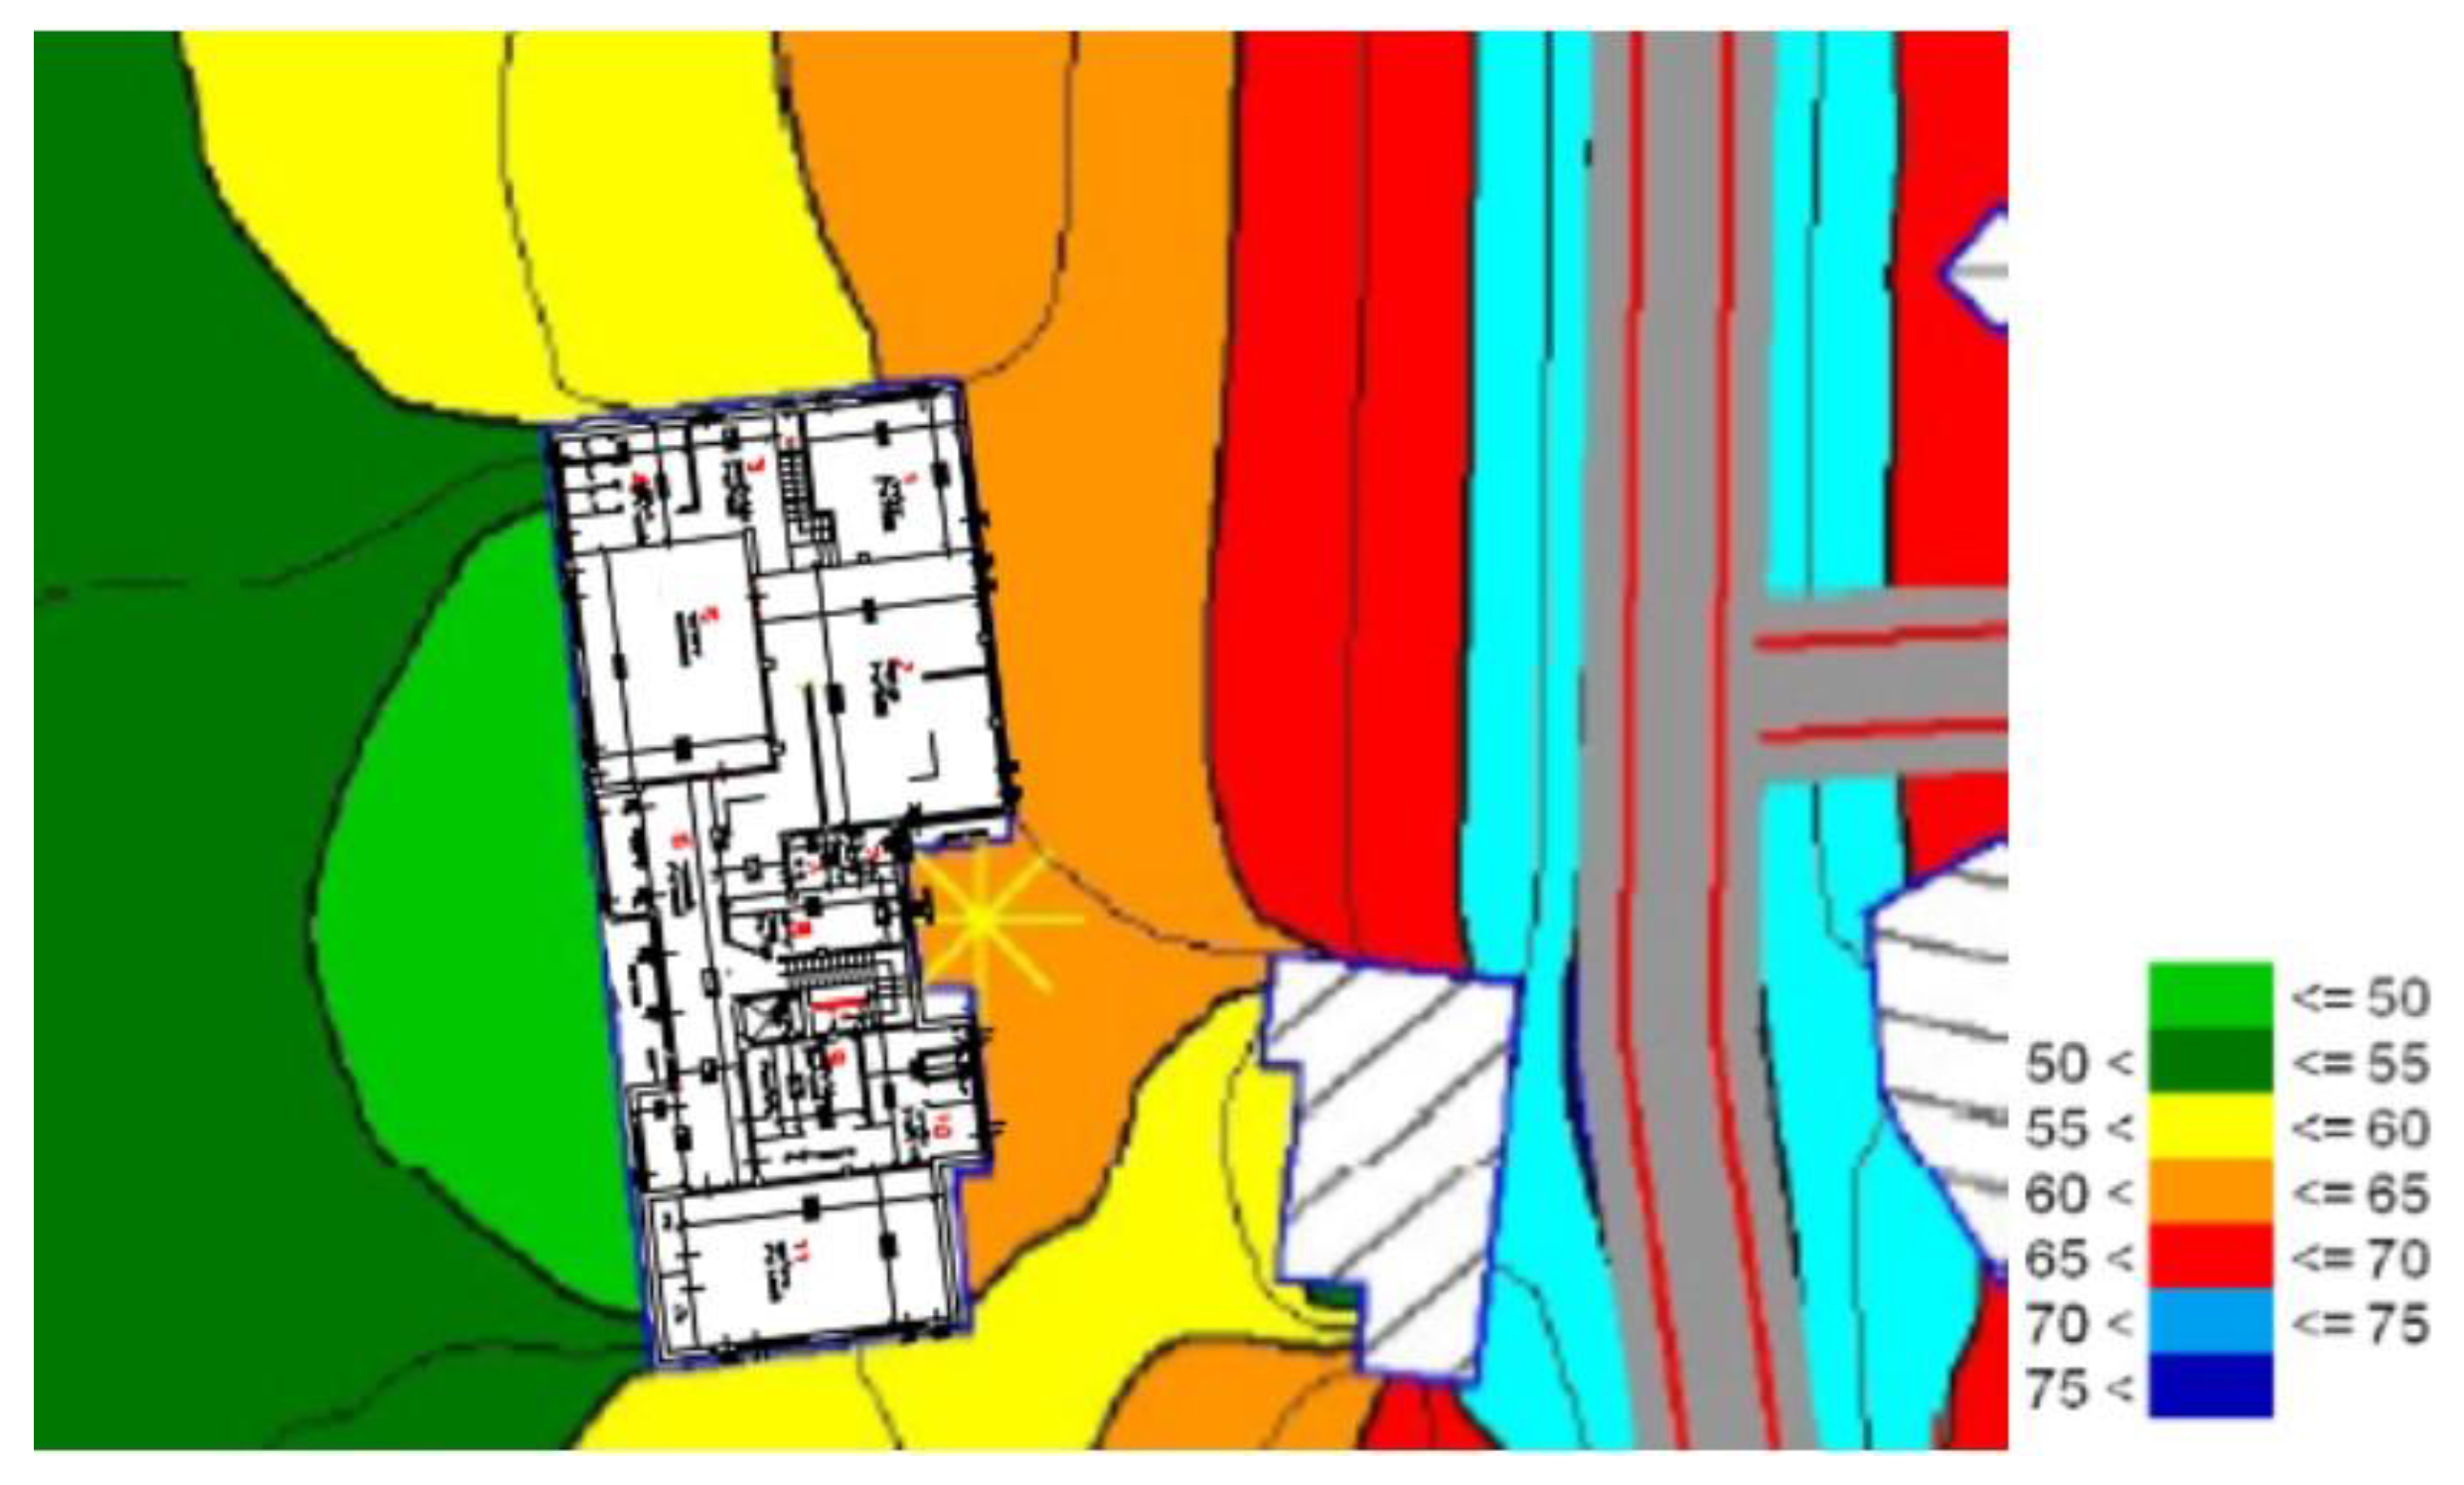
Figure 5 shows the typical distribution of noise on the facades of a school located near a busy road; in this case, the difference between the SPL on the main facade and on the back facade is greater than 10 dB. Nevertheless, obtaining data on the planimetric distribution of classrooms for every school in a municipality can be difficult. For this reason, in a preliminary step of the study, we assume that all students of each school are located on the facade that is more exposed to noise, i.e., on the facade facing the main road.
3. Results
The results of the study deal with two aspects:
- determination of the correlation both between Lden and day-time equivalent level LAeq,6–22h and between Lden and the hourly values of the selected descriptors of noise events (LAmax and LA1) due to traffic noise;
- determination of the number of students exposed to specific intervals of noise levels; these results, affected by a greater uncertainty, refer to the case study of the municipality of Florence and must be considered as an application example of the proposed methodology.
3.1. Correlation between Different Indicators
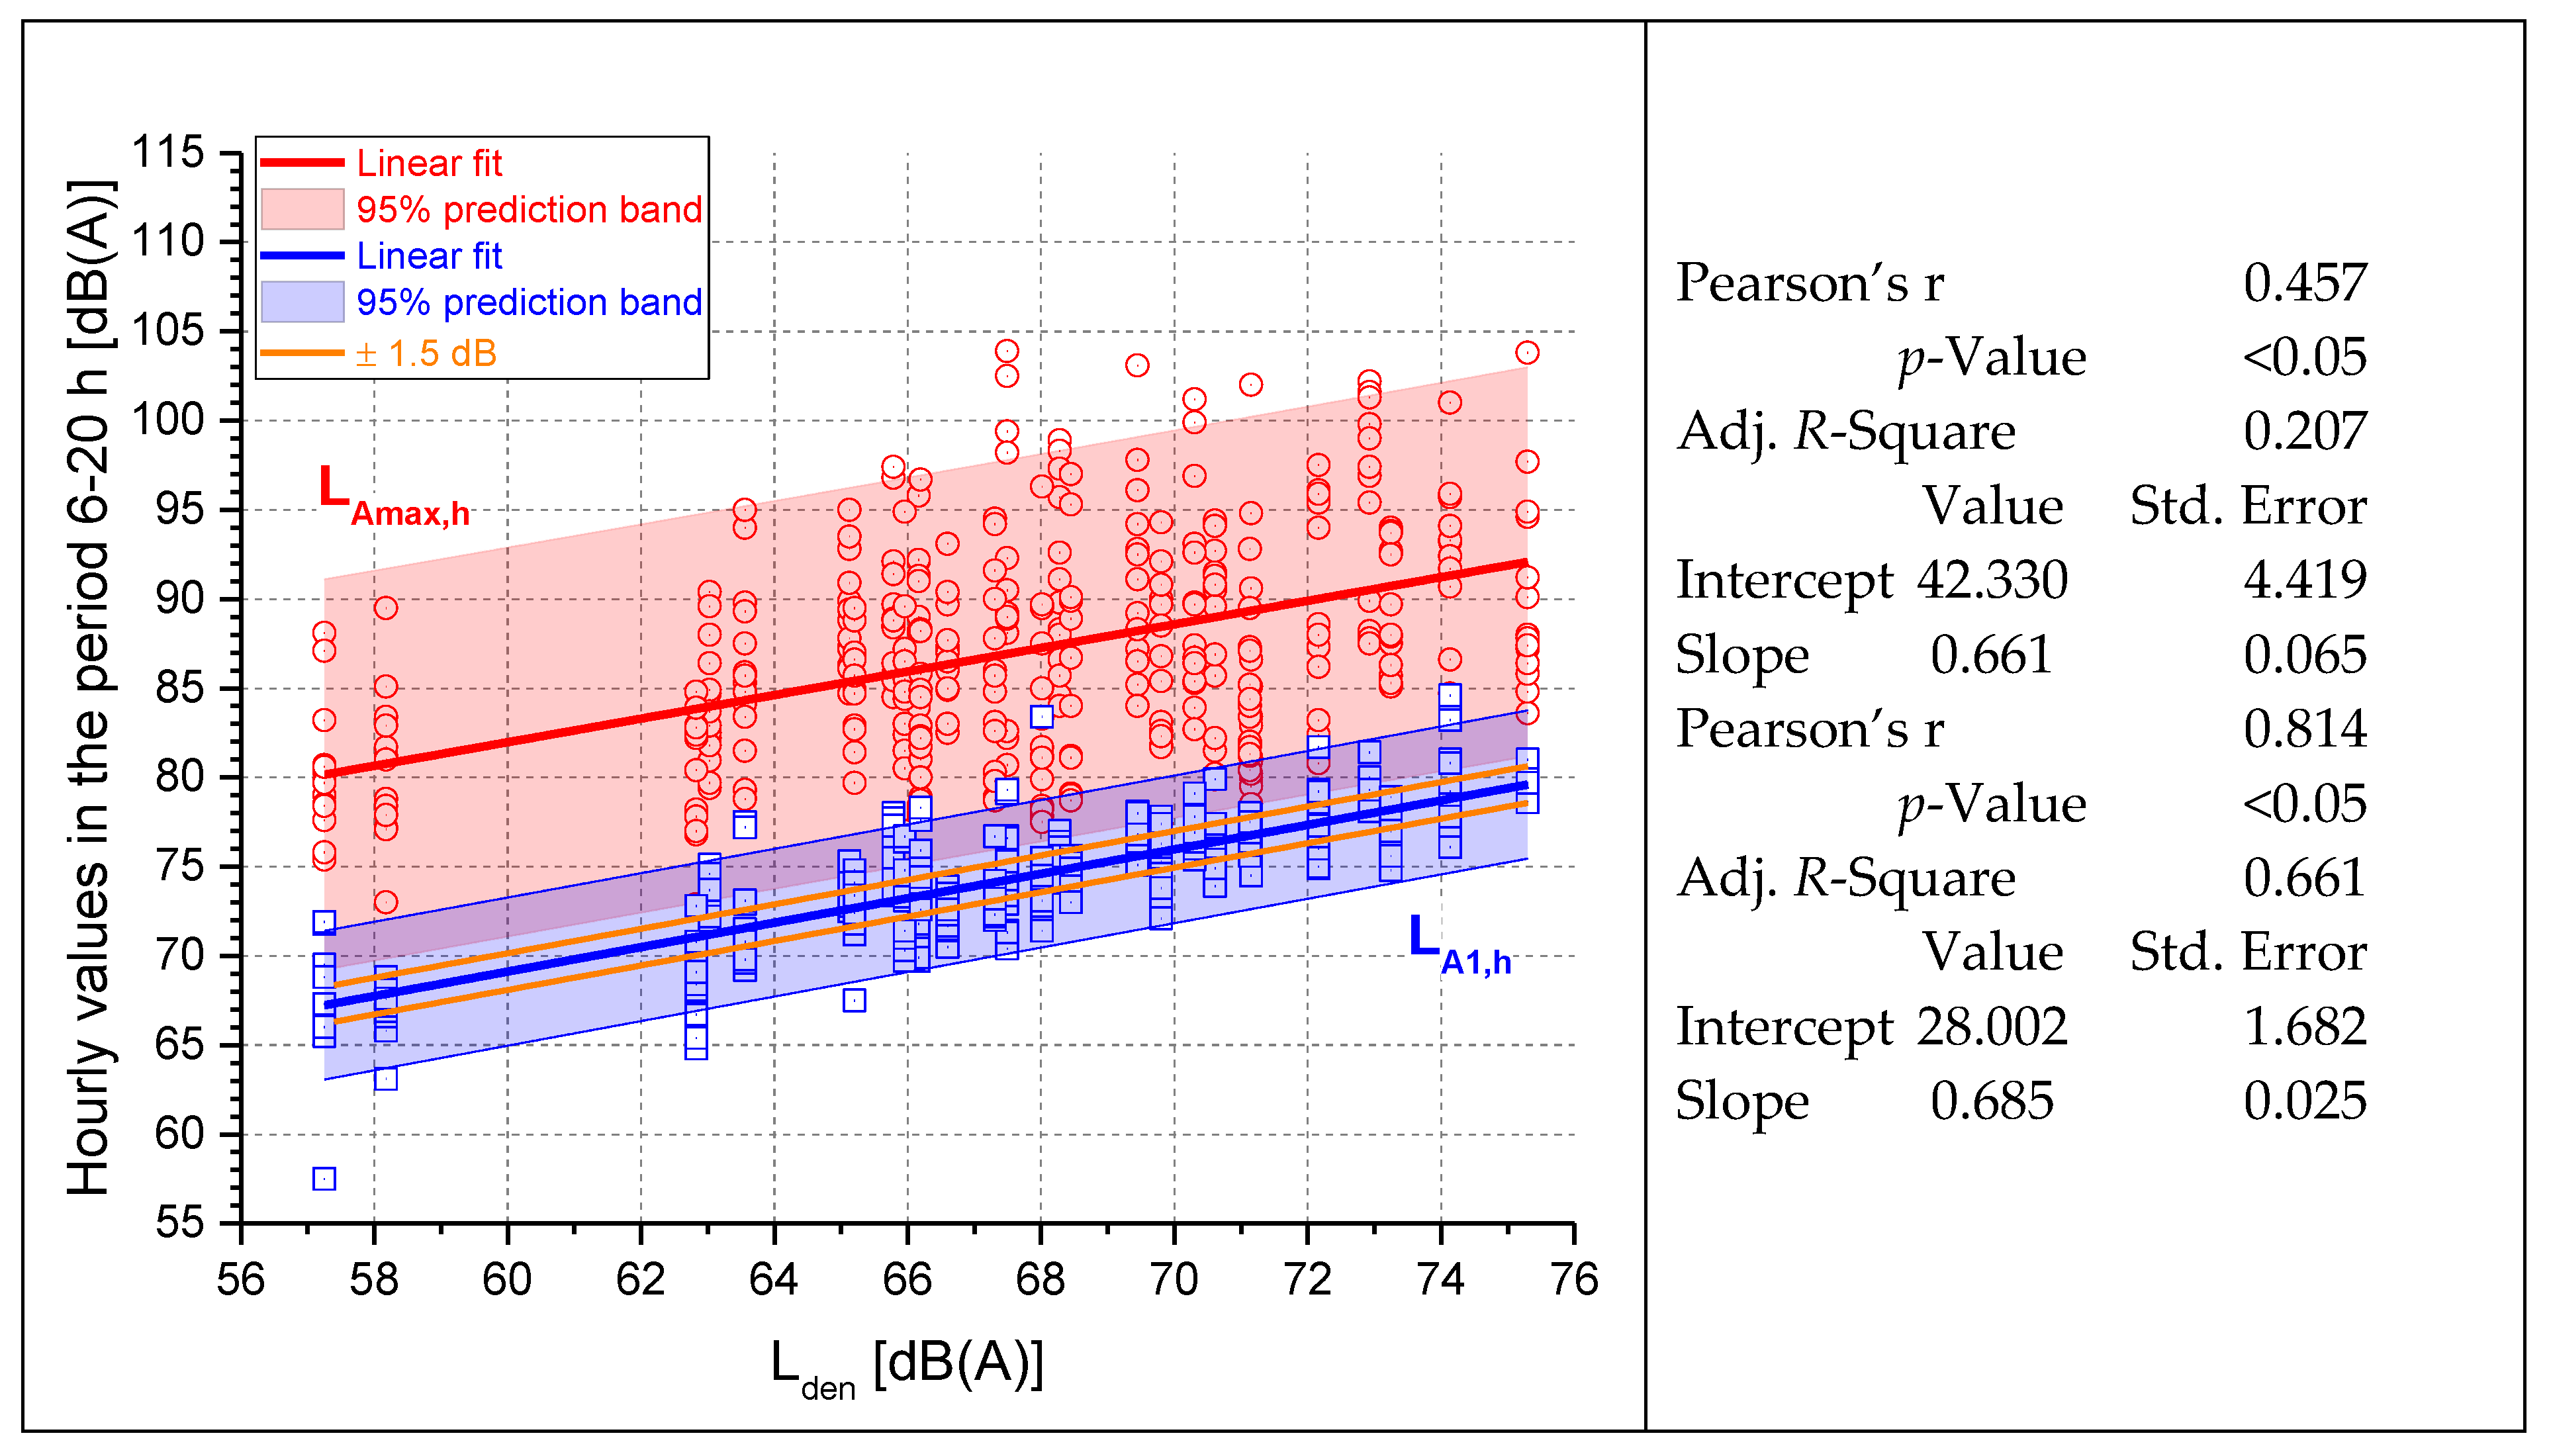
Figure 6 shows the results of the linear regressions of the hourly values in the day-time 6–20 h of both LAmax and LA1 versus the corresponding values of Lden for the 28 urban streets considered (data matrix formed of three variables (columns) and 28 roads × 14 h = 392 rows).
The correlation between LA1 and Lden is higher (R2 = 0.661) than that observed for LAmax (R2 = 0.207) due to a greater dispersion of data for the latter. Indeed, LAmax measured in a time interval of 1 h may be influenced by unusual events, such as very noisy vehicles or sirens. However, these events are often present in traffic noise and it would be inappropriate to exclude them from the analysis. The difference between the regression slopes of LAmax and LA1 is statistically not significant at the 95% confidence level (p-value = 0.725).
Dealing with the accuracy of predicted values, the standard deviation of the error is ±5.5 dB for LAmax and and ±2.1 dB for LA1, whereas the median value of the error is 0.3 and 0.2 dB, respectively. The percentage of errors (predicted–observed values) within the range ±1.5 dB is 21.4% for LAmax and 54.3% for LA1. The range of ±1.5 dB has been chosen because its width (3 dB) corresponds to a doubling of sound energy.
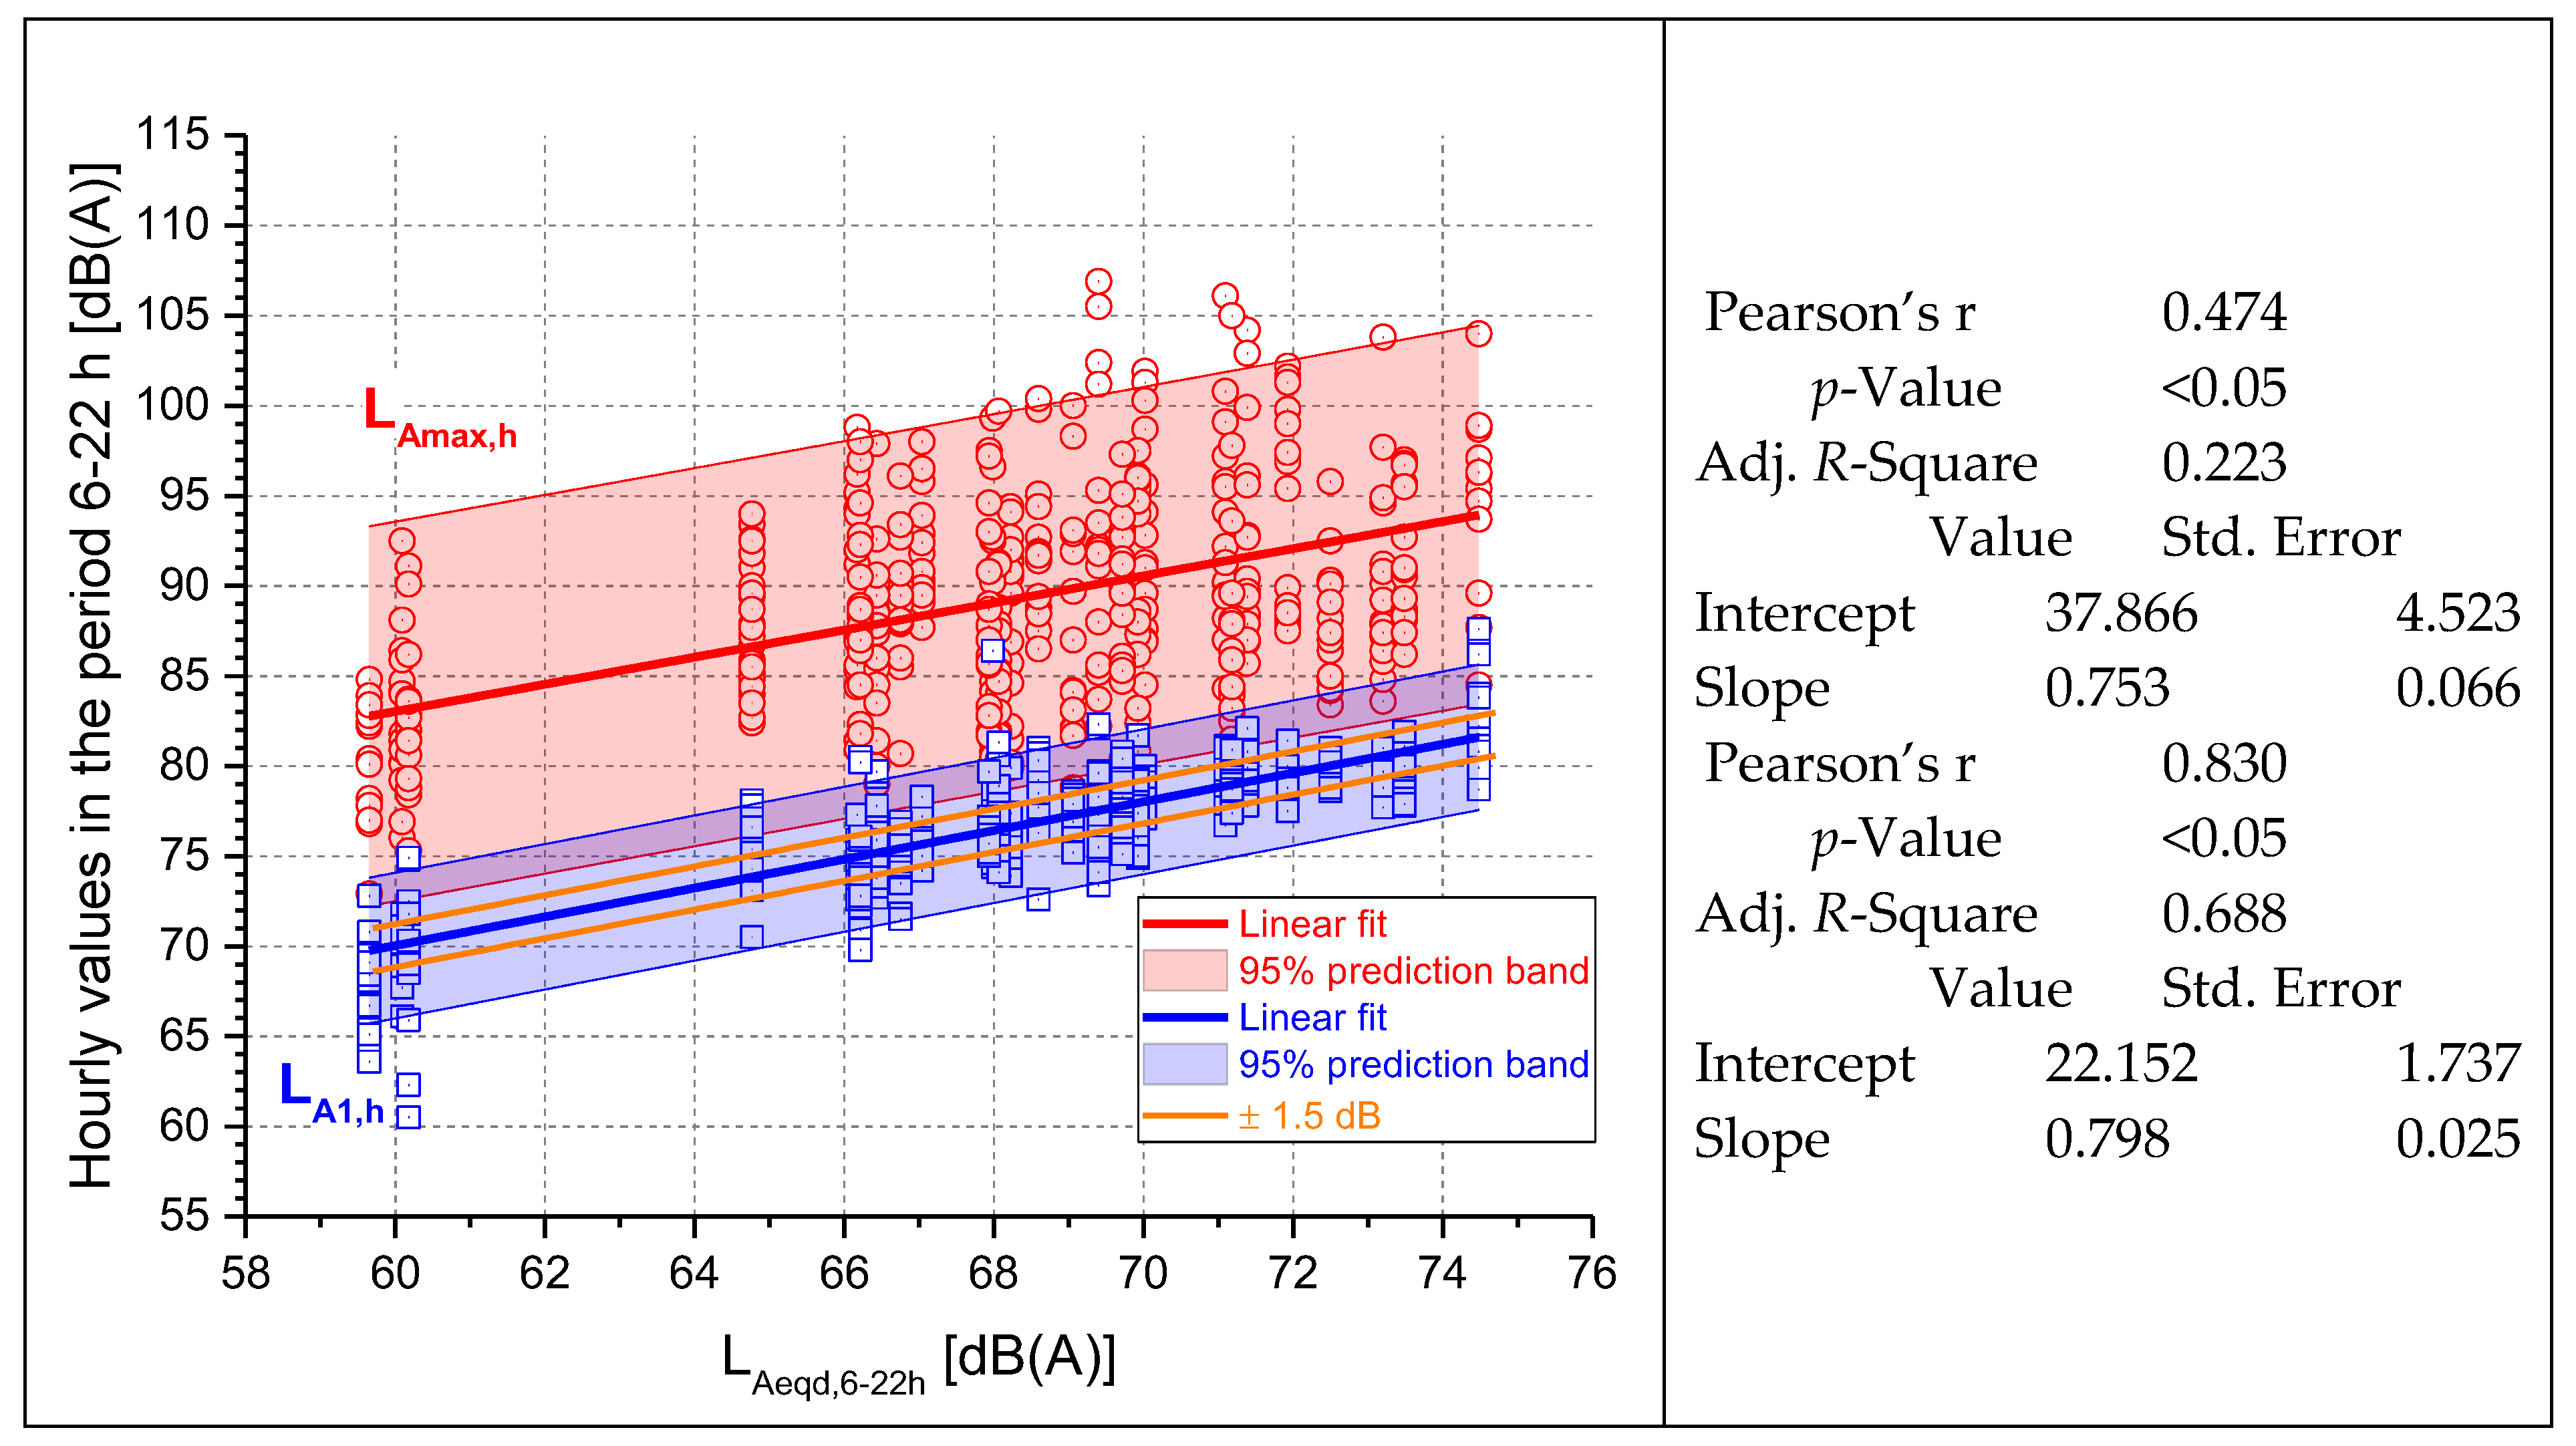
Similar results have been obtained for the linear regressions between the hourly values in the day-time 6–22 h of both LAmax and LA1 versus the corresponding values of LAeq,6–22h (data matrix formed of three columns and 28 roads × 16 h = 448 rows), as shown in Figure 7. The correlation between hourly LA1 values and LAeq,6–22h is much higher (R2 = 0.688) than that observed for LAmax (R2 = 0.223), while the difference between the regression slopes of LAmax and LA1 is statistically not significant at the 95% confidence level (p-value = 0.523).
Dealing with the accuracy of predicted values, the standard deviation of the error is ±5.3 dB for LAmax and ±2.0 dB for LA1, whereas the median value of the error is 0.3 and 0.2 dB respectively. The percentage of errors (predicted–observed values) within the range ±1.5 dB is 19.6% for LAmax and 60.5% for LA1.
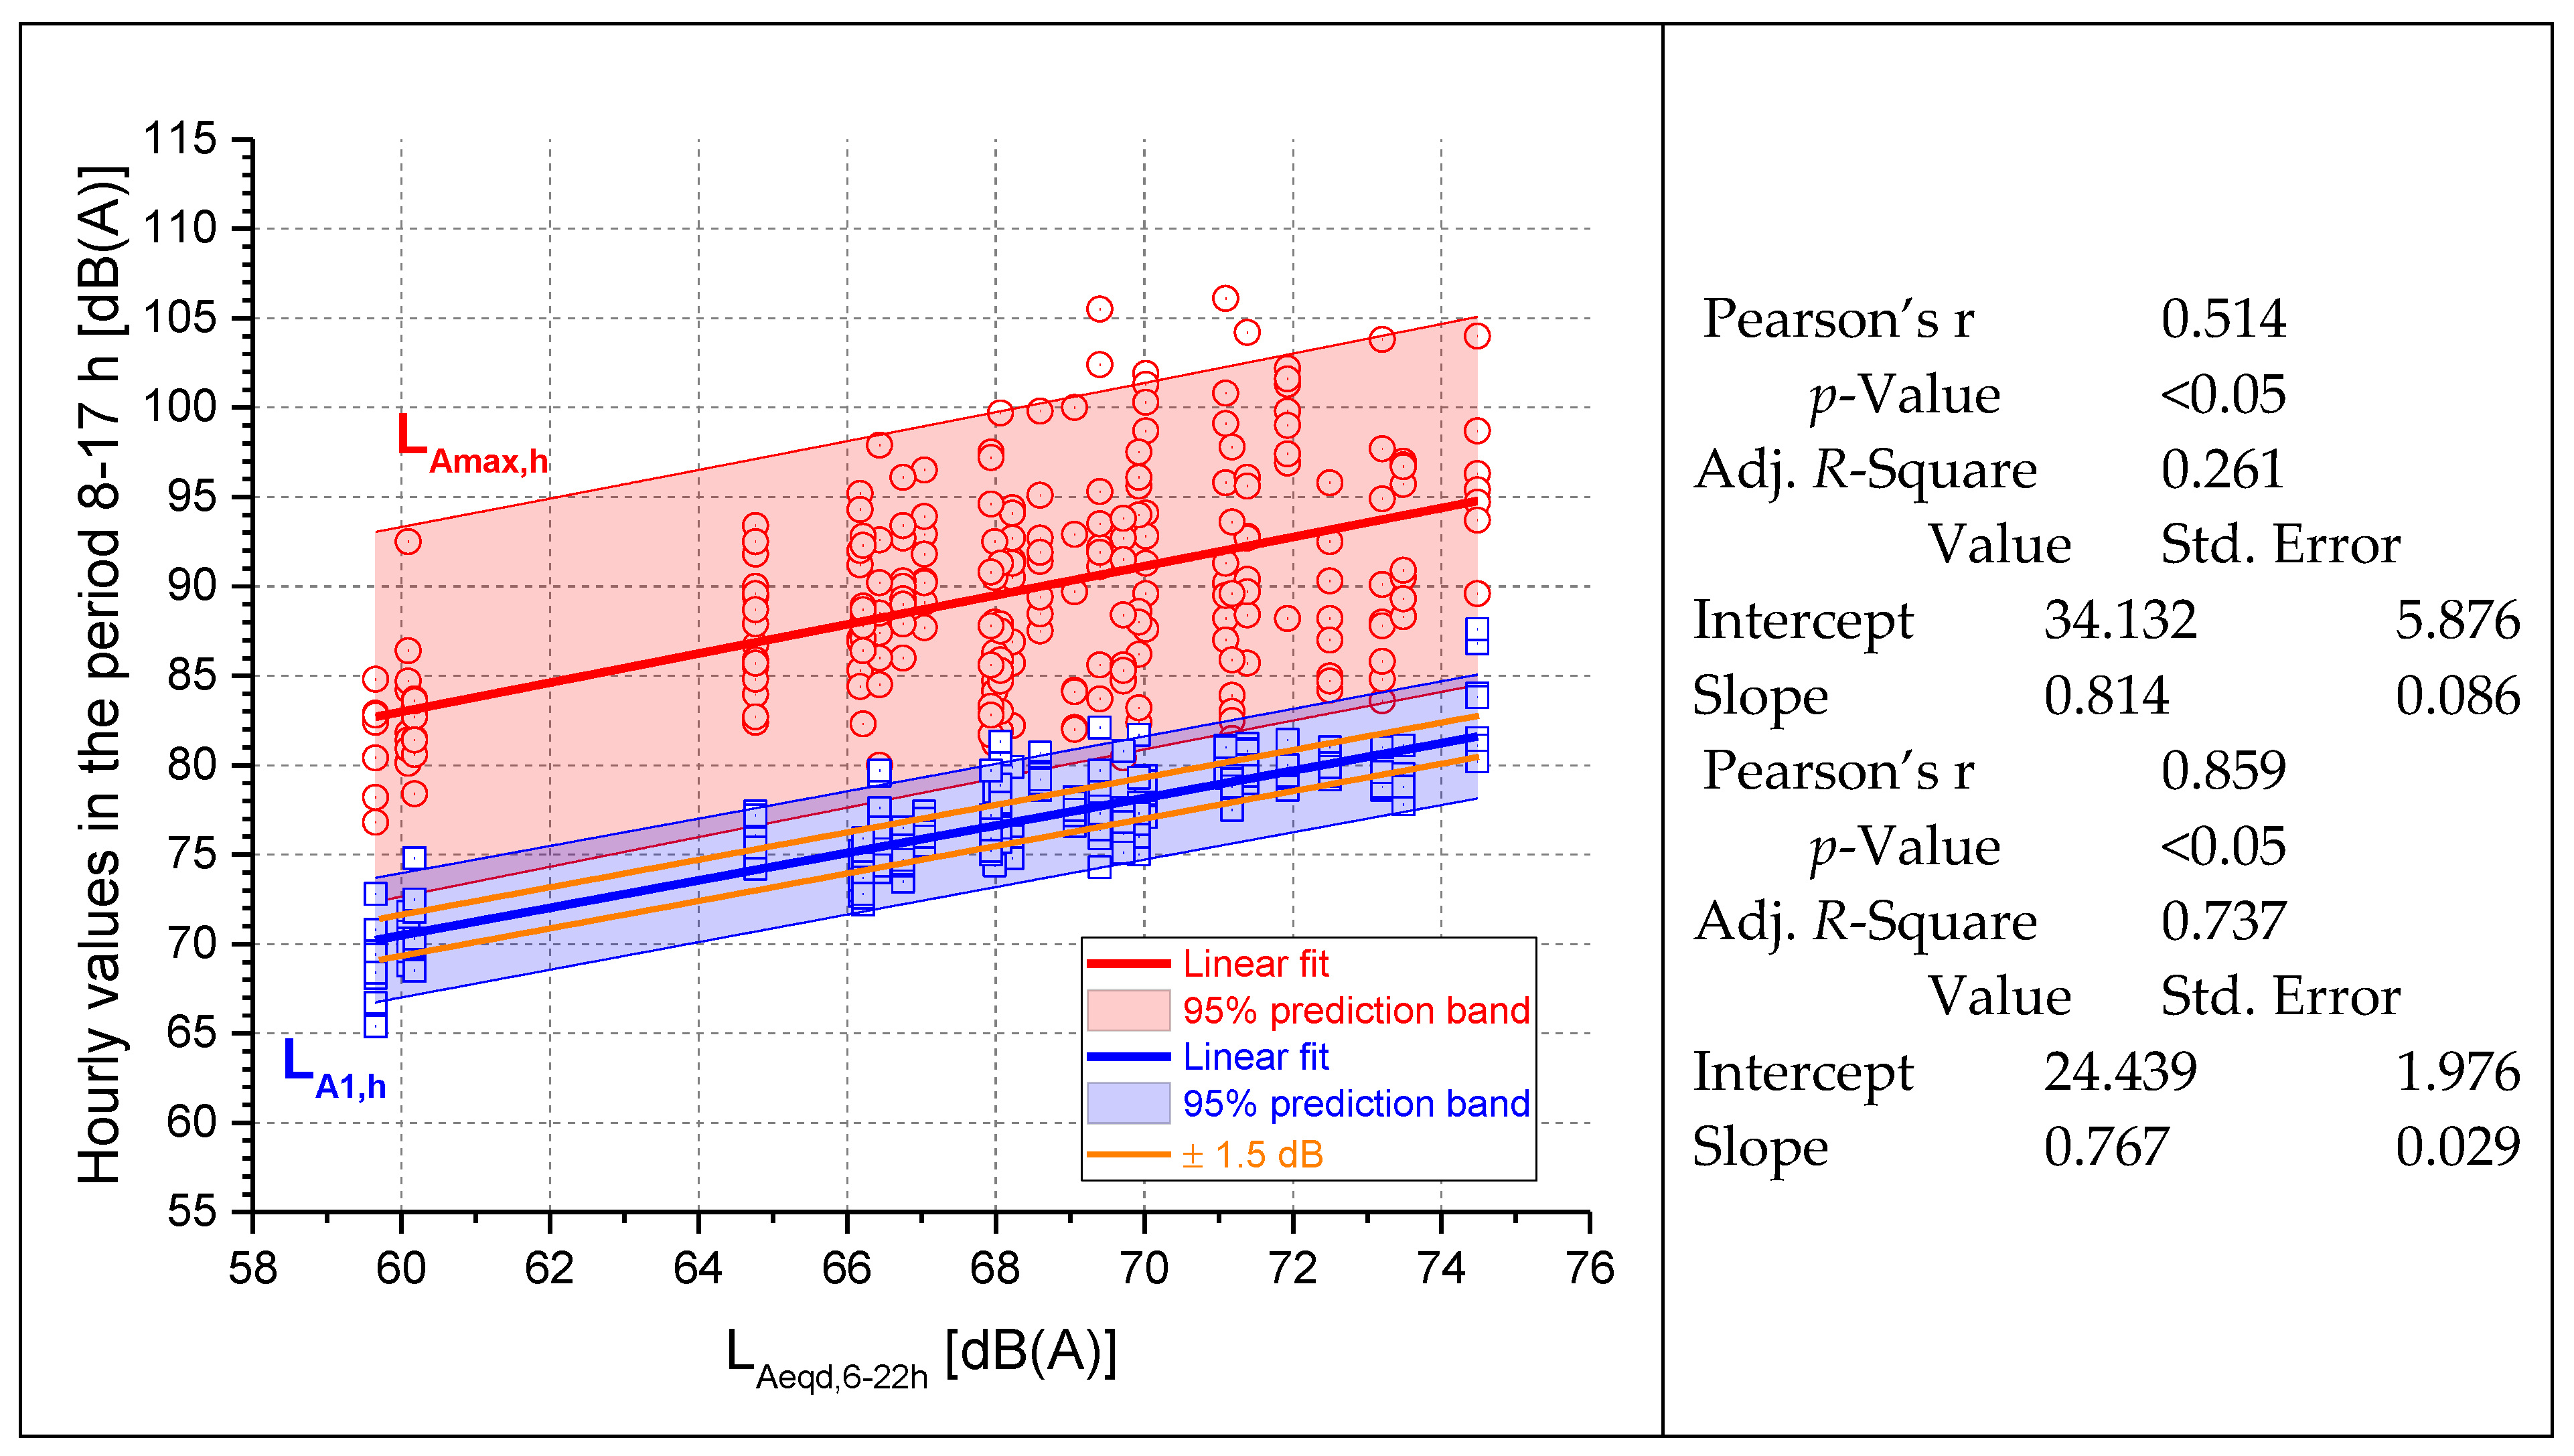
Figure 8 shows the results of the linear regressions between the school hours 8–17 h of both LAmax and LA1 versus the corresponding values of LAeq,6–22h (data matrix formed of three columns and 28 roads × 9 h = 252 rows). Again, the correlation between hourly LA1 values and LAeq,6–22h is much higher (R2 = 0.737) than that observed for LAmax (R2 = 0.261), while the difference between the regression slopes of LAmax and LA1 is statistically not significant at the 95% confidence level (p-value = 0.607). The standard deviation of the errors (predicted–observed values) is 5.2 dB for LAmax and ±1.7 dB for LA1, whereas the median value of the error is 0.1 and 0.2 dB, respectively. The percentage of errors within the range ±1.5 dB is 21.4% for LAmax and 61.1% for LA1.
Comparing the results of the regressions, the estimate of hourly LA1 values within the opening hours of schools (8–17 h) from the day-time LAeq, in the period 6–22 h according to the Italian legislation, shows the best performance, with 61.1% being the percentage of errors within the range ±1.5 dB. This percentage is reduced to 21.4% for hourly LAmax values due to greater variability of data, and it is equal to that observed for the regression between Lden and the hourly LAmax values in the day-time period 6–20 h.
3.2. Determination of the Students’ Exposure to Road Traffic Noise: Application to the Case Study
The methodology described in Section 2 has been applied to the case study of the primary and secondary schools of the municipality of Florence.
Florence is the most populous city in Tuscany, with about 400,000 inhabitants and 81 municipal schools of which 54 primary (with 13,285 students) and 26 lower secondary schools (with 9223 students), as shown in Figure 4.
Figure 9 shows the distribution of the schools in the noise map of the Municipality of Florence.
The number of students and the location of each school have been taken from the registry of Italian school buildings available online [40].
The equivalent SPL in front of the facade of each school can be taken from the noise maps available online [35] for each kind of noise source (roads, railway and airport). From the analysis of these maps, it can be observed that the main noise source is road traffic for all the schools analyzed.
The noise map of Florence gives the SPL in the center of the facade of each building facing a road (Figure 3). For this reason, noise on facades not facing a road is not given as facade noise; nevertheless, it could be evaluated from the color of the map (Figure 9).
As a preliminary step of this study, for the schools with one or more facades not facing a road (for example, court buildings), we have also considered the SPL value of the facade facing the road for the classrooms at the front and back of the school. For this reason, the results of this analysis are overestimated and precautionary due to the consideration of all the students exposed to the highest road traffic noise of their school. In a subsequent phase of the study, the real distribution of the classrooms of each school will be taken into account in order to assign to each student the SPL corresponding to the facade of his/her classroom.
The day-time equivalent SPL (LAeqd,6–22h) for each facade of all the schools has been converted into the equivalent SPL corresponding to the school hours (LAeq,8–17h) by means of Equation (3). Then, these values have been associated with the number of students of each school and divided into intervals of 5 dB, from 55 to 80 dB(A) of the facade SPL, according to the SPL intervals of noise maps. From the facade SPL given by Equation (3), the indoor value of the SPL has been calculated by means of Equation (4), considering the same facade properties and reverberation time for each school by means of Equation (5). This procedure clearly produces an approximation, but it was not possible to obtain the actual value of facade sound insulation and of reverberation time for each classroom. Indeed, the period of construction was known for each school and a tentative investigation was carried out to correlate the period of construction to the predicted facade sound insulation. In any case, the actual facade sound insulation given by a facade is due to many factors, such as the maintenance of the junctions and the sealings of the windows, that can vary not only from one school to another, but also from one classroom to the other.
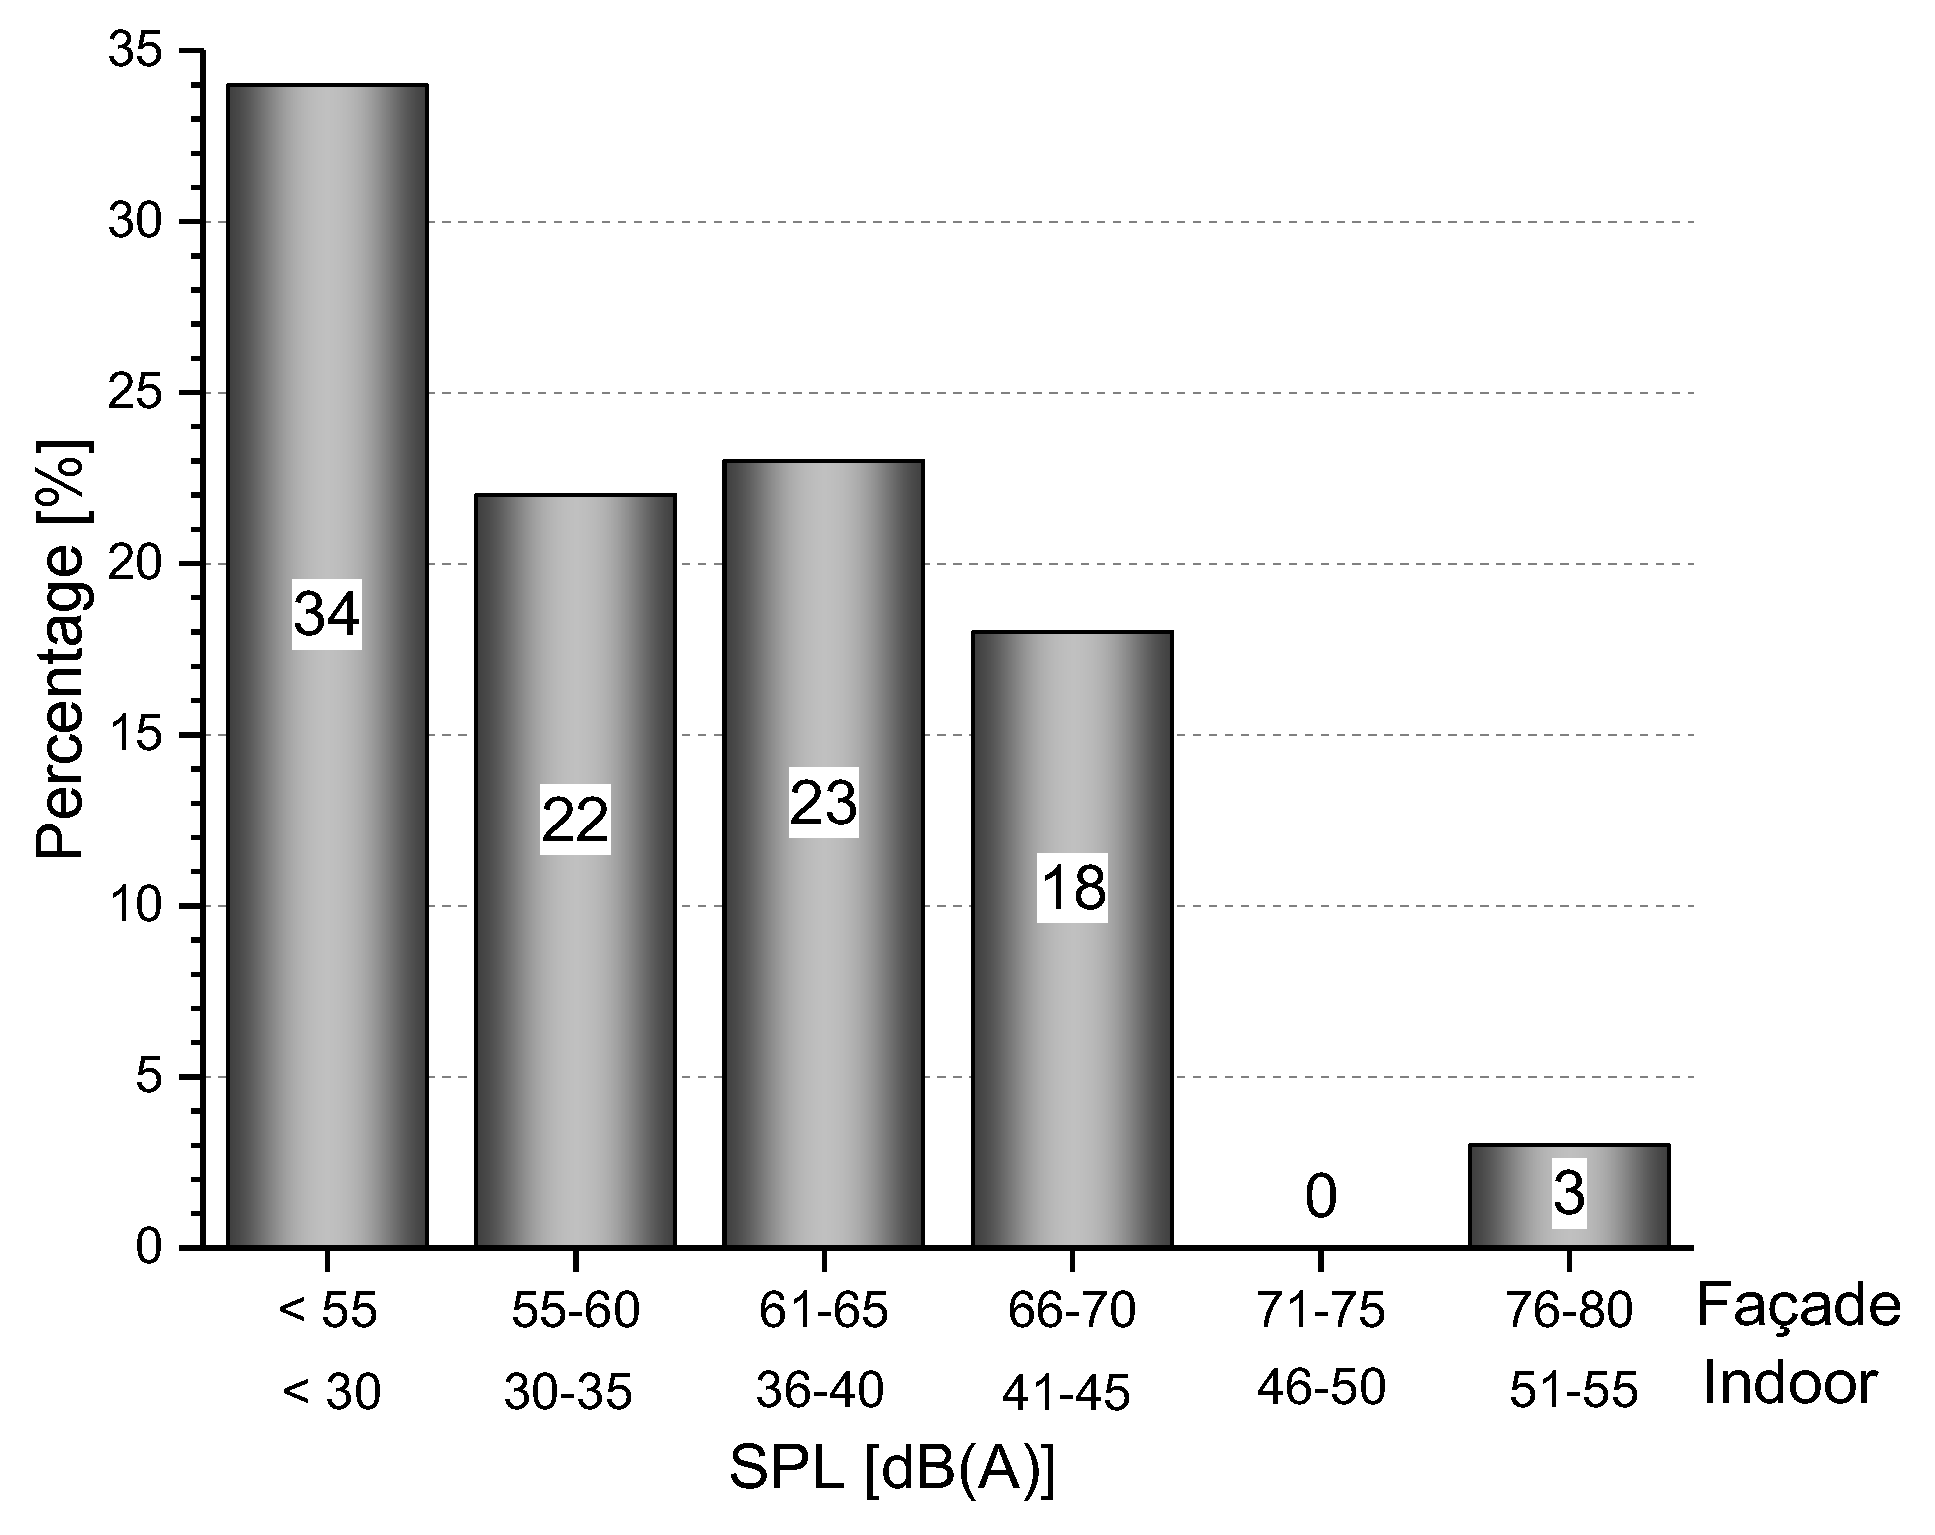
Figure 10 shows the percentage distribution of the facade SPL (LAeq,8–17h) and of the indoor SPL for all the students of the primary and lower secondary schools of Florence.
From the histograms in Figure 10, it can be seen that 44% of students are exposed to the SPL inside the classroom greater than 35 dBA, 21% to levels greater than 40 dBA, and 3% greater than 50 dBA. These values are estimated in more favorable conditions, considering the windows of the classrooms as closed, with the noise coming only from road traffic. However, almost all Italian schools are without mechanical ventilation systems, and therefore, in spring and summer, the closed windows condition is not always valid.
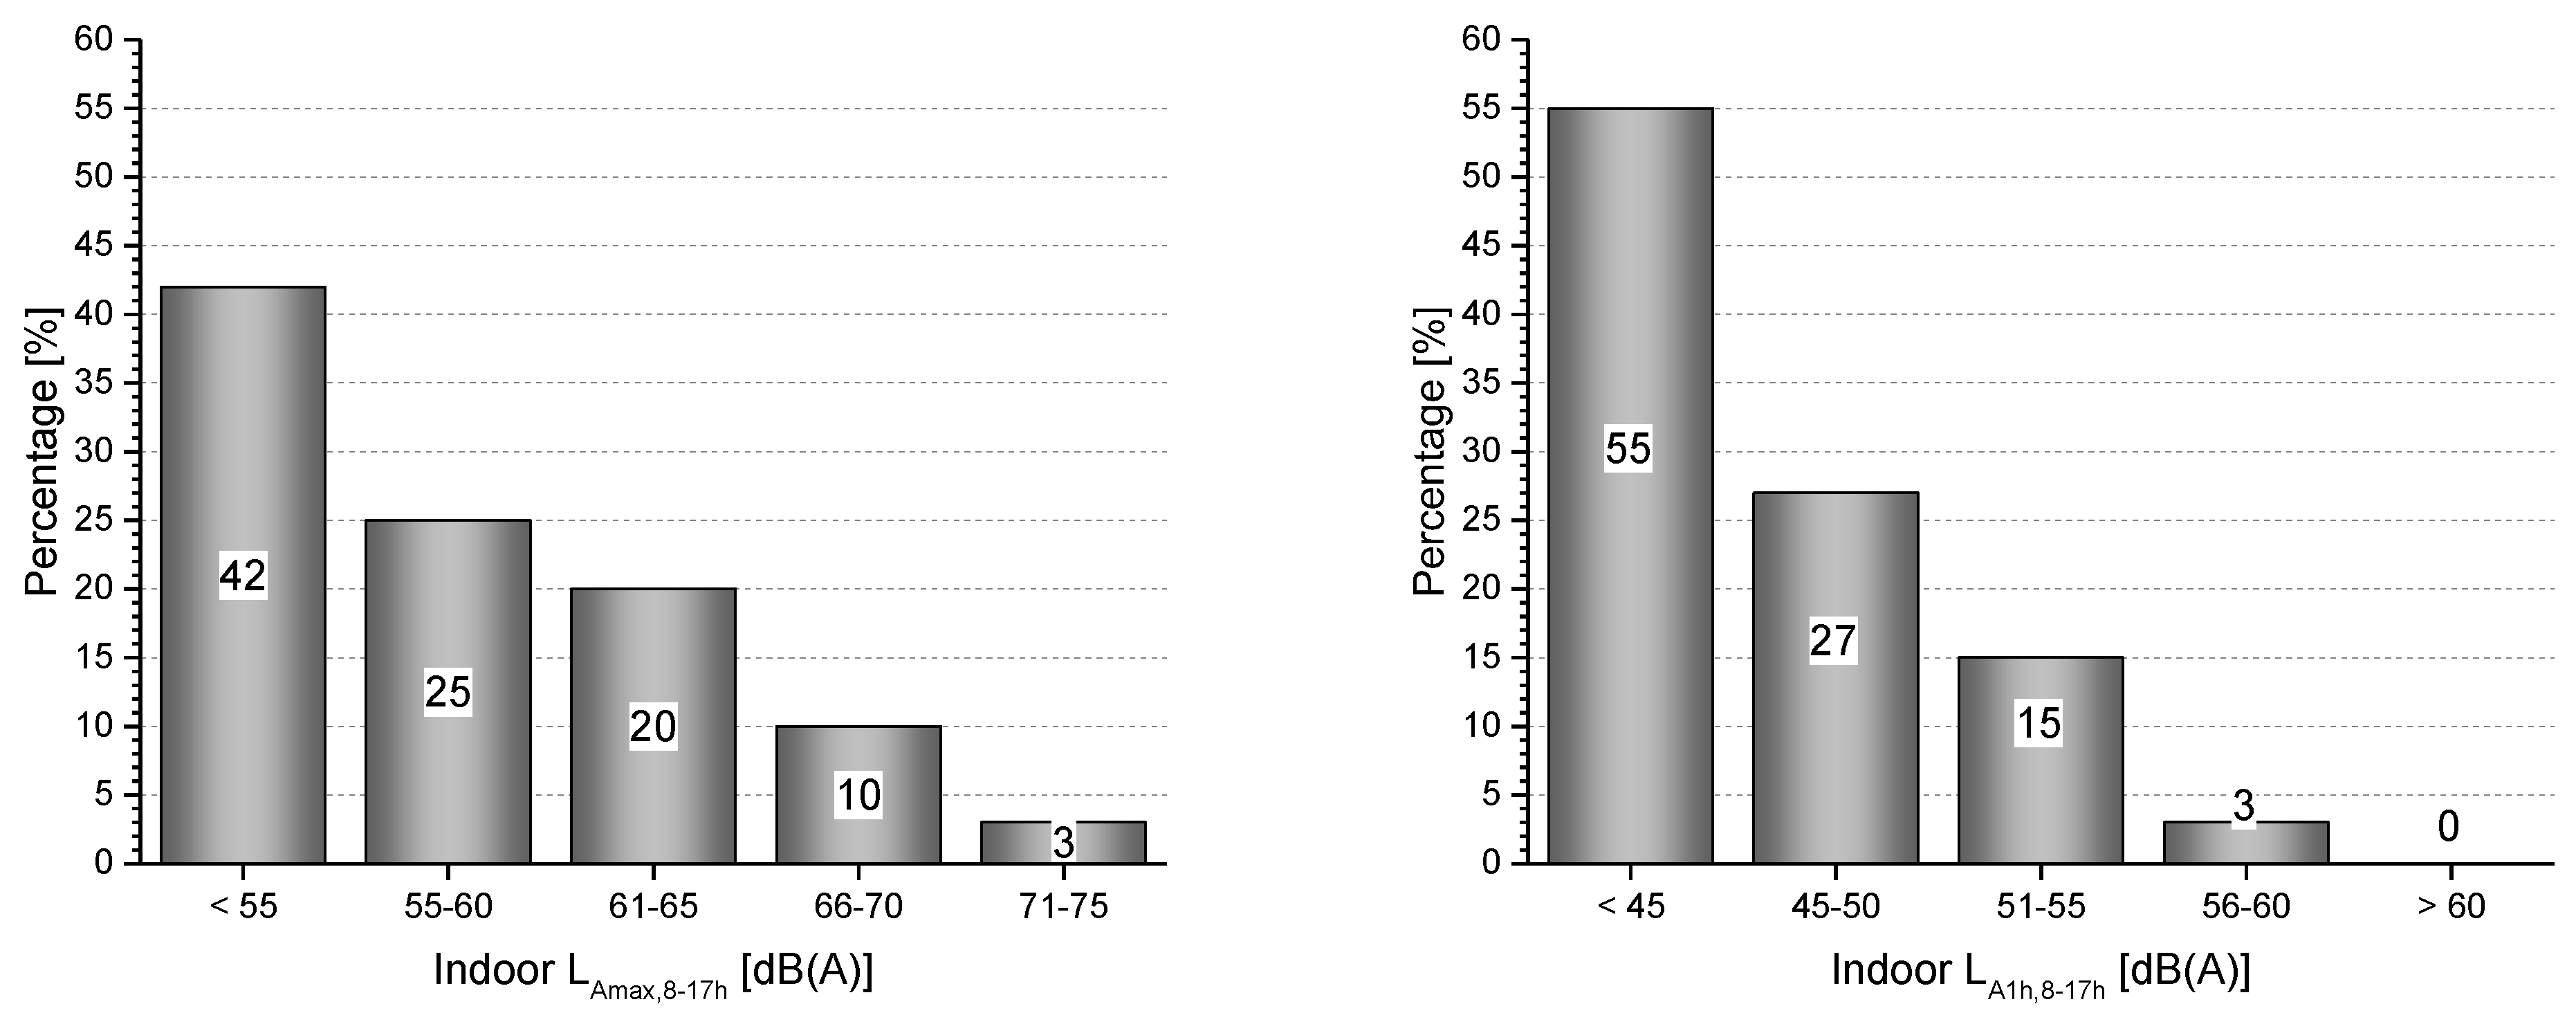
It is also possible to calculate the exposure to short-duration noise events by means of the method described in Section 2 and on the basis of the results reported in the previous paragraph (equations in Figure 8).
This analysis is subject to a wider uncertainty, as previously explained; nevertheless, it can be useful to achieve a preliminary description of the problem.
Figure 11 shows the results of this analysis: almost 60% of students could be exposed to maximum SPL LAmax due to road traffic noise inside the classroom greater than 55 dB(A).
Referring to the LA1 descriptor, about 45% of students are exposed to hourly levels greater than 45 dB(A).
4. Discussion
According to previous studies, acoustic annoyance at school and in other indoor environments is correlated to environmental noise and to the occurrence of short-duration noise events of great amplitude. These noise events can be measured in terms of maximum sound levels, LAmax, or by means of statistical descriptors, such as LA1. Even so, without the use of long-term measurements, the values of these descriptors are not known for a specific street, since the noise maps drawn by the municipalities for the urban agglomerations show only the values of Lden (or also the facade LAeqd,6–22h level in the case of some Italian maps) for the road traffic noise. Thus, with the aim of better characterizing the acoustic annoyance at school, it is important to define a correlation between the values of Lden and the corresponding values of LAmax and LA1.
In this paper, the linear regression between values of Lden and LAeq,6–22h has been performed versus the hourly values of LAmax and LA1 for the periods 6–20 h (Lden), 6–22 h, and school opening hours 8–17 h (LAeq,6–22h). At 28 urban roads, road traffic noise was monitored for at least one day and hourly values of equivalent, maximum, and statistical levels were measured for each of them. The time interval of one hour has been chosen for the analysis of each descriptor because it corresponds to the length of one lesson in schools and to the typical sampling duration of road traffic noise measurements. Moreover, the better correlation between LA1 and LAeq has been obtained for this time interval.
Since road traffic noise is usually expressed in noise maps in terms of day–evening–night equivalent levels Lden, it was necessary to establish a relationship between this indicator and the hourly equivalent level, LAeqh, used in this study. This has been carried out by means of a dataset of 26,808 hourly values of LAeqh collected by continuous monitoring of 312 urban roads in 38 different Italian towns.
Results reveal that the correlation between predictors (Lden and LAeq,6–22h) and LA1 is good, whereas LAmax shows a greater dispersion of data: about 60% of errors of the estimation of LA1 are in the range ±1.5 dB, while only about 20% of errors of LAmax (hourly values) are in the same range. This is due to the greater variability of LAmax data. Moreover, values of LAmax are strongly influenced by the time interval length with greater values when this time interval is longer. For these reasons, it could be more reliable to use the statistical level LA1 when performing an analysis of the effect of noise levels due to traffic noise on the attention and cognitive impairment at school. This can be considered the main finding of this study at this stage.
These results have been used for a preliminary analysis of the primary and lower secondary schools of Florence as a case study.
The indoor SPL for all the students of the schools of Florence has been estimated assuming that all the facades of each school are exposed to the facade SPL corresponding to the facade directly facing the road. Moreover, average values of facade sound insulation with closed windows and of indoor reverberation time have been considered for the calculation of indoor levels.
Indoor levels have been calculated by means of the equations given by the international standard EN ISO 12354-3 [19].
This kind of analysis, referred to in the case study, is largely precautionary and affected by a wide margin of uncertainty if compared to the correlations previously discussed. Indeed, it would be necessary to determine the actual facade sound insulation and the reverberation time of each classroom, as well as the actual SPL on each school facade. Although the actual performances of the facade sound insulation of many schools are known, it is not possible to give reliable data for each facade of every school. For this reason, at the moment, it is not possible to give indications about the uncertainty of the method, and this analysis will be carried out in the next phase of the research.
In any case, the application of the proposed methodology to the case study of the Municipality of Florence can be useful for a general estimation of students’ exposure to short-duration noise events due to traffic noise.
5. Conclusions
This paper proposes a method to estimate students’ exposure to short-duration noise events of great amplitude. These events can be analyzed through maximum or statistical sound pressure levels due to traffic noise, calculated over a specific time interval. The selection of the appropriate descriptor and of its time interval is very important for the reliability of the analysis.
In this study, the analysis of the linear regression between values of Lden and LAeq,6–22h versus the corresponding hourly values of LAmax and LA1 shows that the distribution of the maximum SPLs is very large. Indeed, this descriptor may be influenced by unusual events, such as the pass-by of very noisy vehicles or sirens. In particular, the correlation between LA1 and Lden is much higher (R2 = 0.66) than that observed for LAmax (R2 = 0.21). Moreover, these correlations are higher when referred to LAeq,6–22h instead of to Lden (R2 = 0.74 for the correlation with LA1 and R2 = 0.26 for LAmax, hourly values in the period 8–17 h).
As a consequence, the statistical level LA1 seems more suitable than LAmax for studying the relationship between acoustic 8–17 h annoyance and occurrence of short-duration noise events. This conclusion could be useful for future studies on this topic and also for the definition of guidelines for the protection of schools from traffic noise.
The analysis of the indoor SPLs for each school, carried out for the case study of the Municipality of Florence, has shown that about 3% of students are exposed to levels greater than 45 dB(A) inside the classroom. According to this outcome, it could be argued that traffic noise is not an important noise source for students. However, the analysis of indoor maximum and statistical levels for each classroom, although affected by great uncertainty, shows that the exposure to short-duration noise events may not be negligible. Indeed, according to this case study, almost 60% of the students of the municipal primary and lower secondary schools of Florence could be exposed to maximum SPL due to road traffic noise inside the classroom greater than 55 dB(A), even exceeding the typical background noise in classrooms by more than 10 dB with closed windows. Nevertheless, it must then be considered that the closed windows condition is not always respected in the spring and summer seasons, so the SPL may be much worse.
This preliminary result will be further analyzed in a future development of this work, in which the actual distribution of the classrooms of each school and the SPL for each facade of the schools will be taken into account.
Acknowledgments
This study is based on results of previous researches carried out by the authors. No funding has been used for this study nor for its publication.
Author Contributions
Giovanni Brambilla provided the measurements in Milan and performed the statistical data analysis; David Casini, Gianfranco Cellai and Simone Secchi carried out the measurements in Florence and Pistoia; Simone Secchi analyzed the sound propagation inside the schools. All authors wrote the paper and gave final approval of the version to be published.
Conflicts of Interest
The authors declare no conflict of interest.
References
- Crook, M.A.; Langdon, F.J. The effects of aircrft noise in schools around London Airport. J. Sound Vib. 1974, 3, 221–232. [Google Scholar] [CrossRef]
- Heft, H. Background and focal environmental conditions of the home and attention in young children. J. Appl. Soc. Psychol. 1979, 9, 47–69. [Google Scholar] [CrossRef]
- Sargent, J.W.; Gidmanm, M.I.; Humphreys, M.A.; Utley, W.A. The disturbance caused to school teachers by noise. J. Sound Vib. 1980, 70, 557–572. [Google Scholar] [CrossRef]
- Bronzaft, A.L. The effect of a noise abatement program on reading ability. J. Environ. Psychol. 1981, 1, 215–222. [Google Scholar] [CrossRef]
- Hetu, R.; Truchon-Gagnon, C.; Bilodeau, S.A. Problems of noise in school settings: A review of literature and the results of an exploratory study. J. Speech Lang. Pathol. Audiol. 1990, 14, 31–38. [Google Scholar]
- Johnson, C.E. Children’s phoneme identification in reverberation and noise. J. Speech Lang. Hear. Res. 2000, 43, 144–157. [Google Scholar] [CrossRef] [PubMed]
- Evans, G.W.; Lercher, P.; Meis, M.; Ising, H.; Kofler, W.W. Community noise exposure and stress in children. J. Acoust. Soc. Am. 2001, 109, 1023–1027. [Google Scholar] [CrossRef] [PubMed]
- Haines, M.M.; Stansfeld, S.A.; Job, R.F.S.; Berglund, B.; Head, J. Chronic aircraft noise exposure, stress responses, mental health and cognitive performance in school children. Psychol. Med. 2001, 31, 265–277. [Google Scholar] [CrossRef] [PubMed]
- Shield, B.; Dockrell, J. The Effects of Noise on Children at School: A Review. Build. Acoust. 2003, 10, 97–116. [Google Scholar] [CrossRef]
- Jones, D.M.; Alford, D.; Bridges, A.; Trembley, S.; Macken, W.J. Organizational factors in selective attention: The interplay of acoustic distinctiveness and auditory streaming in the irrelevant sound effect. J. Exp. Psychol. Learn. Mem. Cogn. 1999, 25, 464–473. [Google Scholar] [CrossRef]
- Dockrell, J.E.; Shield, B.M. Children’s perception of their acoustic environment at home and at school. J. Acoust. Soc. Am. 2004, 115, 2964–2973. [Google Scholar] [CrossRef] [PubMed]
- Shield, B.; Conetta, R.; Dockrell, J.; Connolly, D.; Cox, T.; Mydlarz, C. A survey of acoustic conditions and noise levels in secondary school classrooms in England. J. Acoust. Soc. Am. 2015, 137, 177–188. [Google Scholar] [CrossRef] [PubMed]
- Brambilla, G.; Casini, D.; Cellai, G.; Secchi, S. Characterization of short duration noise events for the evaluation of annoyance in schools exposed to traffic noise. In Proceedings of the 24th International Conference on Sound and Vibrations, London, UK, 23–27 July 2017. [Google Scholar]
- World Health Organization (WHO). Burden of Disease from Environmental Noise—Quantification of Healthy Life Years Lost in Europe. 2011. Available online: http://www.euro.who.int/__data/assets/pdf_file/0008/136466/e94888.pdf (accessed on 24 January 2018).
- Lercher, P.; Evans, G.W.; Meis, M. Ambient noise and cognitive processes among primary school children. Environ. Behav. 2003, 35, 725–735. [Google Scholar] [CrossRef]
- Noise Exposure and Cognitive Performance—Children and the Elderly as Possible Risk Groups, WHO Brussels. 2003. Available online: http://www.jwairfair.com/images/children_noise_airport_hygge.pdf (accessed on 24 January 2018).
- Hygge, S.; Boman, E.; Enmarker, I. The effects of road traffic noise and meaningful irrelevant speech on different memory systems. Scand. J. Psychol. 2003, 44, 13–21. [Google Scholar] [CrossRef] [PubMed]
- The Effects of Classroom and Environmental Noise on Children’s Academic Performance. Available online: http://www.icben.org/2008/PDFs/Shield_Dockrell.pdf (accessed on 24 January 2018).
- EN ISO 12354–3:2017, Building Acoustics, Estimation of Acoustic Performance of Buildings from the Performance of Elements—Part 3: Airborne Sound Insulation Against Outdoor Sound. Available online: https://www.iso.org/standard/70244.html (accessed on 3 March 2018).
- Machimbarrena, M.; Rasmussen, B. Comparison of acoustic regulations for housing and schools in selected countries in Europe and South America—A pilot study. In Proceedings of the 22nd International Congress on Acoustics, Buenos Aires, Argentina, 5–9 September 2016. [Google Scholar]
- Determinazione dei Requisiti Acustici Passivi Degli Edifici. Available online: http://www.gazzettaufficiale.it/eli/id/1997/12/22/97A10190/sg (accessed on 24 January 2018).
- Applicazione Delle Metodologie di Calcolo Delle Prestazioni Energetiche e Definizione Delle Prescrizioni e dei Requisiti Minimi Degli Edifici. Available online: http://www.sviluppoeconomico.gov.it/index.php/it/normativa/decreti-interministeriali/2032966-decreto-interministeriale-26-giugno-2015-applicazione-delle-metodologie-di-calcolo-delle-prestazioni-energetiche-e-definizione-delle-prescrizioni-e-dei-requisiti-minimi-degli-edifici (accessed on 24 January 2018).
- UNI 11367:2010, Building Acoustics—Acoustic Classification of Building Units—Evaluation Procedure and In Situ Measurements. Available online: http://store.uni.com/catalogo/index.php/uni-11367-2010.html?josso_back_to=http://store.uni.com/josso-security-check.php&josso_cmd=login_optional&josso_partnerapp_host=store.uni.com (accessed on 24 January 2018).
- Di Bella, A.; Fausti, P.; Scamoni, F.; Secchi, S. Italian experiences on acoustic classification of buildings. In Proceedings of the 41st International Congress and Exposition on Noise Control Engineering, New York, NY, USA, 19–22 August 2012. [Google Scholar]
- Secchi, S.; Scrosati, C.; Casini, D.; Cellai, G.; Busa, L.; Scamoni, F. Typical acoustical performances of facades of Italian schools: The effect of the outdoor noise on the indoor acoustic comfort. In Proceedings of the INTER-NOISE 2016—45th International Congress and Exposition on Noise Control Engineering: Towards a Quieter Future, Hamburg, Germany, 21–24 August 2016. [Google Scholar]
- Casini, D.; Cellai, G.; Secchi, S.; Fogola, J.; Scamoni, F. Urban noise and required facade acoustic insulation of buildings: The case of some agglomerations in Italy. In Proceedings of the 22nd International Congress on Sound and Vibration, Florence, Italy, 12–16 July 2015. [Google Scholar]
- World Health Organization (WHO). Guidelines for Community Noise. Available online: http://whqlibdoc.who.int/hq/1999/a68672.pdf (accessed on 24 January 2018).
- Samuels, S.E.; Parnell, J. Peak noise events occurring in road traffic noise. In Proceedings of the 2004 Annual Conference of the Australian Acoustical Society, Gold Coast, Australia, 3–5 November 2004. [Google Scholar]
- Campbell, J.A.; Parnell, J. A vehicle maximum noise level study. In Proceedings of the 2004 Annual Conference of the Australian Acoustical Society, Gold Coast, Australia, 3–5 November 2004. [Google Scholar]
- RTA Environmental Noise Management Manual. Available online: http://www.rms.nsw.gov.au/business-industry/partners-suppliers/documents/guides-manuals/environmental-noise-management-manual.pdf (accessed on 24 January 2018).
- Schreurs, E.; Brown, L.; Tomerini, D. Maximum pass-by noise levels from vehicles in real road traffic streams: Comparison to modelled levels and measurement protocol issues. In Proceedings of the 45th International Congress on Noise Control Engineering, Osaka, Japan, 21–26 August 2011. [Google Scholar]
- Directive 2002/49/EC of the European Parliament and of the Council of 25 June 2002 Relating to the Assessment and Management of Environmental Noise—Declaration by the Commission in the Conciliation Committee on the Directive Relating to the Assessment and Management of Environmental Noise. Available online: http://eur-lex.europa.eu/legal-content/EN/TXT/?uri=celex%3A32002L0049 (accessed on 25 June 2002).
- Determinazione dei Valori Limite Delle Sorgenti Sonore. Available online: http://www.masterambiente.unimi.it/1024/materiali/dpcm14nov1997.pdf (accessed on 14 November 1997).
- Brambilla, G.; Gallo, V. Andamenti dei livelli LAeq orari nelle 24 ore del rumore urbano e indicazioni per il campionamento spaziale stratificato (24-hour time pattern of hourly LAeq of urban noise and indications for stratified spatial sampling). In Proceedings of the AIA, Siracusa, Italy, 26–28 May 2010. [Google Scholar]
- Noise Map of Florence. Available online: http://sira.arpat.toscana.it/sira/mappa_acustica_Firenze_new.html (accessed on 24 January 2018).
- ISO 16283–1:2014, Acoustics—Field Measurement of Sound Insulation in Buildings and of Building Elements—Part 1: Airborne Sound Insulation. Available online: https://www.iso.org/standard/55997.html (accessed on 3 March 2018).
- ISO 717–1:2013, Acoustics—Rating of Sound Insulation in Buildings and of Building elements—Part 1: Airborne Sound Insulation. Available online: https://www.iso.org/standard/51968.html (accessed on 3 March 2018).
- EN 12354–6:2003, Building Acoustics—Estimation of Acoustic Performance of Buildings from the Performance of Elements—Part 6: Sound Absorption in Enclosed Spaces. Available online: https://www.en-standard.eu/csn-en-12354-6-building-acoustics-estimation-of-acoustic-performance-of-buildings-from-the-performance-of-elements-part-6-sound-absorption-in-enclosed-spaces/ (accessed on 3 March 2018).
- Secchi, S.; Astolfi, A.; Calosso, G.; Casini, D.; Cellai, G.; Scamoni, F.; Scrosati, C.; Shtrepi, L. Effect of outdoor noise and facade sound insulation on indoor acoustic environment of Italian schools. Appl. Acoust. 2017, 126, 120–130. [Google Scholar] [CrossRef]
- Italian National Registry of School Buildings. Available online: http://cercalatuascuola.istruzione.it/cercalatuascuola/ (accessed on 24 January 2018).
Figure 1.
Linear regression between LAmax and LAeq (a) and LA1 and LAeq (b) measured in a street at different time intervals (1 h, 10 min and 1 min).
Figure 1.
Linear regression between LAmax and LAeq (a) and LA1 and LAeq (b) measured in a street at different time intervals (1 h, 10 min and 1 min).

Figure 2.
Linear regression between Lden and LAeqd,6–20h (a), Lden and LAeq,8–17h (b), LAeqd,6–22h and LAeq,8–17h (c).
Figure 2.
Linear regression between Lden and LAeqd,6–20h (a), Lden and LAeq,8–17h (b), LAeqd,6–22h and LAeq,8–17h (c).


Figure 3.
Road traffic noise map of the center of Florence; the colors of the map refer to values of Lden, while values in the box refer to the SPL in the facade of the buildings, expressed with the Italian indicators for day-time and night-time (LAeqd,6–22h and LAeqn,22–6h, respectively).
Figure 3.
Road traffic noise map of the center of Florence; the colors of the map refer to values of Lden, while values in the box refer to the SPL in the facade of the buildings, expressed with the Italian indicators for day-time and night-time (LAeqd,6–22h and LAeqn,22–6h, respectively).

Figure 4.
Number of schools and students in the municipality of Florence.

Figure 5.
Typical distribution of traffic noise on the facades of a school located near a busy road.
Figure 5.
Typical distribution of traffic noise on the facades of a school located near a busy road.

Figure 6.
Linear regressions between hourly values of both LAmax and LA1 versus Lden for all the streets.
Figure 6.
Linear regressions between hourly values of both LAmax and LA1 versus Lden for all the streets.

Figure 7.
Linear regressions between hourly values in the interval 6–22 h of both LAmax and LA1 versus LAeq,6–22h for all the streets.
Figure 7.
Linear regressions between hourly values in the interval 6–22 h of both LAmax and LA1 versus LAeq,6–22h for all the streets.

Figure 8.
Linear regressions between hourly values in the interval 8–17 h of both LAmax and LA1 versus LAeq,6–22h for all the streets.
Figure 8.
Linear regressions between hourly values in the interval 8–17 h of both LAmax and LA1 versus LAeq,6–22h for all the streets.

Figure 9.
Distribution of the primary and secondary schools of Florence (in blue) in the noise map of the Municipality.
Figure 9.
Distribution of the primary and secondary schools of Florence (in blue) in the noise map of the Municipality.

Figure 10.
Distribution of the facade SPL (LAeqd,8–17h) and of the indoor SPL (LAeqd,8–17h) to which the students of primary and lower secondary schools of Florence were exposed.
Figure 10.
Distribution of the facade SPL (LAeqd,8–17h) and of the indoor SPL (LAeqd,8–17h) to which the students of primary and lower secondary schools of Florence were exposed.

Figure 11.
Distribution of the maximum (LAmax) and statistical (LA1) SPL inside the classrooms estimated for the students of primary and lower secondary schools of Florence.
Figure 11.
Distribution of the maximum (LAmax) and statistical (LA1) SPL inside the classrooms estimated for the students of primary and lower secondary schools of Florence.

© 2018 by the authors. Licensee MDPI, Basel, Switzerland. This article is an open access article distributed under the terms and conditions of the Creative Commons Attribution (CC BY) license (http://creativecommons.org/licenses/by/4.0/).
Share and Cite
MDPI and ACS Style
Secchi, S.; Brambilla, G.; Casini, D.; Cellai, G.
A Method to Estimate Students’ Exposure to Road Traffic Noise Events
. Environments 2018, 5, 39.
https://0-doi-org.brum.beds.ac.uk/10.3390/environments5030039
AMA Style
Secchi S, Brambilla G, Casini D, Cellai G.
A Method to Estimate Students’ Exposure to Road Traffic Noise Events
. Environments. 2018; 5(3):39.
https://0-doi-org.brum.beds.ac.uk/10.3390/environments5030039
Secchi, Simone, Giovanni Brambilla, David Casini, and Gianfranco Cellai.
2018. "A Method to Estimate Students’ Exposure to Road Traffic Noise Events
" Environments 5, no. 3: 39.
https://0-doi-org.brum.beds.ac.uk/10.3390/environments5030039
Note that from the first issue of 2016, this journal uses article numbers instead of page numbers. See further details here.