1. Introduction
The first scientific works on sound environment can be traced back to the essays of the Canadian composer R. Murray Schafer in his book “The tuning of the world” [
1], which was the first to discuss the neologism of soundscape in order to describe “an environment of sound (or sonic environment) with emphasis on the way it’s perceived and understood by the individual, or by a society”. Since this first definition, the notion of sound environment had the objective of characterizing the perception by a group of individuals, which also depends on a spatial context and a particular culture. This notion has made it possible to propose a qualitative approach to sounds that analyzes the natural dimensions of these landscapes, and classifies landscapes in order to preserve them. Within the context of the transport outburst (cars, buses, railways, aircrafts, etc.) in Europe and other industrialized countries, the first crises in the energy field, have awakened different social groups and research teams toward an environmental conscience that marked the beginnings of environmental noise research.
At the same time, in Grenoble (France), Jean-François Augoyard, of the research center on Sound Environment and built Space (CRESSON), with his young team of acousticians and architects, explored the notion of sound effect in a similar logic, proposing for the first time a repertoire of sound effects [
2] in order to describe the interactions of the sound environment with the actions and the perception of the inhabitants [
3]. Based on that work, this group has been able to propose a concept formalization of the sound environment that includes not only the ecological approach of Murray Schafer, but also relative works in acoustic engineering [
4,
5]. Actually, this research aims to define the environment in the way we’re listening to it, and it’s the reason why it develops this idea of three different dimensions of the sound environment:
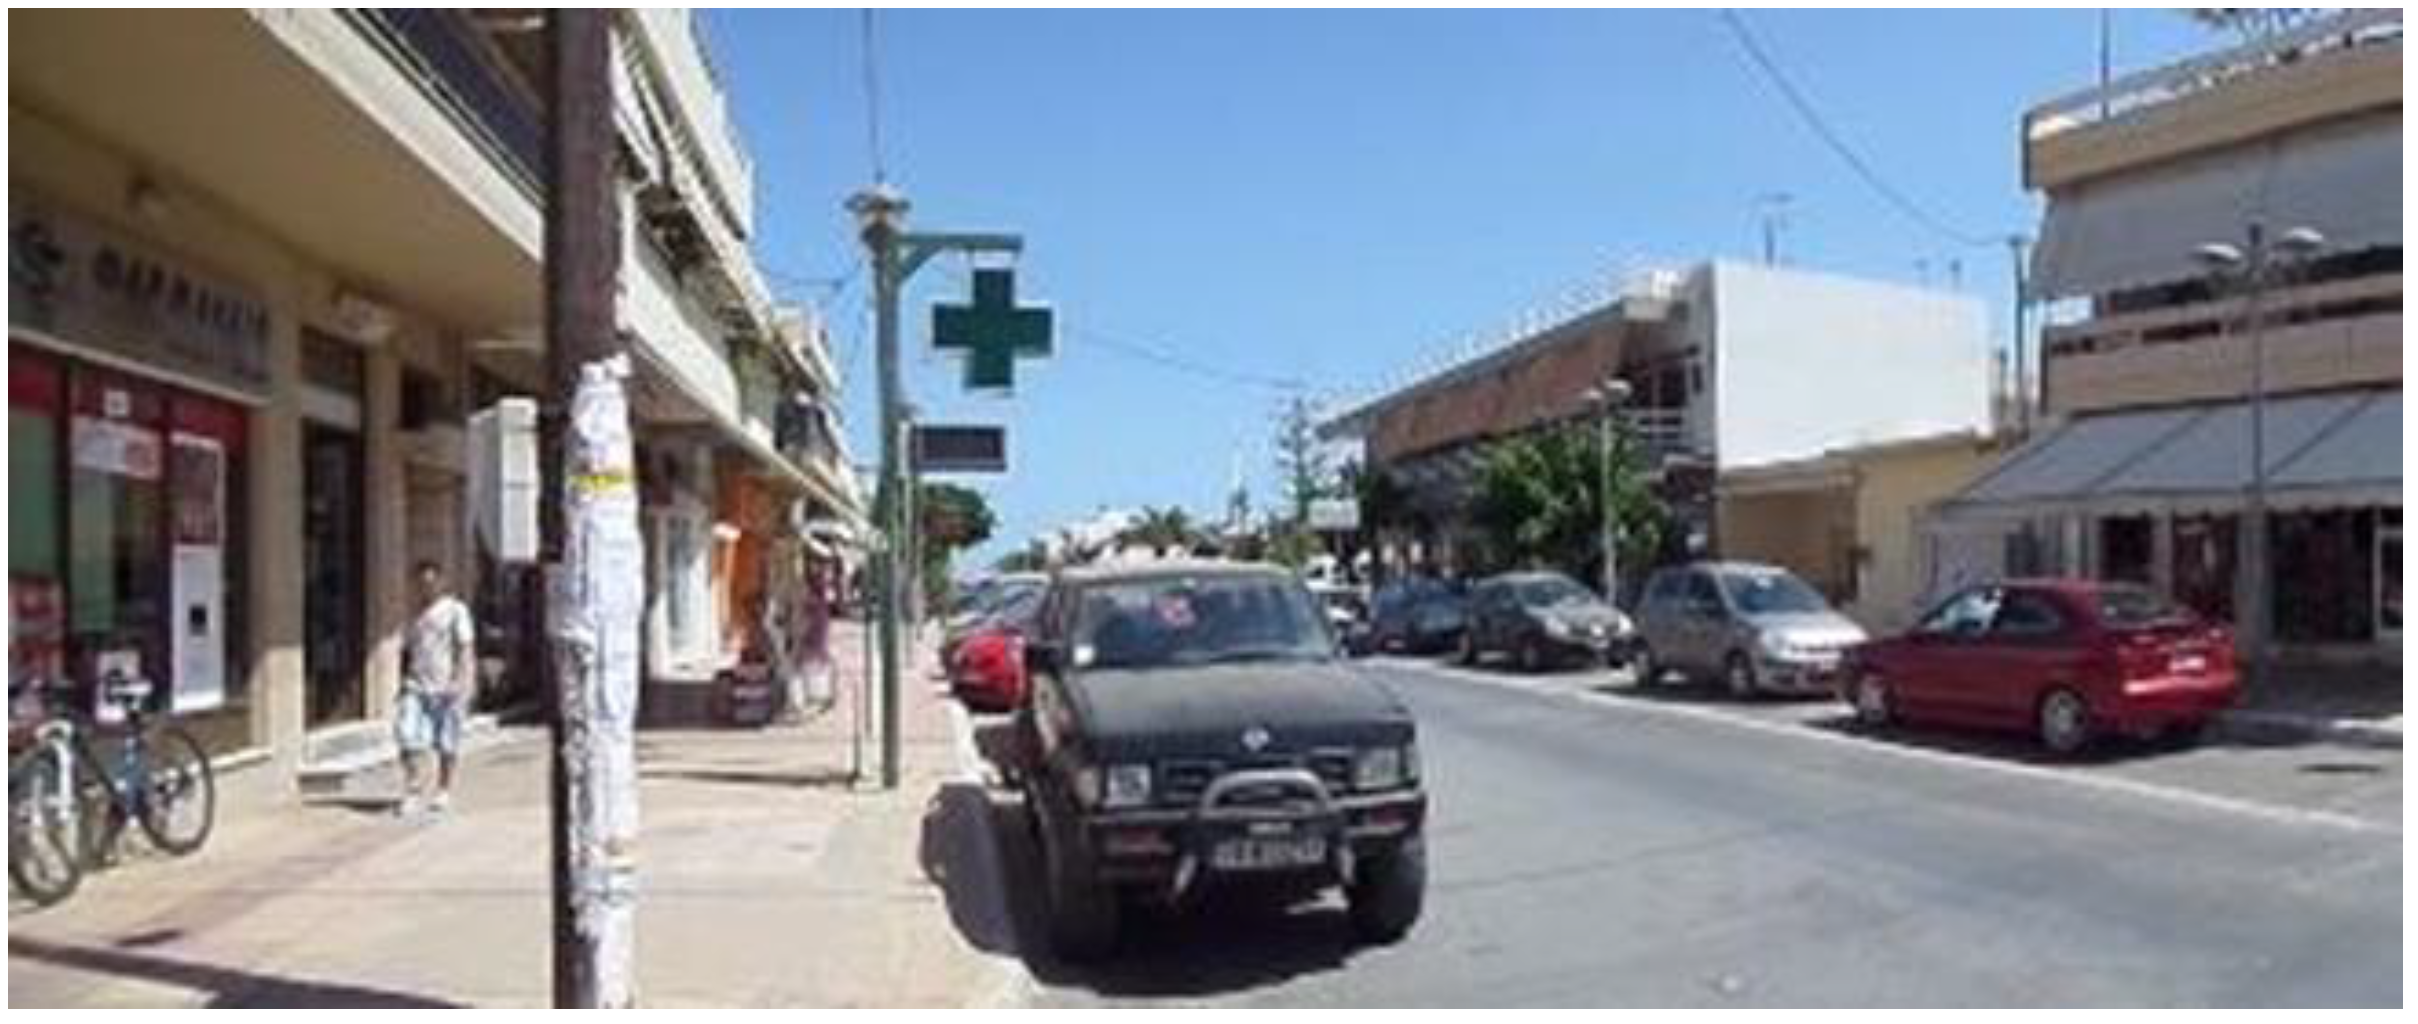
Environmental dimension level describing all physical, emission, and propagation characteristics for all types of environmental sound sources, including e.g., noise barriers and various propagation obstacles, road surface characteristics, urban terrain morphology, shape and use of buildings, etc. (see
Figure 1 as an example). This dimension is quite predictable and permits evaluating with high accuracy i.e., the quantity aspect in noise reduction resulting from various mitigation choices.
Figure 1 illustrates visually an analysis of the environmental dimension containing e.g., street morphology, building heights, terrain morphology, urban road width, traffic synthesis, human activities, etc.
Social practices dimension level (milieu dimension), describing all of the uses that the area already offers, and additionally any other uses that may additionally be offered, as well as acting on a master land use plan level that welcomes (or discourages) some distinct uses, such us open-to-public or “intra muros” spaces, restaurants, cafés, bars, public places, schools, playgrounds, markets allowing multiple events, etc. This dimension level is not fully predictable, but the possibility of choosing to implement or avoid and even exclude certain activities may affect the global acoustic environment.
Figure 2 illustrates the milieu dimension that analysis contains.
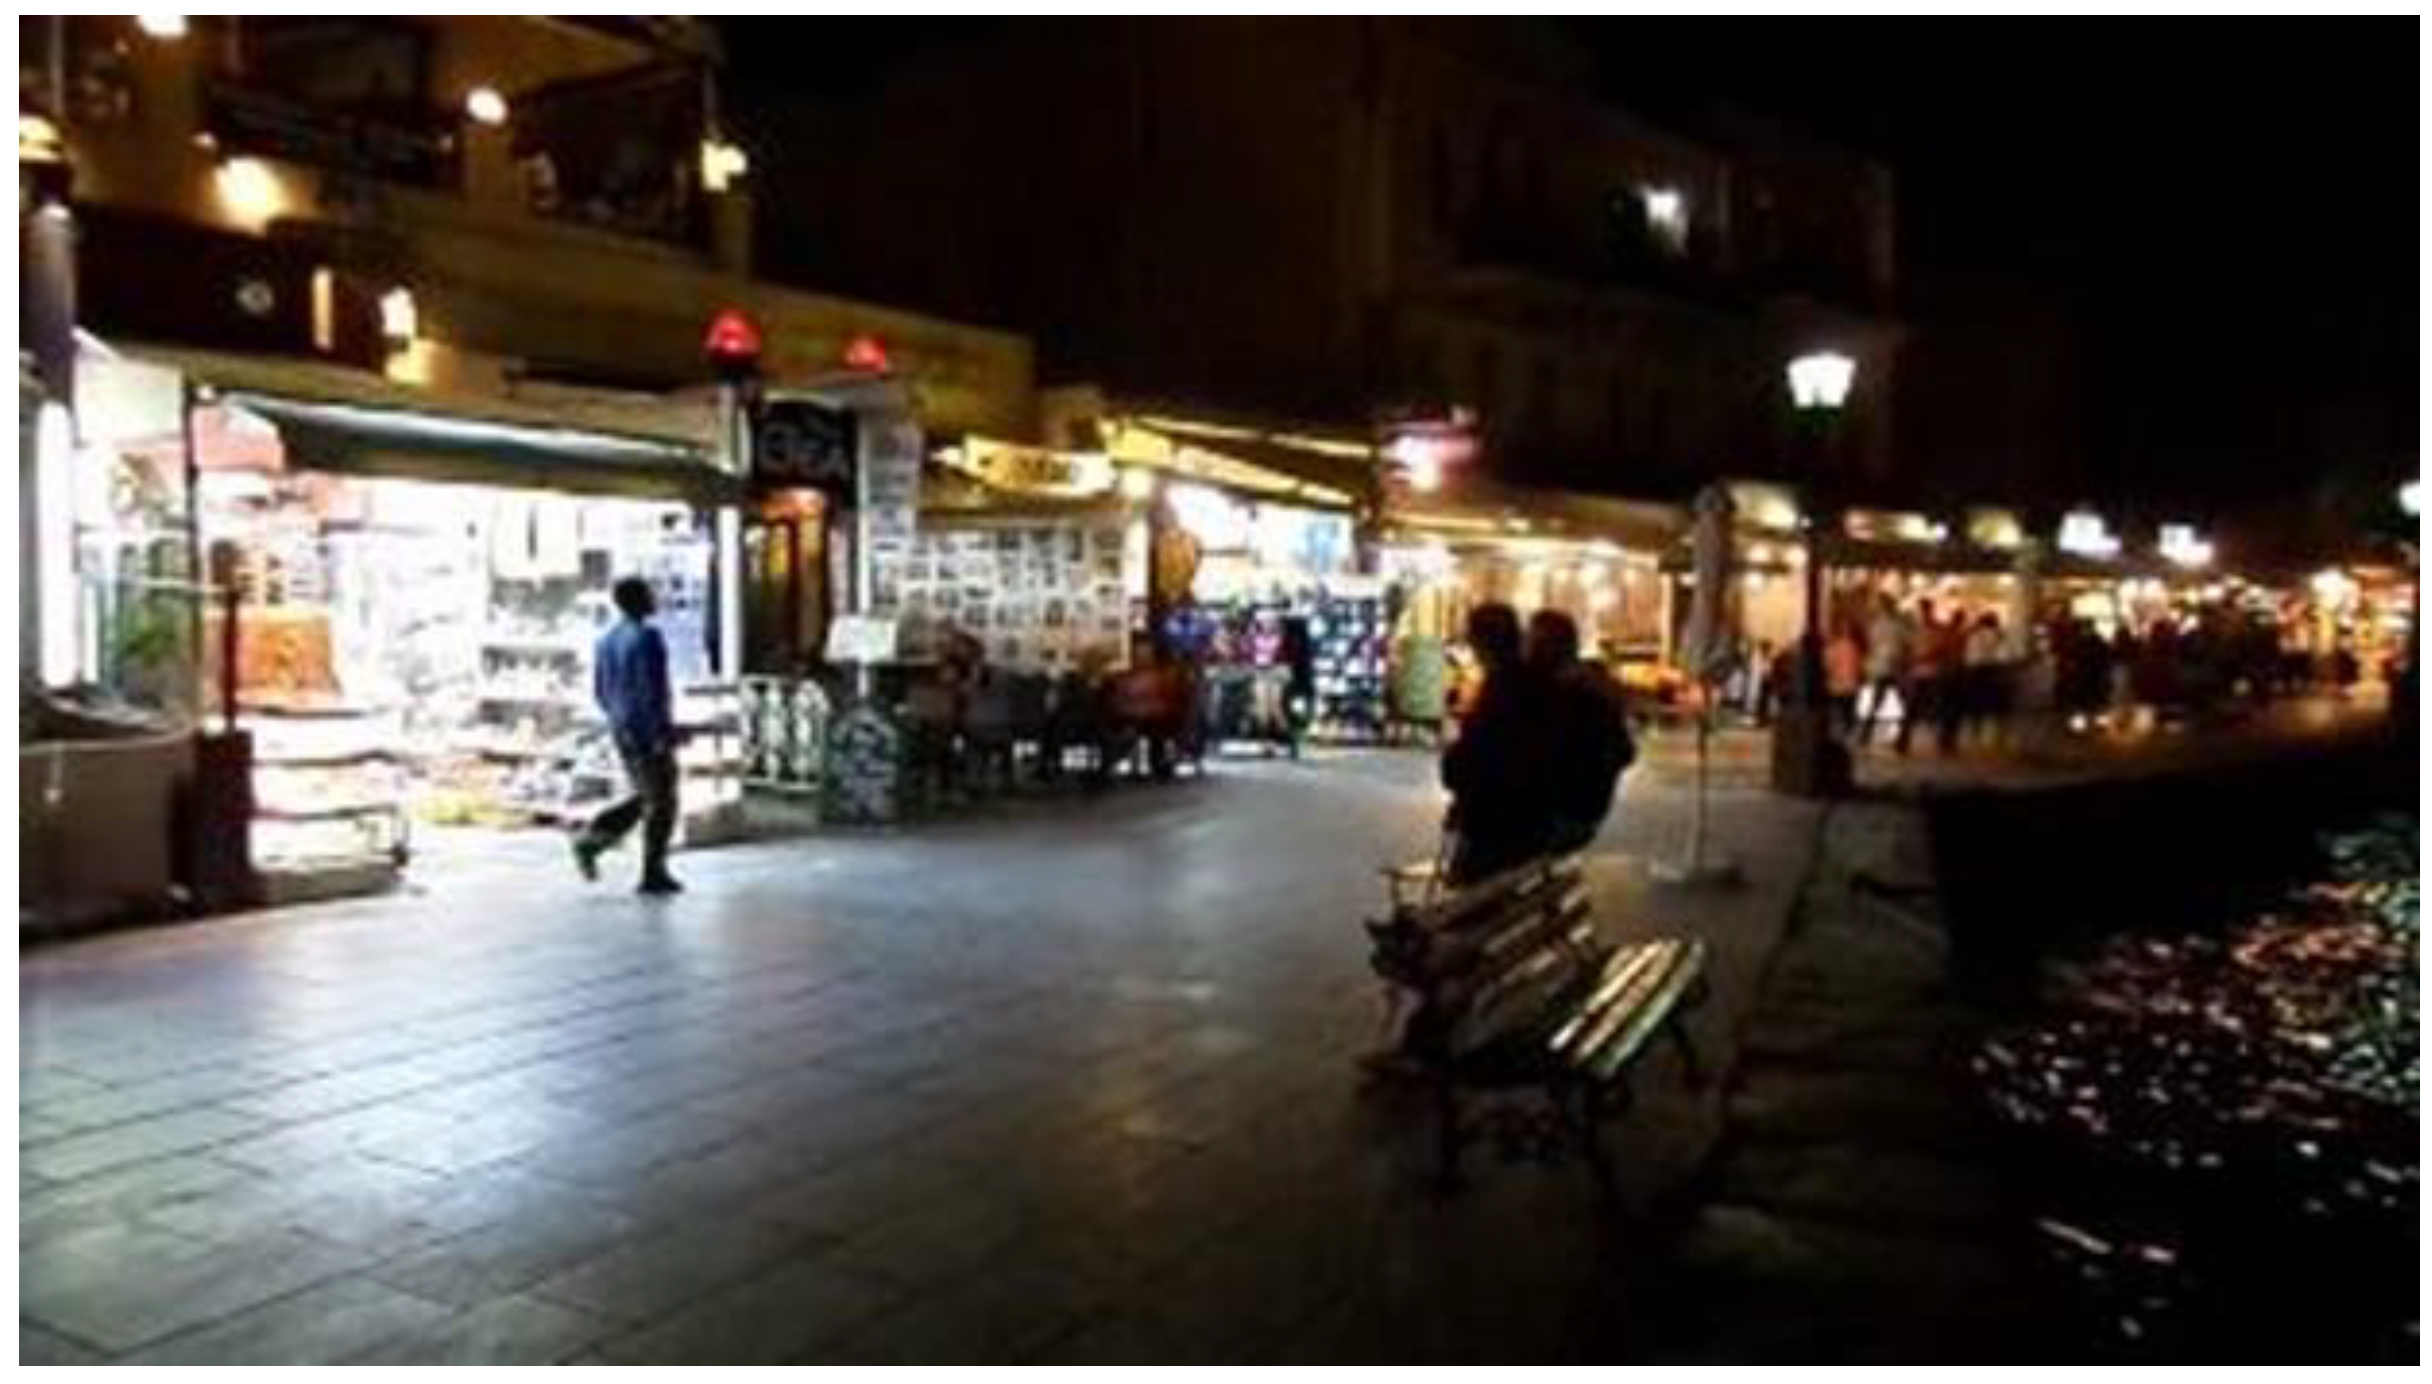
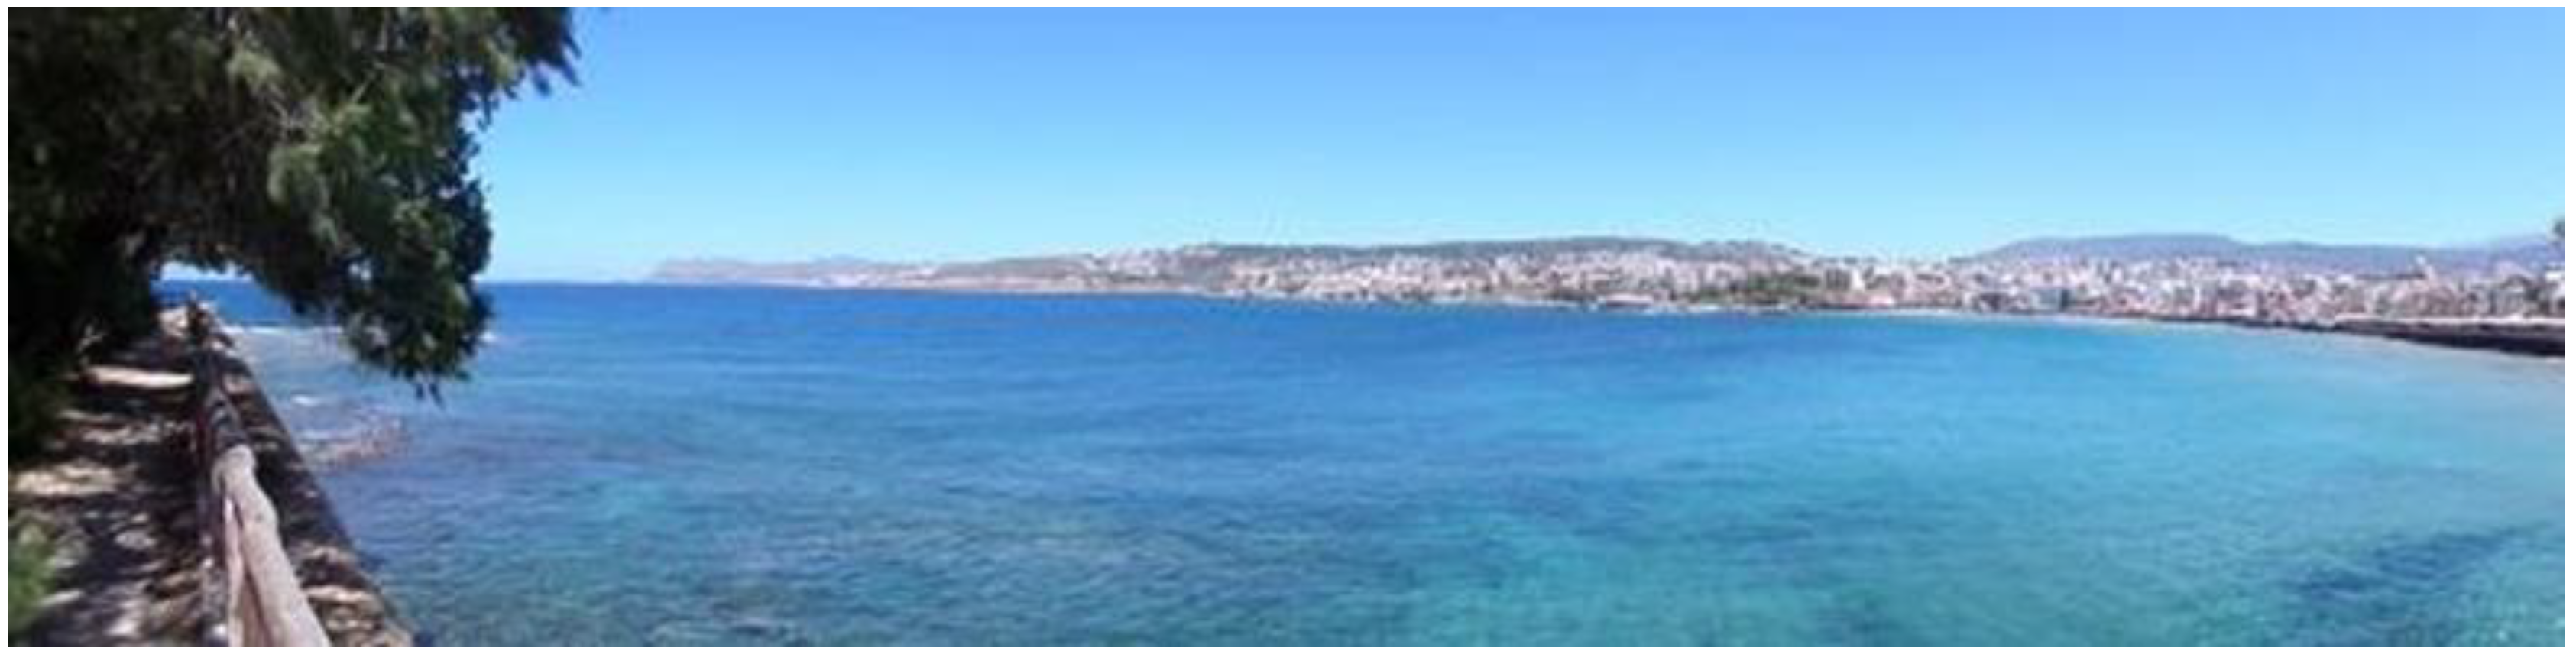
Soundscape dimension level, characterizing the most aesthetic and symbolic links that residents establish with the particular sounds of their neighborhood. These are highly valued by their aesthetic characteristics, such as some natural sounds, city sounds, e.g., church bells, markets, play-yards, etc. (see
Figure 3 as an example). This dimension is also quite difficult to predict; however, it contains an important factor for the success of a broader noise action plan.
Figure 3 illustrates visually an urban agglomeration location in Chania (old city port) where both inhabitants and tourists can rest and enjoy the spatial landscape with the adjoining soundscape. This view presents the dimensions of the sound environment to focus on. The sources and their relative impact on people’s perception were therefore described in order to understand where people may enjoy the soundscape’s full length in each location, and eventually the minimal conditions of their existence.
In this context, we are guided by other similar studies in the area of the visual perception influence of a sound source, such as Violon and Lavandier [
6], and especially for the case study on Chania regarding the sources related to a port and its activities, and also relevant analysis from Badino and Borelli [
7]. The above references are obviously very interesting for this approach; however, we consider that they are too focused on the perception of a particular sound, and that they do not give the acousticians and the city decision-makers the tools to propose adjustments at a larger scale e.g., on a neighborhood or city level. The inhabitants of the examined neighborhoods describe the sounds (noisy or not) that they experience (like, dislike, useful, or not) in their neighborhood, and our analysis aims to incorporate them into the action plans according to the provisions of the 2002/49/EC European directive. Good practices for maritime cities and also several types of urban areas, especially medium-size cities, are needed that aim to complement good practice guides for acoustic quantitative data collection and its representation [
8].
Transportation engineers have also focused on developing tools for environmental noise control. Since the first works of Luquet and Komorn [
9], which contained the definition of the short Leq, engineers have developed measurement equipment and protocols as well as several acoustic criteria in order to explain and predict noise propagation and the exposure of inhabitants to noise. In this way, some 30 years after the beginning of modern acoustics, we can consider the European directive 2002/49 EU as a document of reference that summarizes the advances regarding the management and rehabilitation of the noise environment. It allows European Union (EU) member states to measure or simulate environmental noise propagation in an unambiguous and homogeneous way throughout Europe. However, the choice of the given common criteria, e.g., L
den and L
night, is still under discussion in order to evaluate its potential to represent the perception of inhabitants; these indices adequately quantify the exposure of a population to the environmental noise from transport. This homogeneous approach introduces a unique advantage to share within the EU member states, a common vocabulary, by offering the capacity to compare results at the European, national, and local level, articulating modern regulations as well as the level of noise abatement actions. The European Environment Agency regularly publishes comparative results and reports data on noise exposure covered by directive 2002/49/EC [
10,
11].
Therefore, it is considered that the notion of sound environment refers to all of the sources and sound productions of a place, whether or not they are covered by the above-mentioned European directive on environmental noise: it includes noises from transport and industrial sites, but also human activities linked with the places and sounds of nature. It’s for this reason that in this approach, a comprehensive method is proposed in order to complete the Strategic Noise Maps (SNM), introducing a series of layers focusing on the qualitative dimensions of the sound environment. The cross-analysis of these documents enables updating the noise action plan that can then be enriched by the goal of rehabilitating the sound environment. In this sense, in a way to create the sound environment of tomorrow, a design for a sustainable sound environment is assessed and proposed.
2. State of Art of the Studies on the Sound Environment
2.1. Noise, Environment, Soundscape
For more than 20 years, a double movement in studies on the sound environment is ongoing. First of all, acoustic engineering is becoming more and more open to other disciplines such as geography, urban planning, statistics, and sociology, in order to better understand all of the dimensions of the issue. In this sense, all of the works on geographic information systems (GIS) to represent and manage sound environments consist of an interesting evolution. From simple geolocalization and the representation of noise measurements on a map [
12] to experimental works that propose expert or simplified tools for authorities to manage the sound environment [
13], most of the research works in this branch use cartography tools in order to summarize several analyses and discuss the results in between disciplines, including: acoustics, transport analysis, topography, geography, town planning, and architecture. In this logic, Greece developed such a methodology since its first SNM for the cities of Volos and Larissa in central Greece [
14].
At the same time, acousticians and soundscapers are also trying to define criteria in order to assess soundscapes and generalize their studies in multiple and diverse contexts. Many works follow principles tested by room acoustics studies and psychoacoustics [
15,
16,
17,
18] and try to find new criteria that can articulate simulation or measured values with perception quality assessments. For example, recent works by Rychtáriková and Gerrit [
19] try to automatically classify soundscapes through a set of acoustic criteria as “related to the sound intensity (defined through sound pressure level), temporal changes of the sound, evaluated through roughness and fluctuation strength, frequency spectrum (via the sharpness parameter), and spaciousness via the so-called urban
inter-aural level difference” [
19]. Although significant progress has been made since the earliest works, an in situ approach involves taking into account other variable dimensions such as multisensory perception and user actions [
20]. Therefore, the main issue is how this directive can be supplemented to address the qualitative dimensions of all of the sound sources in the environment [
21].
2.2. Quiet Zones and Sound District Identities
Under directive 2002/49, it was also possible for urban agglomeration, in addition to SNM, to identify and protect quiet zones in several districts. According to the directive, each member state is free to use its own criteria and determine under what conditions an area can be qualified as “quiet”. Many works has shown that the notions of quietness and silence are very subjective [
22] and differ depending on the country and/or the community in question [
23]. For example, it has been shown that quiet areas can be qualified as areas where you can meet people; therefore, it does not mean that it’s absolutely silent. A fundamental discrimination also needs to be introduced at urban agglomerations of more than one million inhabitants and cities with more than 100,000 inhabitants where the conditions of creating and managing possible quiet areas cannot be compared. In other words, the European directive is quite difficult to impose on member states, since it assigns only a single value for quiet areas to account for dissimilarities between cities of different size and/or different cultures.
The differences in climate within the area of the countries covered by the directive are also an important reason why the strict application of any acoustic criteria to determine quiet areas is difficult (see
Table 1). In Southern Europe, the definition between the beginning and the end of the day periods, the evening, and the night in the calculation of L
den are already under discussion, and are not necessarily based on the way of life of the inhabitants [
24]. For example, comparing 24 h noise measurements, i.e., in Athens’ ring road, it was established that the L
eq value (1 h) falls between 3 a.m. and 5 a.m.; meanwhile, in other European capitals that are further north, such as Paris, the city falls asleep earlier (between 2 a.m. and 4 a.m.).
In this general context, in a significant number of cities and urban agglomerations of Greece, a different approach was proposed (between the time period 2012–2016), which is presented hereafter. This approach aims to overcome the inevitable measures of noise control of any Noise Action Plan (NAP) in order to also provide a Sound Environment Action Plan (SEAP). In other words, this new form of noise action plan is not only dedicated at reducing—by abatement measures—the Lden levels in the most “noisy” areas, it also proposes a set of comprehensive acoustic and non-acoustic actions for selected urban neighborhoods in order to preserve, transform, or recreate a sustainable sound environment for the inhabitants.
This paper offers a summary description of the method illustrated by the studies that have been carried out for the cities of Volos, Larissa, Heraklion, Chania, Agrinio, Corfu, and Thessaloniki [
14,
21,
25,
26,
27,
28] in the frame of directive 2002/49 [
29].
3. Methodology: Interdisciplinary Approach
The multidisciplinary approach in this paper proposes an articulation between the quantitative analyses as described by the directive, and a qualitative analysis based on the constitution of a series of maps.
3.1. Strategic Noise Map and Noise Action Plans
The European directive has created the necessary conditions for the EU member states to consider various ways to manage environmental noise. It’s based on the choice of common noise criteria, a common calculation mode, and finally a common representation mode. Since its first release, several modifications have been implemented in order to improve the model and the relevant calculation methodologies. For example, noise from scooter and motorbikes was not initially taken into account in the calculation of noise levels from road traffic [
30]. However, today, both the new CNOSSOS-EU and the NMPB [
31,
32] methods offer the prediction of sound levels in order to meet regulatory constraints, anticipate a grim situation, and design or optimize solutions to reduce noise. They allow, with an acceptable relative precision, the treatment of important problems of a larger scale (urban district, city, agglomeration, infrastructure network), and adaptation to the complexity of the sites (topological, geometries, propagation conditions).
Directive 2002/49 (annex I and III) and its new release, 2015/996 (CNOSSOS-EU, annex I), propose recommendations to the stakeholders in order to produce their Strategic Noise Maps and the associated action plans. During this phase, the strategic noise maps were produced with the use of Cadnaa Software calibrated by several on site 24-h measurements. It is based on a spatial three-dimensional (3D) model imported from the urban services of each agglomeration, which was always updated by several in situ observations. The 3D model was also linked to the Geographical Information System of the city in order to manage, analyze, and graphically present all of the georeferenced data and results.
3.2. Sound Environment Mapping
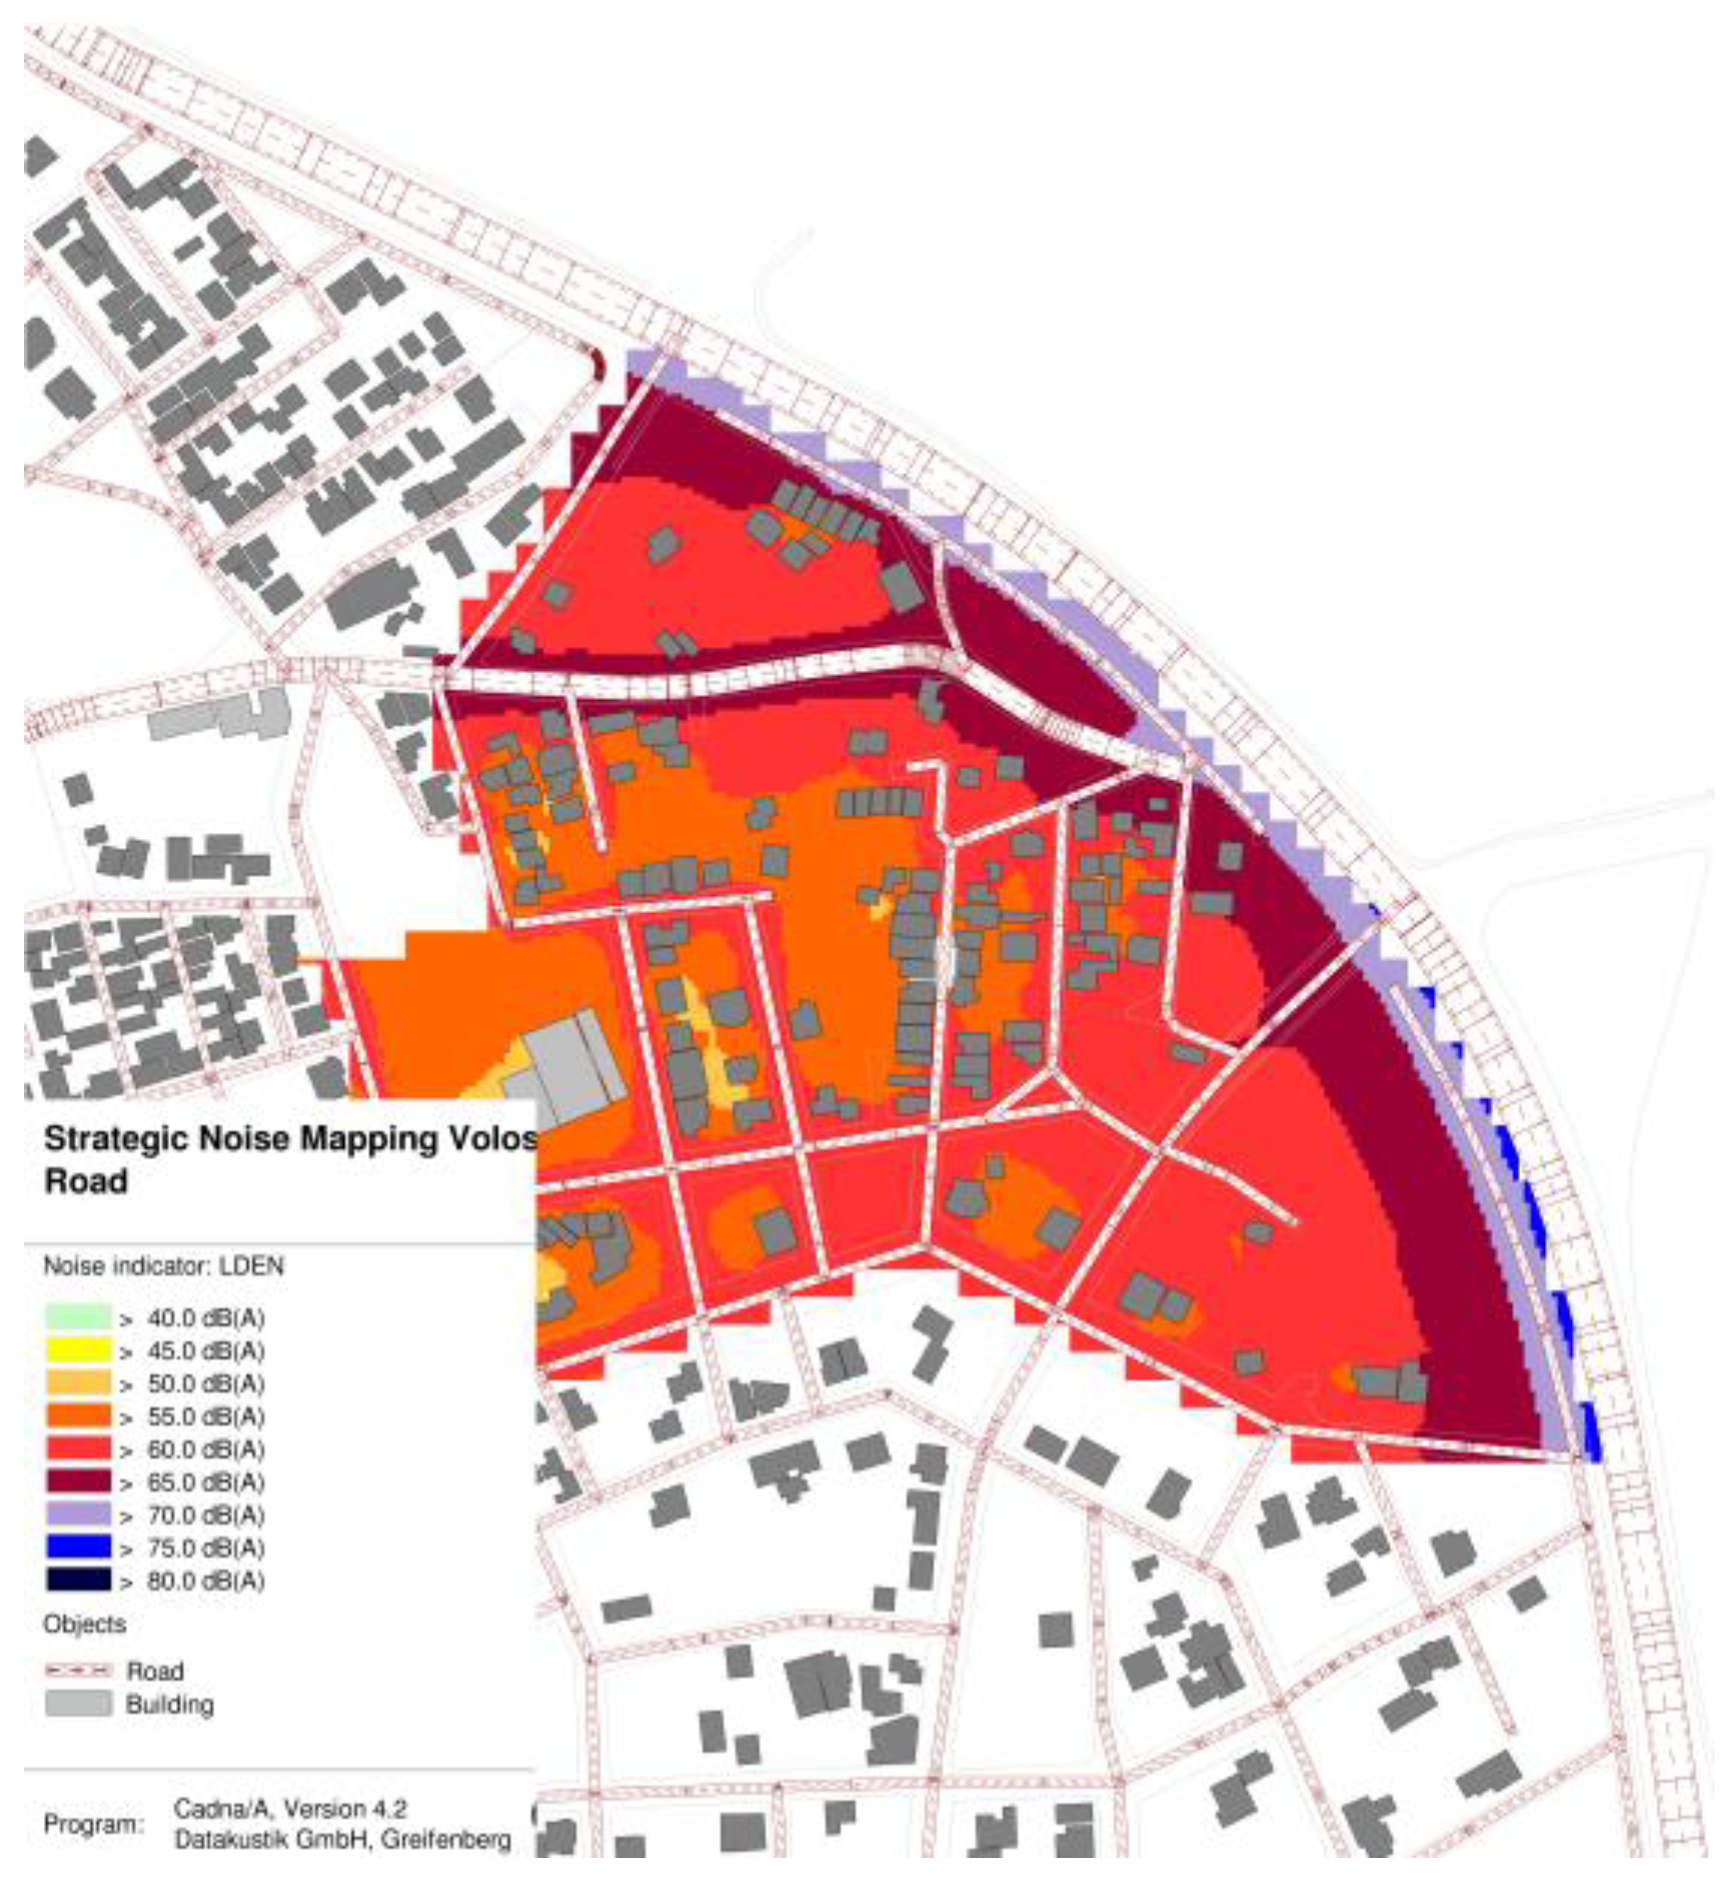
Although major developments have been implemented in the new framework (CNOSSOS-EU), it’s also important to integrate sound sources related to human activities (leisure, work, neighborhoods) in order for them to be taken into account in the evaluation. The noise maps of specific noise sources, such as transportation networks, cannot take other sources that participate in the formation of the rich sound envelope in which we live into account. In the period between 2012–2016, in the urban agglomerations of Volos (
Figure 4), Larissa, Chania, Heraklion, Corfu, Agrinio, and Thessaloniki, such methodology has been applied and implemented in particularly selected urban areas due to their special sound identities. In many cases, these urban areas have been chosen because of their proximity to a main transportation network node (peripheral road and train stations in Volos, or train lines in Larissa, or international airports such as Heraklion and Corfu). Some of these Urban Areas have also been selected because they are expected to experiment with a major modification of the existing local network of mass transportation (such as the relocation of the international airport of Heraklion, or the opening of the new metro line in Thessaloniki, etc.). Some urban agglomerations were also interesting case studies for testing the possible modification and reorganization of their traffic plans (Volos city center, Larissa, Agrinio, Thessaloniki), including also the impact of mitigating noise by specific measures such as noise barriers, the introduction of urban roundabouts (Volos), or pedestrian corridor projects (Volos, Thessaloniki). Whatever the particular case studied, an in-depth evaluation of the environmental qualities and relevant noise problems in these urban neighborhoods was introduced.
The objective of the analysis was to evaluate the environmental noise and propose appropriate mitigation measures. Beyond that, these cases studies aimed at the qualitative dimensions of the environment, and by setting up a cartography, we propose tools to analyze the existing environment and positive evolutions of the sound environment. By reducing the scale of the analysis (from the urban agglomeration scale to the neighborhood scale), it was possible to analyze the given district at a “street-by-street” “block-by-block”, or even “building-by-building” level, and therefore access the relation between the existing urban form and the sound propagation. In addition to the SNM approach, several type of maps are introduced in order to better understand the appearance and the propagation conditions of the main sound sources in the selected urban areas.
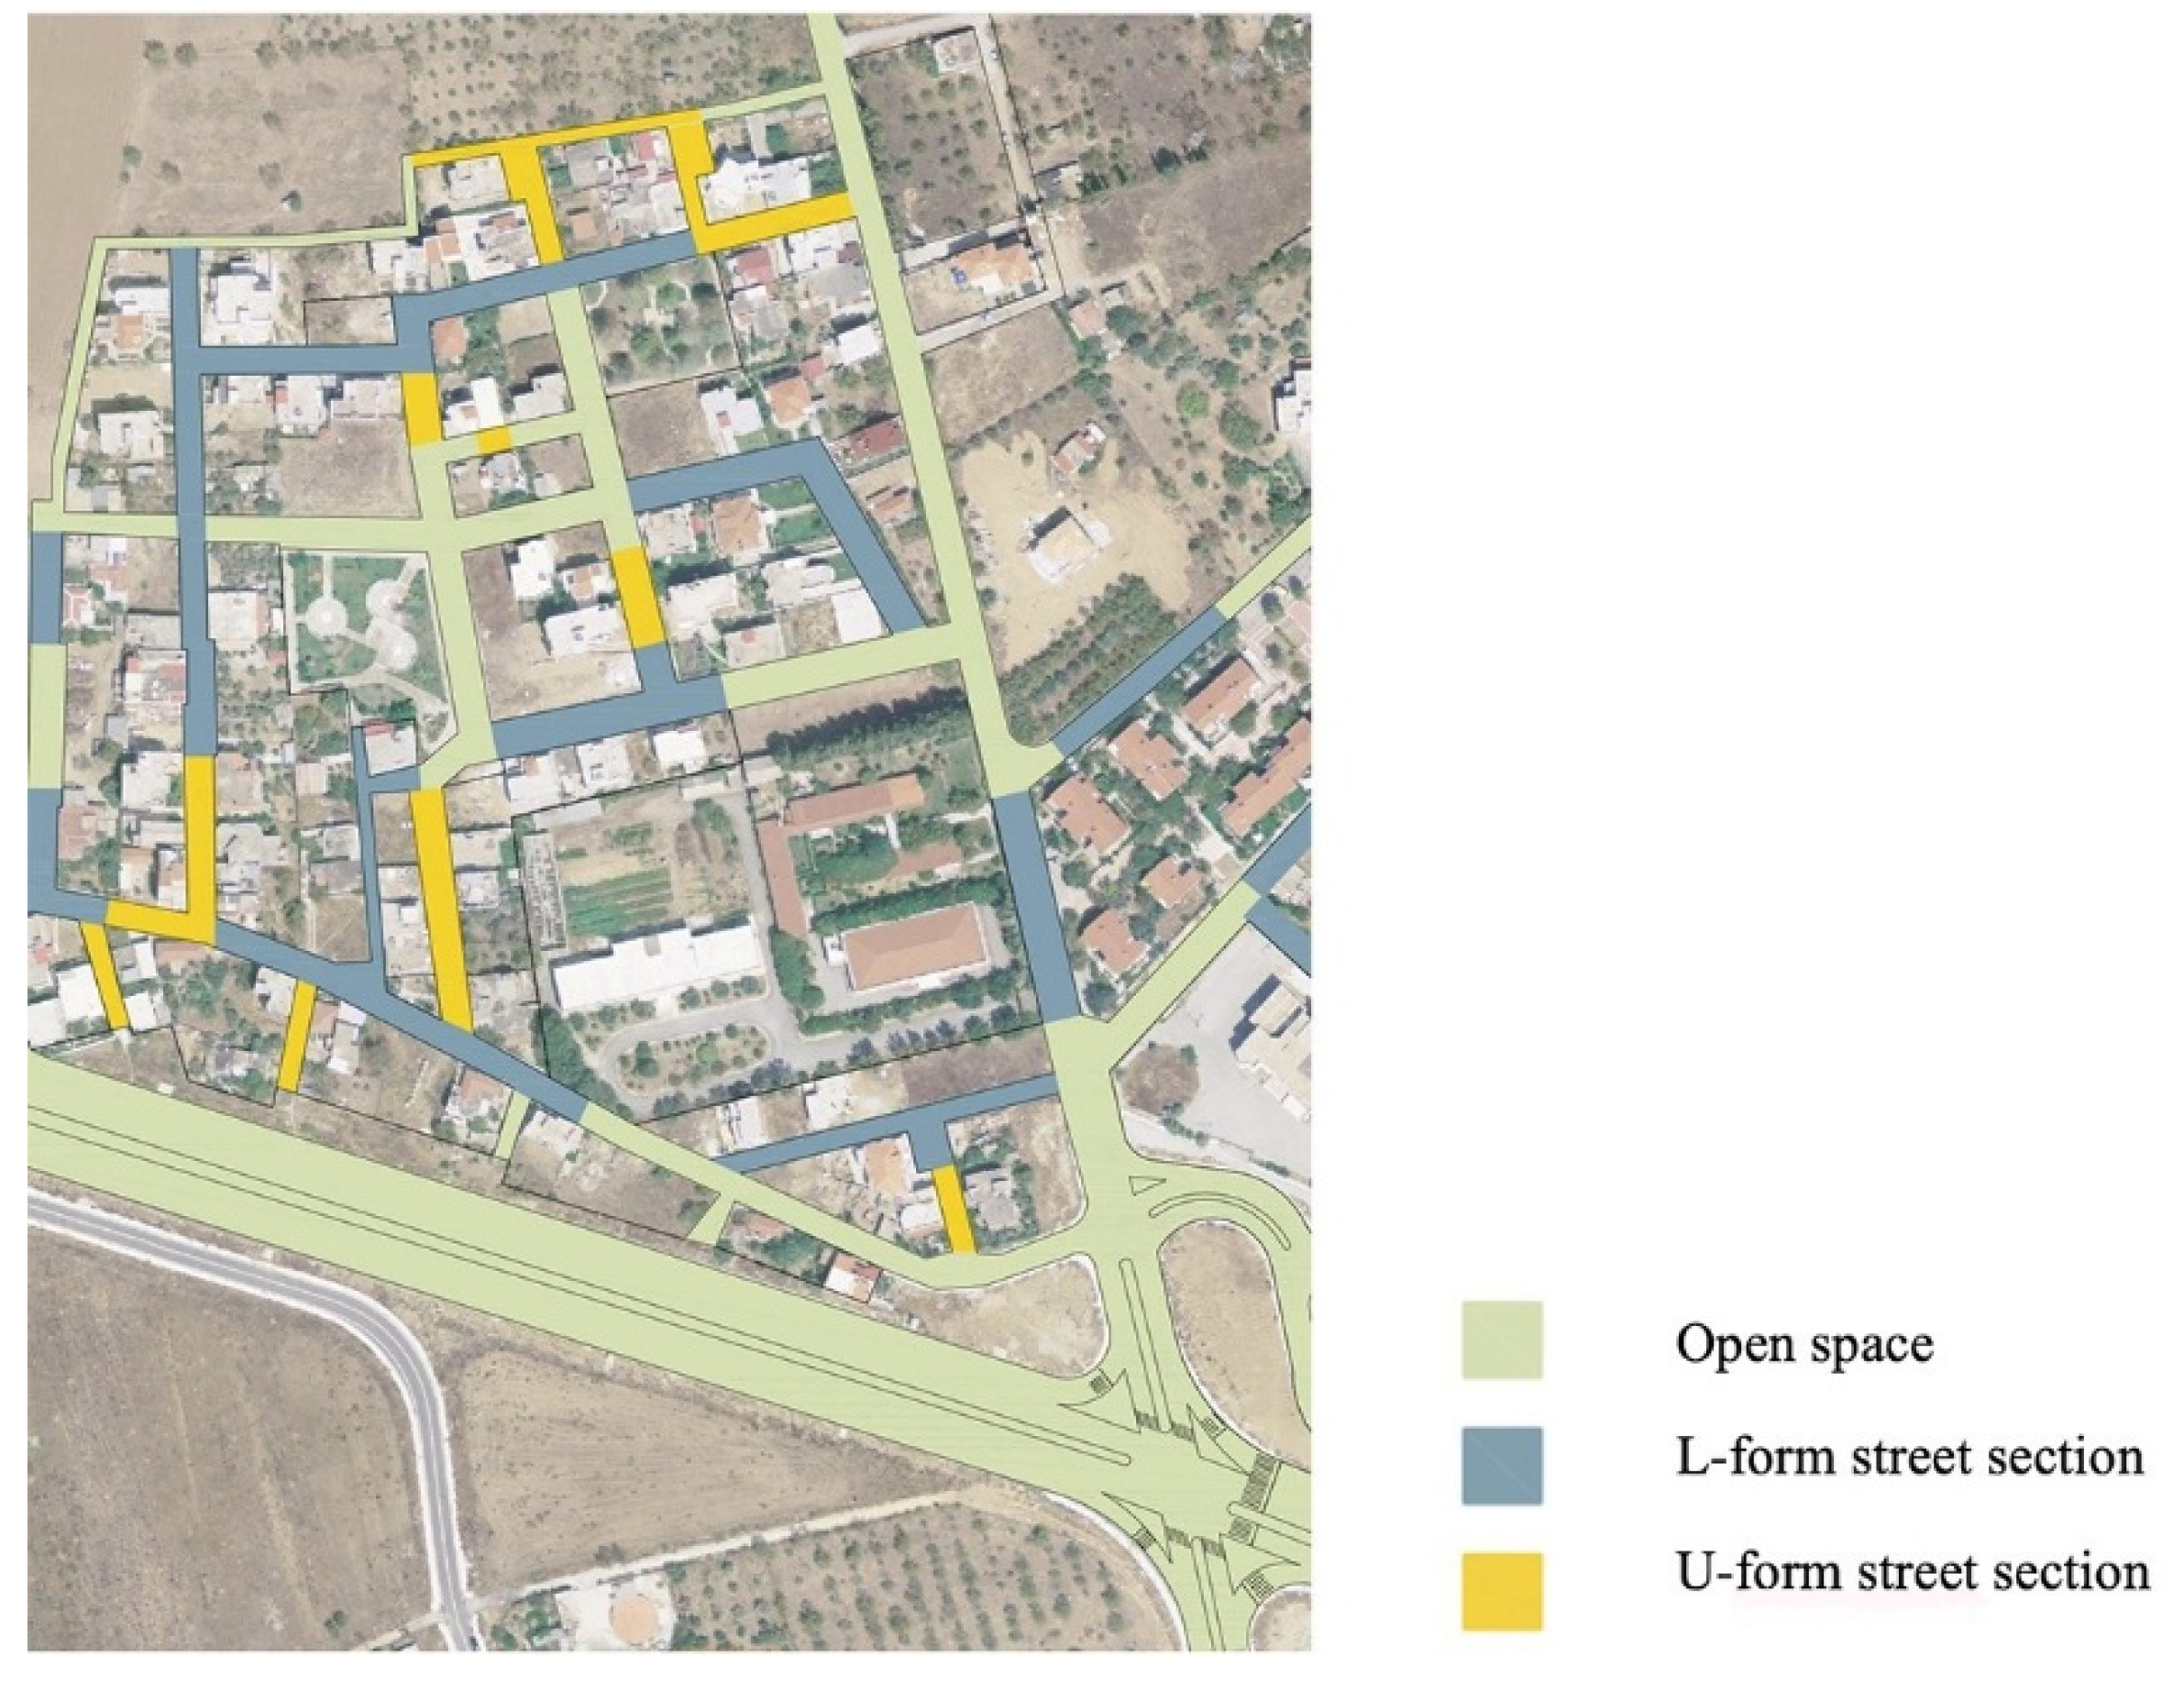
3.2.1. Urban Typology Map
U-shaped, L-shaped sections, and the open road are usually the three categories that are represented in this map; its aim is to simply represent the third dimension on a two-dimensional (2D) map, i.e., to draw a layer that outlines the acoustic propagation conditions of sounds (see
Figure 5 below).
This map, which preferably ought to be presented on a satellite view background (roster), gives a rapid idea of where the reflection effect of building’s facades can create a more or less reverberated urban sound environment, or not. It’s a first approach in determining whether the acoustic space of the public spaces, in a given urban area, is rather “closed”, “half-closed”, or “open”.
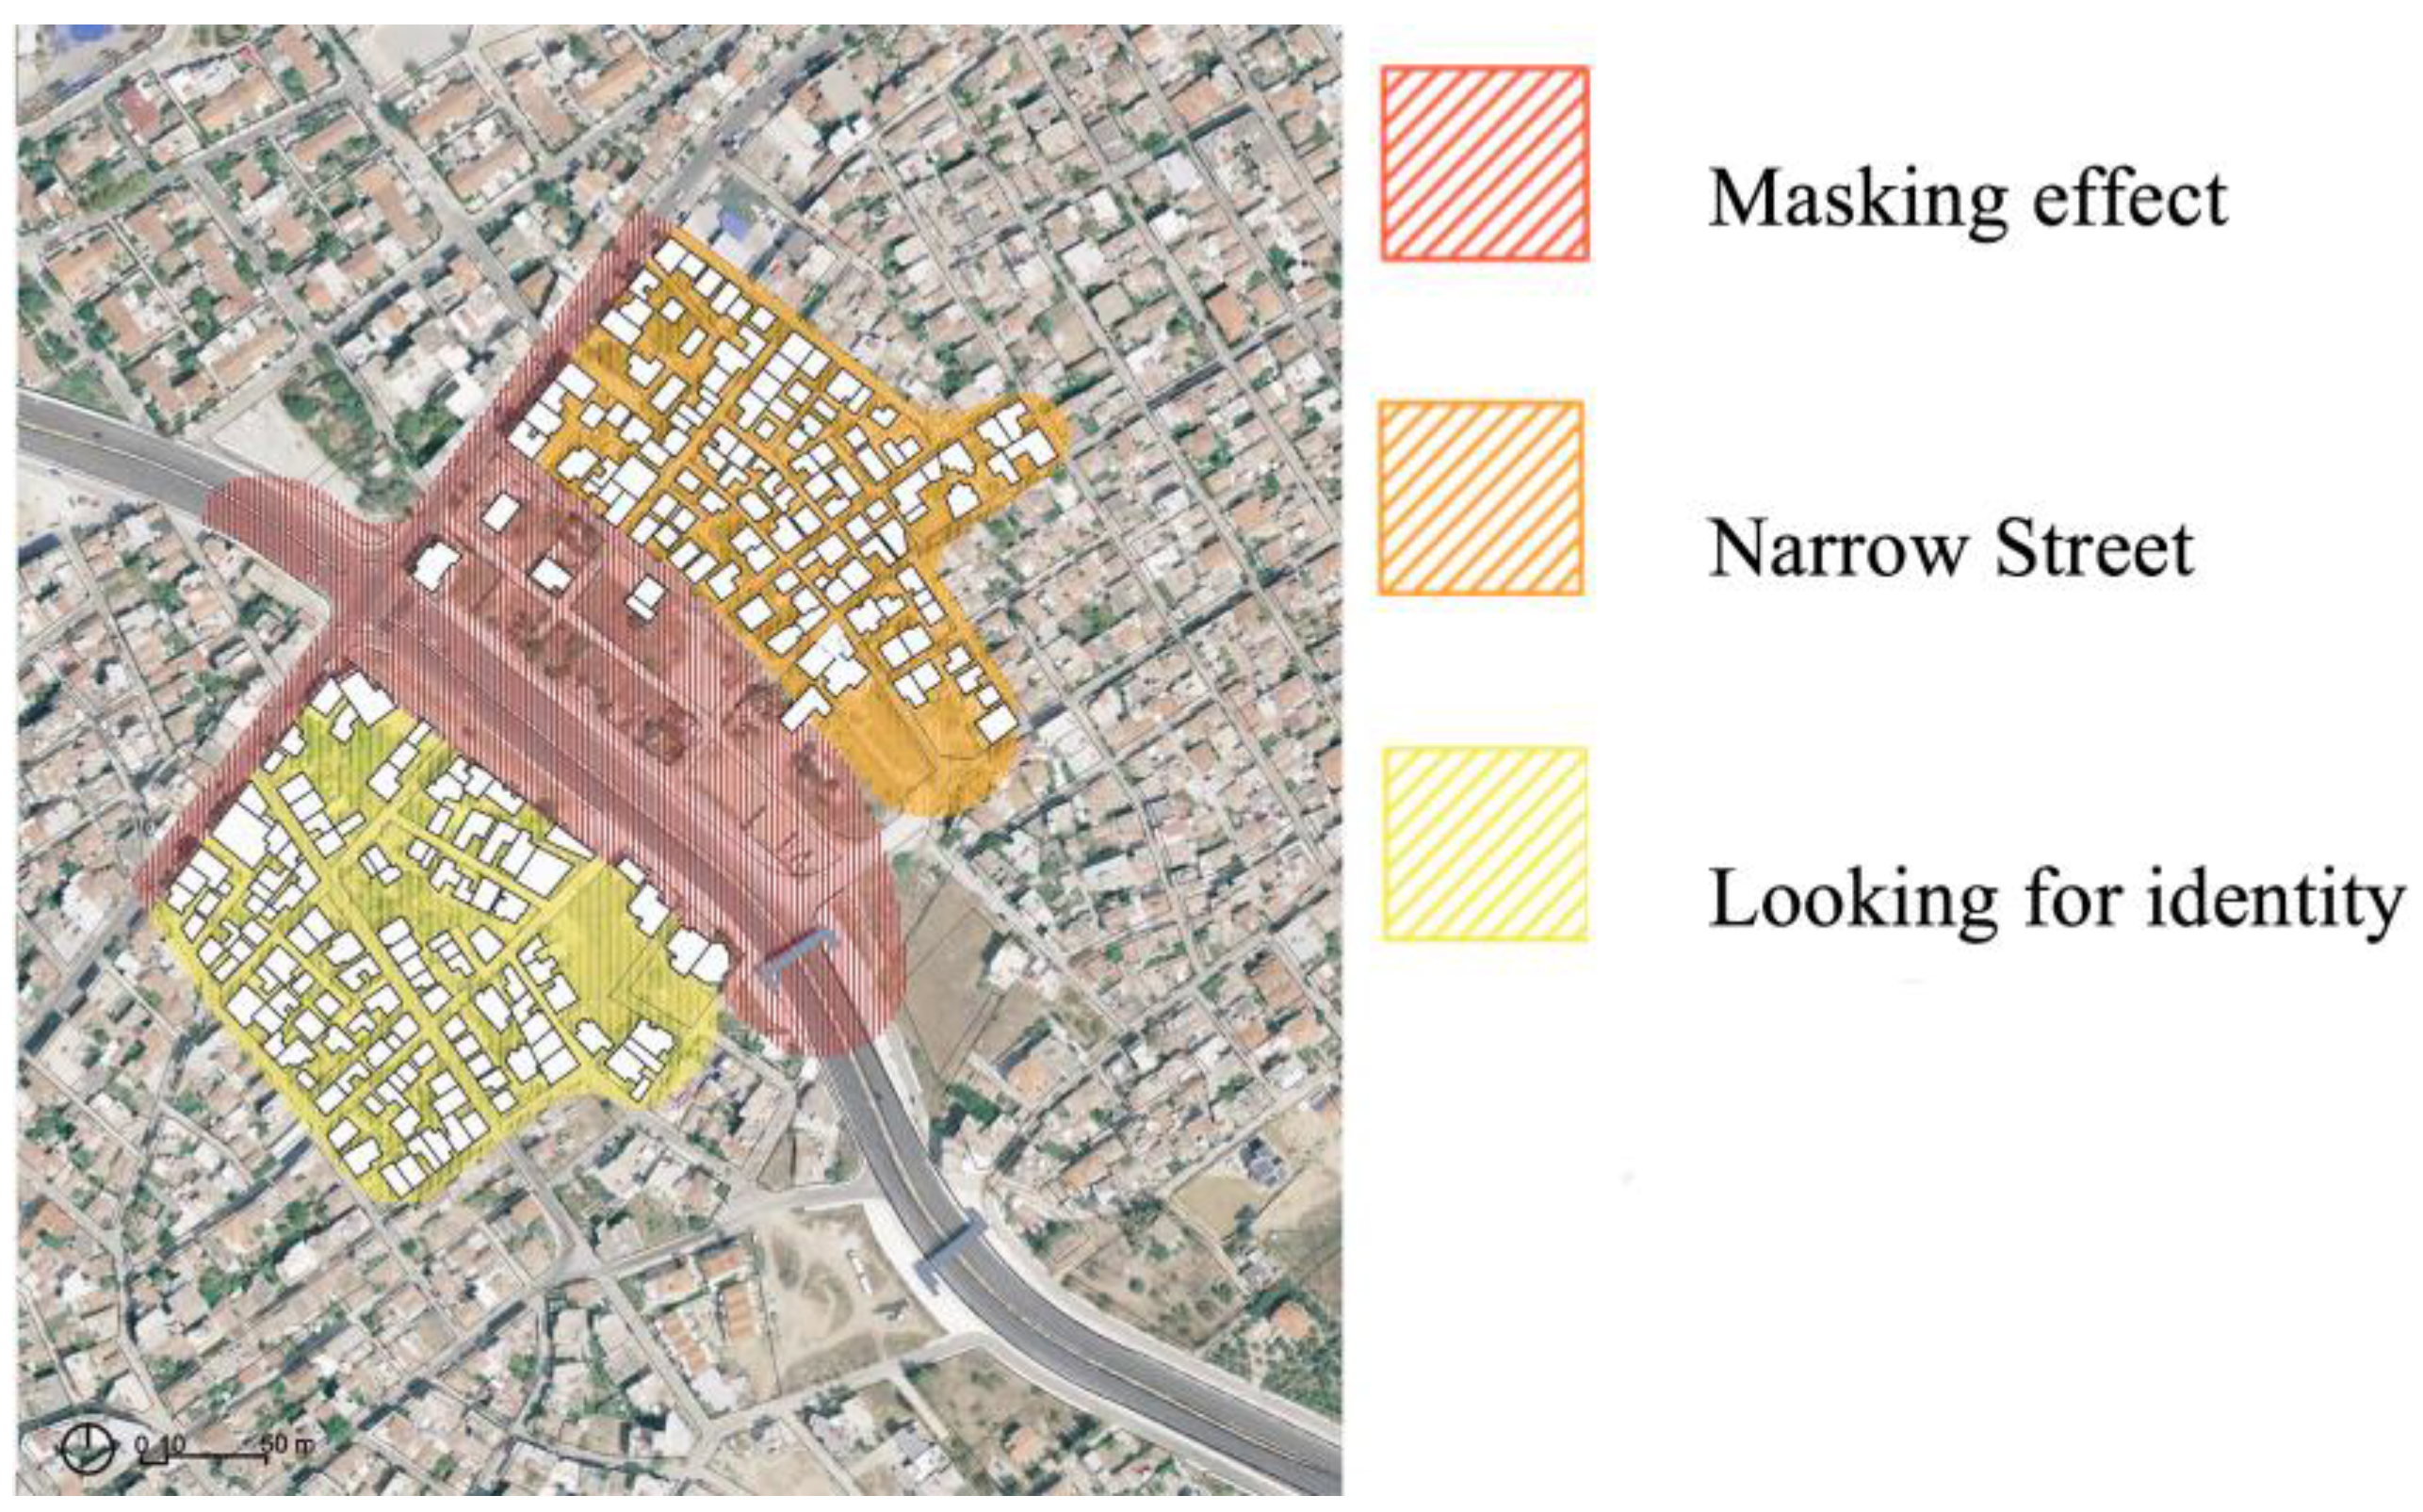
3.2.2. Spatio-Acoustic Typology Map
This map shows how the urban forms can potentially create several acoustic effects (acoustic filters, mask, cutting effect, reserves of silence, urban acoustic room, sound rhythms, etc.) [
2]. This map is based on a series of in situ observations that include acoustic measurements, sound recordings, and attentive listening of the site at different times of the day and week.
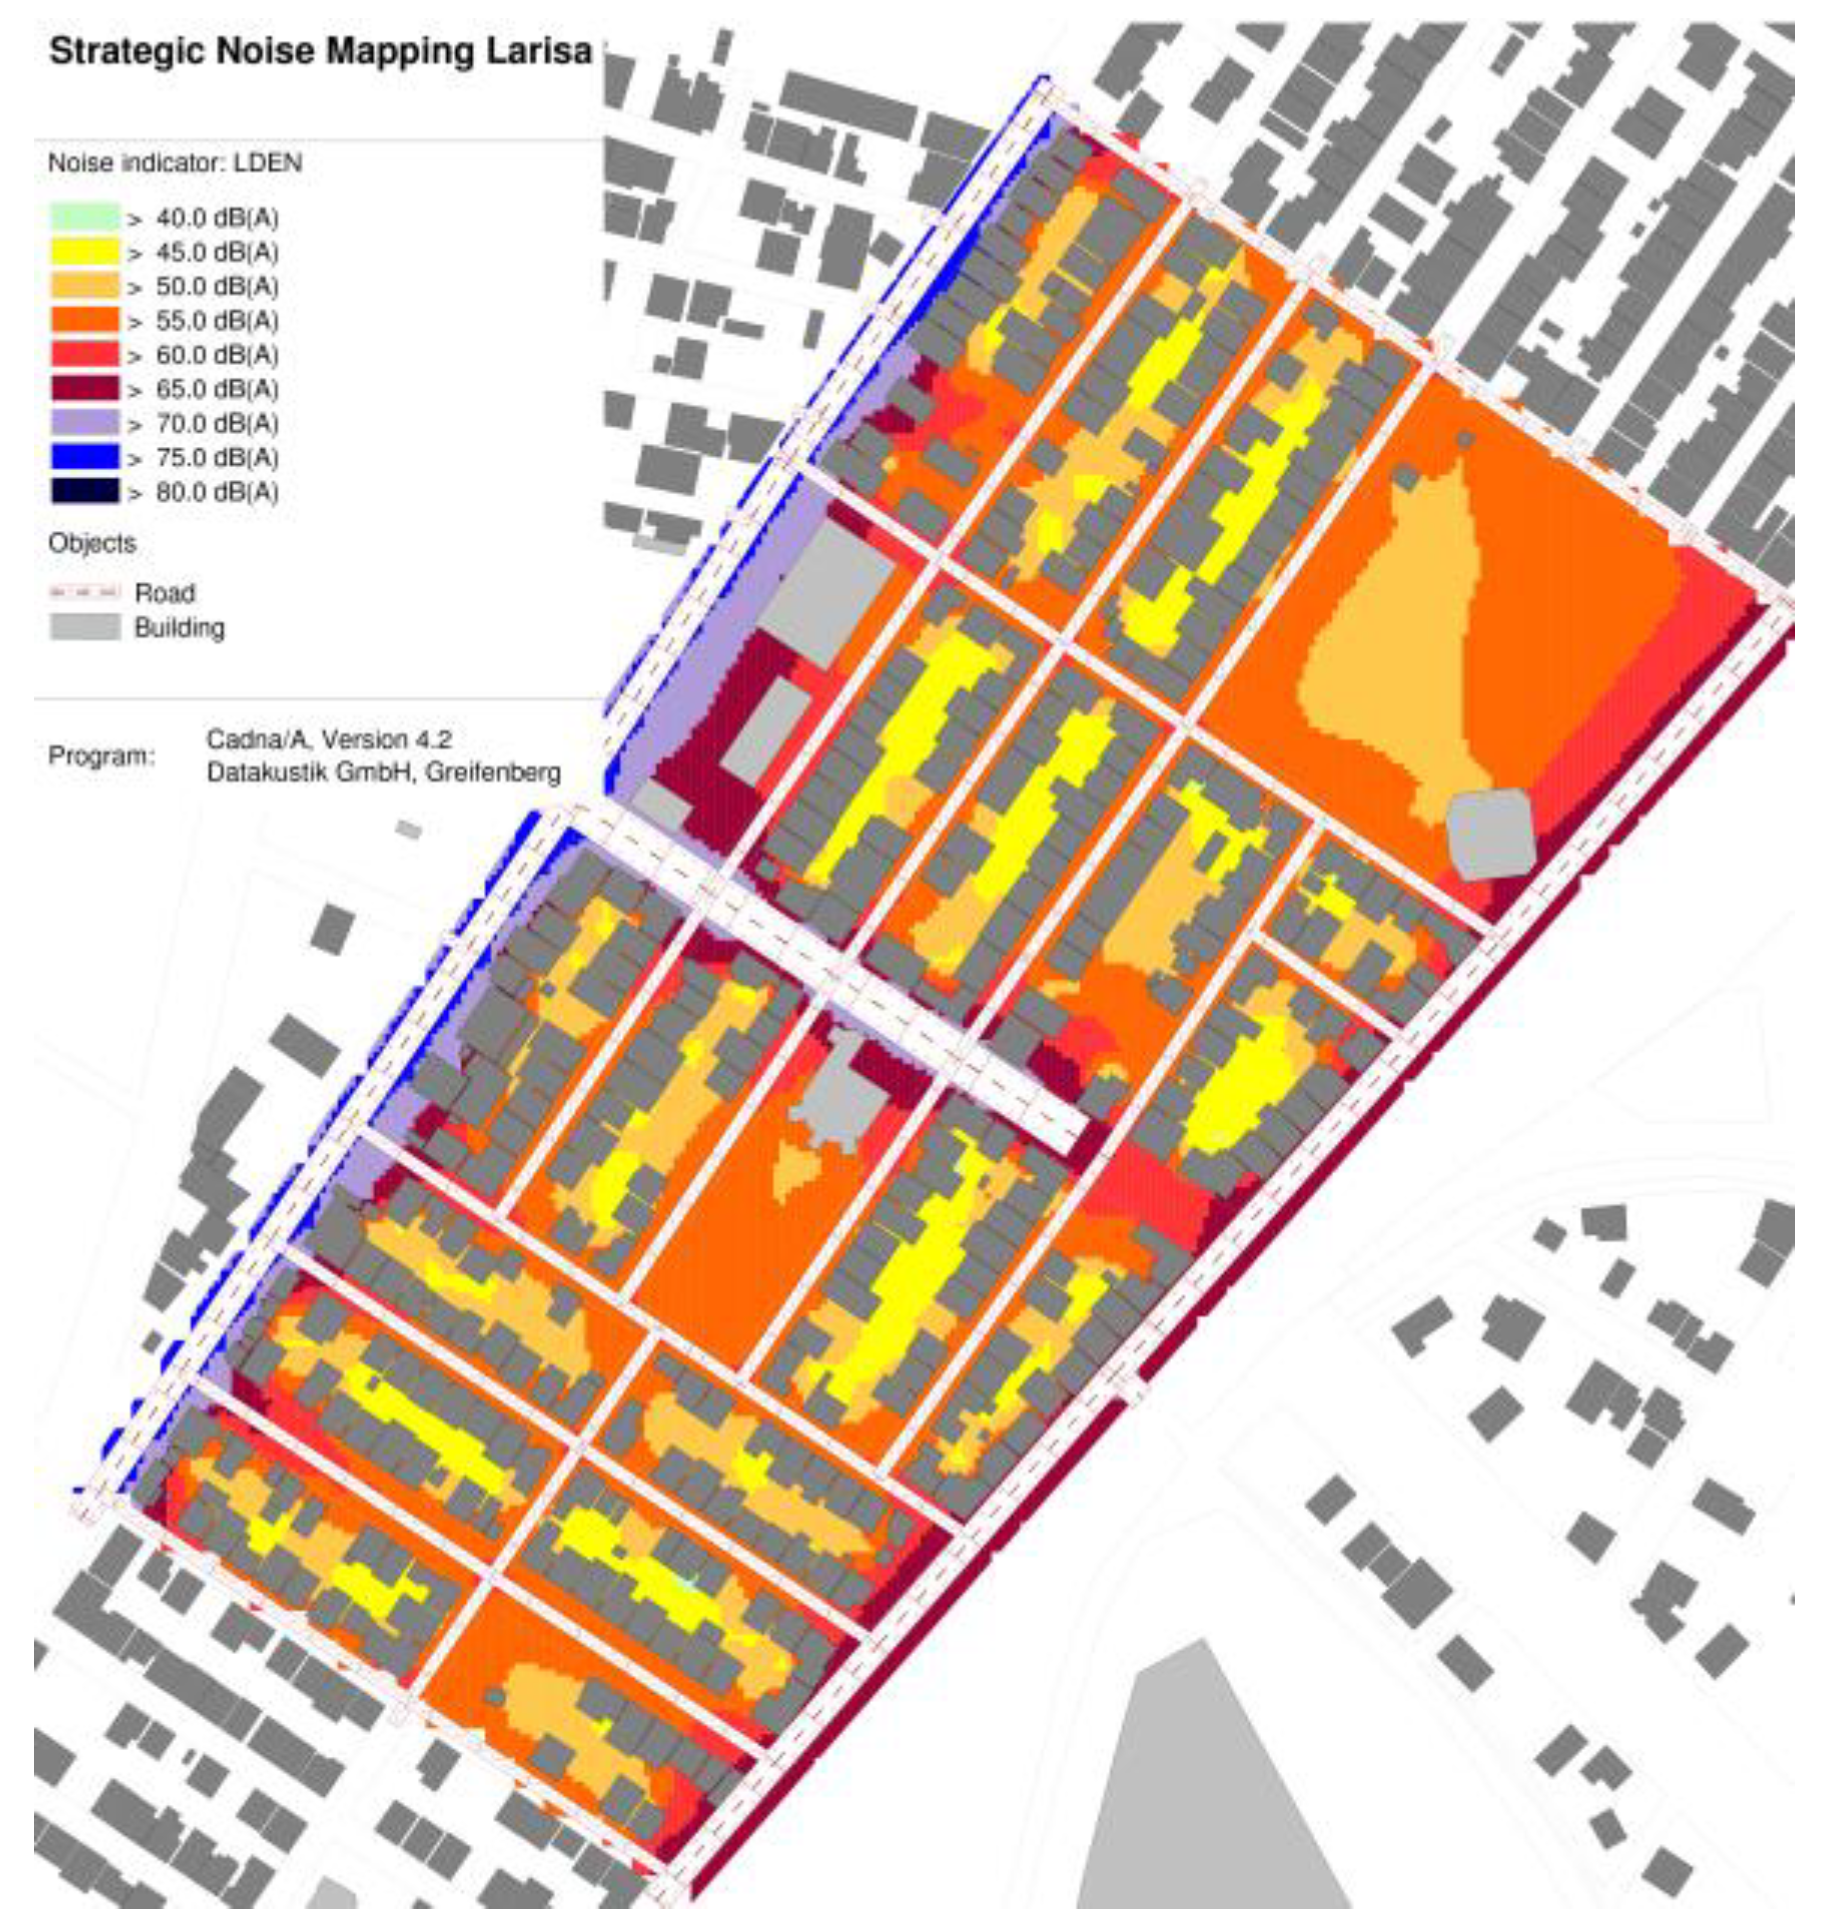
The map, hereafter (see
Figure 6) for example in the UA of Echekratidos in the urban agglomeration of Larissa, private and semi-public space in between the building blocks creates some kind of silence islets actually because of the mass and the height of the existing buildings. It was important to show that in situ analysis campaigns were executed (sound recordings, observations, and interviews), and their results combined with the SNM simulation were able to show that the topography of the district, and the given forms of the existing buildings are able to create easily identifiable sound effects when someone walks through the district.
In a global analysis of the soundscape qualities, it’s important to show clearly in an appropriate map such potentials of the existing urban form.
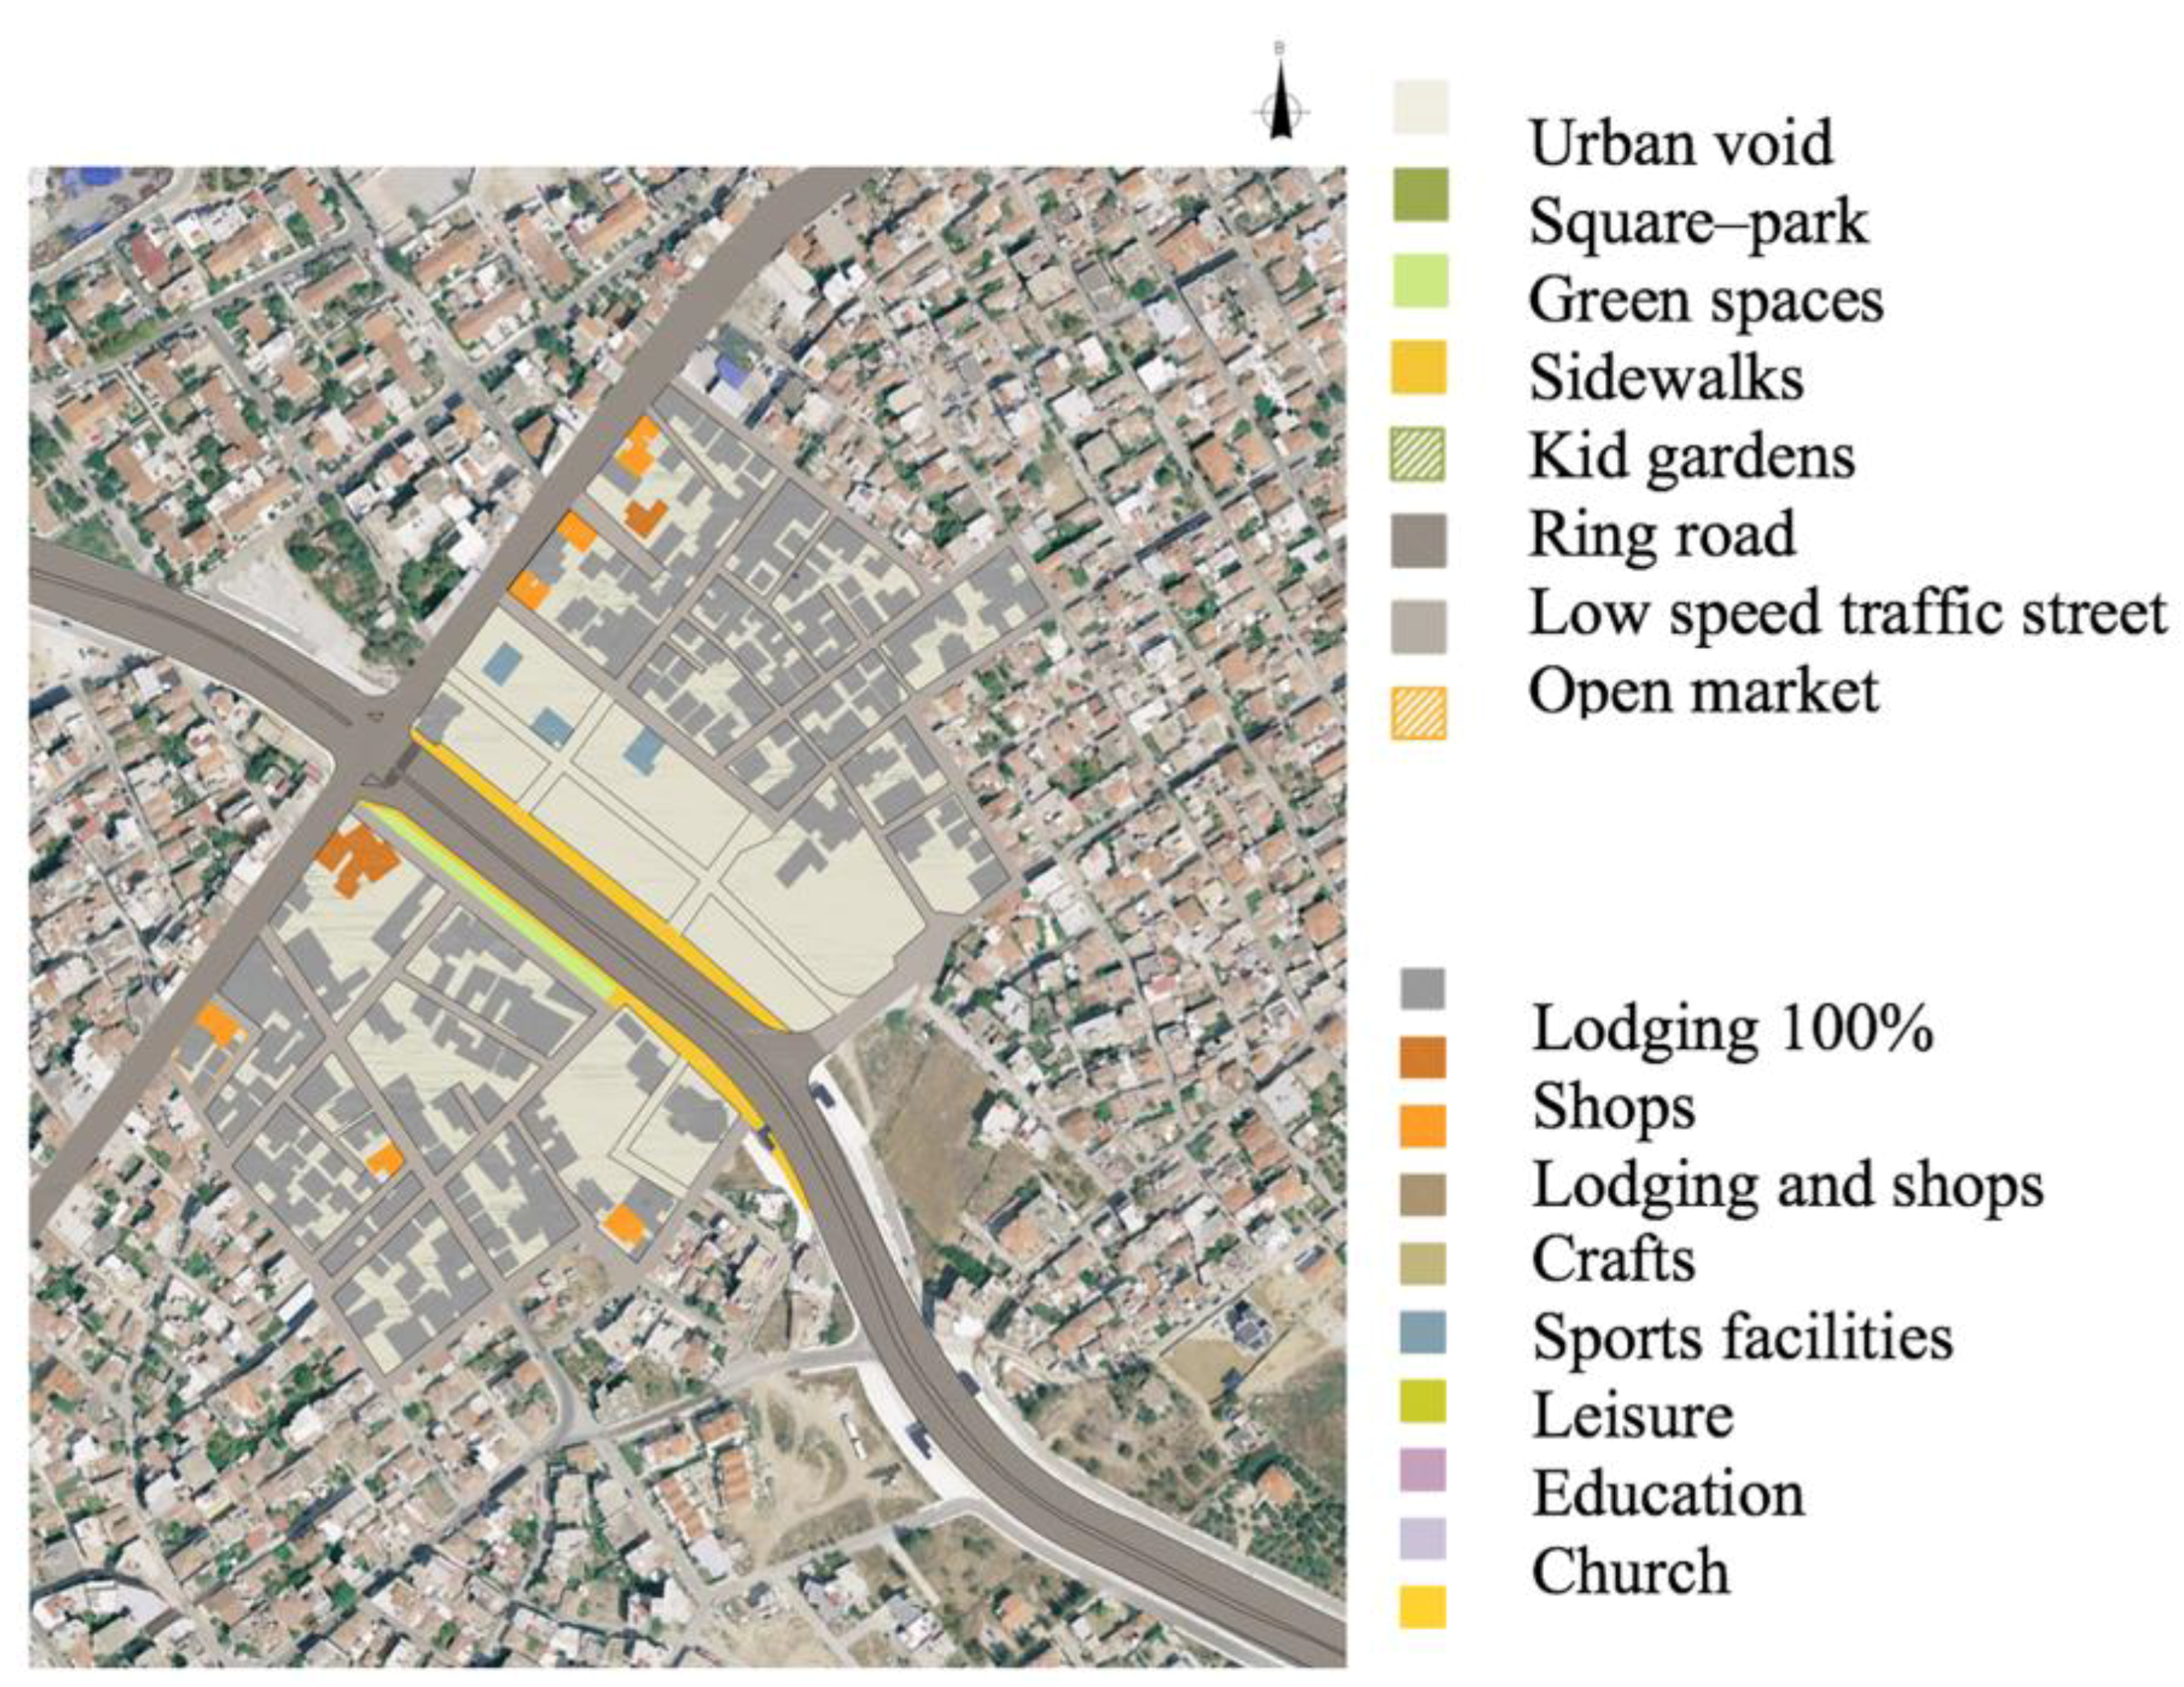
3.2.3. Map of Predominant Uses
Public and private urban outdoor spaces as well as building activities are presented in the two following maps. On the first one (
Figure 7), streets, boulevards, peripheral roads, sidewalks, small parks, gardens, and unbuilt zones are presented on a colored chart in order to qualify the main noise sources presented on the site and their spaces of propagation.
Such a map (
Figure 7) shows how the existing dwellings, crafts, shops, churches, schools, and industrial buildings are mixed in an urban area and how they are characteristics of its urban identity. In this example, the urban area named Karagats shows a series of open spaces that are built mainly with residential buildings. So, we can imagine that the sound environment is mainly characterized by people’s residential activities with more or less noise traffic depending on the distance of the listener from the ring road.
3.2.4. Sound Signals Map and Sound Marks Map
The following maps are created based on the results of the interviews that have been performed on site. Actually, the main goal of these interviews is to understand the sounds that residents can listen to in situ, and also how these sounds are categorized and assessed. The goal of the analysis is not to describe all of the sounds that can be heard on site, but also to ask the people who live there which one can be considered as a signal (recognizable), and the ones that can mark and identify the place (markers) [
14,
26,
33]. For each urban area, individual interviews were conducted based on the same questionnaire, and recorded on digital recorder. These interviews were redrafted in text form, and then further compared and analyzed based on the principle hypothesis. Each time, interviewers were particularly trying to select inhabitants depending on where they were living in the neighborhood. Many interviews were conducted and analyzed systematically, and the interviews were terminated as soon as the spectrum of possible answers became stable. For example, in 2012, in the municipalities of Larissa and Volos, five neighborhoods were studied, and the statistical distribution of the interviews can be seen in the following
Table 2.
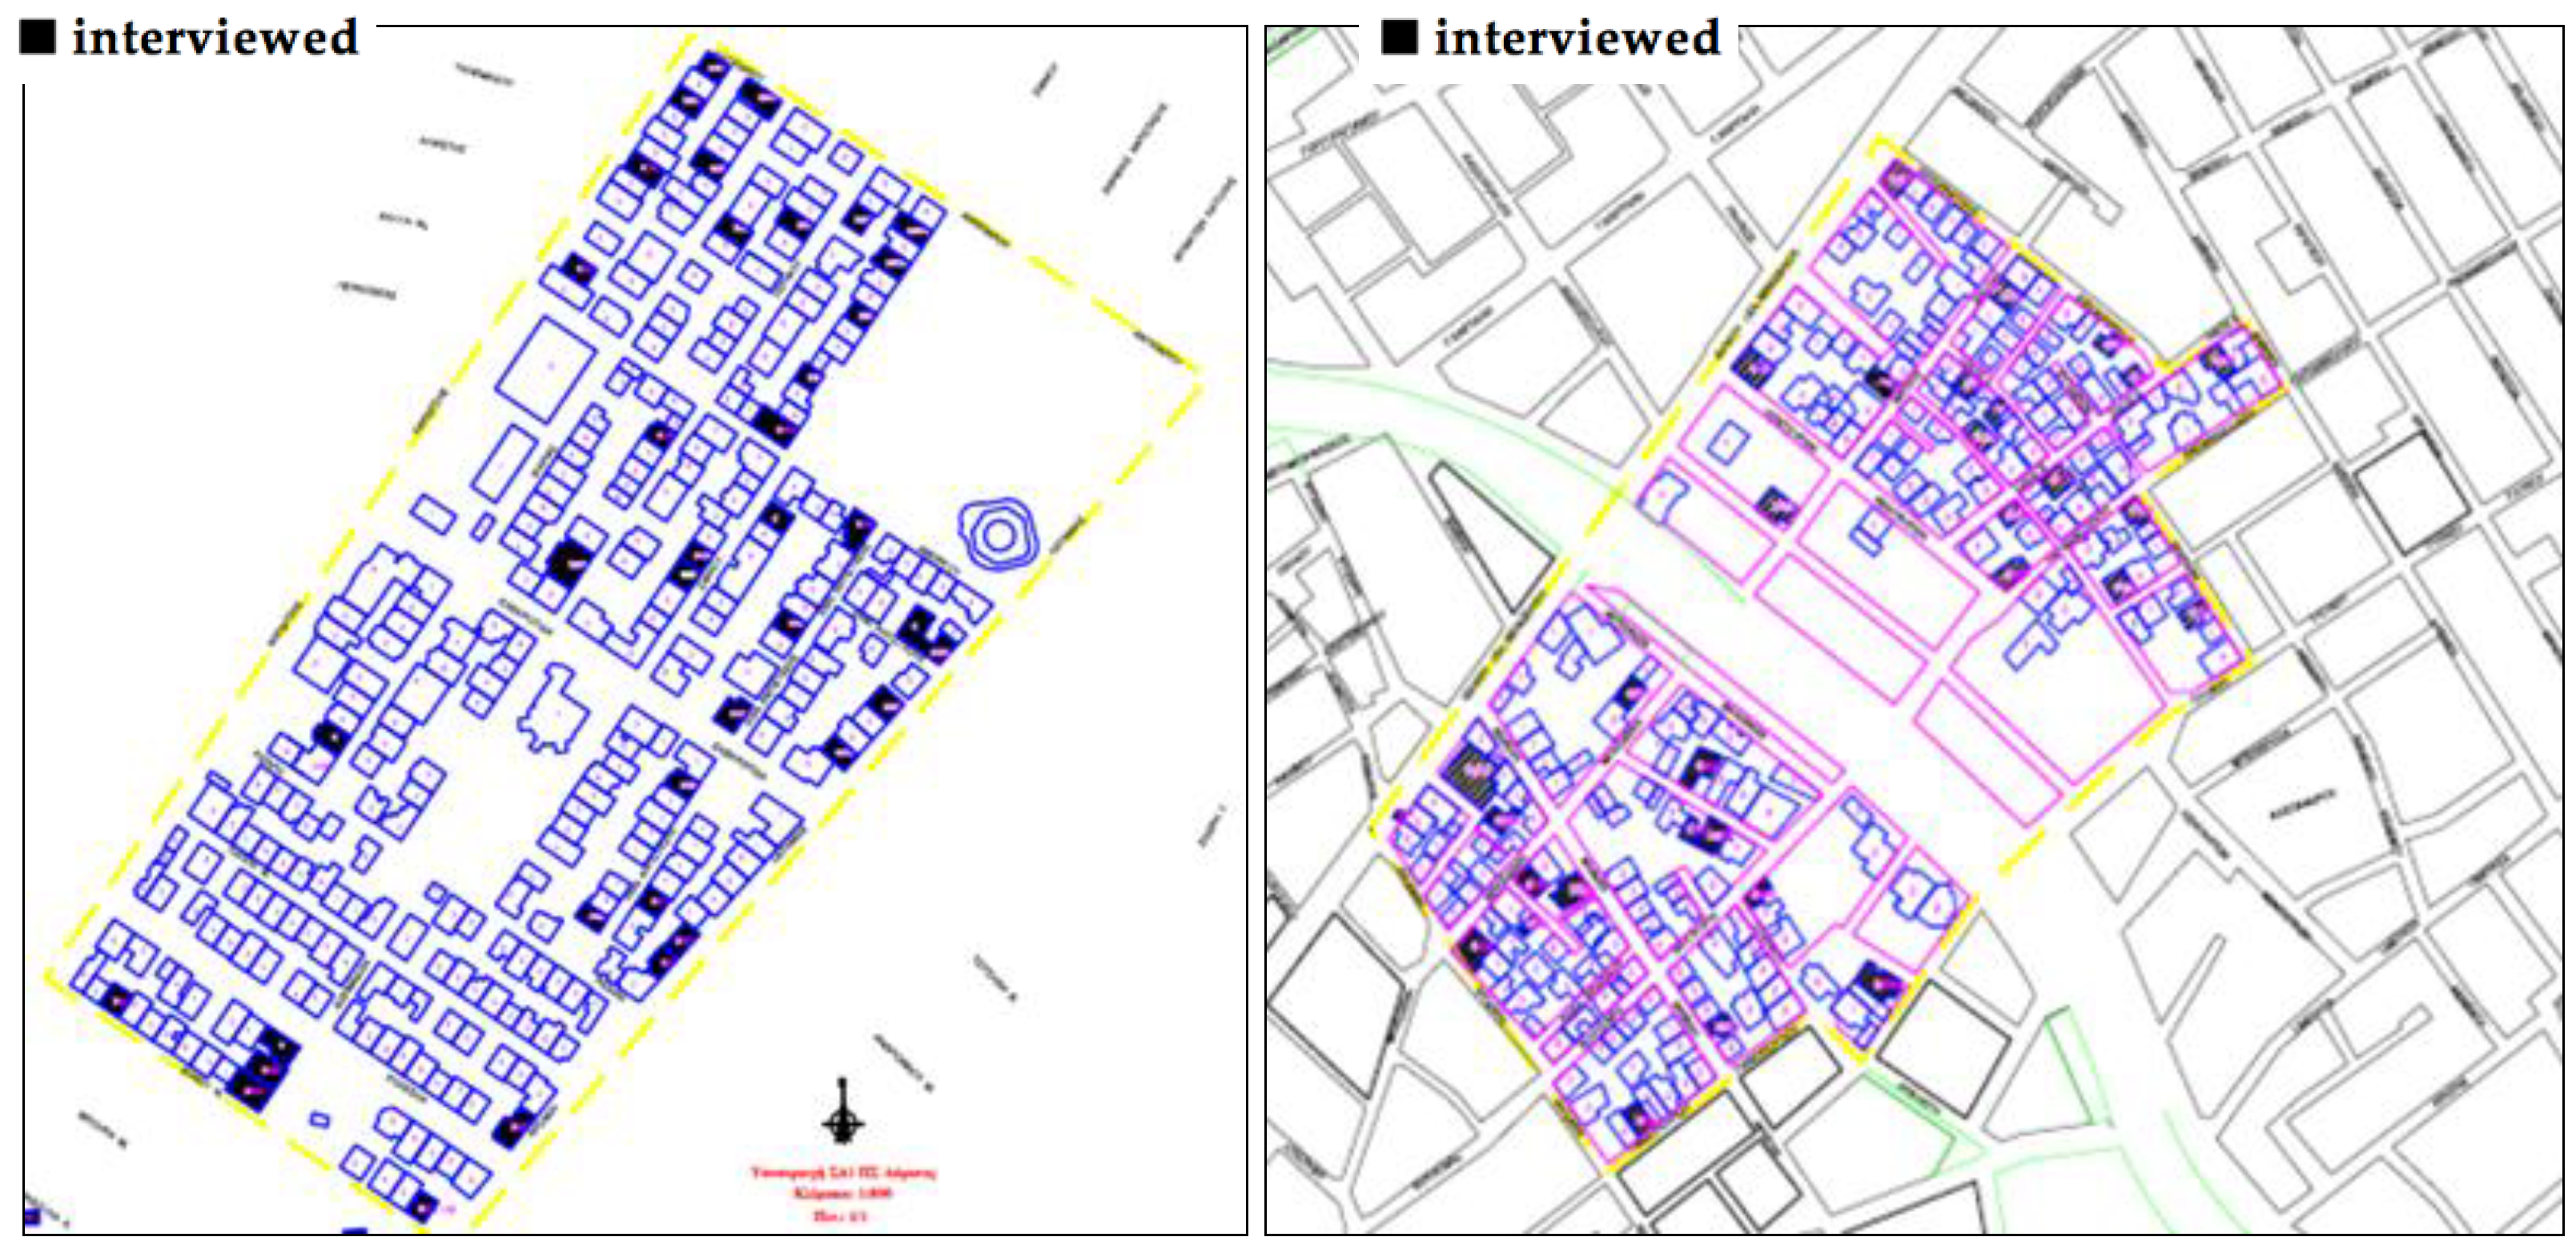
These interviews were systematically located on a GIS map in order to possibly correlate sound phenomena to specific locations. For example in
Figure 8, two GIS maps present the buildings where the interviews were conducted.
The principal factor for a successful interview is introducing to the local population the chance to express themselves on the semantic sounds of their district and determine along with them the meaningful ones as well as establish their degree of annoyance—if any (see
Figure 9). Such interviews help us understand what is actually heard in an urban area when car traffic stops.
In the case of the old city center of Chania in the island of Crete, traffic noise was not considered as a major problem, because most of the district was not accessible by vehicles. Therefore, the main issue was finding a balance between the need for the area to welcome tourists and visitors, and the way to respect an inhabitant’s way of life during day and night. Such factors included: non-respect of people’s privacy, deterioration of public and private spaces and furniture, noise, non-respect for sleep necessity, and the introduction of multiple disturbances (see
Figure 10a,b). Therefore, it was important that the interviewer addressed all of the questions within the form of a general discussion, using simultaneously—as recommended—a digital sound recorder in order to record the dialogue and analyze it properly afterwards.
The purpose is to synthesize people’s responses in a usable form for the analysis in order to group them by the redundancy point of view. Such interviews provided the capacity to develop the relevant sound signals properly, and then constitute a sound mark map that summarized all of the transmitted information by the interviewed population. Obviously, such a map cannot represent all of the possible audible sound sources in a UA. On the other hand, it presents the signals and/or sound events identified by the inhabitants, related to the UA activities, even if they were produced outside its boundaries, but were otherwise clearly perceived in the assessed area.
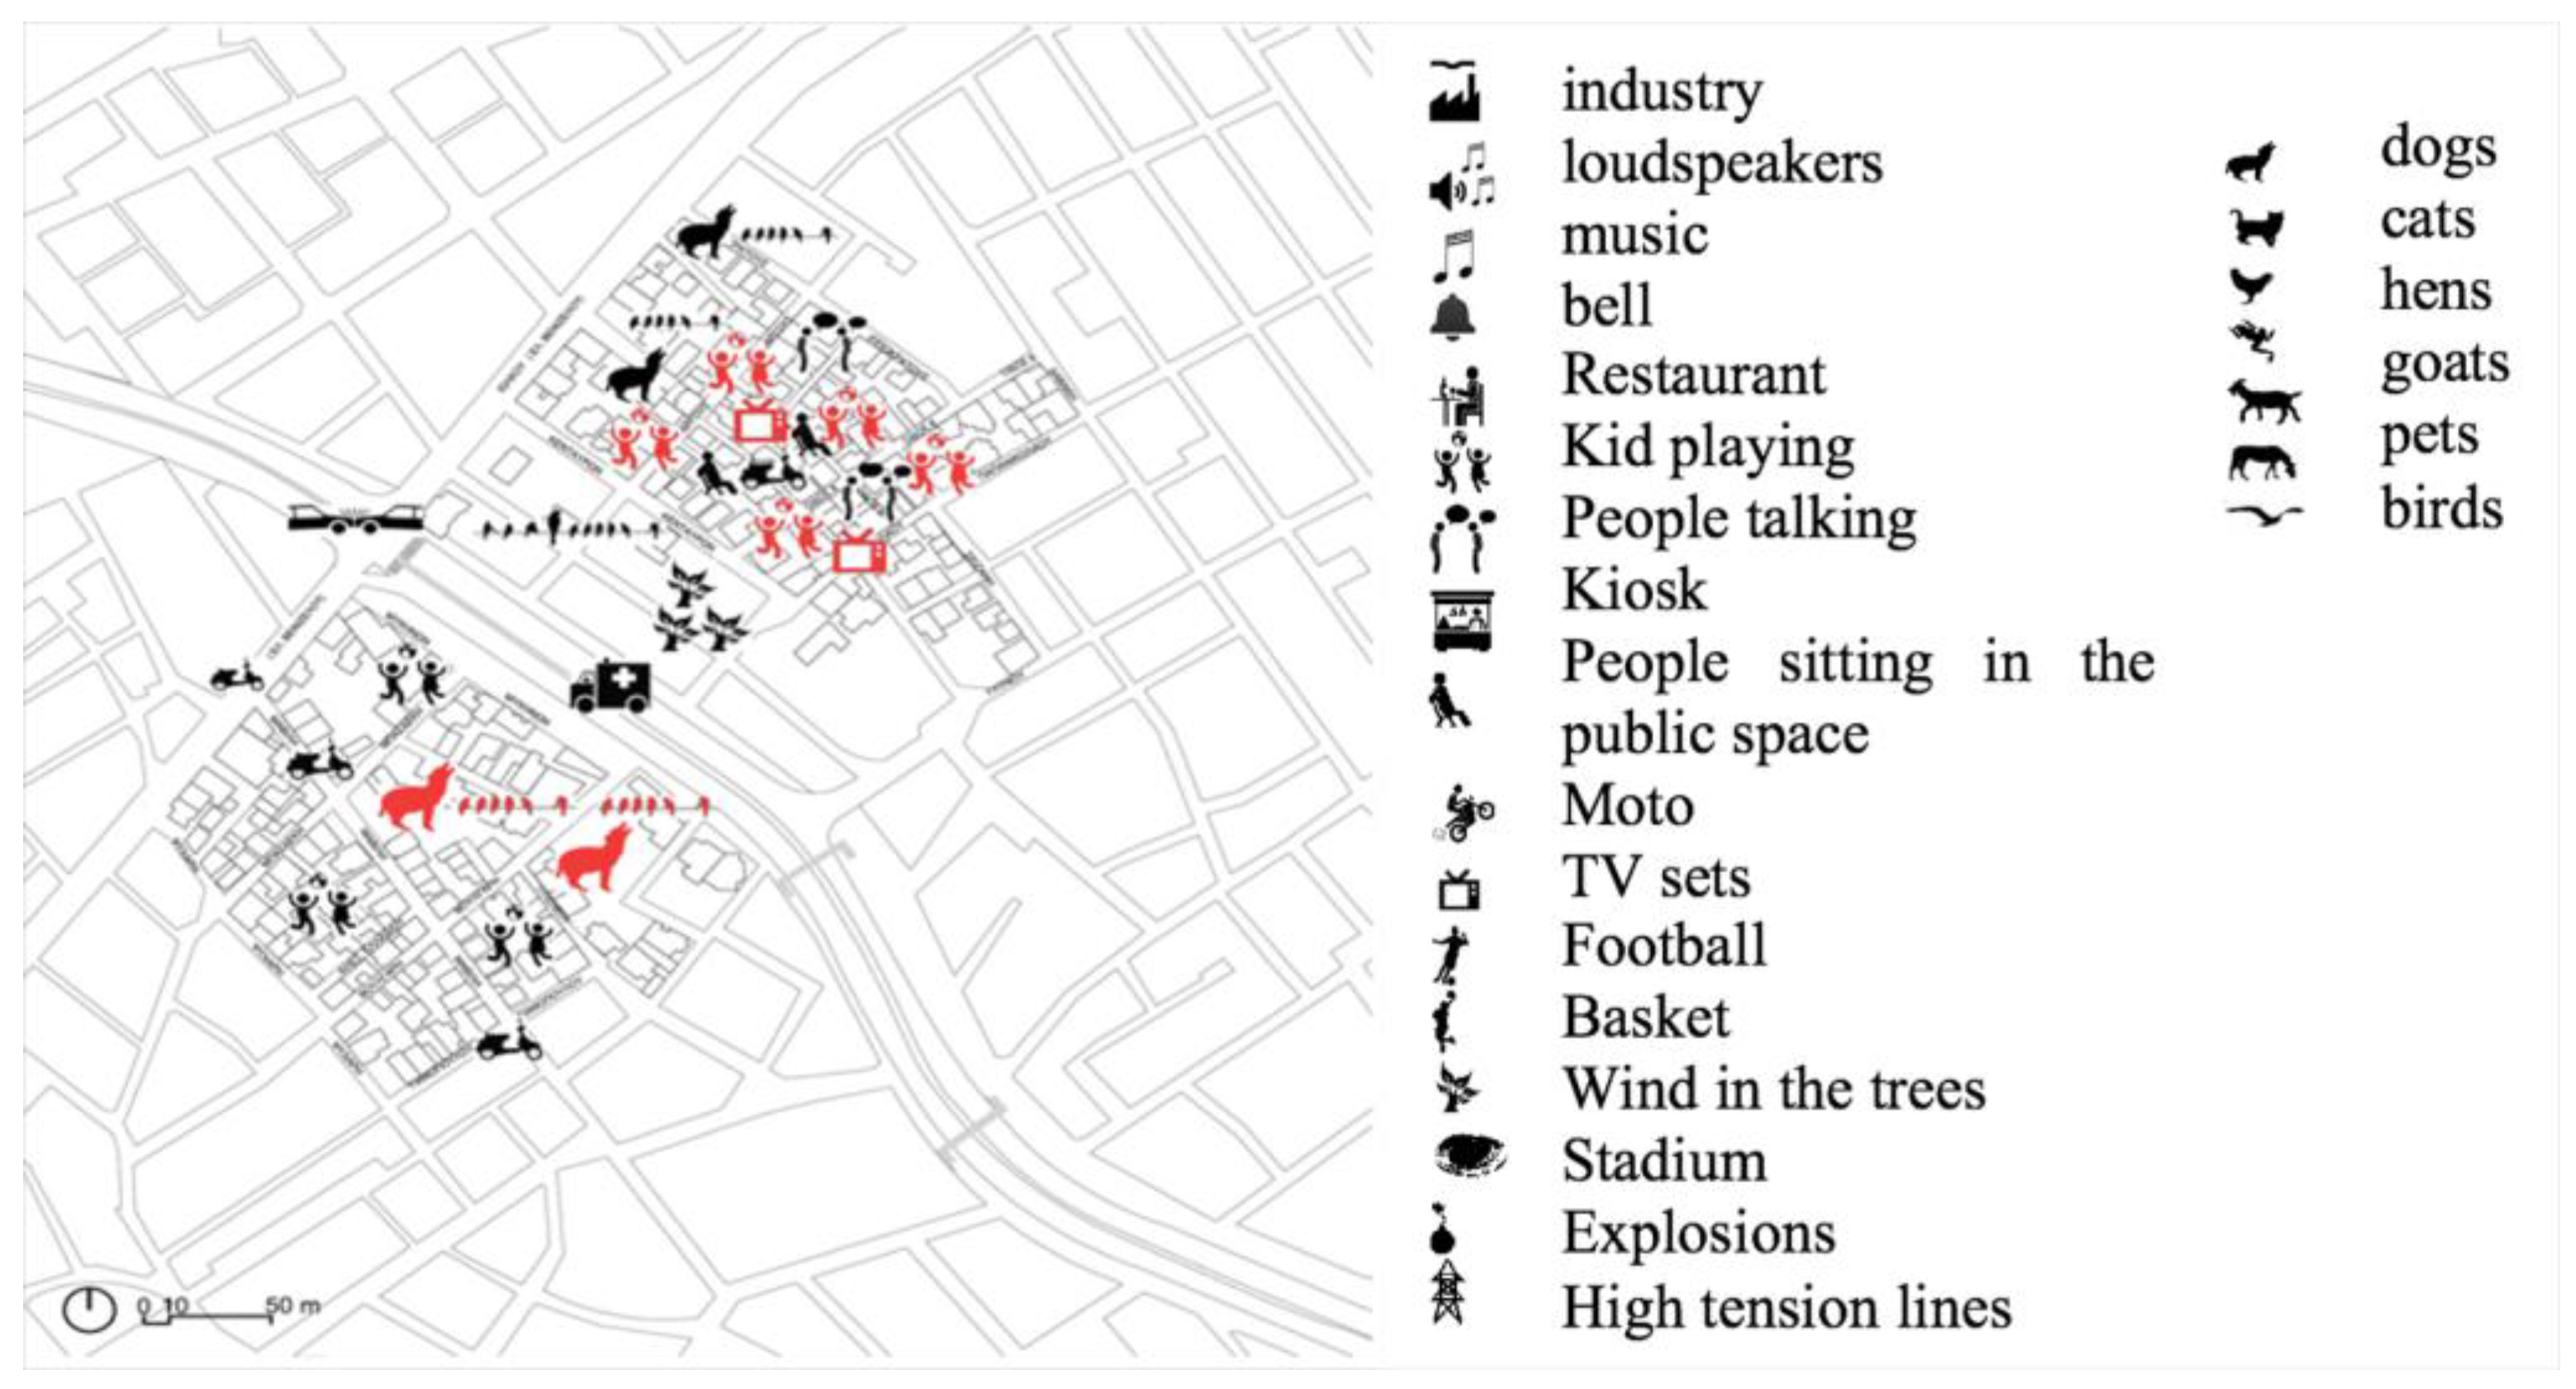
As presented in
Figure 11, very easy-to-read icons were used and drawn on the general map of the neighborhood studied in order to quickly understand the main characteristics of the sound environment. The visual logic is used here to show the plurality and localization of the main urban sources that had been noticed by inhabitants. This map can be seen as containing the average behaviors of sound sources in the district. For example, in
Figure 11, kids playing are often heard, because traffic is light in this area, and parents let them play in the streets and the small parks of the old city center. In the same way, traffic is of course always heard, but there, people talked more about the sound of bus traffic, which seems to be more noticeable. Actually, many churches are present in this area, but people talk more about two specific bells that can be heard only there, and it’s the reason that the icon is colored with red. Music from radio sets or TV sets are regularly heard in the public spaces of Chania, but the live music of the conservatoire through the open windows is very well-known to the inhabitants (icon of music note colored in red, see
Figure 11).
In other words, it is likely that a visitor can hear these sounds if he or she walks in the public areas of the neighborhood studied. He will be able to hear many other sounds, but the sounds described on the map are characteristic for the inhabitants of their living place.
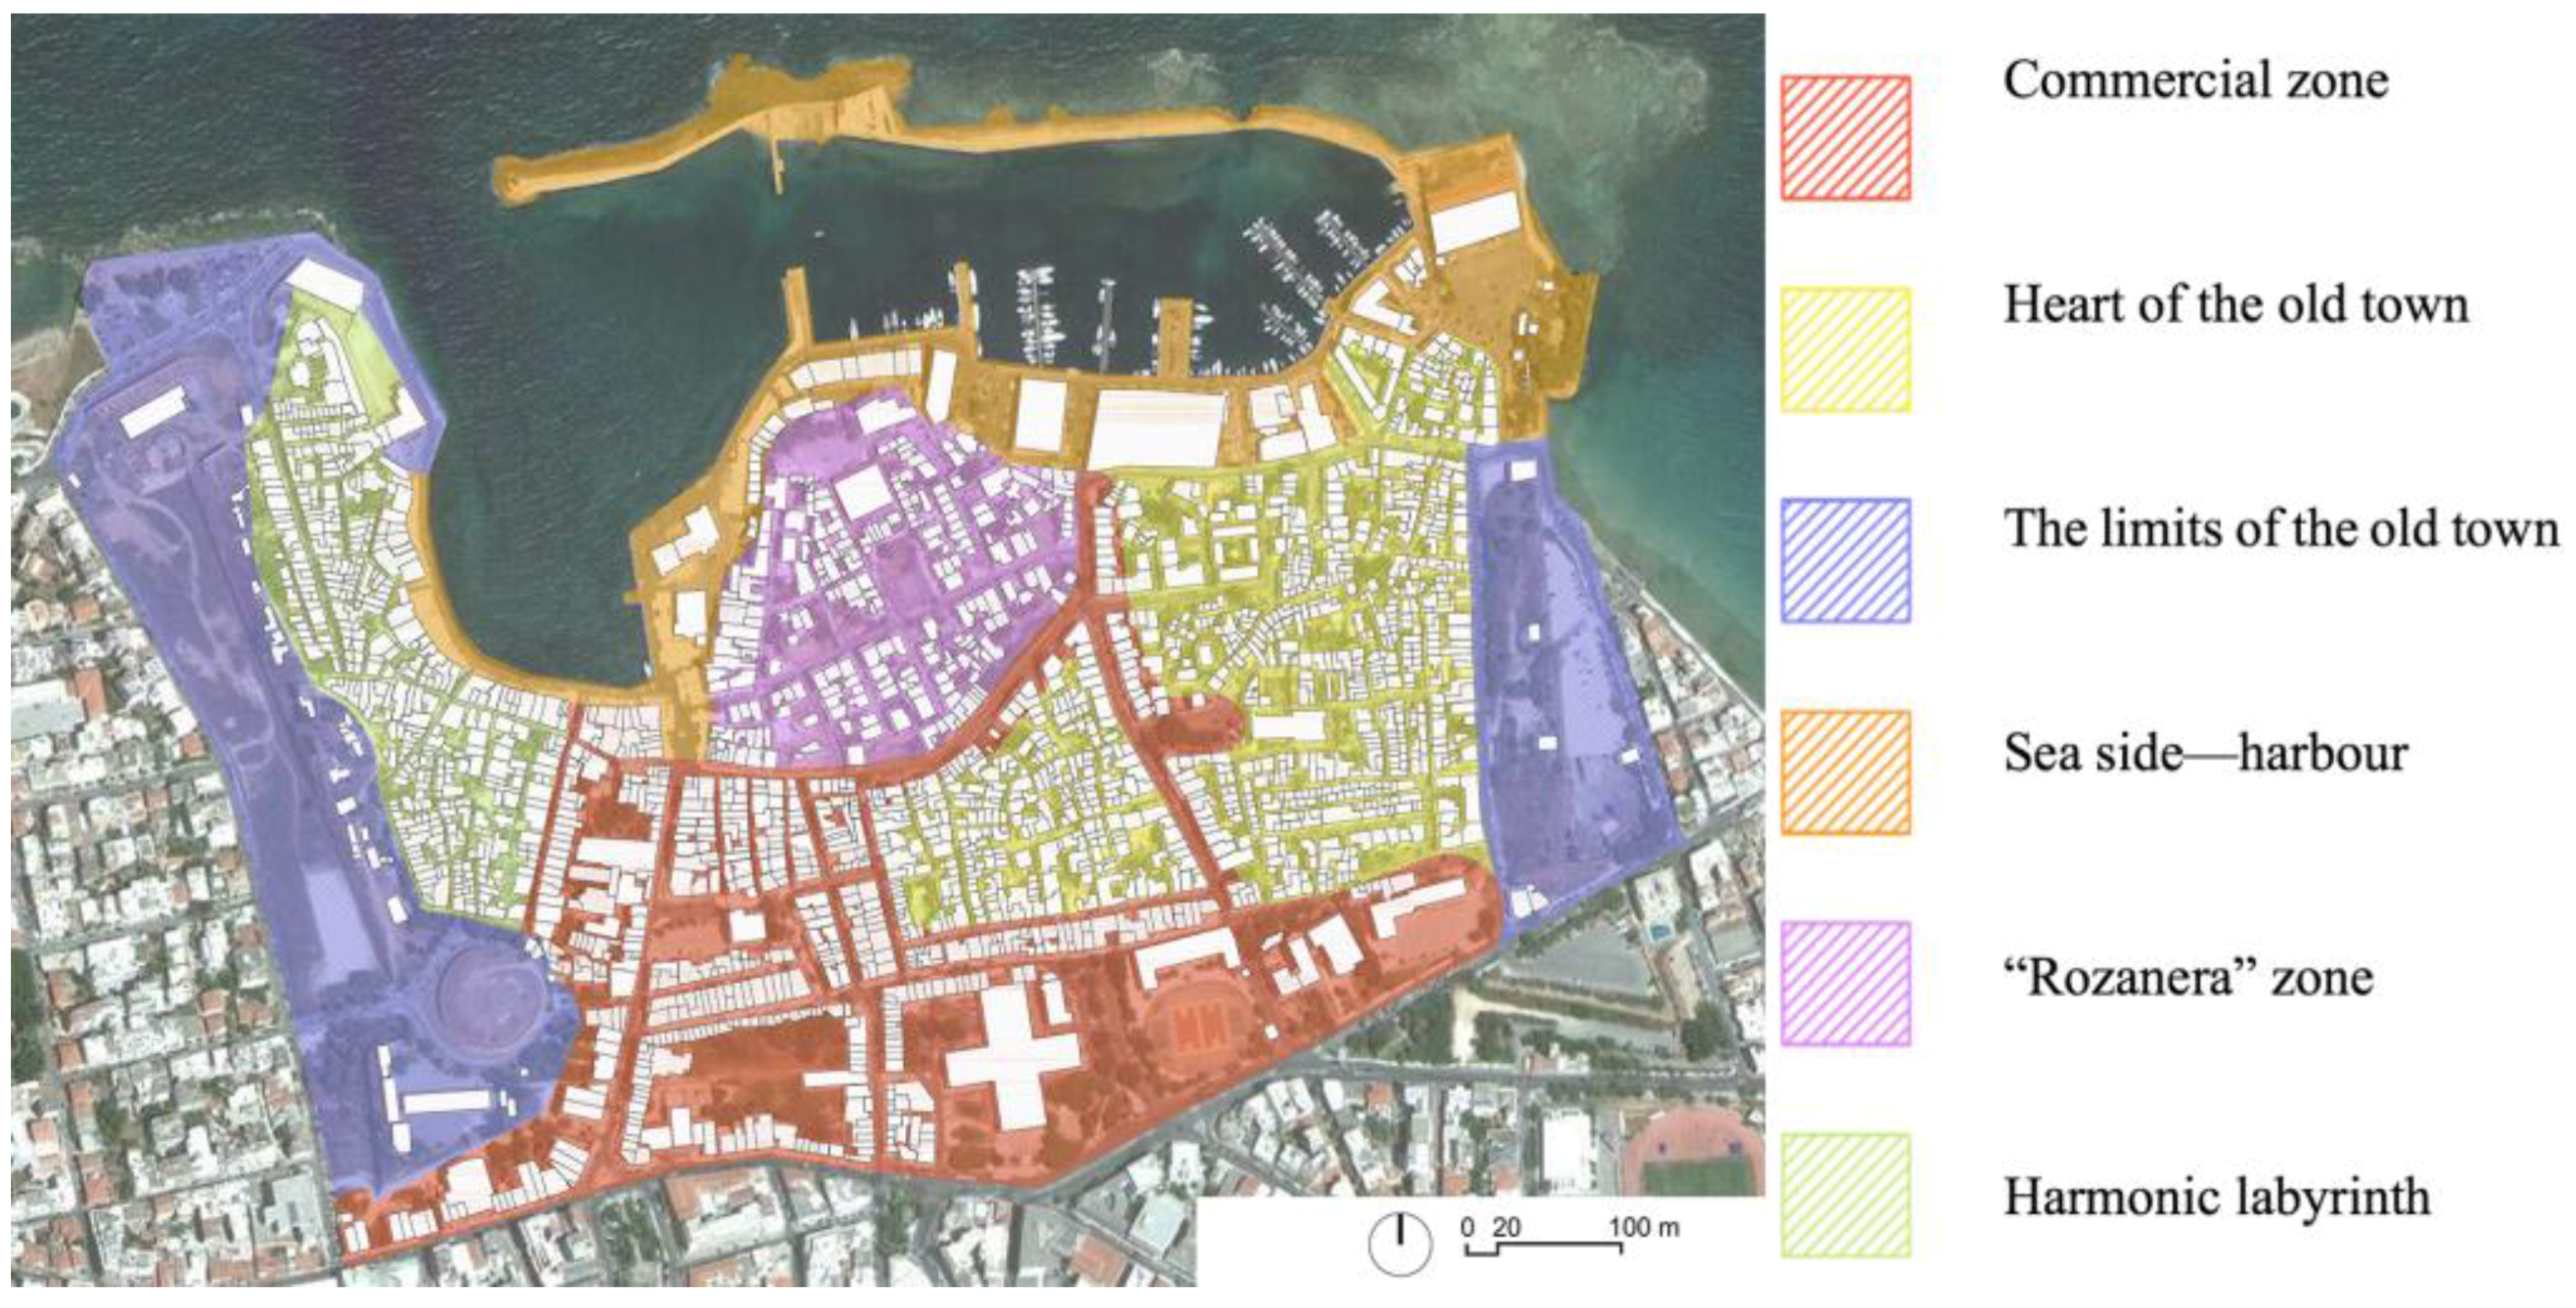
3.2.5. Sound Identity Map
The last map can be considered a transversal map in which we try to characterize the sonic environment of the smaller zones. This map is intended to be read by city mayor services, the town planner, and the architect in order to summarize all of the previous analysis that had been performed before. It shows the same area with different colored zones to explain where you can expect a typical and uniform sound environment. Since the sound perception limits don’t fit the visual perception limits, this area most of the time overpasses the geometrical limits of the urban composition. It expresses, in a visual way, where the differences in the sound environments are inside the studied neighborhood (see
Figure 12).
It’s difficult to compile the dynamic behavior of the sound environment on a map. However, even if it’s constantly evolving, this sound environment is always differentiated in the ears of the inhabitants. Some recurring points are observable; the conditions of production and propagation of sounds (but also noises from transportation) are also repetitive. It’s then possible to determine in a neighborhood one or several sub-areas that characterize, on average, what residents can hear in these spaces (see
Figure 12). In this sense, this map synthesizes the four first and thus gives, in a simple form, the keys to design an action plan for the sound environment.
4. Results: Towards a Noise and Sound Environmental Action Plan
A cross-analysis of the previous described six maps allows acousticians to provide a general noise and sound environmental action plan. As described by the European directives, the noise action plan is determined in order to reduce noise exposure of the inhabitants. The sound environmental action plans aim to give complementary recommendations for all of the districts studied, and in this way addresses general recommendations at the agglomeration city scale. This plan includes architectural, urban planning, and political recommendations concerning the management of noisy areas and especially the management of all of the other areas of the city for which the sound environment must be protected, reinforced, or created. As an example, this work is illustrated on an area of the city that is decomposed according to the three dimensions of the sound environment that we have described in the introduction: the dimensions of the environment, the social practice (milieu dimension), and the soundscape.
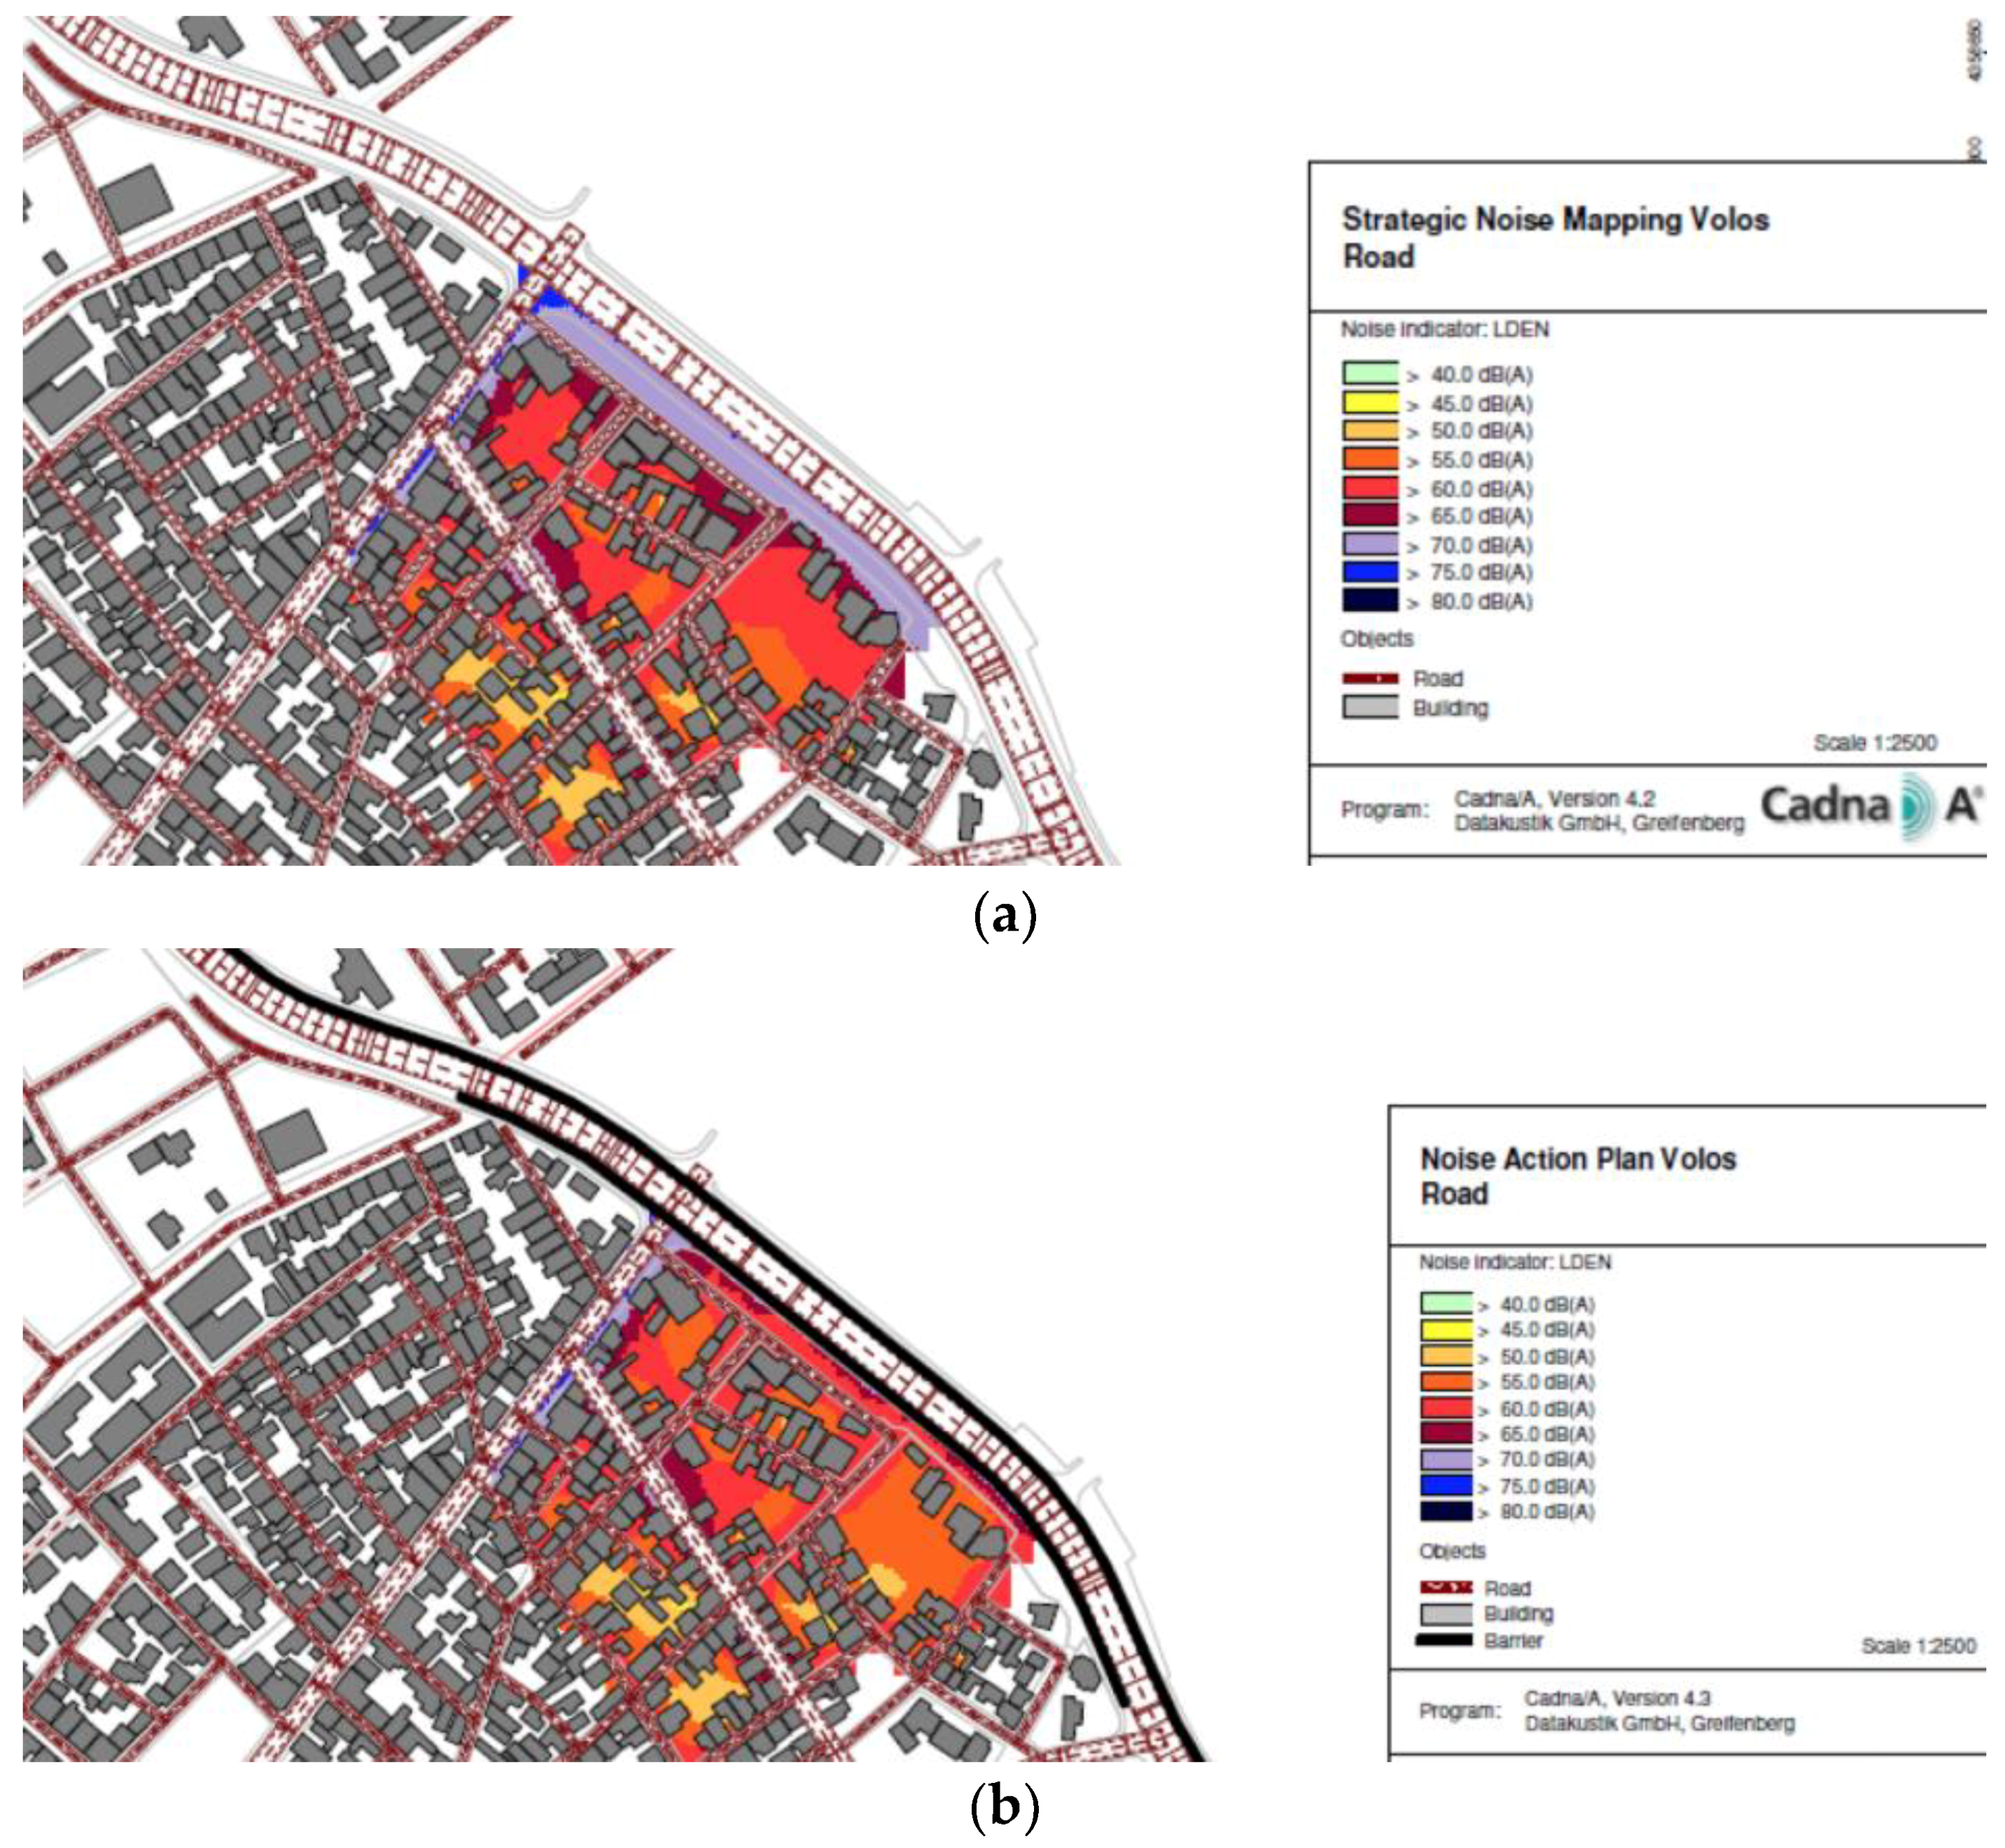
The environmental dimension of the plan preserves the qualities that are identified by residents. A typical UA e.g., Iolkos, was selected due to its high density of dwellings and because it’s crossed by the semi-urban ring motorway. Another challenge lies in the above-mentioned ring motorway being crossed by a major north–south urban avenue axis defining two inner districts with a different architectural typology, and therefore presenting a space of intense exchanges between two major sections of the urban agglomeration in order to accommodate the interactions, trade, services, and commerce among the buildings (see
Figure 13). In this neighborhood, the positive impact of installing several noise barrier solutions was assessed (see
Figure 14a,b). The relevant NAP of the urban agglomeration of Volos suggests that an important part of the residential population is exposed to significantly lower traffic noise levels due to the positive effect of the proposed noise barriers. This result mainly involves residential buildings that directly face the ring road. For the north and south parts, in addition to the above mitigation measures, the improvement of the existing traffic fluidity by reducing the starts and stops of the traffic was also recommended. In addition, a major effort was needed for the rehabilitation and improvement of public transportation. Local authorities must promote further public transportation services in order to reduce the flow of private cars.
Concerning the social practice dimension, the management of activities on the sites has been recommended in order to ensure the mixture of land uses and buildings in a way that avoids sound conflicts in the districts around the Iolkou avenue in Volos. This area already benefits from a very rich mixture of uses that enable it to host a large number of activities throughout the day and evening e.g., shops, cafes, houses, crafts, public services, banks, pedestrian movement, joggers, etc. Therefore, the further development of this aspect of the UA by adding small green spaces and playgrounds in the neglected parts of its surface area was recommended. Bicycle lanes may also be implemented within this area, as well as within the rest of the city. The sound environment of these neighborhoods is largely regulated by the roads and their crossing. The qualities of the sound environment of these neighborhoods are therefore directly linked to the mobility of the transport and people in this area (see
Figure 15). The recommendation for the authorities was to deal with the problems observed on this site, particularly in the crossings of the various flows and the resolution of their priorities (buses, cars, bikes, pedestrians, etc.).
Recommendations concerning the particularities of the soundscape outline have included creating additional sound aesthetic interventions in order to promote soundscape hearing rehabilitation towards the north part of this urban area. The urban density of this northern part of the urban area is high. As a result, in this part of the city, the sound environment is more similar to that of a small rural village, where it’s practically possible to hear the conversations of residents (or even TV sets) in the street (see
Figure 16). Public spaces are narrower and do not easily let the cars pass, and it is appreciated that in these spaces, the sounds of nature are more present. The use of neglected public spots was recommended to create recreation and rest areas where people can meet during the evenings (with or without playgrounds).
In this framework, the NAP was further complemented for the following urban areas: Iolkos, Fitokou, Karagatz, the old city and seafront in Volos Alkazar Parc, the Echekratidos urban areas in Larissa, the old city of Chania, and Alikarnassos UA in Herakleion, the so-called Pontikonissi in Corfu, the city center of Agrinio, and Thessaloniki [
14,
21,
25,
26]. Sound environment plans were recommended based on the previous methodologies, and the main proposals were all aiming to reduce noise exposure and make the sound environment sustainable.
5. Discussion
Numerous examples and cases wassessed in this paper, which made it possible to complement European directive 2002/49/EC on environmental noise through a series of approaches, observations, and analyses regarding the sound environment. Τhe main aspects of sound quality e.g., stimulus–response compatibility, pleasantness of sounds, and the identifiability of sounds or sound sources, are important to be addressed within the proposed noise action plans [
34]. The proposed approach complements both the quantitative approach of the EU directive and the qualitative approach of the urban acoustic environment. It’s based on the research of various teams, who consider that the basic sources of environmental noise (such as transport and industry) are not the only ones responsible for the sound quality of the urban environment. Furthermore, social surveys of the relationship between noise exposure and the subjective reactions are very useful, and all converge toward a comprehensive understanding of all of the factors characterizing the response of inhabitants when their neighborhood soundscape is assessed [
35].
Therefore, this approach further proposes the creation of a series of maps that complete the engineering approach of SNM and NAPs by relating them to sound perception, geography, and sociology. However, in order to be more efficient, this approach requires additional data to be collected, with an emphasis on inhabitants’ perceptions in connection with a series of observations and in situ recordings. It implies that the analysis must be carried out on a neighborhood scale, and for this reason, it may be assumed that a survey done for one neighborhood is not necessarily immediately replicable as identical for another neighborhood. Nevertheless, a comprehensive study of several dissimilar neighborhoods may introduce indicators either for each district separately, or for the entire urban agglomeration.
It’s therefore relatively important to properly select the UAs that will be further studied and analyzed thoroughly. Indeed, they need to represent both the peculiarities of the urban agglomeration and the UA, and also focus on a significant number of development issues. For example, in the urban agglomeration of Volos, the study focused on a number of districts with variable densities at the edge of an urban ring road, which over the years has seen its traffic considerably increased. In the same way, in the UA of the old city in Volos, in which the main entrance of the city is directly connected to the city’s train station, the focus was given to the implementation of three major roundabouts in order to further facilitate the road traffic flow. As a result, the proposed solutions can also be generalized to other similar neighborhoods or simply to engage the authorities in thinking about issues that involve the whole territory: access to public transport, the development of several soft transport modes, the relocation of transport infrastructures, the creation of both recreation and sport facilities, the distribution of commercial activities and housing, the preservation of parks and gardens, etc. To illustrate this, it can be said that often, in the case of the Greek urban agglomerations mentioned above, relevant environmental studies proposed the introduction of bicycle networks in order to minimize the use of the private cars and promote a shift to more ecological transport modes.
Therefore, the proposed solutions within the context of the management and rehabilitation of the sound environment are not necessarily from acoustic solutions and mitigation measures. The sound environment requires that we take care of all of the sound sources and their spaces of propagation and reception by inhabitants. As a result, this approach must also be open to the expertise of all of the stakeholders in urban space planning, such as architects, urban planners, transportation engineers, and politicians.
One can criticize this approach by saying it does not provide an exhaustive and scientific evaluation of the soundscapes of a city. The methodology is generally a part of the resolution also, but it’s important to say that this method does not offer any “miracles” for any type of urban areas in any context. The method is a quantitative and qualitative approach, and therefore is strongly dependent on the location when articulating the acoustic meanings of the live experience of the inhabitants. The purpose of such approaches is to evaluate the minimum conditions for the existence and protection of these sound qualities (acoustic, spatial, or social) within the relevant NAP in order to protect them, further promote them, and if applicable, propose new ones. It’s actually a quite innovative perspective that aims to analyze the existing situation and identify the main features and the design of its development.
In this context, the methodology allows revealing what makes a neighborhood specific from the sound point of view, and therefore avoiding actions that could make it neutral, and thus without quality, and produce an uninterested sound environment without significance or meaning for the inhabitants. It should be noted that this approach makes it possible to produce sustainable sound environments insofar as they are identified by their inhabitants, and the proposed modifications are shared by the residents, who are therefore ready to evolve with them. In this sense, a sustainable sound environment would be an environment with the qualities identified by the inhabitants whose evolution would be sustainable for them.
6. Conclusions
In the framework of the European directive 2002/49/EC for the assessment of the environmental noise in Greece, in the time period between 2012–2016, an opportunity was offered to develop a specific methodology in order to analyze the sound environment of several urban areas in large and medium-size urban agglomerations of the country e.g., Volos, Larissa, Heraklion, Chania, Agrinio, Corfu, and Thessaloniki. This paper presents an innovative multidisciplinary approach, showing how environmental noise data can be cross-analyzed with urban and architectural data and perception descriptors expressed directly by the inhabitants. It shows how these results may be implemented in the proposed NAP for the authorities to have a more comprehensive plan called Sound Environmental Action Plan (SEAP).
This approach makes it possible to treat dissimilar study cases in Europe within urban agglomerations of different sizes. It obviously involves, more or less, several resources depending on the size of the studied agglomeration, but it’s also possible to select a number of smaller urban areas to analyze and propose recommendations both for specific neighborhoods and also for the entire agglomeration.
This approach synthesizes numerous works relating to the perception of the sound environment, and its management and possible rehabilitation. It’s based on the constitution of a series of overlapping sound and space data maps produced from observations, measurements, modeling assessments, and interviews carried out in situ. Its results are not only used to complete the SNM and NAPs according to the European directive, but they further participate in elaborating different actions for the involved stakeholders, which could possibly preserve, enhance, and create a sustainable sound environment for the European cities of tomorrow.


