Application of GIS-Based Multi-Criteria Decision Technique in Exploration of Suitable Site Options for Anaerobic Digestion of Food and Biodegradable Waste in Oita City, Japan


Abstract
:1. Introduction
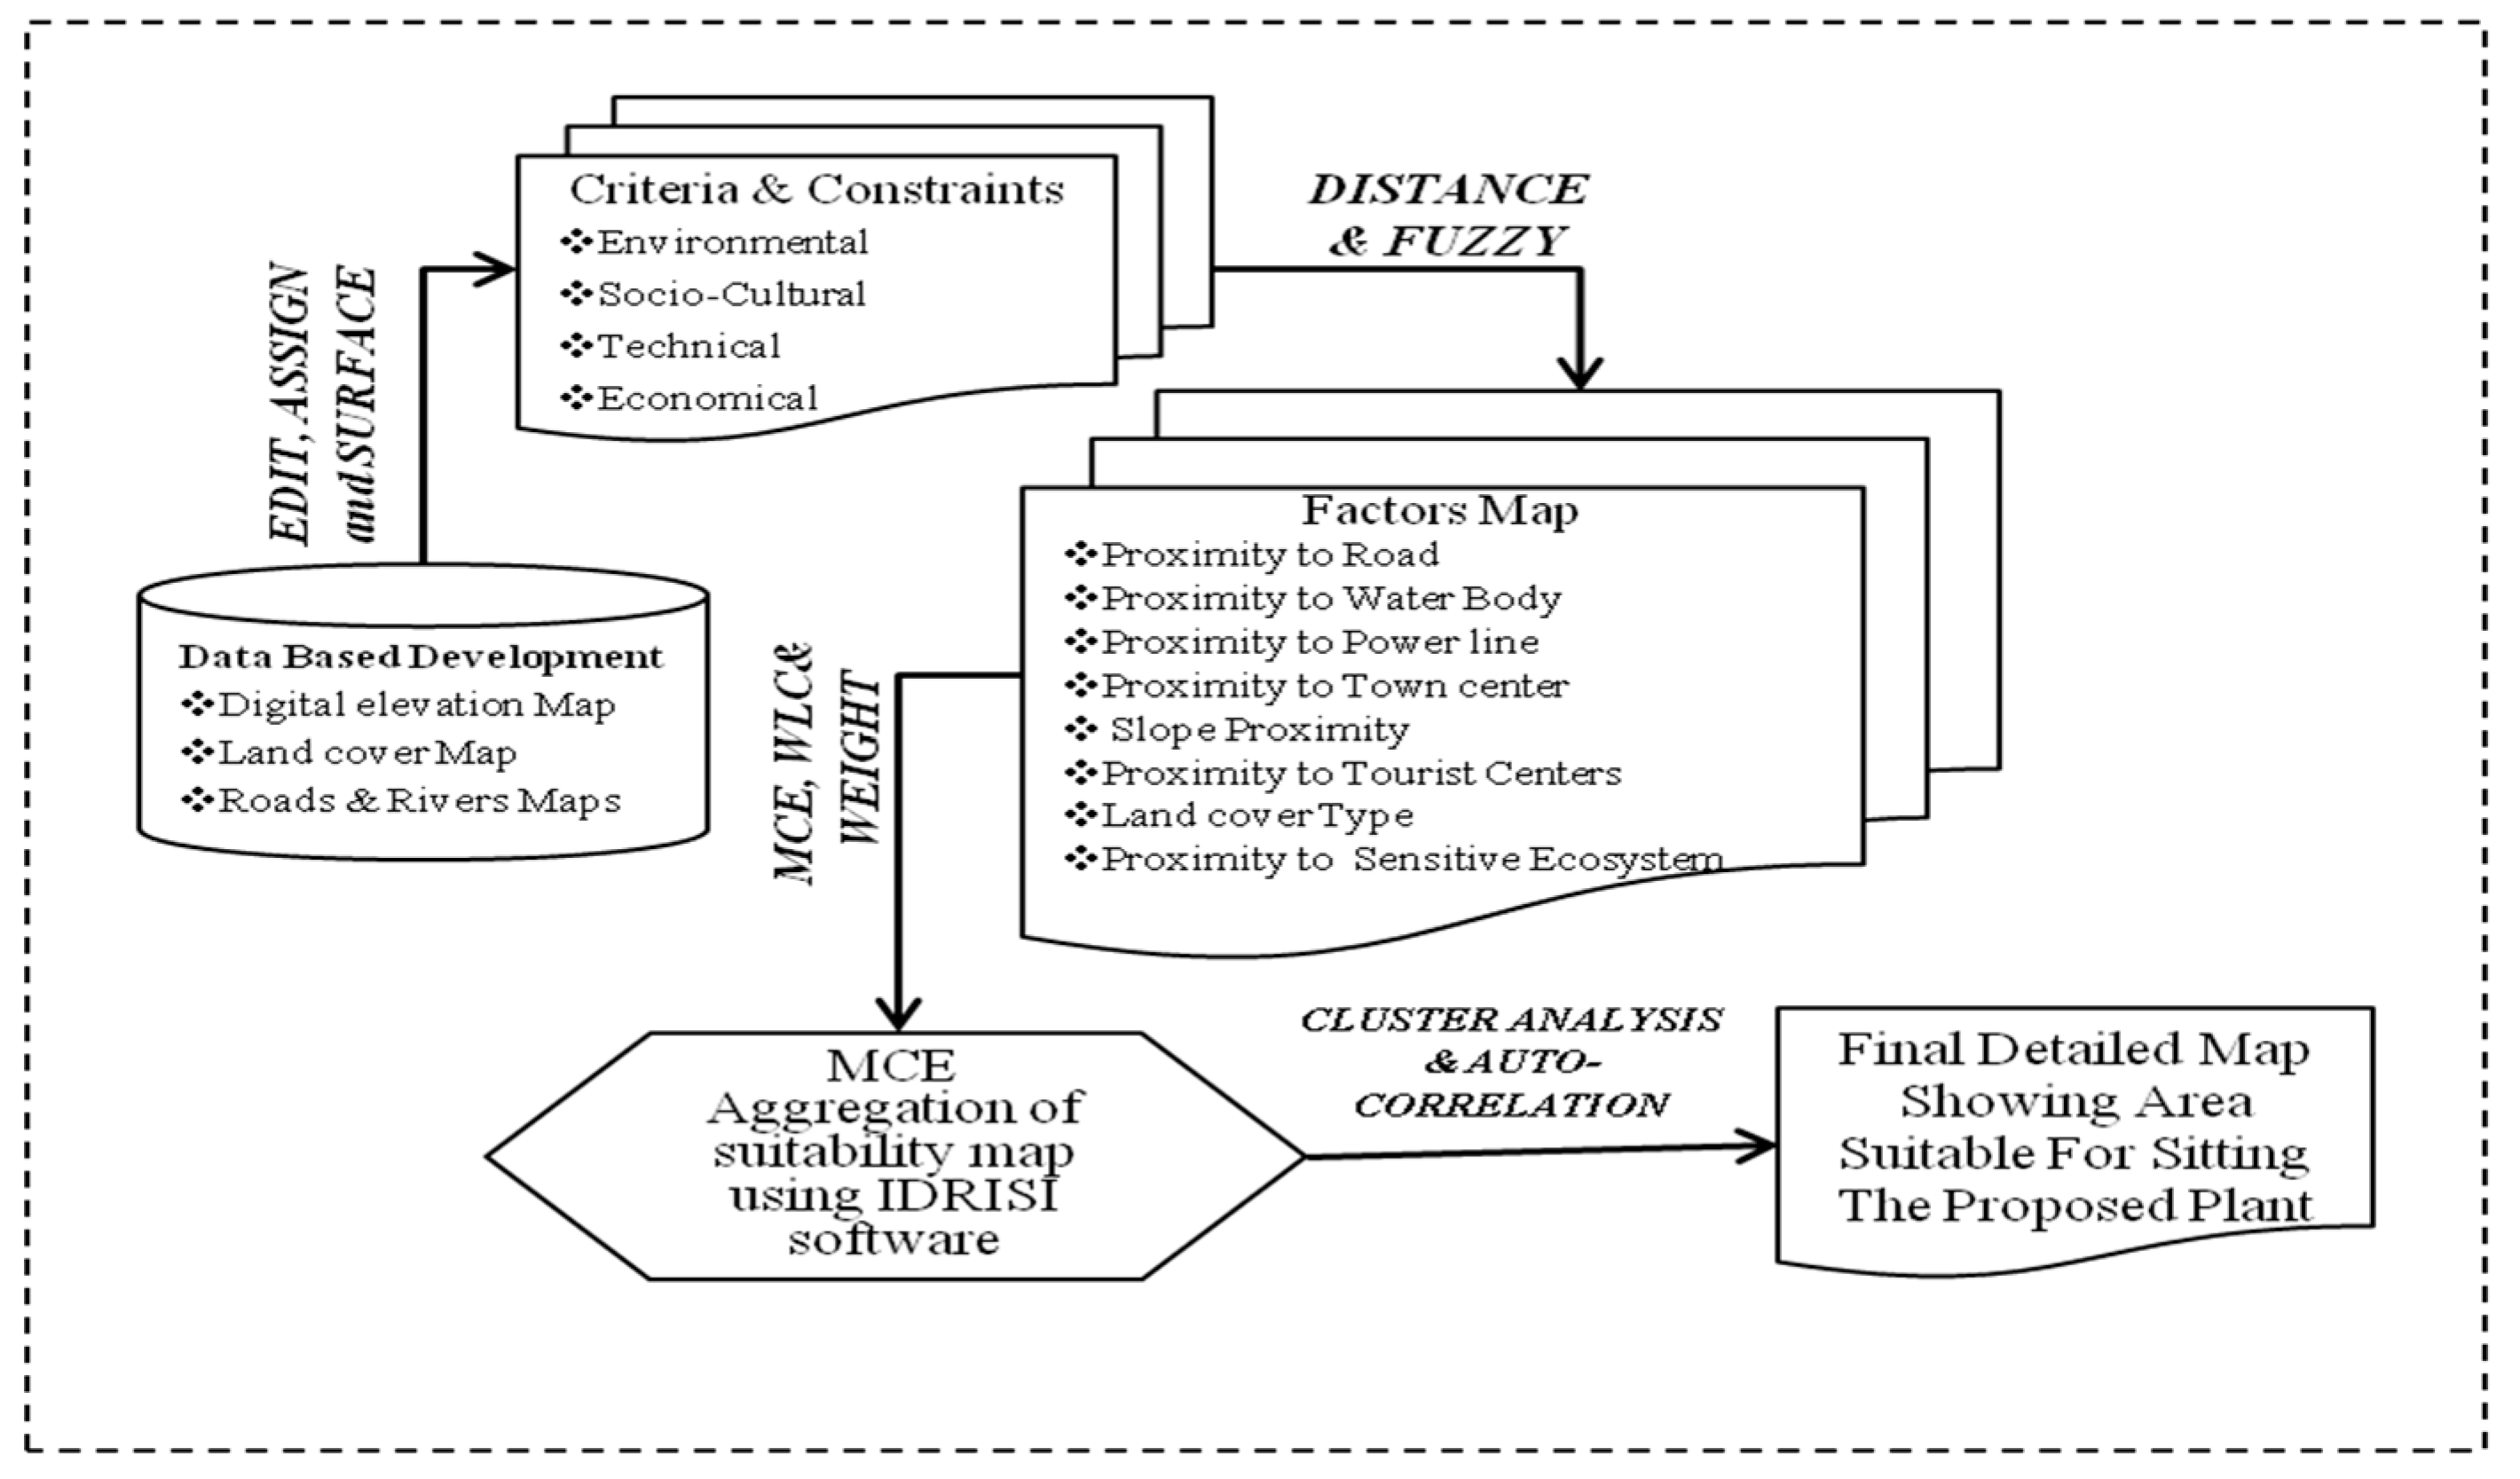
2. Materials and Methods
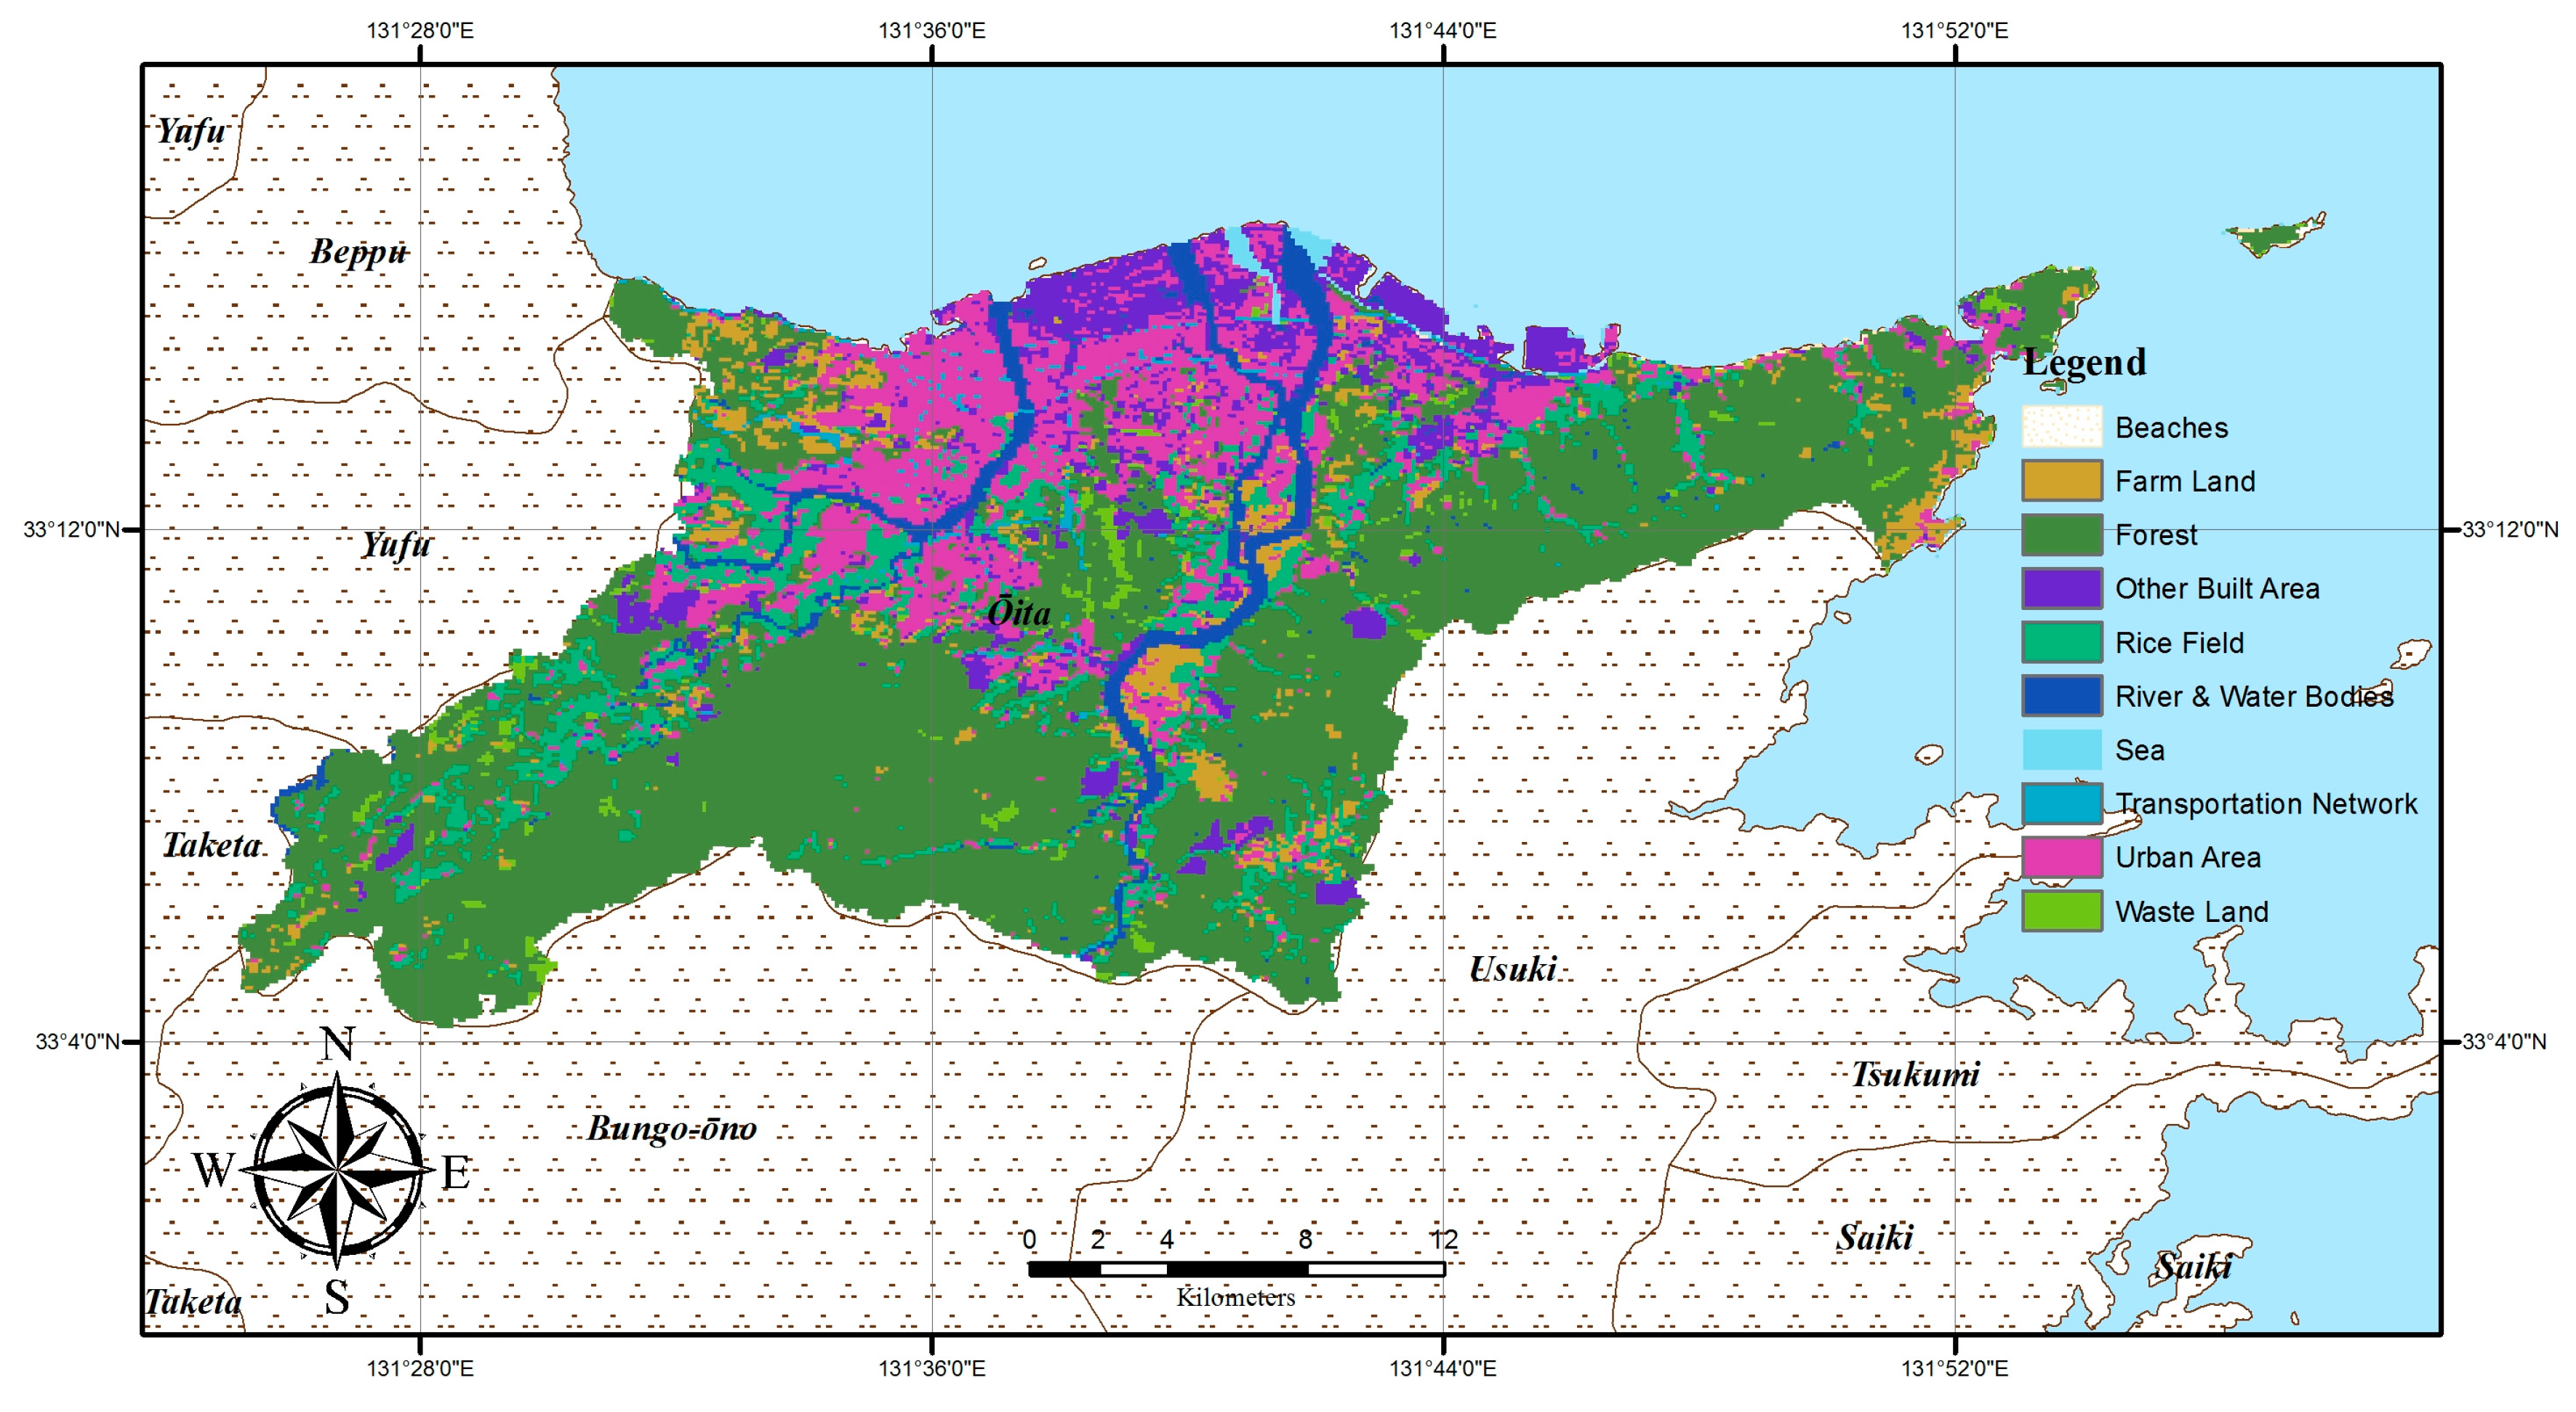
2.1. Study Area
2.2. Criteria Evaluation: Constraints and Factors
2.3. Weighted Linear Combination
- Wi is the weight of each factor i,
- and Xi is the criterion score of factor i.
- and ∏ is the product.
- Rmin is the minimum score,
- and Rmax is the maximum score.
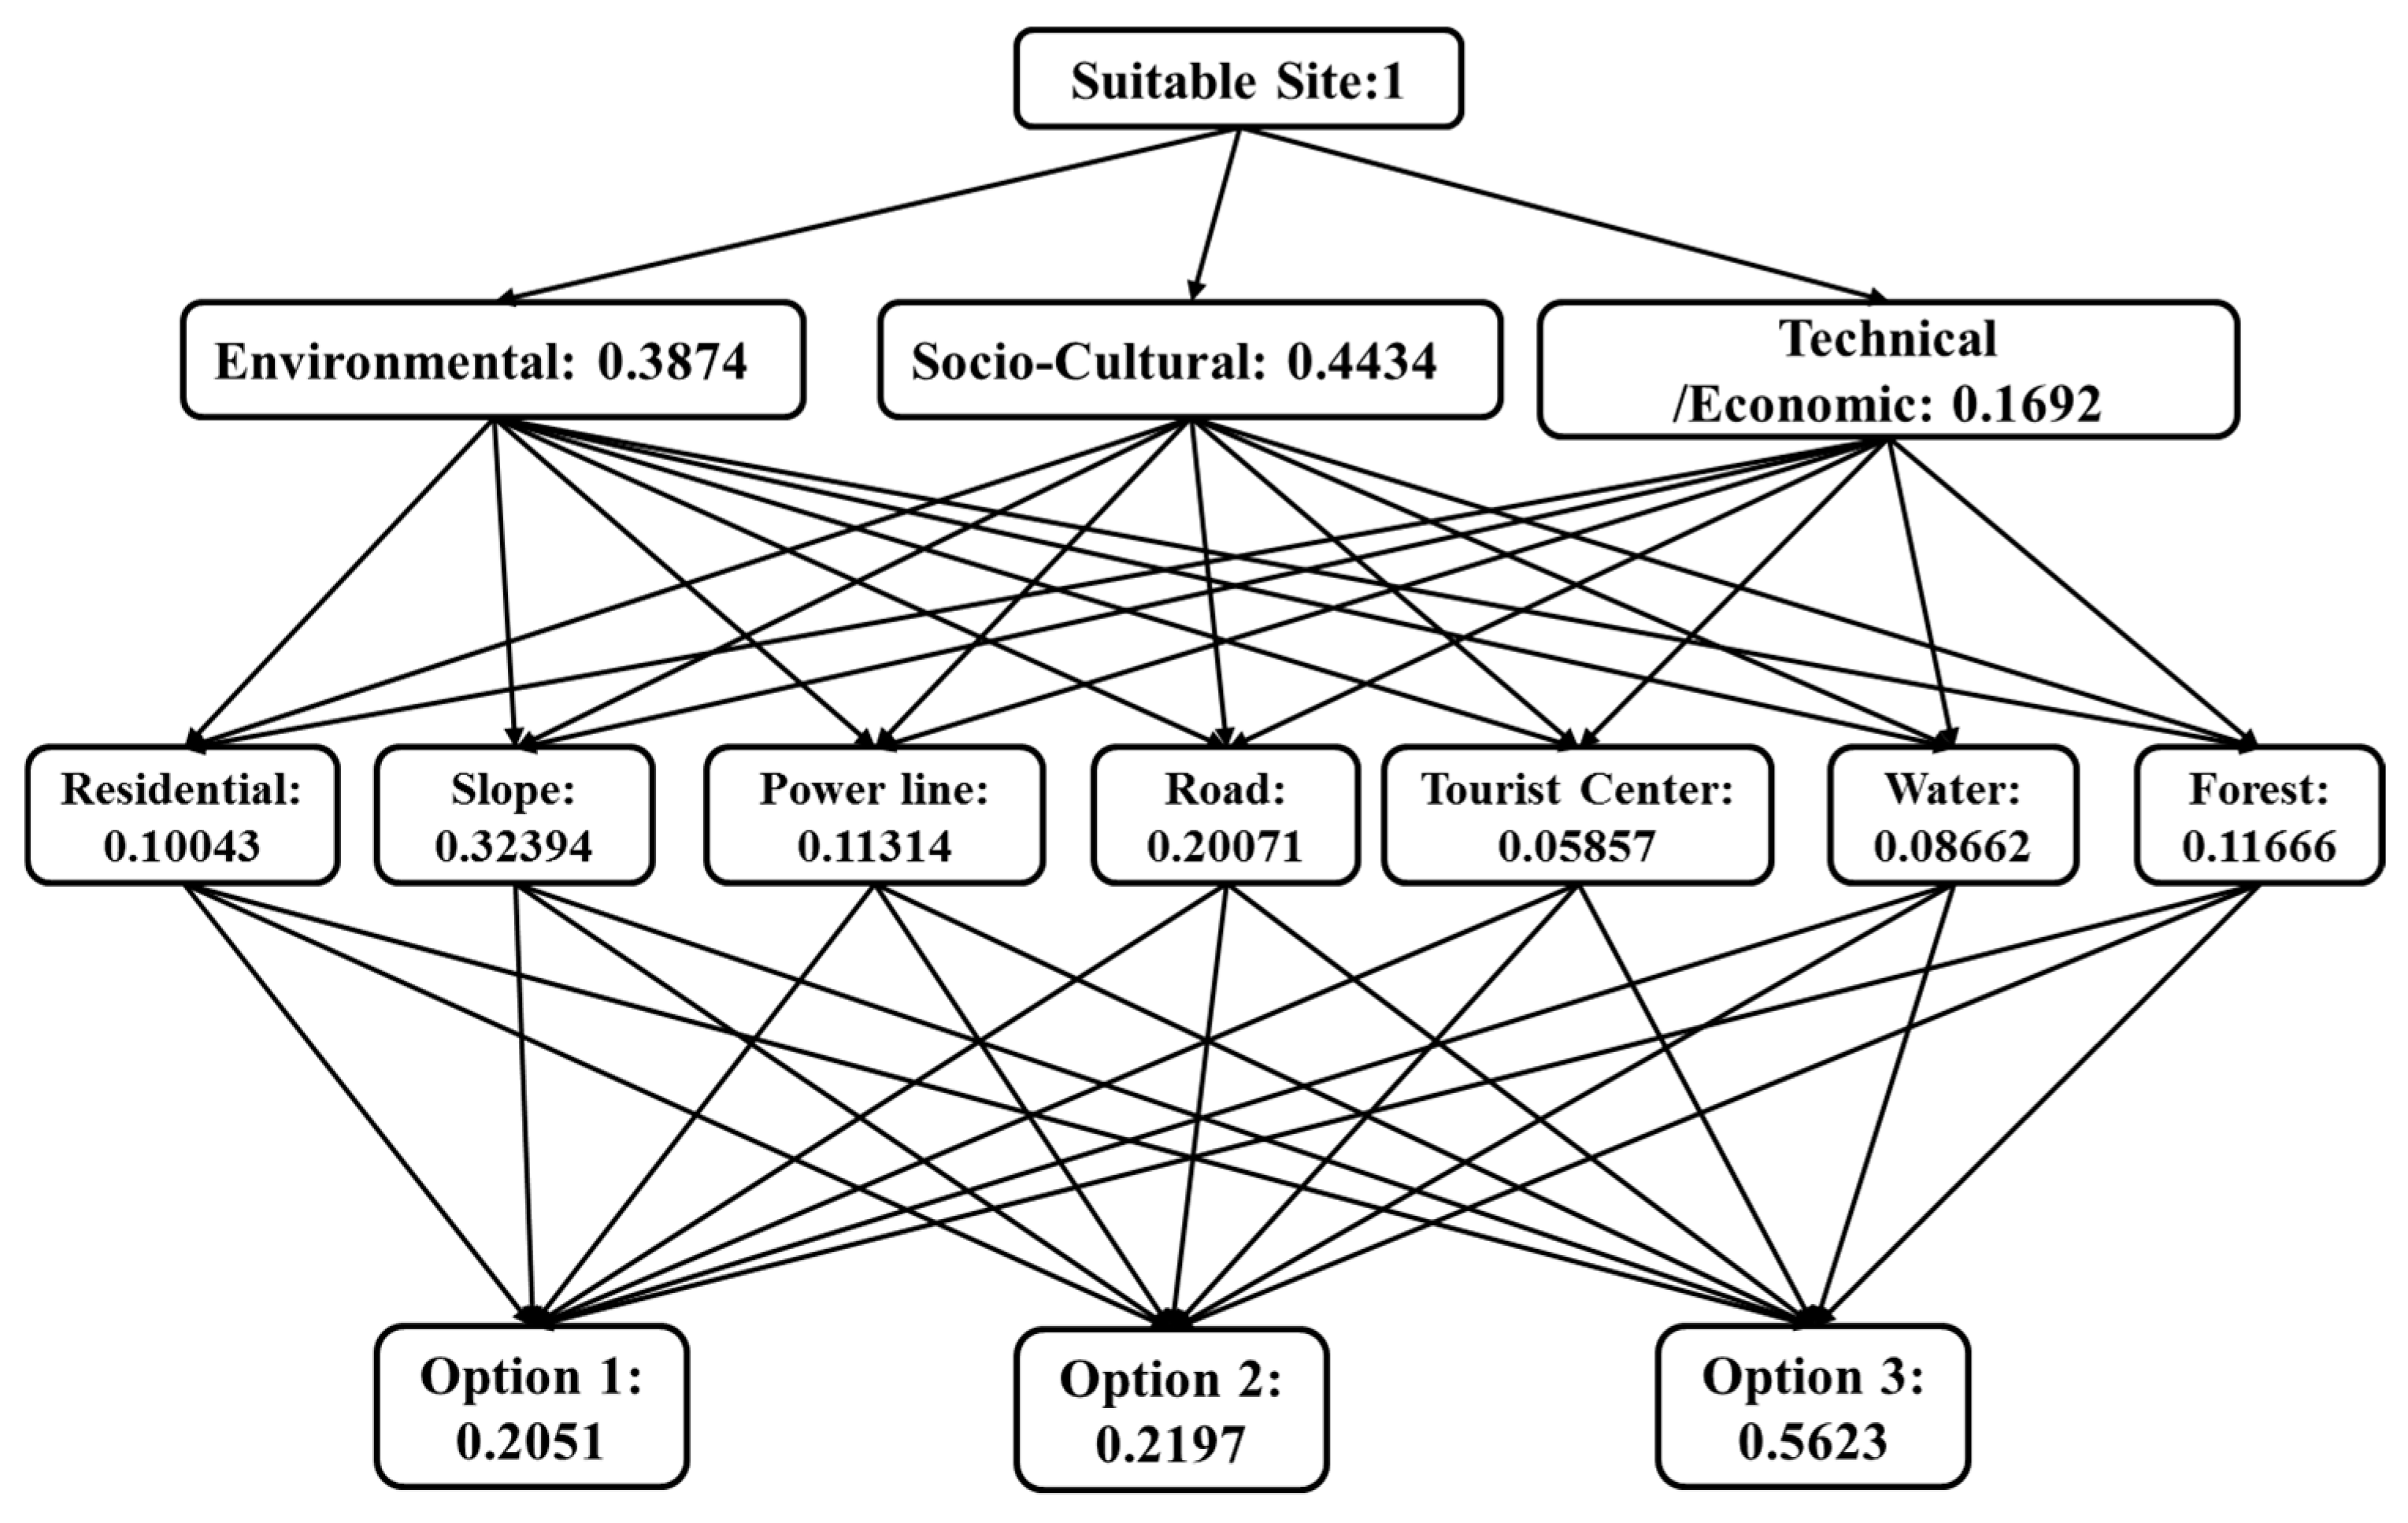
2.4. Pairwise Comparison
3. Results
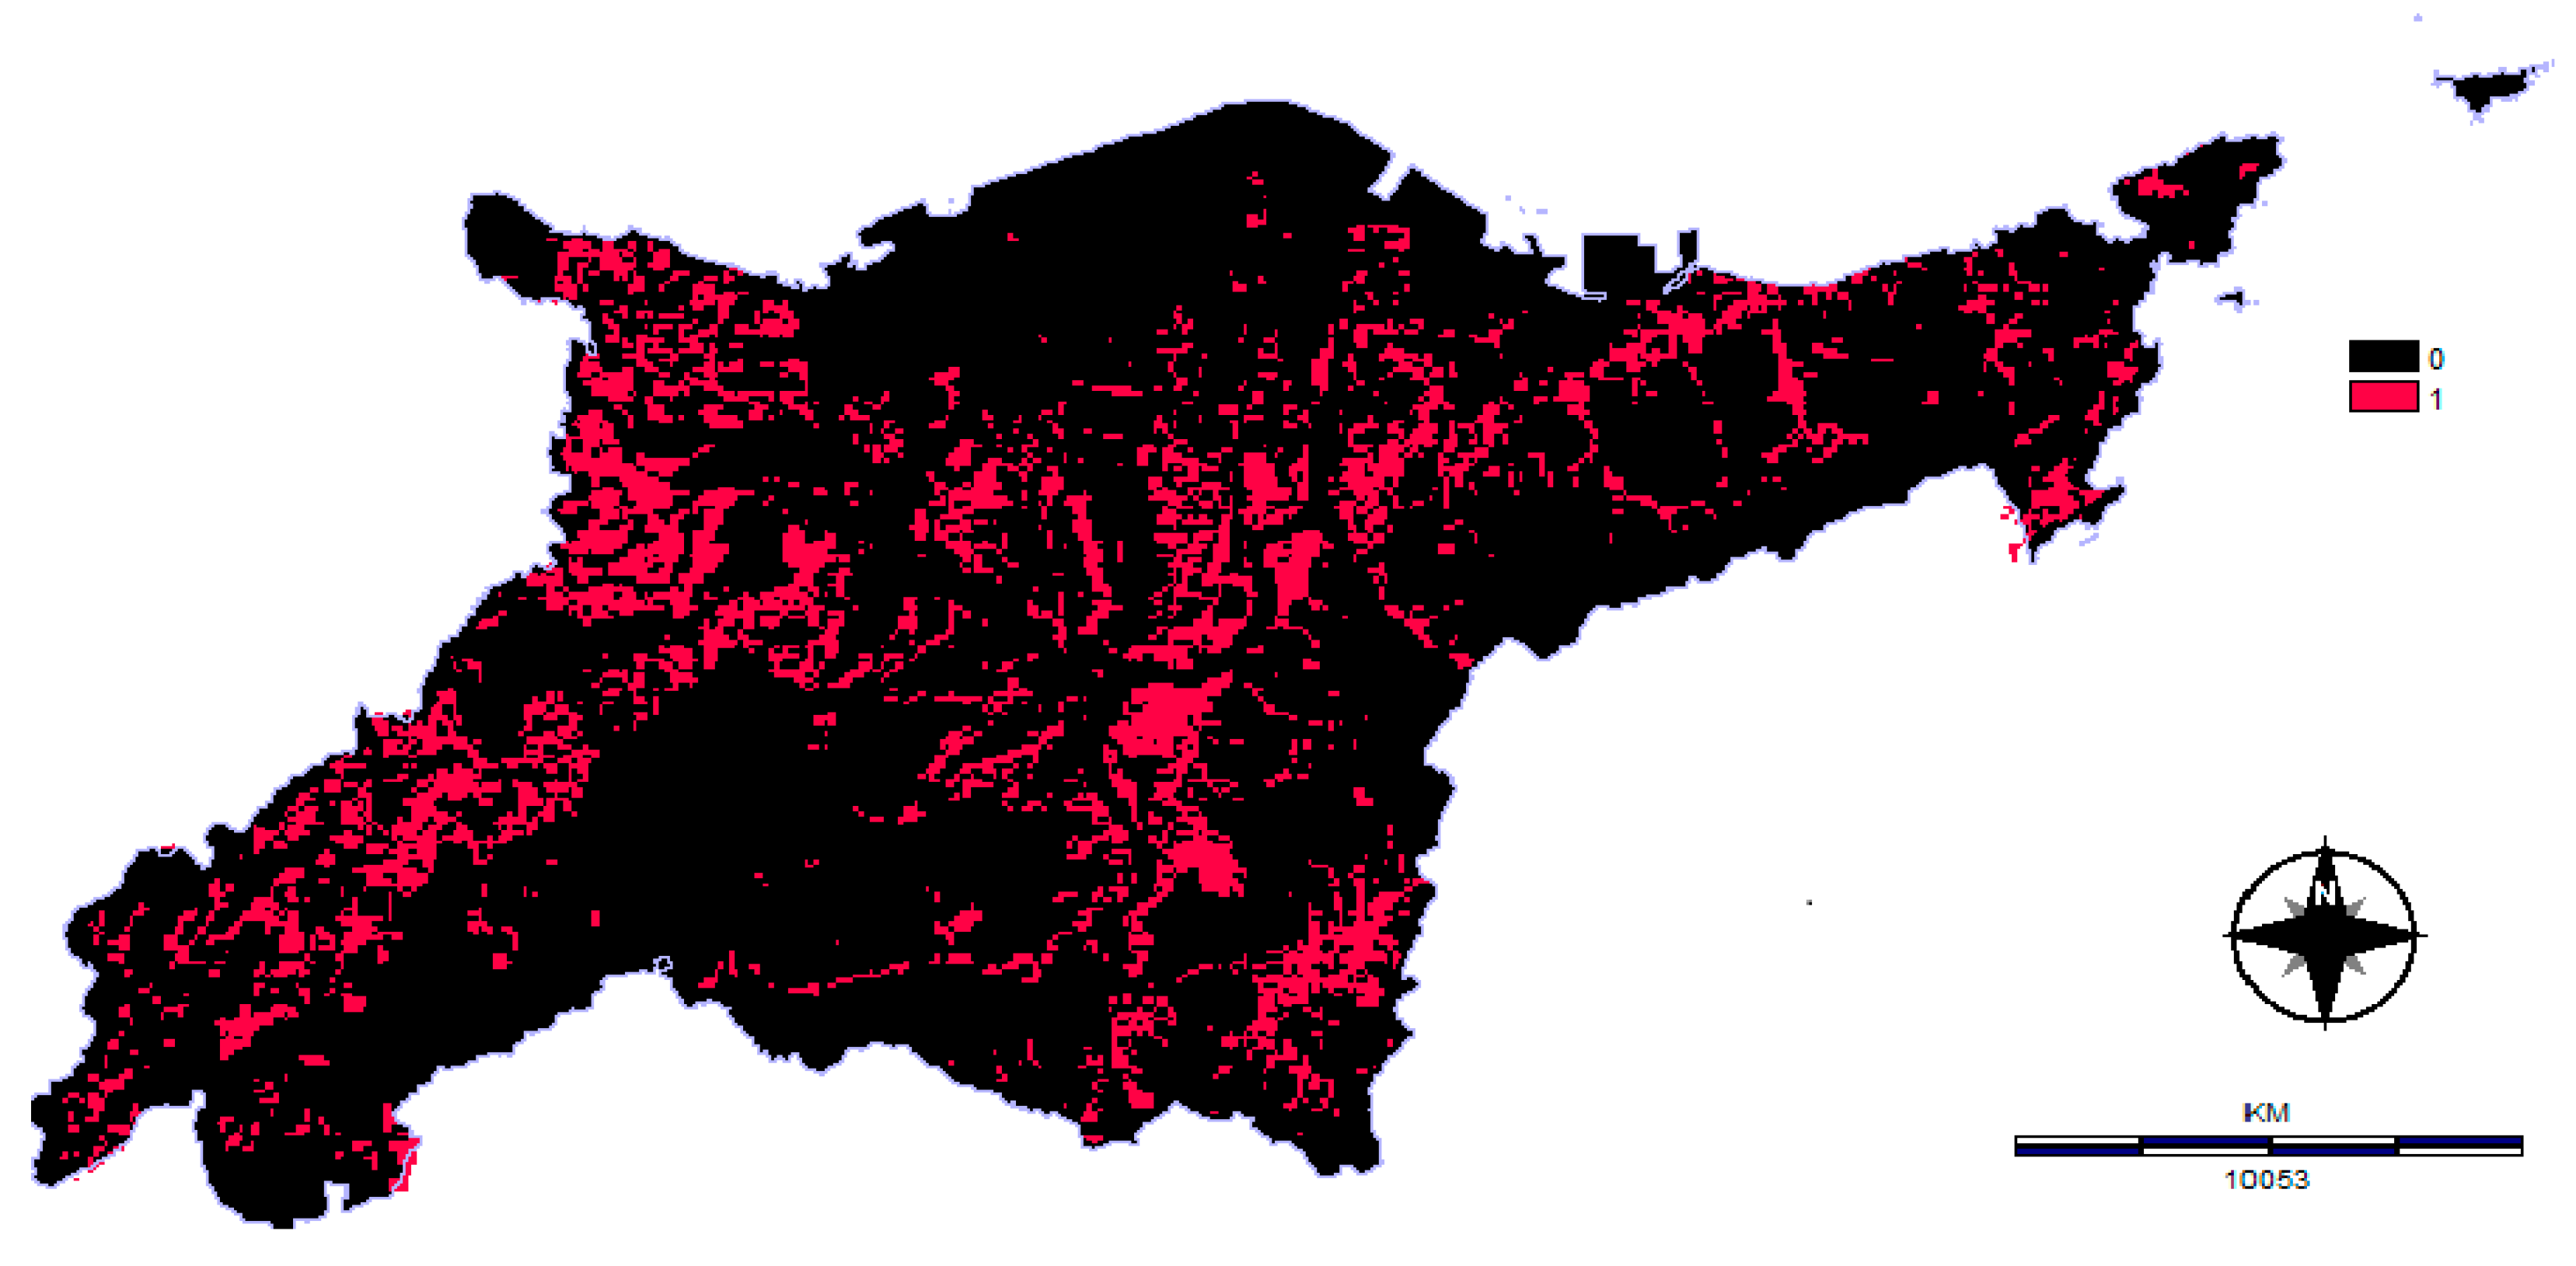
3.1. Constraint Map
3.1.1. Environmental Constraint Map
3.1.2. Sociocultural Constraint Map
3.1.3. Technical/Economic Constraint Map
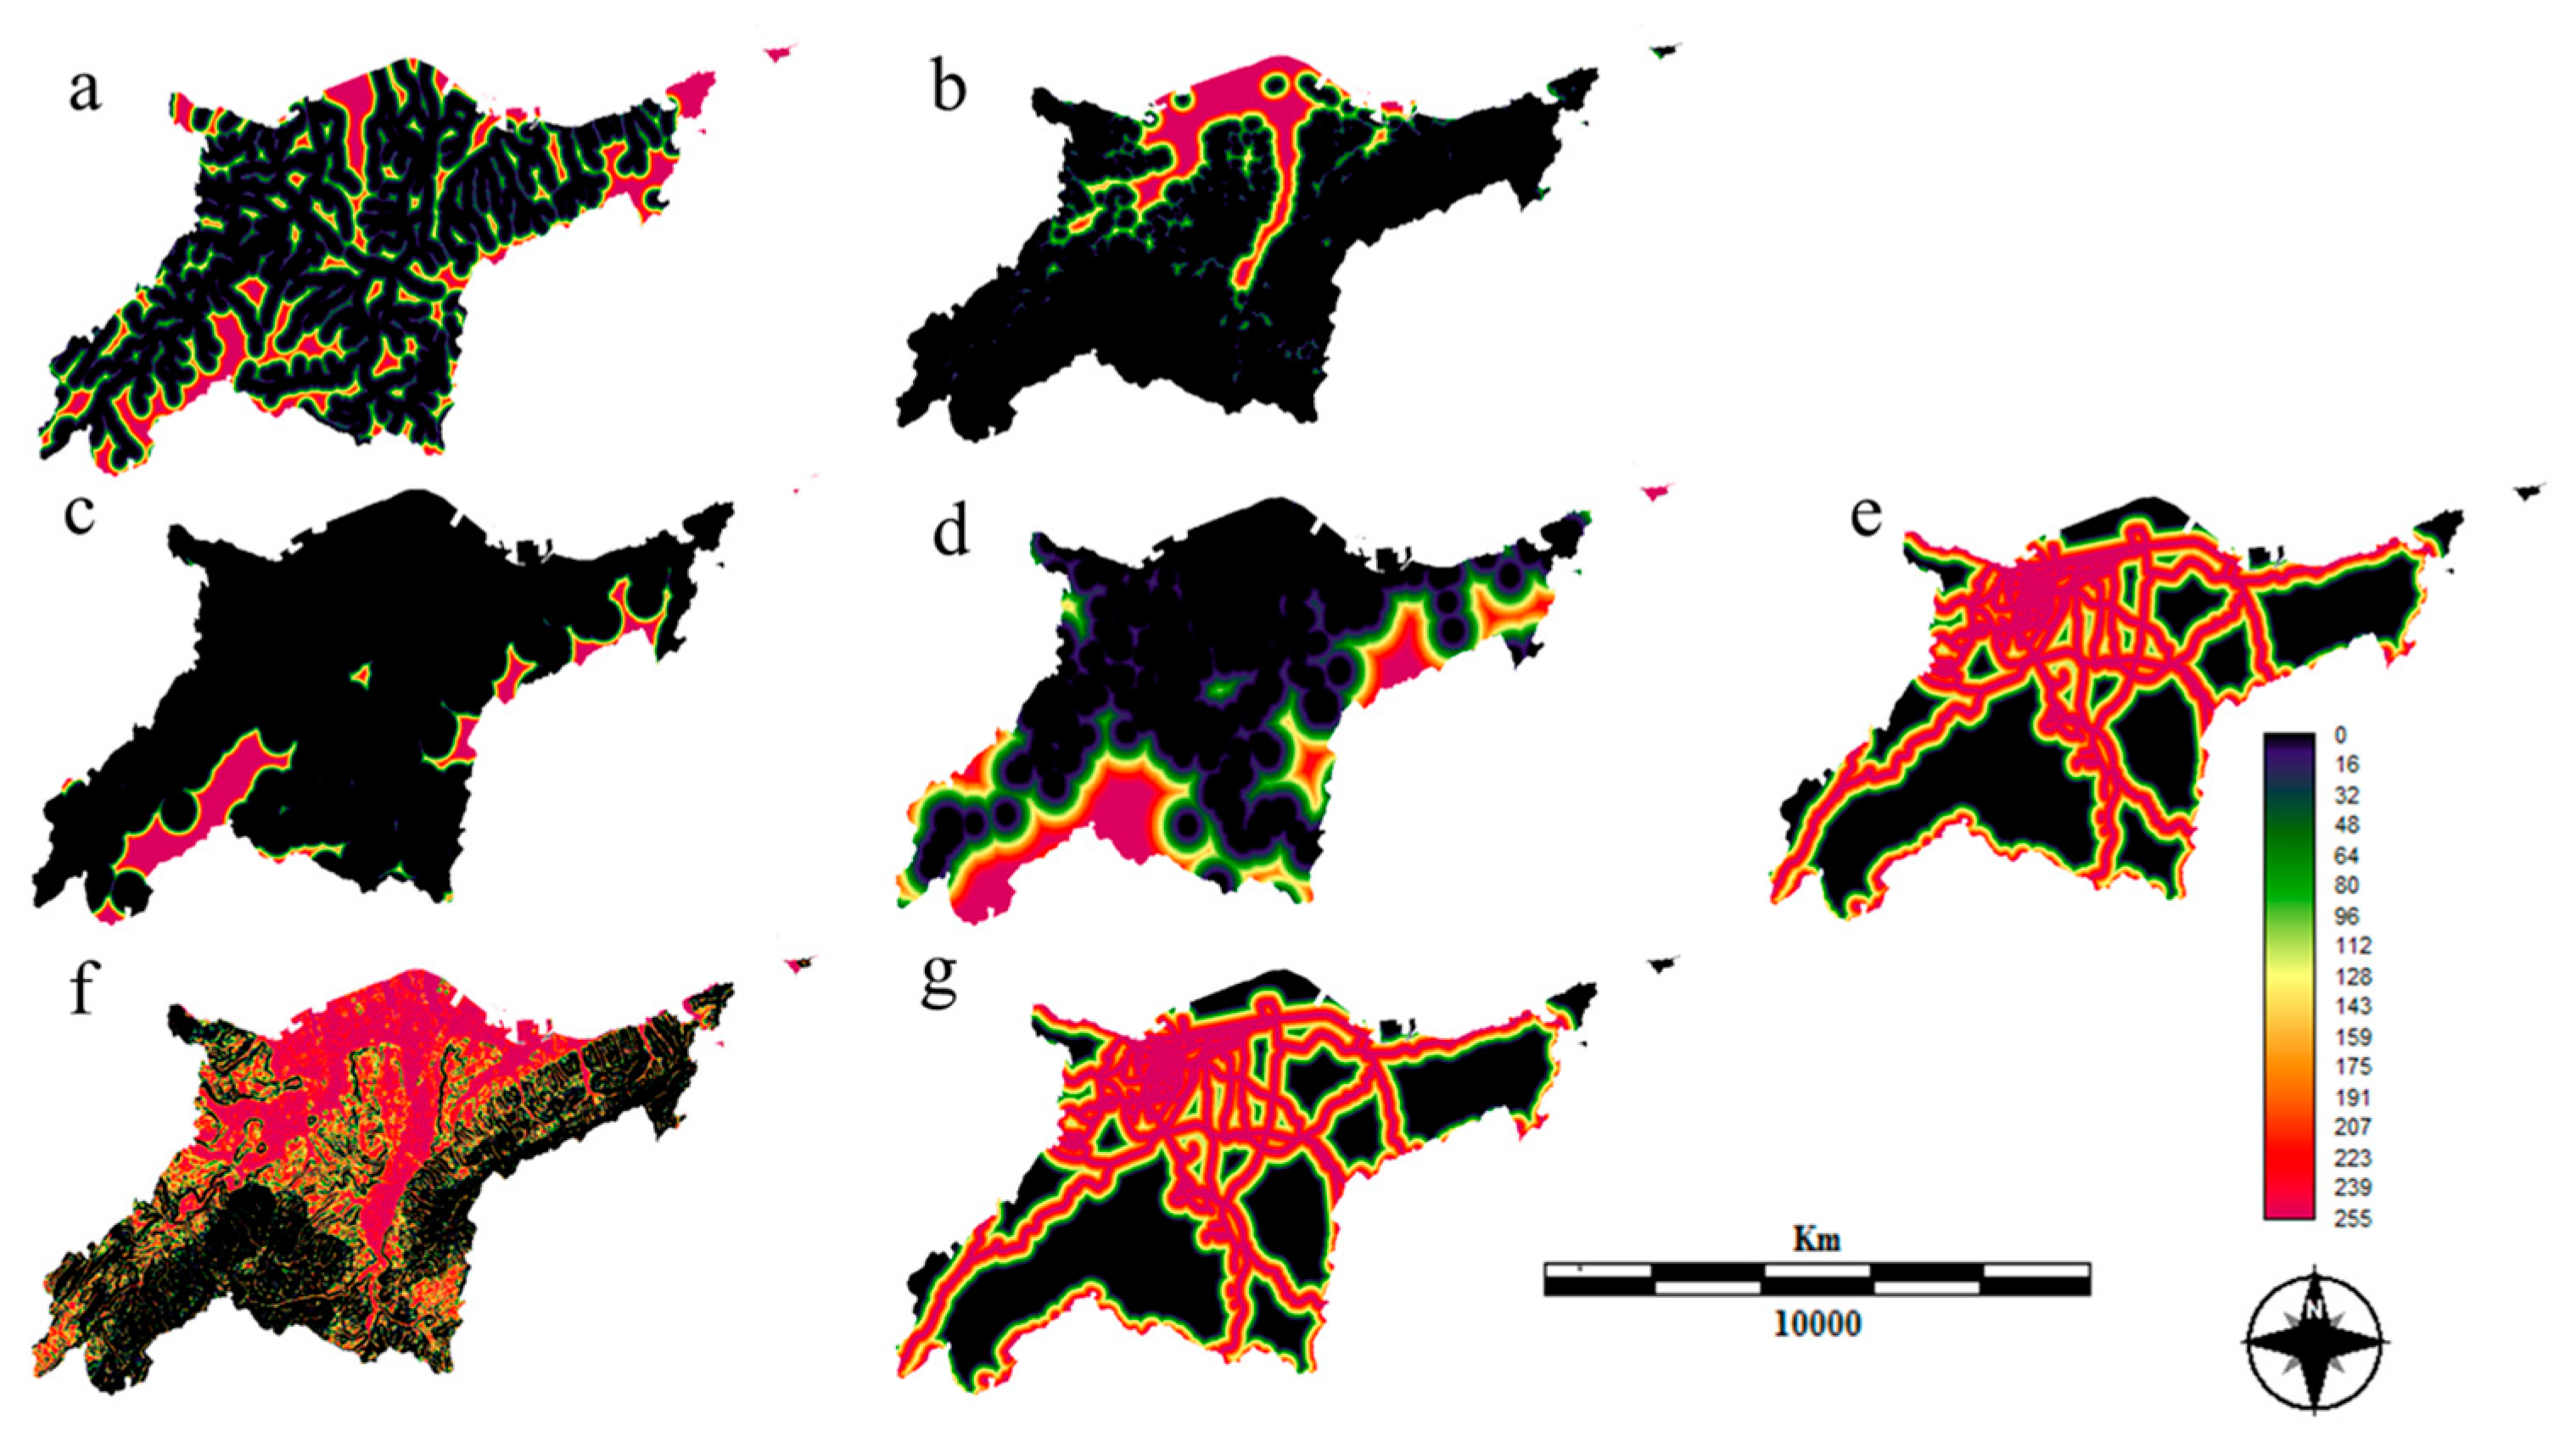
3.2. Factor Standardization Using Fuzzy Function
3.2.1. Proximity to Water Bodies
3.2.2. Proximity to Forests
3.2.3. Proximity to Residential Areas
3.2.4. Proximity to Touristic and Cultural Centers
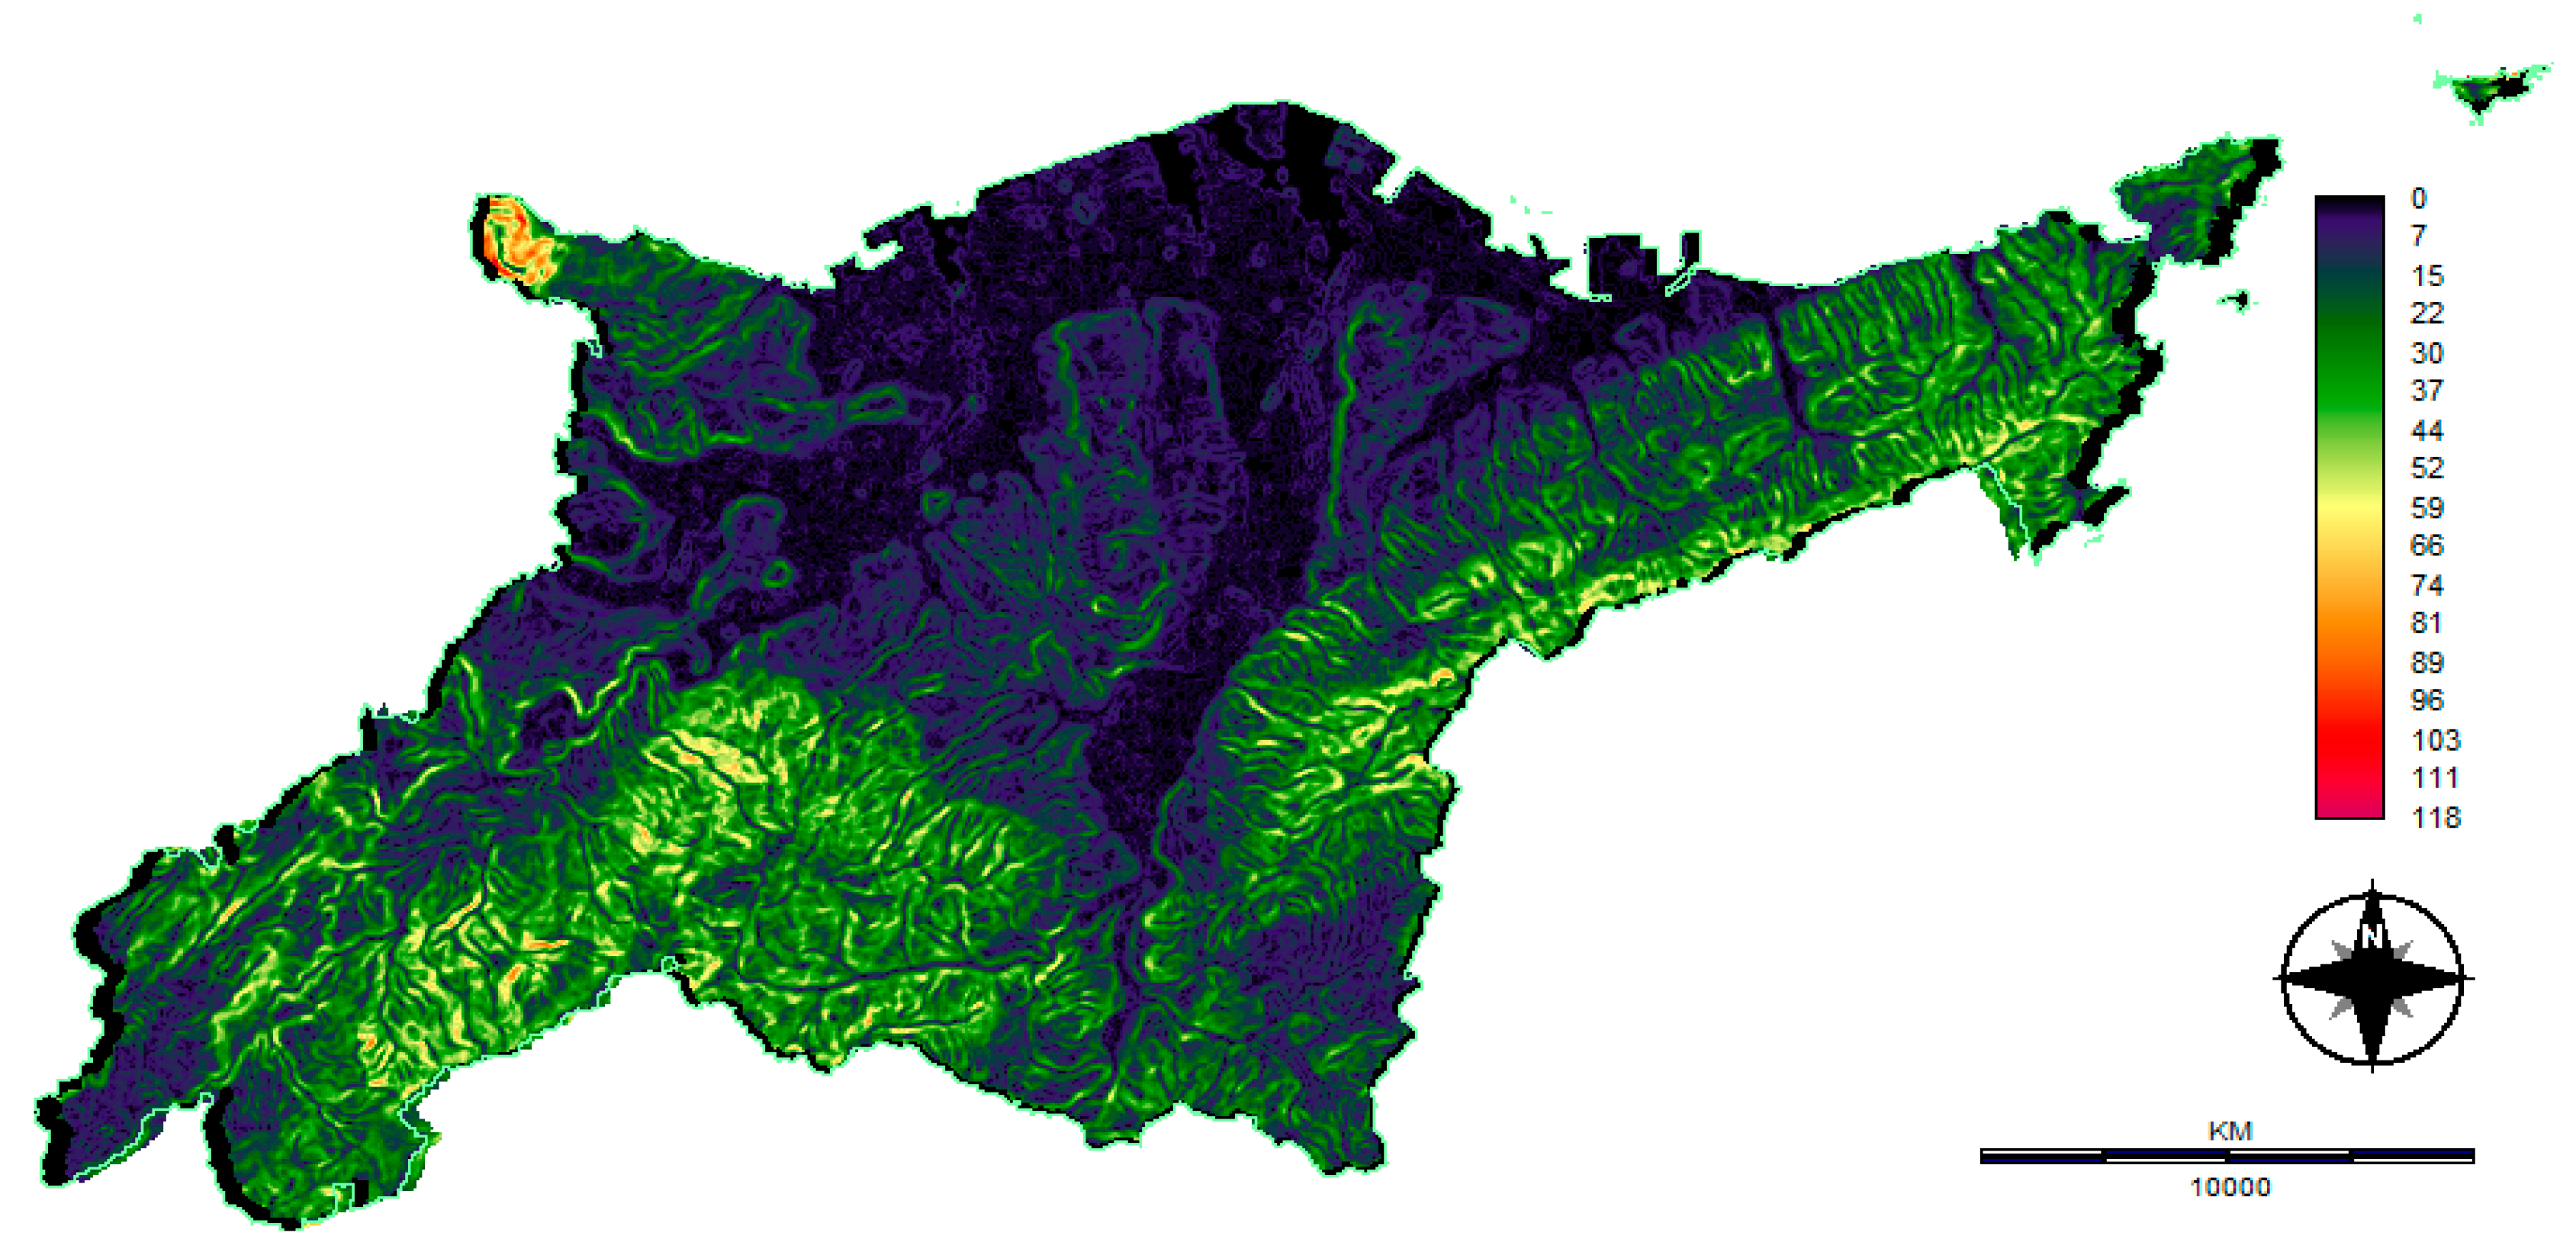
3.2.5. Proximity to Slope Gradients
3.2.6. Proximity to Roads
3.2.7. Proximity to Powerlines
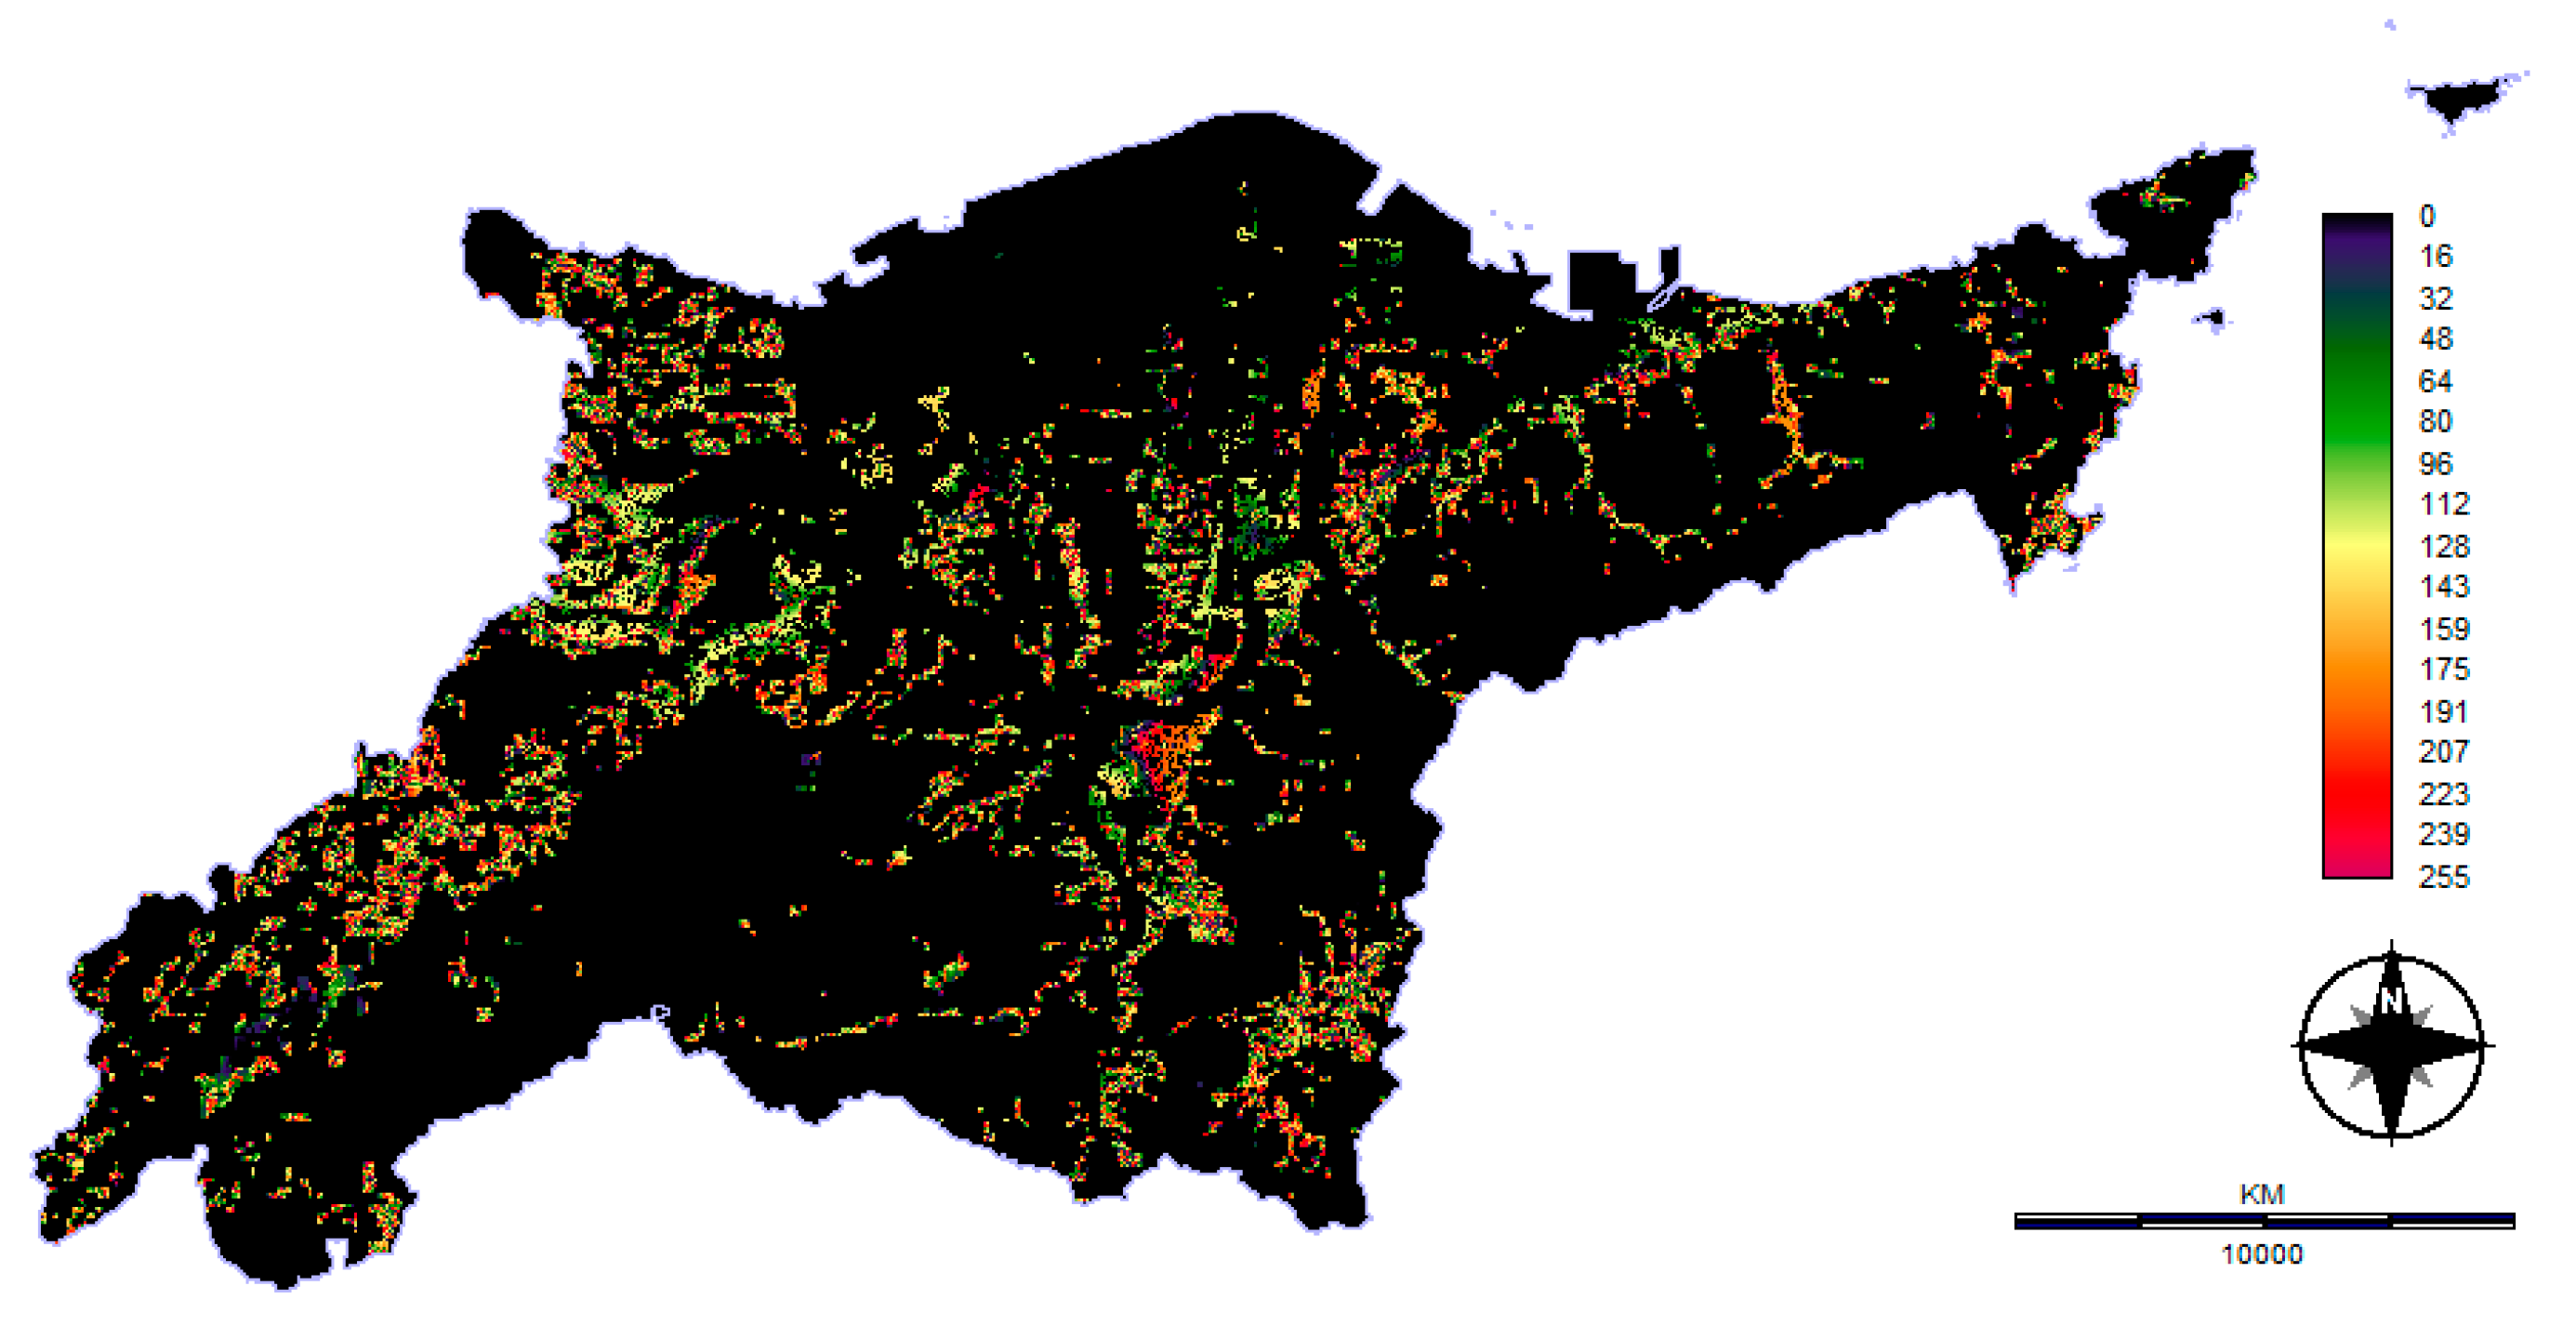
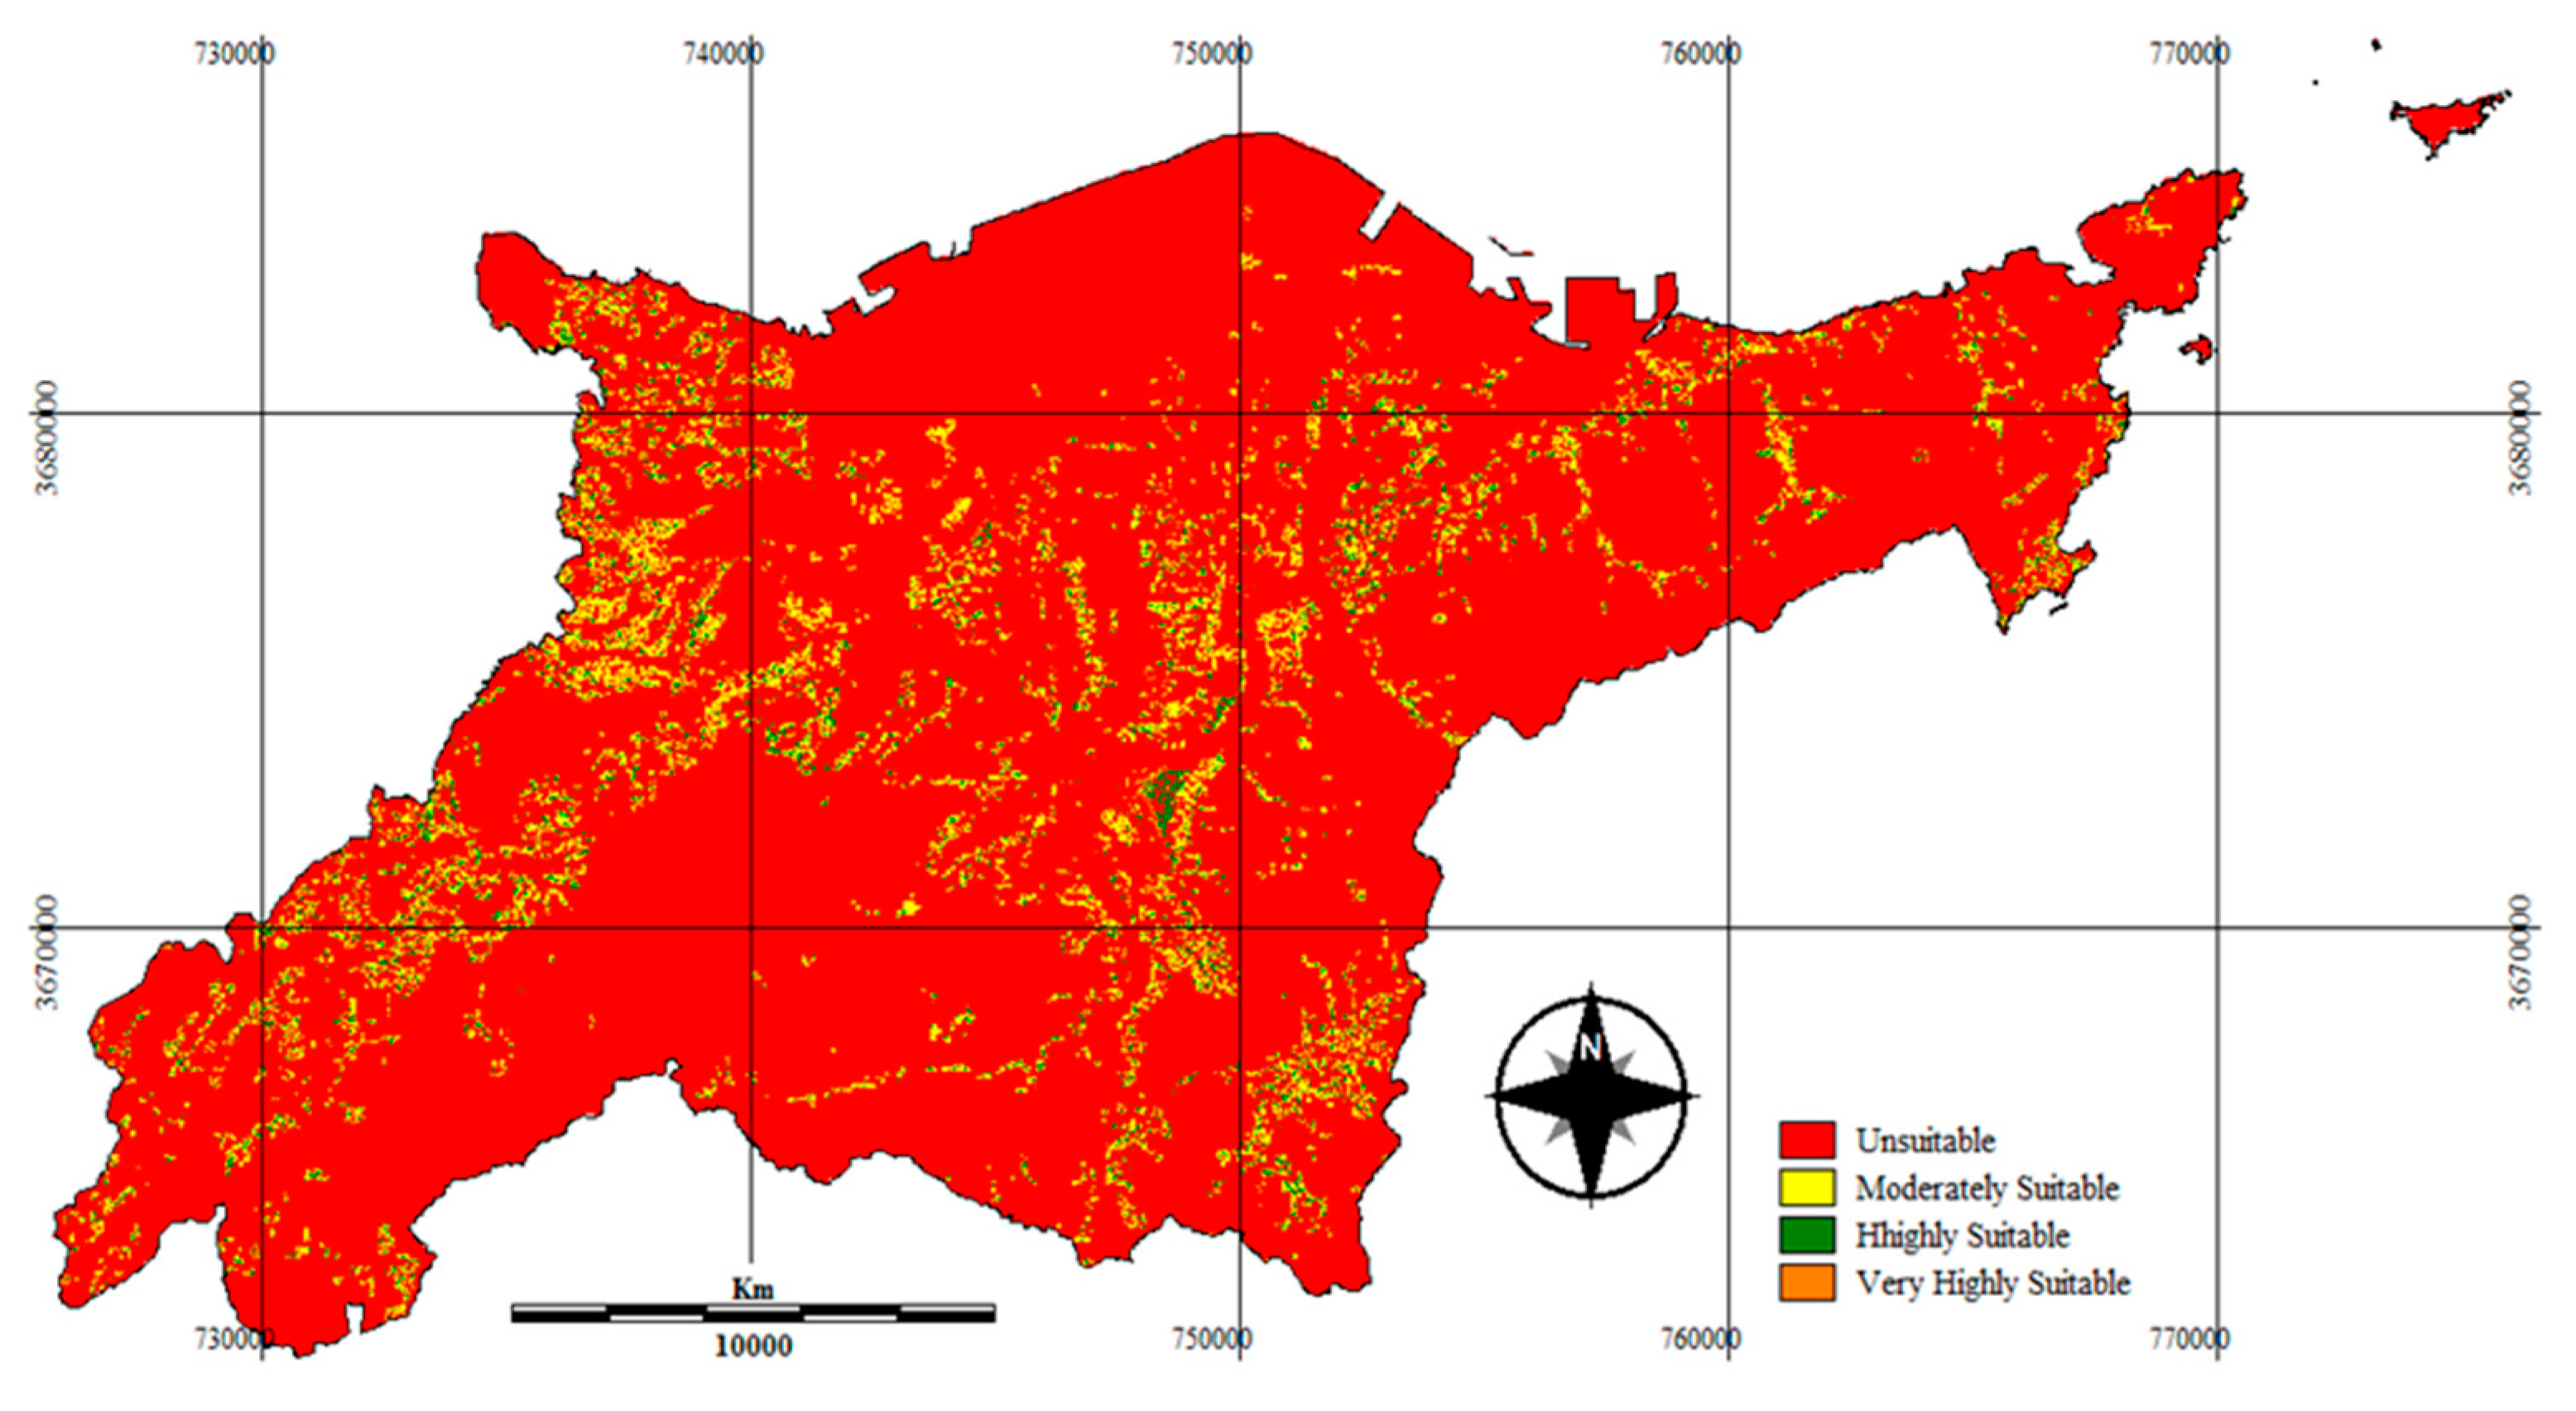
3.3. Pairwise Comparison and WCL Technique
4. Discussion
5. Conclusions
Funding
Conflicts of Interest
References
- Takata, M.; Fukushima, K.; Kino-Kimata, N.; Nagao, N.; Niwa, C.; Toda, T. The effects of recycling loops in food waste management in Japan: Based on the environmental and economic evaluation of food recycling. Sci. Total Environ. 2012, 432, 309–317. [Google Scholar] [CrossRef] [PubMed]
- Wong, L.-F.; Fujita, T.; Xu, K. Evaluation of regional bioenergy recovery by local methane fermentation thermal recycling systems. Waste Manag. 2008, 28, 2259–2270. [Google Scholar] [CrossRef] [PubMed]
- Okuda, I.; Thomson, V.E. Regionalization of municipal solid waste management in Japan: Balancing the proximity principle with economic efficiency. Environ. Manag. 2007, 40, 12–19. [Google Scholar] [CrossRef] [PubMed]
- Braber, K. Anaerobic digestion of municipal solid waste: A modern waste disposal option on the verge of breakthrough. Biomass Bioenergy 1995, 9, 365–376. [Google Scholar] [CrossRef]
- Sakai, S.; Sawell, S.E.; Chandler, A.J.; Eighmy, T.T.; Kosson, D.S.; Vehlow, J.; Van der Sloot, H.A.; Hartlen, J.; Hjelmar, O. World trends in municipal solid waste management. Waste Manag. 1996, 16, 341–350. [Google Scholar] [CrossRef]
- Tavares, G.; Zsigraiová, Z.; Semiao, V. Multi-criteria GIS-based siting of an incineration plant for municipal solid waste. Waste Manag. 2011, 31, 1960–1972. [Google Scholar] [CrossRef] [PubMed]
- Babalola, M.A. A multi-criteria decision analysis of waste treatment options for food and biodegradable waste management in Japan. Environments 2015, 2, 471–488. [Google Scholar] [CrossRef]
- Khalid, A.; Arshad, M.; Anjum, M.; Mahmood, T.; Dawson, L. The anaerobic digestion of solid organic waste. Waste Manag. 2011, 31, 1737–1744. [Google Scholar] [CrossRef] [PubMed]
- ISWA—The International Solid Waste Association. Food Waste as a Global Issue—From the Perspective of Municipal Solid Waste Management; Key Issue Paper; ISWA Publications: Vienna, Austria, 2013. [Google Scholar]
- Khoo, H.H.; Lim, T.Z.; Tan, R.B.H. Food waste conversion options in Singapore: Environmental impacts based on an LCA perspective. Sci. Total Environ. 2010, 408, 1367–1373. [Google Scholar] [CrossRef] [PubMed]
- Franchetti, M. Economic and environmental analysis of four different configurations of anaerobic digestion for food waste to energy conversion using LCA for: A food service provider case study. J. Environ. Manag. 2013, 123, 42–48. [Google Scholar] [CrossRef] [PubMed]
- Mata-Alvarez, J.; Mace, S.; Llabres, P. Anaerobic digestion of organic solid wastes. An overview of research achievements and perspectives. Bioresour. Technol. 2000, 74, 3–16. [Google Scholar] [CrossRef]
- Kemal Korucu, M.; Erdagi, B. A criticism of applications with multi-criteria decision analysis that are used for the site selection for the disposal of municipal solid wastes. Waste Manag. 2012, 32, 2315–2323. [Google Scholar] [CrossRef] [PubMed]
- Gbanie, S.P.; Tengbe, P.B.; Momoh, J.S.; Medo, J.; Kabba, V.T.S. Modelling landfill location using Geographic Information Systems (GIS) and Multi-Criteria Decision Analysis (MCDA): Case study Bo, Southern Sierra Leone. Appl. Geogr. 2013, 36, 3–12. [Google Scholar] [CrossRef]
- Kontos, T.D.; Komilis, D.P.; Halvadakis, C.P. Siting MSW landfills with a spatial multiple criteria analysis methodology. Waste Manag. 2005, 25, 818–832. [Google Scholar] [CrossRef] [PubMed]
- OzeairAbessi, M.S. Site Selection of a Hazardous Waste Landfill Using GIS Technique and Priority Processing, a Power Plant Waste in Qazvin Province Case Example. Environ. Sci. 2009, 6, 121–134. [Google Scholar]
- Khan, S.; Faisal, M.N. An analytic network process model for municipal solid waste disposal options. Waste Manag. 2008, 28, 1500–1508. [Google Scholar] [CrossRef] [PubMed]
- Malczewski, J. Spatial Multicriteria Decision Analysis. In Spatial Multicriteria Decision Making and Analysis: A Geographic Information Sciences Approach; Jean-Claude, T., Ed.; Ashgate Publishing Ltd.: London, UK, 1999; pp. 11–48. [Google Scholar]
- Malczewski, J. GIS-based multicriteria decision analysis: A survey of the literature. Int. J. Geogr. Inf. Sci. 2006, 20, 703–726. [Google Scholar] [CrossRef]
- Moeinaddini, M.; Khorasani, N.; Danehkar, A.; Darvishsefat, A.A.; Zienalyan, M. Siting MSW landfill using weighted linear combination and analytical hierarchy process (AHP) methodology in GIS environment (case study: Karaj). Waste Manag. 2010, 30, 912–920. [Google Scholar] [CrossRef] [PubMed]
- Sharifi, M.; Hadidi, M.; Vessali, E.; Mosstafakhani, P.; Taheri, K.; Shahoie, S.; Khodamoradpour, M. Integrating multi-criteria decision analysis for a GIS-based hazardous waste landfill sitting in Kurdistan Province, Western Iran. Waste Manag. 2009, 29, 2740–2758. [Google Scholar] [CrossRef] [PubMed]
- Khalili, N.R.; Duecker, S. Application of multi-criteria decision analysis in design of sustainable environmental management system framework. J. Clean. Prod. 2013, 47, 188–198. [Google Scholar] [CrossRef]
- Duarte, L.; Teodoro, A.C.; Maia, D.; Barbosa, D. Radio Astronomy Demonstrator: Assessment of the Appropriate Sites through a GIS Open Source Application. ISPRS Int. J. Geo-Inf. 2016, 5, 209. [Google Scholar] [CrossRef]
- Eastman, J.R. IDRISI Taiga-Guide to GIS and Image Processing; Clark Labs., Clark University: Worcester, MA, USA, 2009. [Google Scholar]
- Al-Jarrah, O.; Abu-Qdais, H. Municipal solid waste landfill siting using intelligent system. Waste Manag. 2006, 26, 299–306. [Google Scholar] [CrossRef] [PubMed]
- Aragonés-Beltrán, P.; Pastor-Ferrando, J.P.; García-García, F.; Pascual-Agulló, A. An Analytic Network Process approach for siting a municipal solid waste plant in the Metropolitan Area of Valencia (Spain). J. Environ. Manag. 2010, 91, 1071–1086. [Google Scholar] [CrossRef] [PubMed]
- Chang, N.-B.; Parvathinathan, G.; Breeden, J.B. Combining GIS with fuzzy multicriteria decision-making for landfill siting in a fast-growing urban region. J. Environ Manag. 2008, 87, 139–153. [Google Scholar] [CrossRef] [PubMed]
- Ekmekçioğlu, M.; Kaya, T.; Kahraman, C. Fuzzy multicriteria disposal method and site selection for municipal solid waste. Waste Manag. 2010, 30, 1729–1736. [Google Scholar] [CrossRef] [PubMed]
- Gorsevski, P.V.; Donevska, K.R.; Mitrovski, C.D.; Frizado, J.P. Integrating multi-criteria evaluation techniques with geographic information systems for landfill site selection: A case study using ordered weighted average. Waste Manag. 2012, 32, 287–296. [Google Scholar] [CrossRef] [PubMed]
- Salman Mahini, A.; Gholamalifard, M. Siting MSW landfills with a weighted linear combination (WLC) methodology in a GIS environment. Int. J. Environ. Sci. Technol. 2006, 3, 435–445. [Google Scholar] [CrossRef]
- Sumathi, V.R.; Natesan, U.; Sarkar, C. GIS-based approach for optimized siting of municipal solid waste landfill. Waste Manag. 2008, 28, 2146–2160. [Google Scholar] [CrossRef] [PubMed]
- Wang, G.; Qin, L.; Li, G.; Chen, L. Landfill site selection using spatial information technologies and AHP: A case study in Beijing, China. J. Environ. Manag. 2009, 90, 2414–2421. [Google Scholar] [CrossRef] [PubMed]
- Chang, N.-B.; Chang, Y.-H.; Chen, H.-W. Fair fund distribution for a municipal incinerator using GIS-based fuzzy analytic hierarchy process. J. Environ. Manag. 2009, 90, 441–454. [Google Scholar] [CrossRef] [PubMed]
- Chiueh, P.-T.; Lo, S.-L.; Chang, C.-L. A GIS-based system for allocating municipal solid waste incinerator compensatory fund. Pay as you throw: A tool for urban waste management. Waste Manag. 2008, 28, 2690–2701. [Google Scholar] [CrossRef] [PubMed]
- Oita City. Statistics of Oita-City (2017 Version). 2018. Available online: http://www.city.oita.oita.jp.e.adk.hp.transer.com/o001/shisejoho/annai/tokei-nenkan-h29.html (accessed on 22 April 2018).
- Oita Pride. Oita City Outline 2017. Available online: http://www.city.oita.oita.jp/o029/shisejoho/annai/documents/english.pdf (accessed on 22 April 2018).
- Ministry of the Environment (MOE). Establishing a Sound Material-Cycle Society: Milestone toward a Sound Material-Cycle Society through Changes in Business and Life Styles; Ministry of the Environment Government: Tokyo, Japan, 2010. Available online: http://www.env.go.jp/en/recycle/smcs/a-rep/2010gs_full.pdf (accessed on 20 September 2015).
- Oita Municipal Government. Oita Zero Waste Strategy: The Status and Plans of Biomass Resource Utilization; Oita Municipal Government: Oita City, Japan, 2014. [Google Scholar]
- ASTER Global Digital Elevation Model (ASTER GDEM) Version 2 (3 October 2011). Available online: https://ssl.jspacesystems.or.jp/ersdac/GDEM/E/4.html (accessed on 15 June 2015).
- National Land Numerical Information Version 3.1. City Area Data. Available online: http://nlftp.mlit.go.jp/ksj-e/gml/datalist/KsjTmplt-A09.html (accessed on 15 June 2015).
- Ordinance No. 35 of Ministry of Health and Welfare of 1971. Regulations of Waste Management and Public Cleansing Law; Ministry of the Environment: Tokyo, Japan, 2002. Available online: https://www.env.go.jp/en/laws/recycle/03.pdf (accessed on 20 September 2015).
- Demesouka, O.E.; Vavatsikos, A.P.; Anagnostopoulos, K.P. Suitability analysis for siting MSW landfills and its multicriteria spatial decision support system: Method, implementation and case study. Waste Manag. 2013, 33, 1190–1206. [Google Scholar] [CrossRef] [PubMed]
- Şener, Ş.; Şener, E.; Nas, B.; Karagüzel, R. Combining AHP with GIS for landfill site selection: A case study in the Lake Beyşehir catchment area (Konya, Turkey). Waste Manag. 2010, 30, 2037–2046. [Google Scholar] [CrossRef] [PubMed]
- Drobne, S.; Lisec, A. Multi-attribute Decision Analysis in GIS: Weighted Linear Combination and Ordered Weighted Averaging. Informatica 2009, 33, 459. [Google Scholar]
- Saaty, T.L. The Analytic Hierarchy Process: Planning, Priority Setting, Resource Allocation; McGraw-Hill International Book Co.: New York, NY, USA, 1980. [Google Scholar]
- Saaty, T.L.; Vargas, L.G. Models, Methods, Concepts & Applications of the Analytic Hierarchy Process; Kluwer Academic Publishers: Boston, MA, USA, 2001. [Google Scholar]
- Saaty, T.L.; Sagir, M. An essay on rank preservation and reversal. Math. Comput. Model. 2009, 49, 1230–1243. [Google Scholar] [CrossRef]
- Malczewski, J. On the Use of Weighted Linear Combination Method in GIS: Common and Best Practice Approaches. Trans. GIS 2000, 4, 5–22. [Google Scholar] [CrossRef]


| Constraint | Factors | Description |
|---|---|---|
| Environmental | Water bodies | Safe distance from any stream, wetland, lake, pool, river, or water source to prevent pollution |
| Forests | Distance from forests must be reasonable enough to protect forests, farms, and gardens | |
| Sociocultural | Residential areas | Safe minimum distance to avoid Not in My Backyard (NIMBY) phenomenon and reasonable distance for waste transportation |
| Touristic and cultural centers | Safe distance with legal protection for any national parks, lakes, and pools; tourist centers; and protected and cultural areas | |
| Technical/economic | Roads | Safe distance from any passages, roads, or highways |
| Slope gradients | Steep land is not always required for most waste disposal facilities | |
| Powerlines | Distance from any powerlines is very essential as the electricity produced will need to be sold to nearby residential areas |
| Constraints and Factors | Control Points (a and c) | Control Points (b and d) | Fuzzy Membership Function |
|---|---|---|---|
| Environmental | |||
| ✓ Water bodies | a: 200 m | b: 1000 m | Sigmoidal monotonically increasing |
| ✓ Forests | a: 500 m | b: 1200 m | Sigmoidal monotonically increasing |
| Socialcultural | |||
| ✓ Residential areas | c: 800 m | d: 1500 m | Sigmoidal monotonically decreasing |
| ✓ Touristic and cultural centers | a: 250 m | b: 1200 m | Sigmoidal monotonically increasing |
| Technical/Economic | |||
| ✓ Roads | c: 100 m | d: 1000 m | Linear monotonically decreasing |
| ✓ Slope gradients | c: 10% | d: 20% | Sigmoidal monotonically decreasing |
| ✓ Powerlines | c: 100 m | d: 1000 m | Linear monotonically decreasing |
| Residential | Slope | Power | Road | Tourist Center | Water | Forest | Priority Vector | |
|---|---|---|---|---|---|---|---|---|
| Residential | 1 | 0.0793 | ||||||
| Slope | 3 | 1 | 0.3482 | |||||
| Power | 1 | 1/3 | 1 | 0.1216 | ||||
| Road | 3 | 1/3 | 4 | 1 | 0.2653 | |||
| Tourist Center | 2 | 1/4 | 1/3 | 1/4 | 1 | 0.084 | ||
| Water | 1/3 | 1/6 | 1/3 | 1/6 | 1 | 1 | 0.0459 | |
| Forest | 2 | 1/6 | 1/3 | 1/6 | 3 | 1 | 1 | 0.0557 |
| Alternatives | Minimum Suitability | Maximum Suitability | Area (km2) | WLC Mean Score | WLC Rank | AHP Priority Weight | AHP Rank |
|---|---|---|---|---|---|---|---|
| Option 1 | 94 | 187 | 6731.02 | 136.35 | 3 | 0.2051 | 3 |
| Option 2 | 188 | 233 | 2950.3 | 210.6 | 2 | 0.2197 | 2 |
| Option 3 | 234 | 255 | 1335.79 | 244.75 | 1 | 0.5623 | 1 |
© 2018 by the author. Licensee MDPI, Basel, Switzerland. This article is an open access article distributed under the terms and conditions of the Creative Commons Attribution (CC BY) license (http://creativecommons.org/licenses/by/4.0/).
Share and Cite
Babalola, M.A. Application of GIS-Based Multi-Criteria Decision Technique in Exploration of Suitable Site Options for Anaerobic Digestion of Food and Biodegradable Waste in Oita City, Japan. Environments 2018, 5, 77. https://0-doi-org.brum.beds.ac.uk/10.3390/environments5070077
Babalola MA. Application of GIS-Based Multi-Criteria Decision Technique in Exploration of Suitable Site Options for Anaerobic Digestion of Food and Biodegradable Waste in Oita City, Japan. Environments. 2018; 5(7):77. https://0-doi-org.brum.beds.ac.uk/10.3390/environments5070077
Chicago/Turabian StyleBabalola, Micky A. 2018. "Application of GIS-Based Multi-Criteria Decision Technique in Exploration of Suitable Site Options for Anaerobic Digestion of Food and Biodegradable Waste in Oita City, Japan" Environments 5, no. 7: 77. https://0-doi-org.brum.beds.ac.uk/10.3390/environments5070077