Article

Characterization of Recycled Wood Chips, Syngas Yield, and Tar Formation in an Industrial Updraft Gasifier

1
Department of Chemical and Biological Engineering, The University of British Columbia, 2360 East Mall, Vancouver, BC V6T 1Z, Canada
2
College of Engineering, University of Saskatchewan, Saskatoon, SK S7N 5B1, Canada
3
CanmetENERGY-Ottawa, NRCan, Ottawa, ON K1A 0E4, Canada
4
Nexterra Systems Corporation, Vancouver, BC V6B 4N8, Canada
*
Author to whom correspondence should be addressed.
Submission received: 15 June 2018 / Revised: 16 July 2018 / Accepted: 20 July 2018 / Published: 22 July 2018

Abstract

:
In this study, the moisture content, calorific value, and particle size of recycled wood chips were measured. The wood chips were used to fuel an 8.5 MWth updraft gasifier to produce syngas for combustion in a steam-producing boiler. In-situ syngas composition and tar concentrations were measured and analyzed against biomass fuel properties. No efforts were made to adjust the properties of biomass or the routine operating conditions for the gasifier. A sampling device developed by CanmetENERGY-Ottawa (Ottawa, ON, Canada) was used to obtain syngas and tar samples. Wood chip samples fed to the gasifier were taken at the same time the gas was sampled. Results indicate that as the fuel moisture content increases from 20% to 35%, the production of CO drops along with a slight decrease in concentrations of H2 and CH4. Tar concentration increased slightly with increased moisture content and proportion of small fuel particles (3.15–6.3 mm). Based on the findings of this study, biomass fuel moisture content of 20% and particles larger than 6.3 mm (1/4″) are recommended for the industrial updraft gasifier in order to achieve a higher syngas quality and a lower tar concentration.

1. Introduction

Combustion and gasification are key thermal/thermochemical conversion technologies. In terms of climate change mitigation, gasification processes have the advantage of lesser greenhouse gas emissions compared to full oxidative combustion processes. The syngas produced can be further processed into biofuels and chemical products [1].
In this work, two commercial gasification systems are studied. The University of British Columbia (UBC) installed a fixed-bed updraft biomass gasification system (Figure 1) at the Vancouver Campus in 2012. The 8.5 MWth gasifier was designed to provide up to 5% of 40 MW campus power and 15% of 40 MW thermal-based heat. In addition to the gasifier at UBC, a tissue plant that produces household paper products in Metro Vancouver has also been operating two gasifiers identical to UBC’s system since 2010.
The wood wastes consist of two types of materials: scraps from construction and demolition (C&D), and municipal tree trimmings collected from Metro Vancouver’s curbsides and landfill. A recycling yard located 50 km from the gasification plant collects the wood scraps and trimmings. The materials are sorted so as not to contain any non-woody materials. The woody portion is ground, screened, and stored under a covered flat storage. About 12,500 dry tonnes of ground and chipped wood waste per year (2–3 truckloads per day) are trucked to the gasification plant. Once at the plant, the wood chips are sampled for moisture and size measurements. Occasionally, the ash content and calorific value of chipped fuels is measured.
Following the fuel specifications, particles should not be greater than 76 mm. The proportion of particles with a size below 6.3 mm shall have a mass fraction less than 25%. Our recent work on the gasifier [2] showed that 12% more steam could be generated if the fuel moisture content was reduced from 35% to 20% wet basis (wb).
Syngas composition depends on the fuel composition and amount of oxygen in the air, and variation in syngas composition can disrupt the usage of syngas [3,4]. Rajvanshi [5] suggested that fuel moisture, ash content and its elements, particle size, heating value, and bulk density are major fuel properties that affect biomass gasification. Molino et al. [6] summarized the effect of these biomass feedstock characteristics on syngas composition; they also discussed the effect of operating conditions, including gasifying agent and equivalence ratio (ER, the ratio of actual A/F value to stoichiometric A/F value). Van der Drift et al. [7] suggested that the ER needed to be raised with increasing fuel moisture content in order to keep the gasifier temperature constant. An increase in ER results in an increase in temperature, as more feedstock is combusted to produce more heat and promote carbon conversion [8]. It is important to have an appropriate ER level to ensure the balance between reactor temperature and syngas production. In contrast, without adjusting the ER, high moisture biomass would have a negative impact on the internal heating rate of a particle since latent heat is needed for evaporating water. The resulting slow-down of biomass devolatilization leads to a lower gasification temperature and less carbon conversion and syngas yield [9,10,11,12]. Couto et al. [13] assessed the gasification of municipal solids’ wastes in a semi-industrial gasifier. They noted an increase in H2 and CO contents due to a higher gasifier temperature, which in turn led to an increase in the lower heating value (LHV) of syngas.
Tar may be defined as the hydrocarbon and oxygenated compounds in the combustible gas stream with a molecular weight greater than benzene [14]. Lignin is a main precursor of tar due to its aromatic nature [15]. The tar in the gas stream is an undesired by-product of biomass gasification. It may cause fouling of heat transfer surfaces and engine parts when the gas is used as a combustion fuel, resulting in the malfunctioning of engines, mechanical, and handling equipment. Besides, catalysts cannot survive for long in the presence of tar [16]. The concentration and composition of tar depend on the gasifier type, operating conditions, and fuel properties/quality [17]. Although it is the updraft gasifier which is known to produce syngas with the most tar, it has advantages over other types of gasifiers. Fixed bed gasifiers (updraft or downdraft) are simpler than the fluidized bed; besides, the thermal output of fluidized bed gasifiers is limited to 10 MWth or less. Updraft gasifiers can operate with wetter biomass with up to 60% MC (moisture content) (wb) whereas the downdraft gasifiers must operate with biomass with less than 25% MC (wb) [18].
With air as the gasifying agent, Li et al. [19] studied the gasification of western hemlock sawdust in a pilot-scale circulating fluidized bed at two temperatures (700 and 850 °C) and with moisture content ranging from 6.6% to 22% wb. For the reducing species, they observed a decrease in (CO, H2, CH4) concentrations from (16.6%, 5.5%, 3.4%) to (9.6%, 3.0%, 1.9%) as ER increased from 0.20 to 0.54. According to Huang et al. [8], CO2 content in the gas increases while H2 and CO contents decrease. Van Paasen and Kiel [20] conducted a lab-scale experiment with constant ER (0.25), gasifier bed temperature (around 815 °C), and three levels of moisture content (10%, 26% and 43% wb). The effect of moisture content on temperature and ER was eliminated by using a supplemental heater. They reported a modest increase in H2 and a similar decrease in CO, along with a decrease in tar concentration from 14.2 g/m3 to 11.4 g/m3 and 8.5 g/m3 as fuel moisture content increased from 10% to 43% wb. Atnaw et al. [21] investigated the effect of gasifier temperature and moisture content of biomass fuel (oil palm fronds) on syngas composition and calorific value. Lower CO concentration was observed at higher fuel moisture content, but the changes in H2 and CH4 concentrations were only marginal; syngas calorific value almost doubled within the range of 2.5–6.0 MJ/Nm3 as biomass moisture content was reduced from 29% to 22% wb. James et al. [22] assessed the effect of biomass physical properties on updraft gasification of woodchips. The H2 content was found to have no significant changes while the CO content was somewhat reduced as the moisture content increased from 10% to 22% wb, resulting in a decrease in the higher heating value of the syngas from 3.67 to 2.84 MJ/m3. In a related study, James et al. [23] found that as ER increased from 0.21 to 0.29, tar formation was raised from 1.6 to 3.1 g/m3 for all types of biomass in their experiment, but there was no influence on syngas composition.
Chianese et al. [24] investigated H2 production from catalytic conversion of syngas generated in a fixed-bed biomass gasification pilot plant, using steam as gasifying agent. They showed that tar concentration decreased as operating temperature increased. Bronson et al. [25] evaluated the effect of moisture content and particle size of forest residues (hog fuel) on tar formation at three gasifier temperatures (725, 800 and 875 °C) in a small (0.16 m diameter) pilot-scale bubbling fluidized bed gasifier. At each temperature, ER was adjusted to compensate for the effect of moisture content in order to maintain a constant temperature. They found that moisture content ranging from 25–31% (wb) had a negligible effect on tar concentration—rather, the smallest particles (with sizes less than 3.15 mm) resulted in the highest tar concentration, as compared to the larger particles with sizes ranging from (3.18–6.35 mm) and (6.35–19 mm).
Published data from highly-controlled laboratory experiments on gasification of biomass indicates that there exists a direct relation between biomass fuel properties (such as moisture, ash, and particle size) and syngas yield and tar formation [5,26,27,28]. However, similar data on industrial gasifiers is lacking in published literature. The main objective of this research is to investigate the effects of fuel quality on syngas quality and tar formation in an industrial gasifier that is operating routinely under commercial obligations. No attempt is made to influence the fuel properties or operating conditions of the gasifier for the sake of this research.

2. Materials and Methods
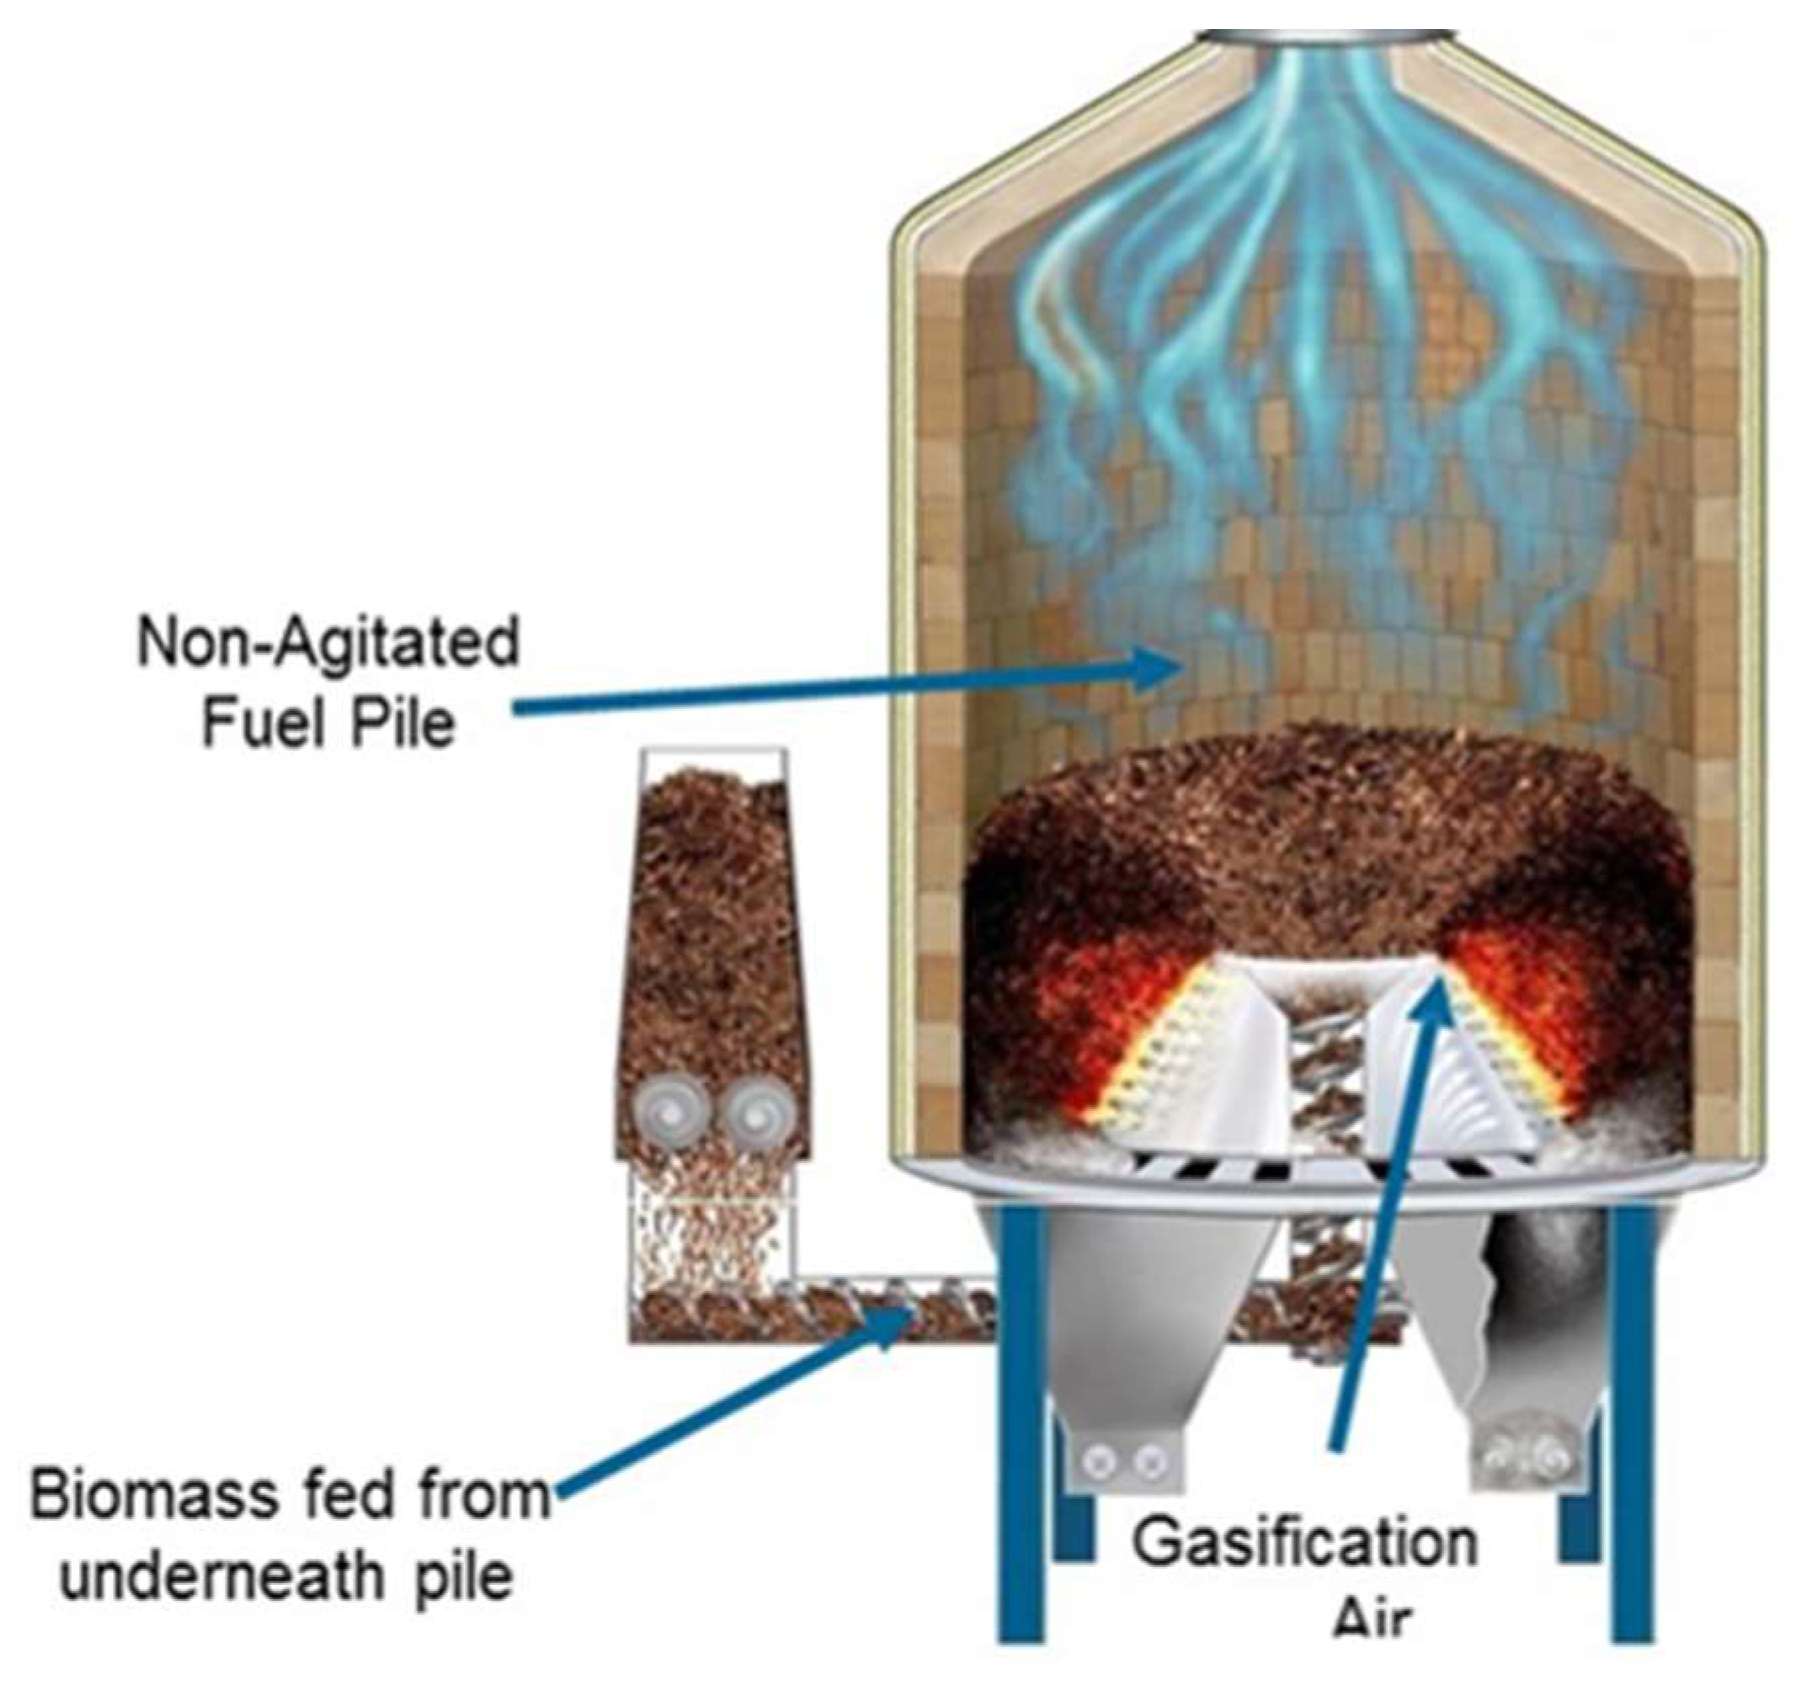
2.1. Gasifiers

Two commercial fixed-bed updraft gasifiers were used in the study. As previously mentioned, these gasifiers were identical models made by the same manufacturer, and the only difference between them was the utilization of their output energy. The gasifier installed at UBC used the energy for steam generation while the other gasification system provided energy for a tissue plant.
Each of the gasifier reactors was made of a cylindrical chamber 5 m in diameter and 5 m in height (Figure 1). The chips were vertically fed to the reactor by a feeder screw located at the center of and underneath the reactor. The fuel then passed through several stages before it was converted to syngas. The major stages were drying, partial oxidation (combustion), pyrolysis, gasification, and reduction to ash. Air was introduced to the fuel pile at the combustion stage. The gasifier temperature was kept constant by controlling the fuel feed rate, equivalent ratio, and fuel pile height. The bed temperature generally ranges from 815–980 °C when combustion occurs. The fuel gets converted into three major components: syngas, tar, and non-combustible ash. The tar-rich syngas is directed to the thermal oxidizer where it is burned to generate heat. Ash is removed by an automated system. An electrostatic precipitator is in place to treat the particulate matter to ensure the emission standard specified in the air quality permit is met.

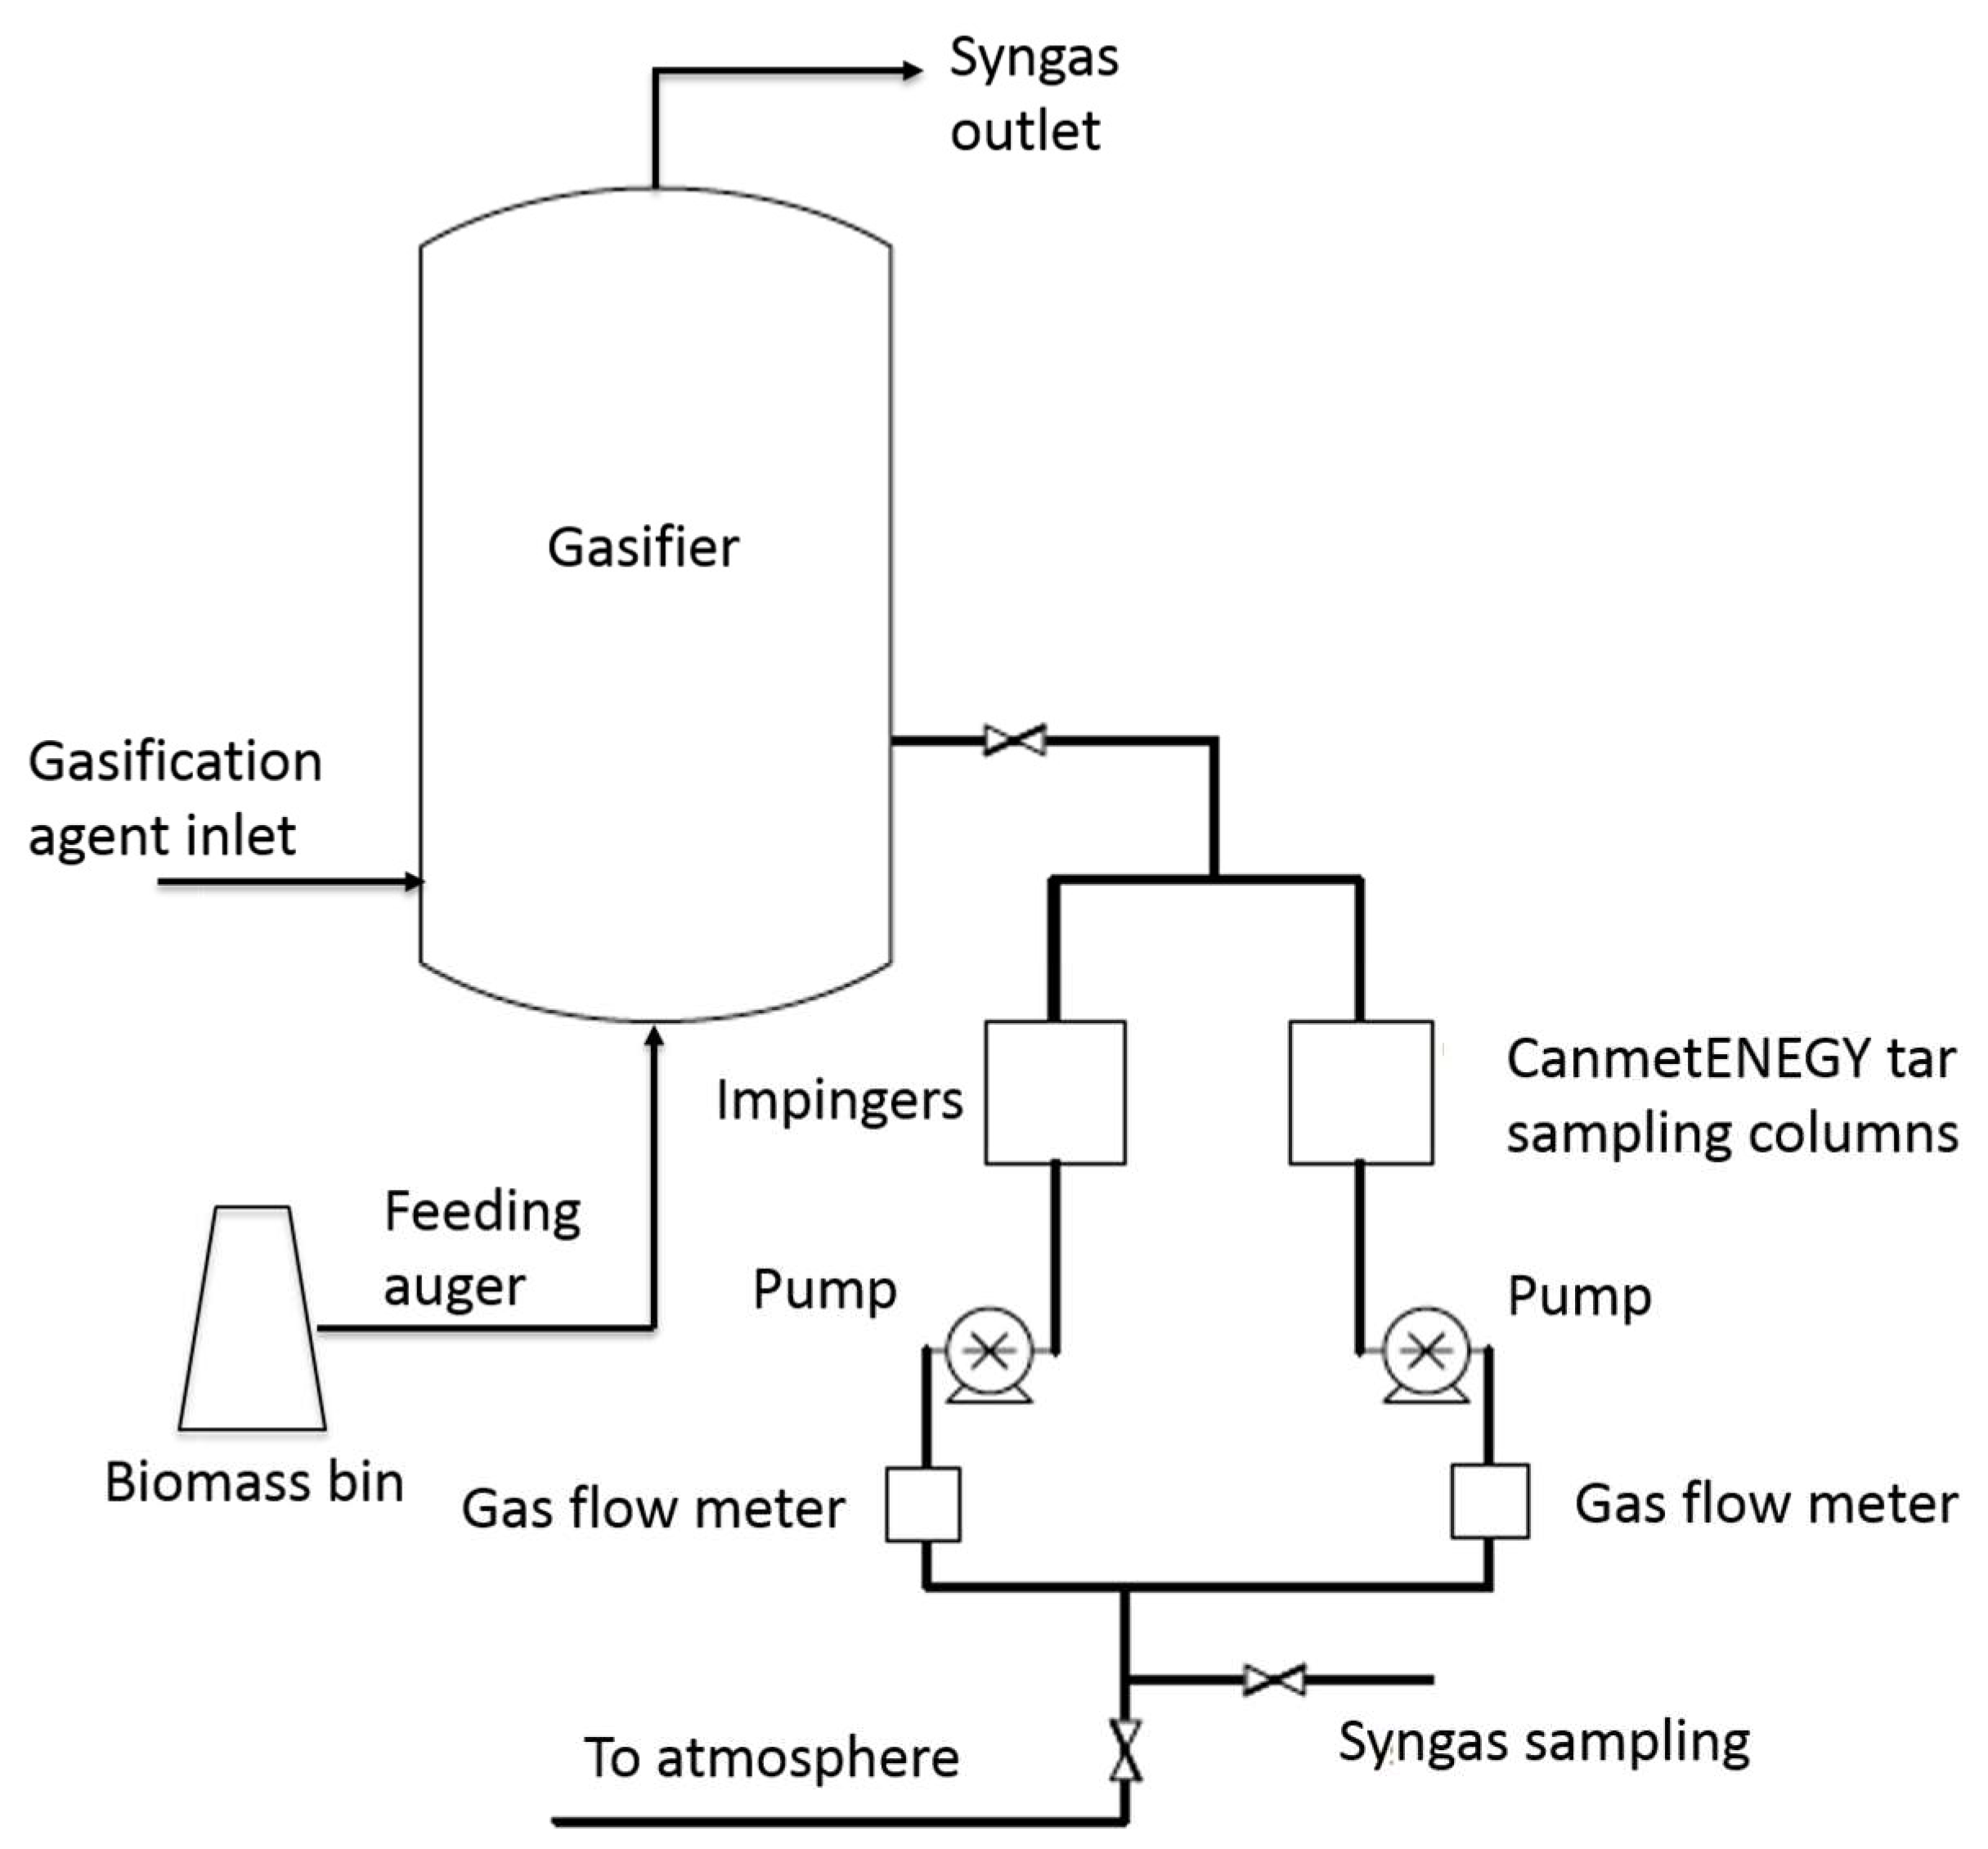
2.2. Gas and Tar Sampling

Various tar sampling methods have been developed over recent decades, each with their own advantages and disadvantages [29]. The most common method for tar sampling is condensing the tar in a cooled liquid solvent, such as isopropanol [30]. The contents of the solution are analyzed to determine the tar concentration via gravimetric evaporation or gas chromatography (GC). The tar measurement and CEN/TS 15439 standard is an impinger-based sampling protocol developed by the European Union [31,32] following the work done by Kiel et al. [30].
CanmetENERGY-Ottawa (CE-O) has designed, tested and fabricated an alternative syngas and tar sampling device [30] for in-situ industrial applications. The unit comprises of a sampling probe, chiller, vacuum pump, and gas flow meter. Robinson [33] conducted a series of experiments using a lab-scale bubbling fluidized bed gasifier and hardwood pellets as fuel, and showed that the CE-O was able to sample syngas with tar concentrations less than 10 g/m3. Robinson found the samples taken by the CE-O and the CEN/TS 15439 standards provided a similar syngas profile and tar production.
In this paper, the CE-O and the CEN/TS 15439 standards were used side-by-side to sample syngas and collect tar from the gasification reactor. The gas chromatography-thermal conductivity detector (GC-TCD) technique was used to identify and quantify syngas composition. The amount of solvent, or isopropanol, for each sampling event was about 600 g. Approximately 170 L of syngas was pulled through the sampling device over a period of 90 min. The concentration of the tar samples was quantified using GC-FID equipped with a column packed with DPDM-siloxane (5% diphenyl + 95% dimethyl). The heating program applied to the sample in GC was as follows: initial temperature 50 °C for 5 min, ramp at 8 °C/min to 300 °C and hold at 300 °C time for 5 min. GC-FID identified the major compounds in the sample. Other unknown peaks in the GC-FID results were added to the major compounds to calculate the total tar concentration in the solvent Cs. Tar concentration in syngas, Cg was calculated according to the following equation:
C g = M V g = C s × V s V g
where M is the mass of tar, Vs is the volume of solvent, Vg is the volume of syngas, and Cs is the concentration of tar in the solvent as measured by GC.

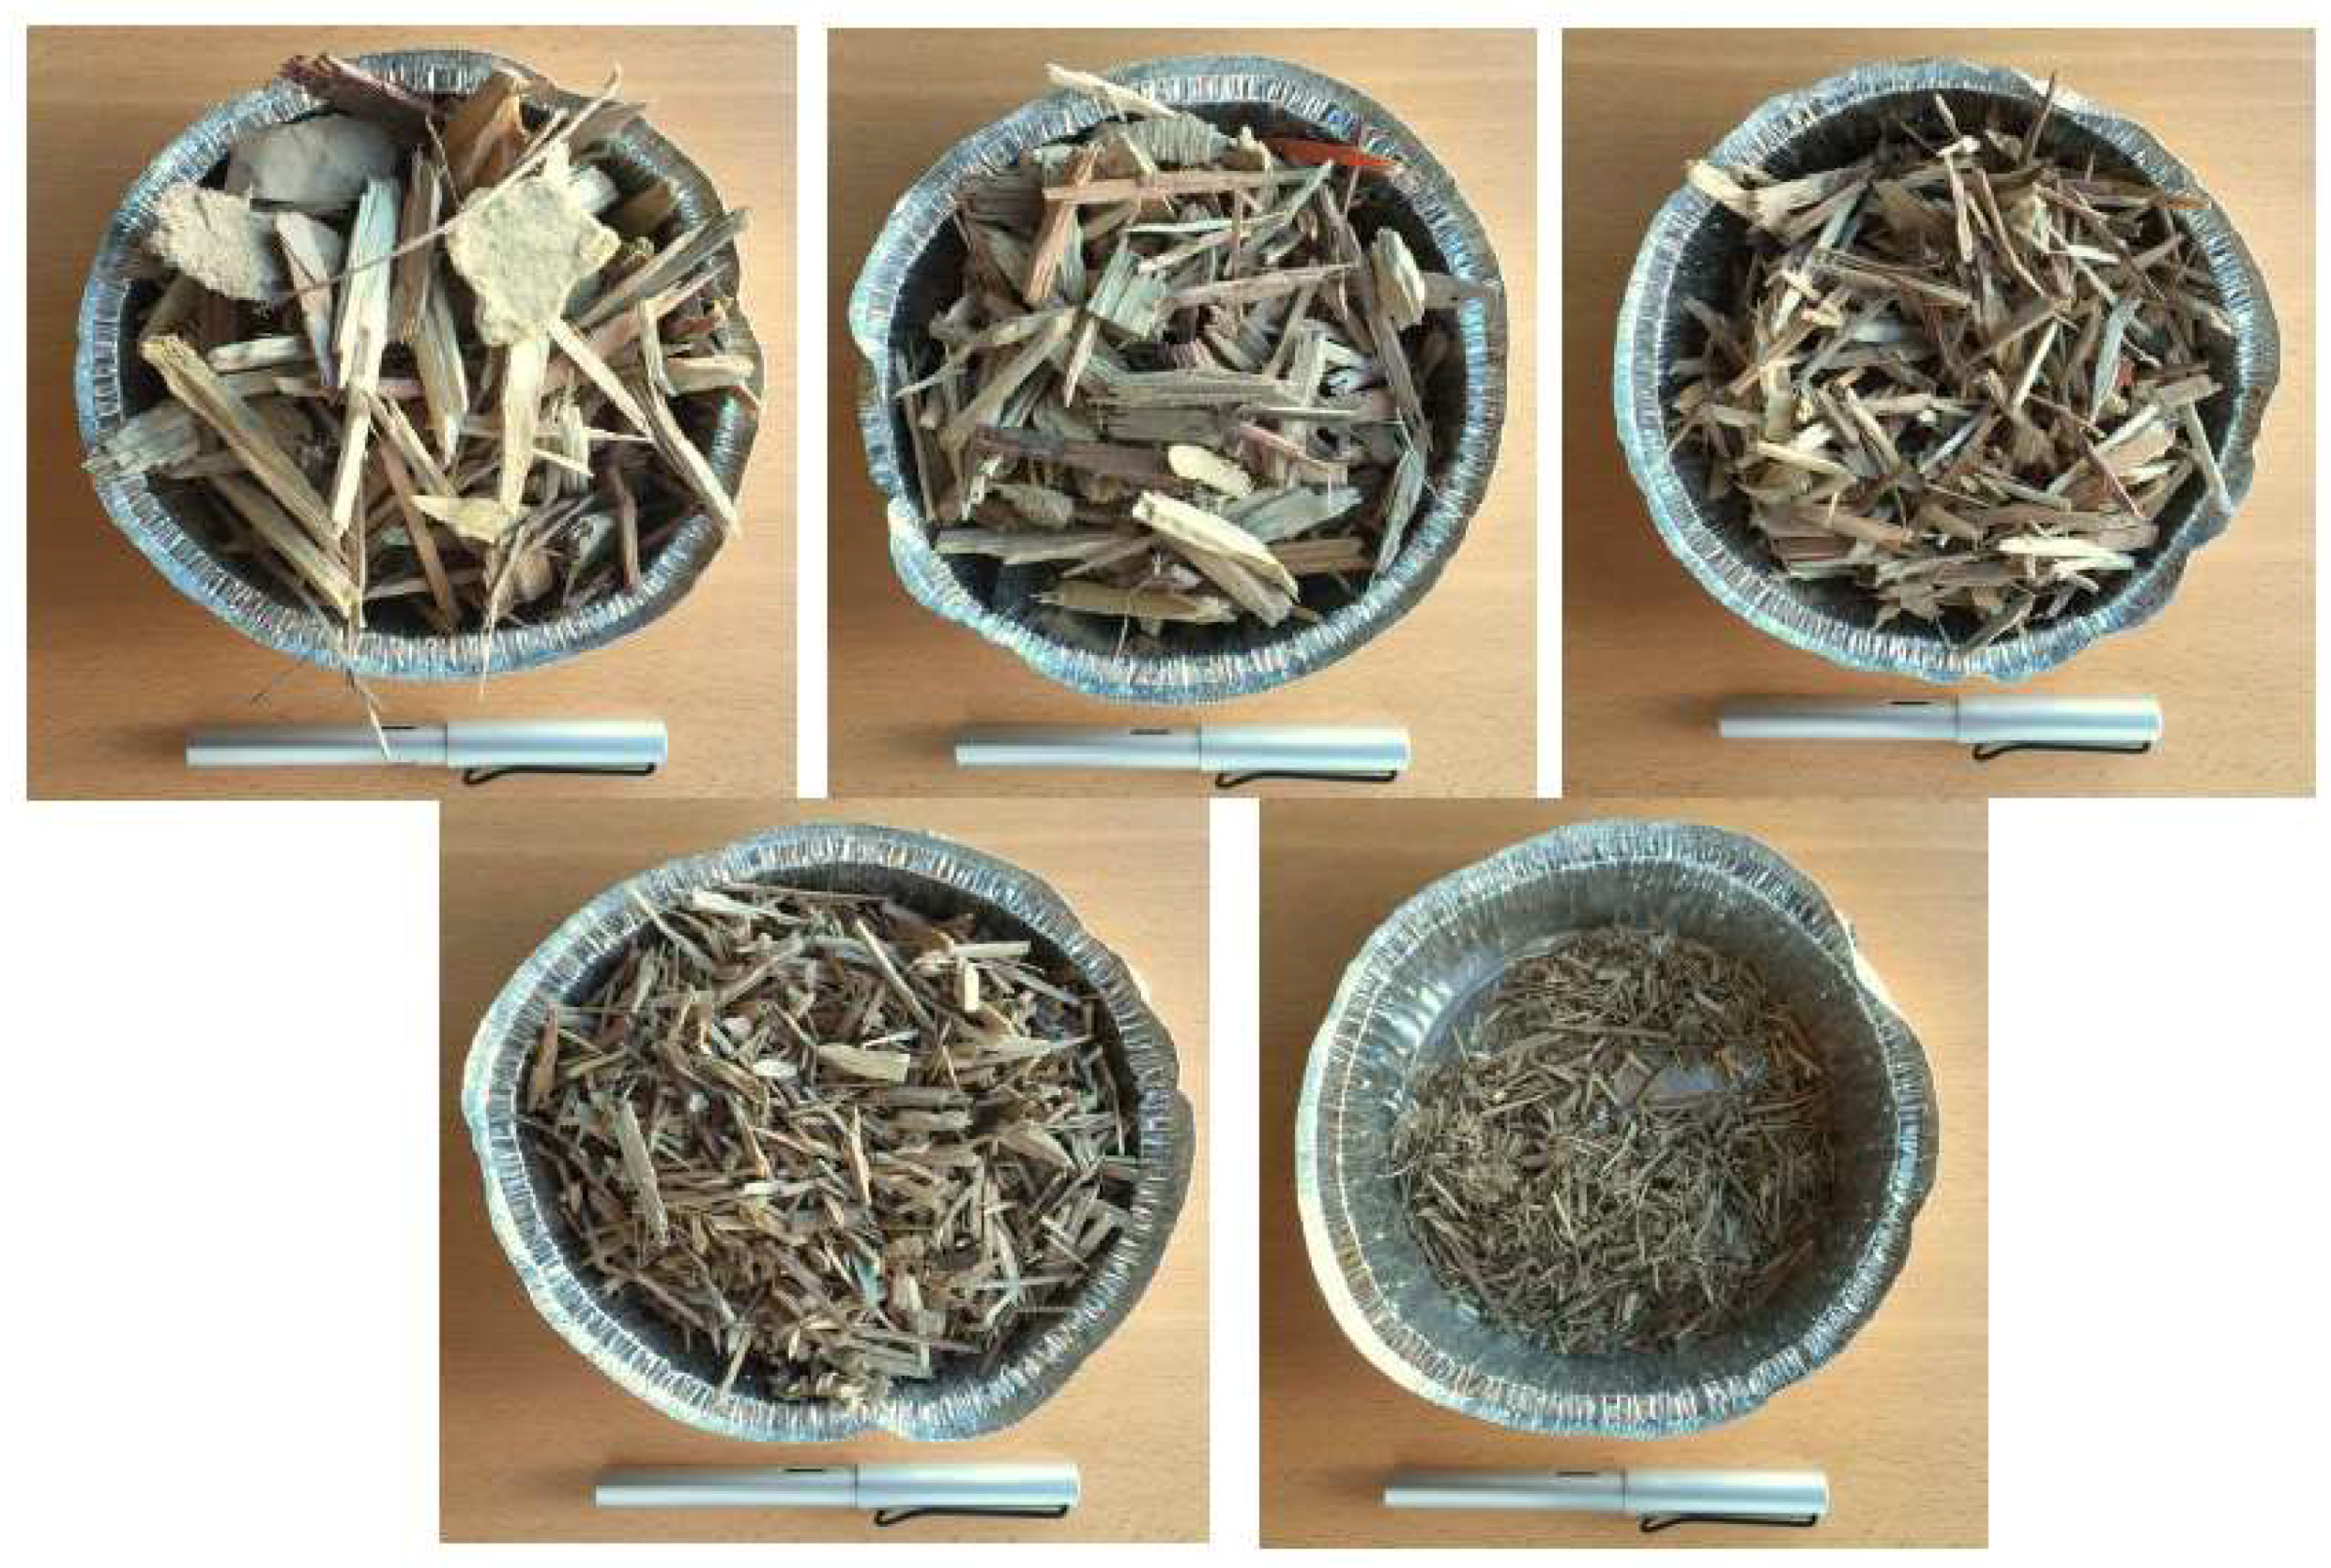
2.3. Biomass Fuel Sampling

Biomass fuel samples were taken from the port near the gasifier feeding auger. Approximately 5 kg of fuel was collected during each syngas sampling event for subsequent measurements of moisture content, ash content, and calorific value. Fuel samples were taken before, during, and after tar collection following the CEN/TS 14778-1 standard [34], and fuel MC (moisture content) was measured in accordance with the CEN/TS 14774 standard [35].

2.4. Test Procedure

Initially, we conducted a test using the CE-O and compared the results with those derived from the impingers. This test occurred at the tissue plant. Samplings using the two pieces of equipment were done in parallel and from the same port over two days (Figure 2). Each syngas and tar sampling event lasted for about 20 min.
For the impingers technique, a sampling probe was connected to an in-line particulate matter filter, which was then attached to the first impinger bottle in the ice bath. The last impinger bottle was in the hot bath and connected to a pump which sent the gas through a flow meter to exhaust. Overall cleaning was carried out at the end of the entire testing day, whereby the probes were washed with isopropyl alcohol in order to collect the heavy tar that had not been absorbed by the impingers. The cleaning procedure took an additional 10 min to complete.
The testing procedure using the CE-O approach was in accordance with the specifications in the CanmetENERGY report, which included instructions regarding device operation, assembly guidelines, sampling procedures, and use of solvent. Setup of the CE-O device consisted of three main modules: hot gas particulate filtration and heated lines; tar collection flask, chiller, and pump; and gas flow rate measurements.
A follow-up test was performed at the UBC gasifier over a period of two months. The tests involved 40 sampling events using the CE-O device. The device was checked for oxygen leakage. After the test, the concentration of oxygen in the syngas was evaluated. Those samples with high oxygen levels (greater than 0.5%) were deleted from the dataset to ensure that there was no gas dilution due to outside air.

3. Results

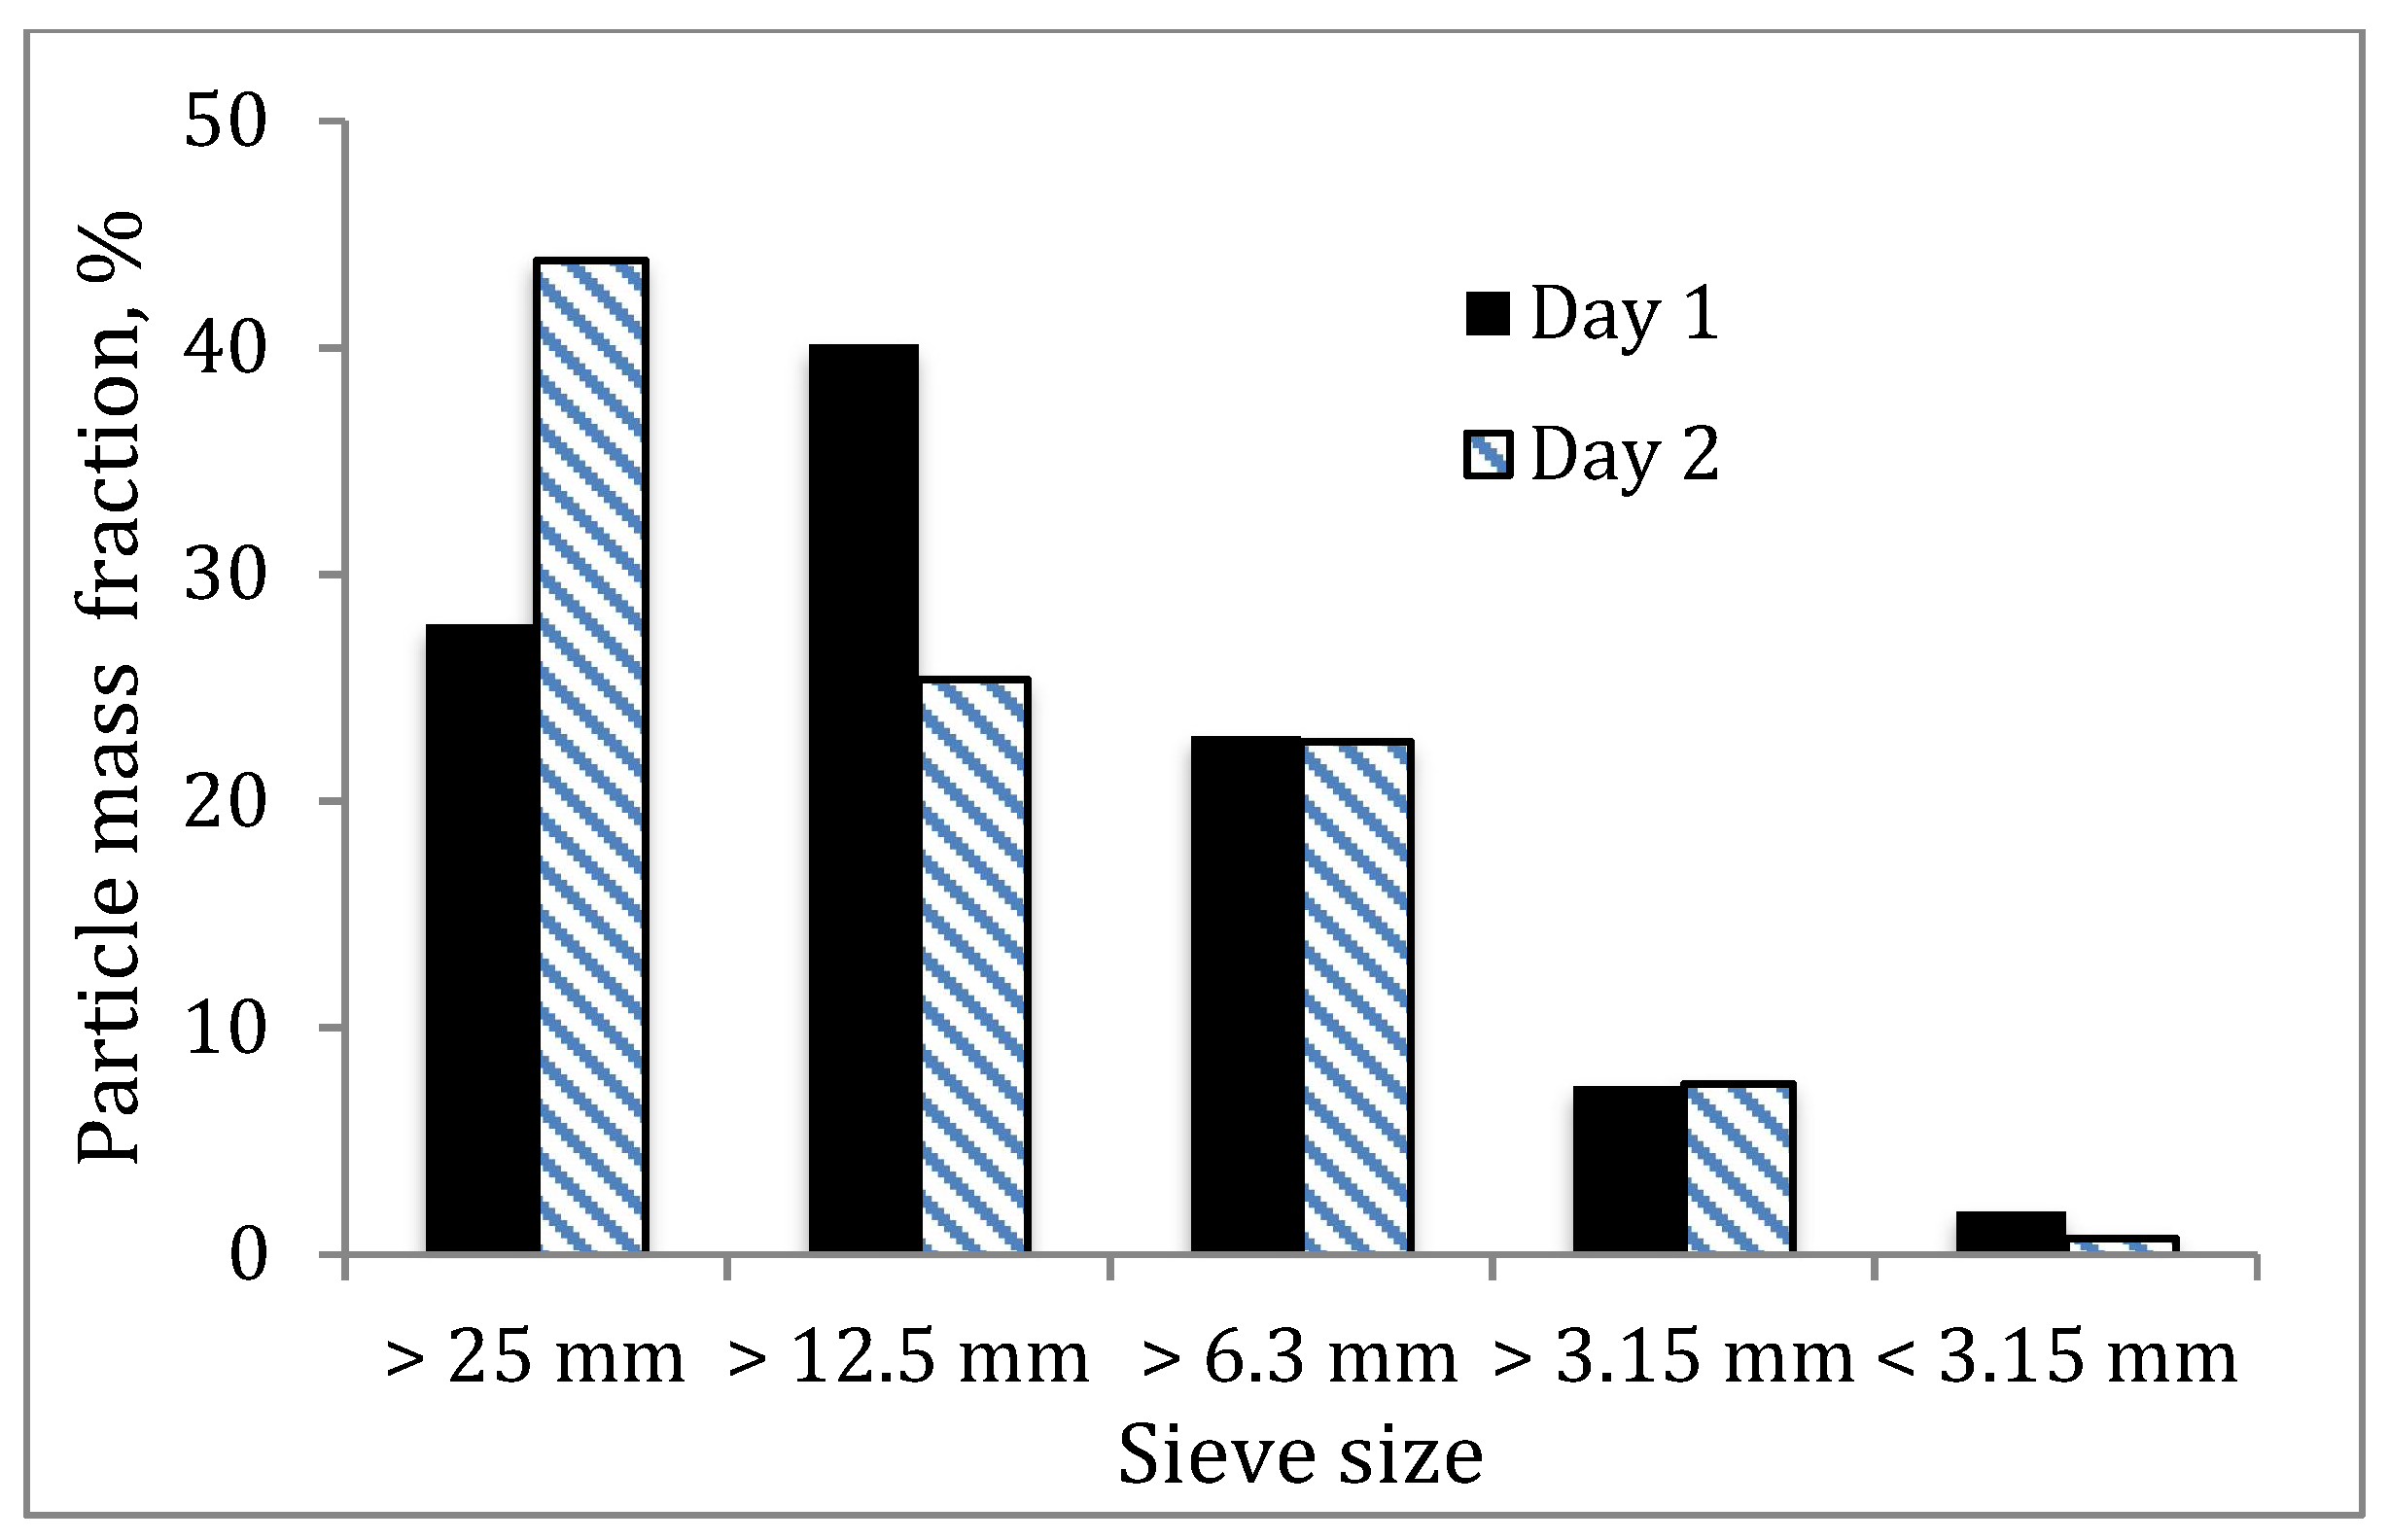
3.1. Fuel Properties

The biomass fuel samples obtained from the gasifier at the tissue plant were fractionated into five sizes (Figure 3) using round-hole screens with diameters of 25, 12.5, 6.3, and 3.15 mm, and a pan. Figure 4 shows the size distribution of the biomass samples. Almost half of the material were large pieces (greater than 25 mm) on day 2, whereas 40% of the mass was between 12.5 and 25 mm on day 1. The mass fraction of small pieces (below 3.15 mm) was less than 2% on both sampling days.
For the UBC gasifier, particle size distribution analysis of the fuel samples shows that about 70% of particles falls in between 3.15 and 25 mm. A somewhat smaller fraction of particles is greater than 25 mm. The samples “as received” at UBC were slightly wetter than the samples at the tissue plant.
Table 1 lists the properties of fuel. Fuel MC ranged from 20.6 to 33.3% wb with an average of 26.8% and standard deviation of 4.3%. Bulk density and calorific value were 150.7 ± 17.3 kg/m3 and 19.2 ± 0.65 MJ/kg, respectively. The physical properties of the biomass between the two sites were not too different, except that the samples at the tissue plant had a somewhat higher ash content (1.8 ± 0.5% db vs. 1.06 ± 0.3% db at the UBC site). Table 2 lists the ultimate analysis and proximate analysis results, indicating that the fuel’s specifications were within the expected values.

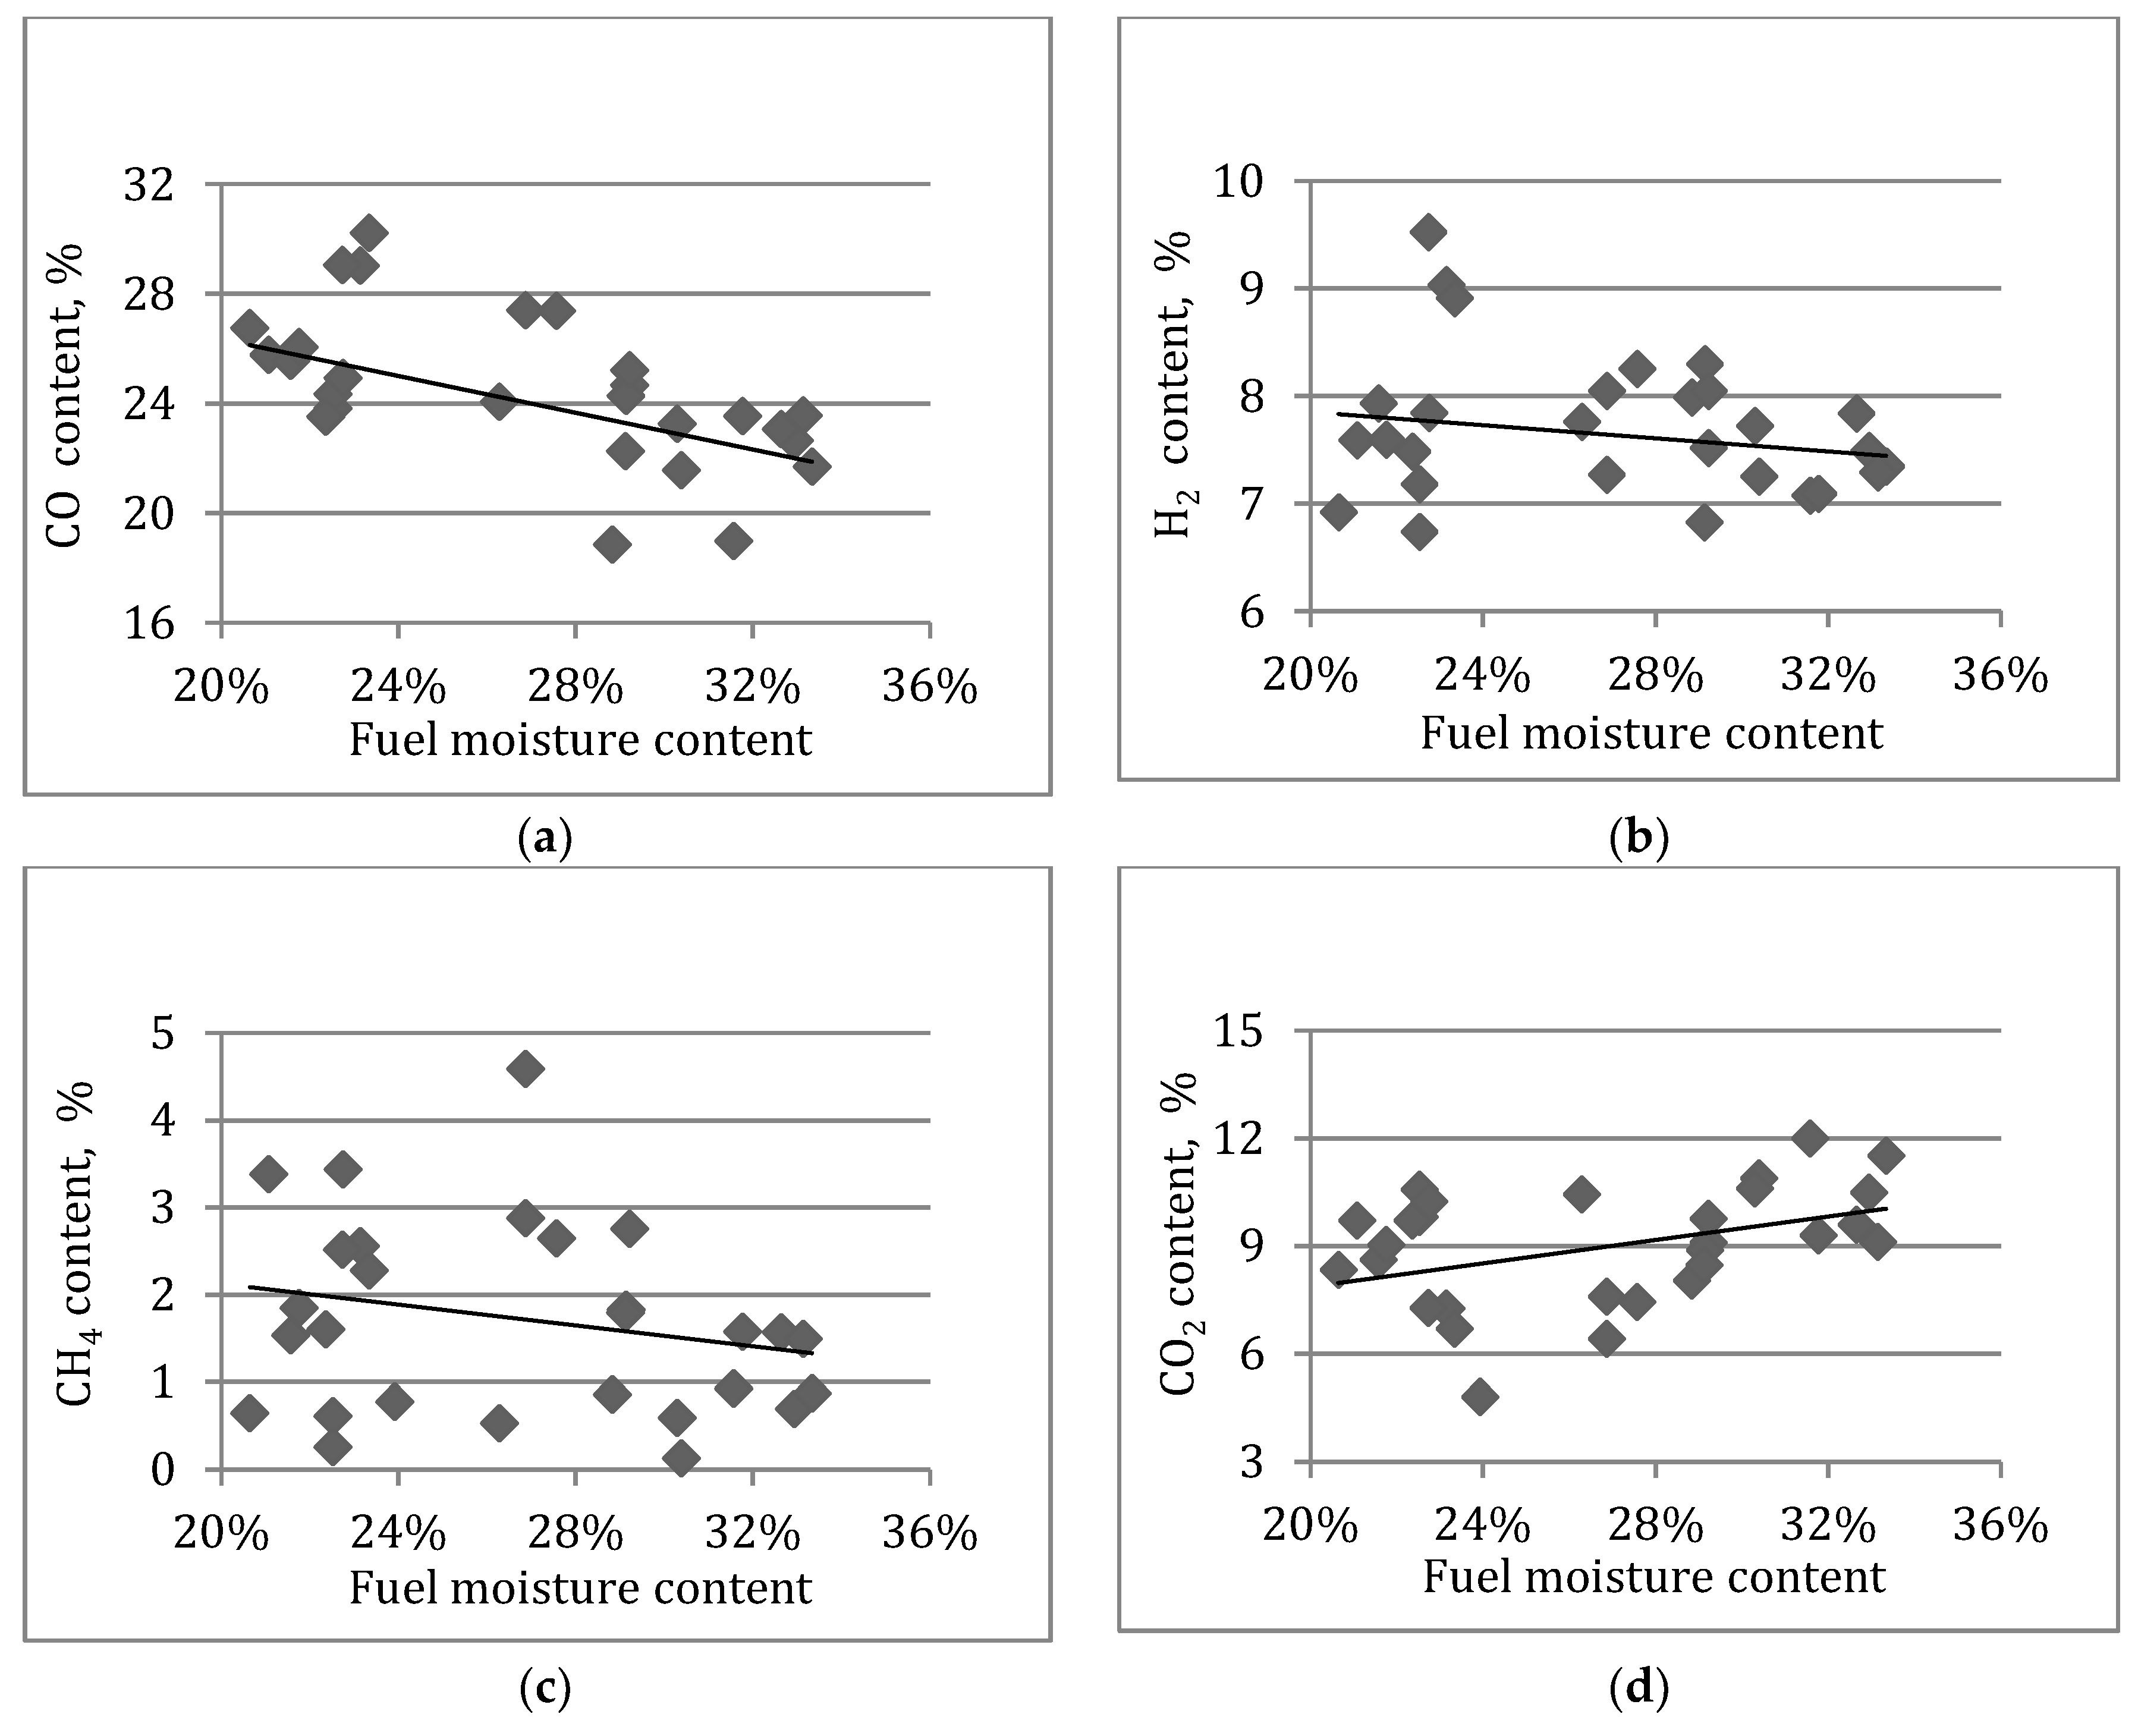
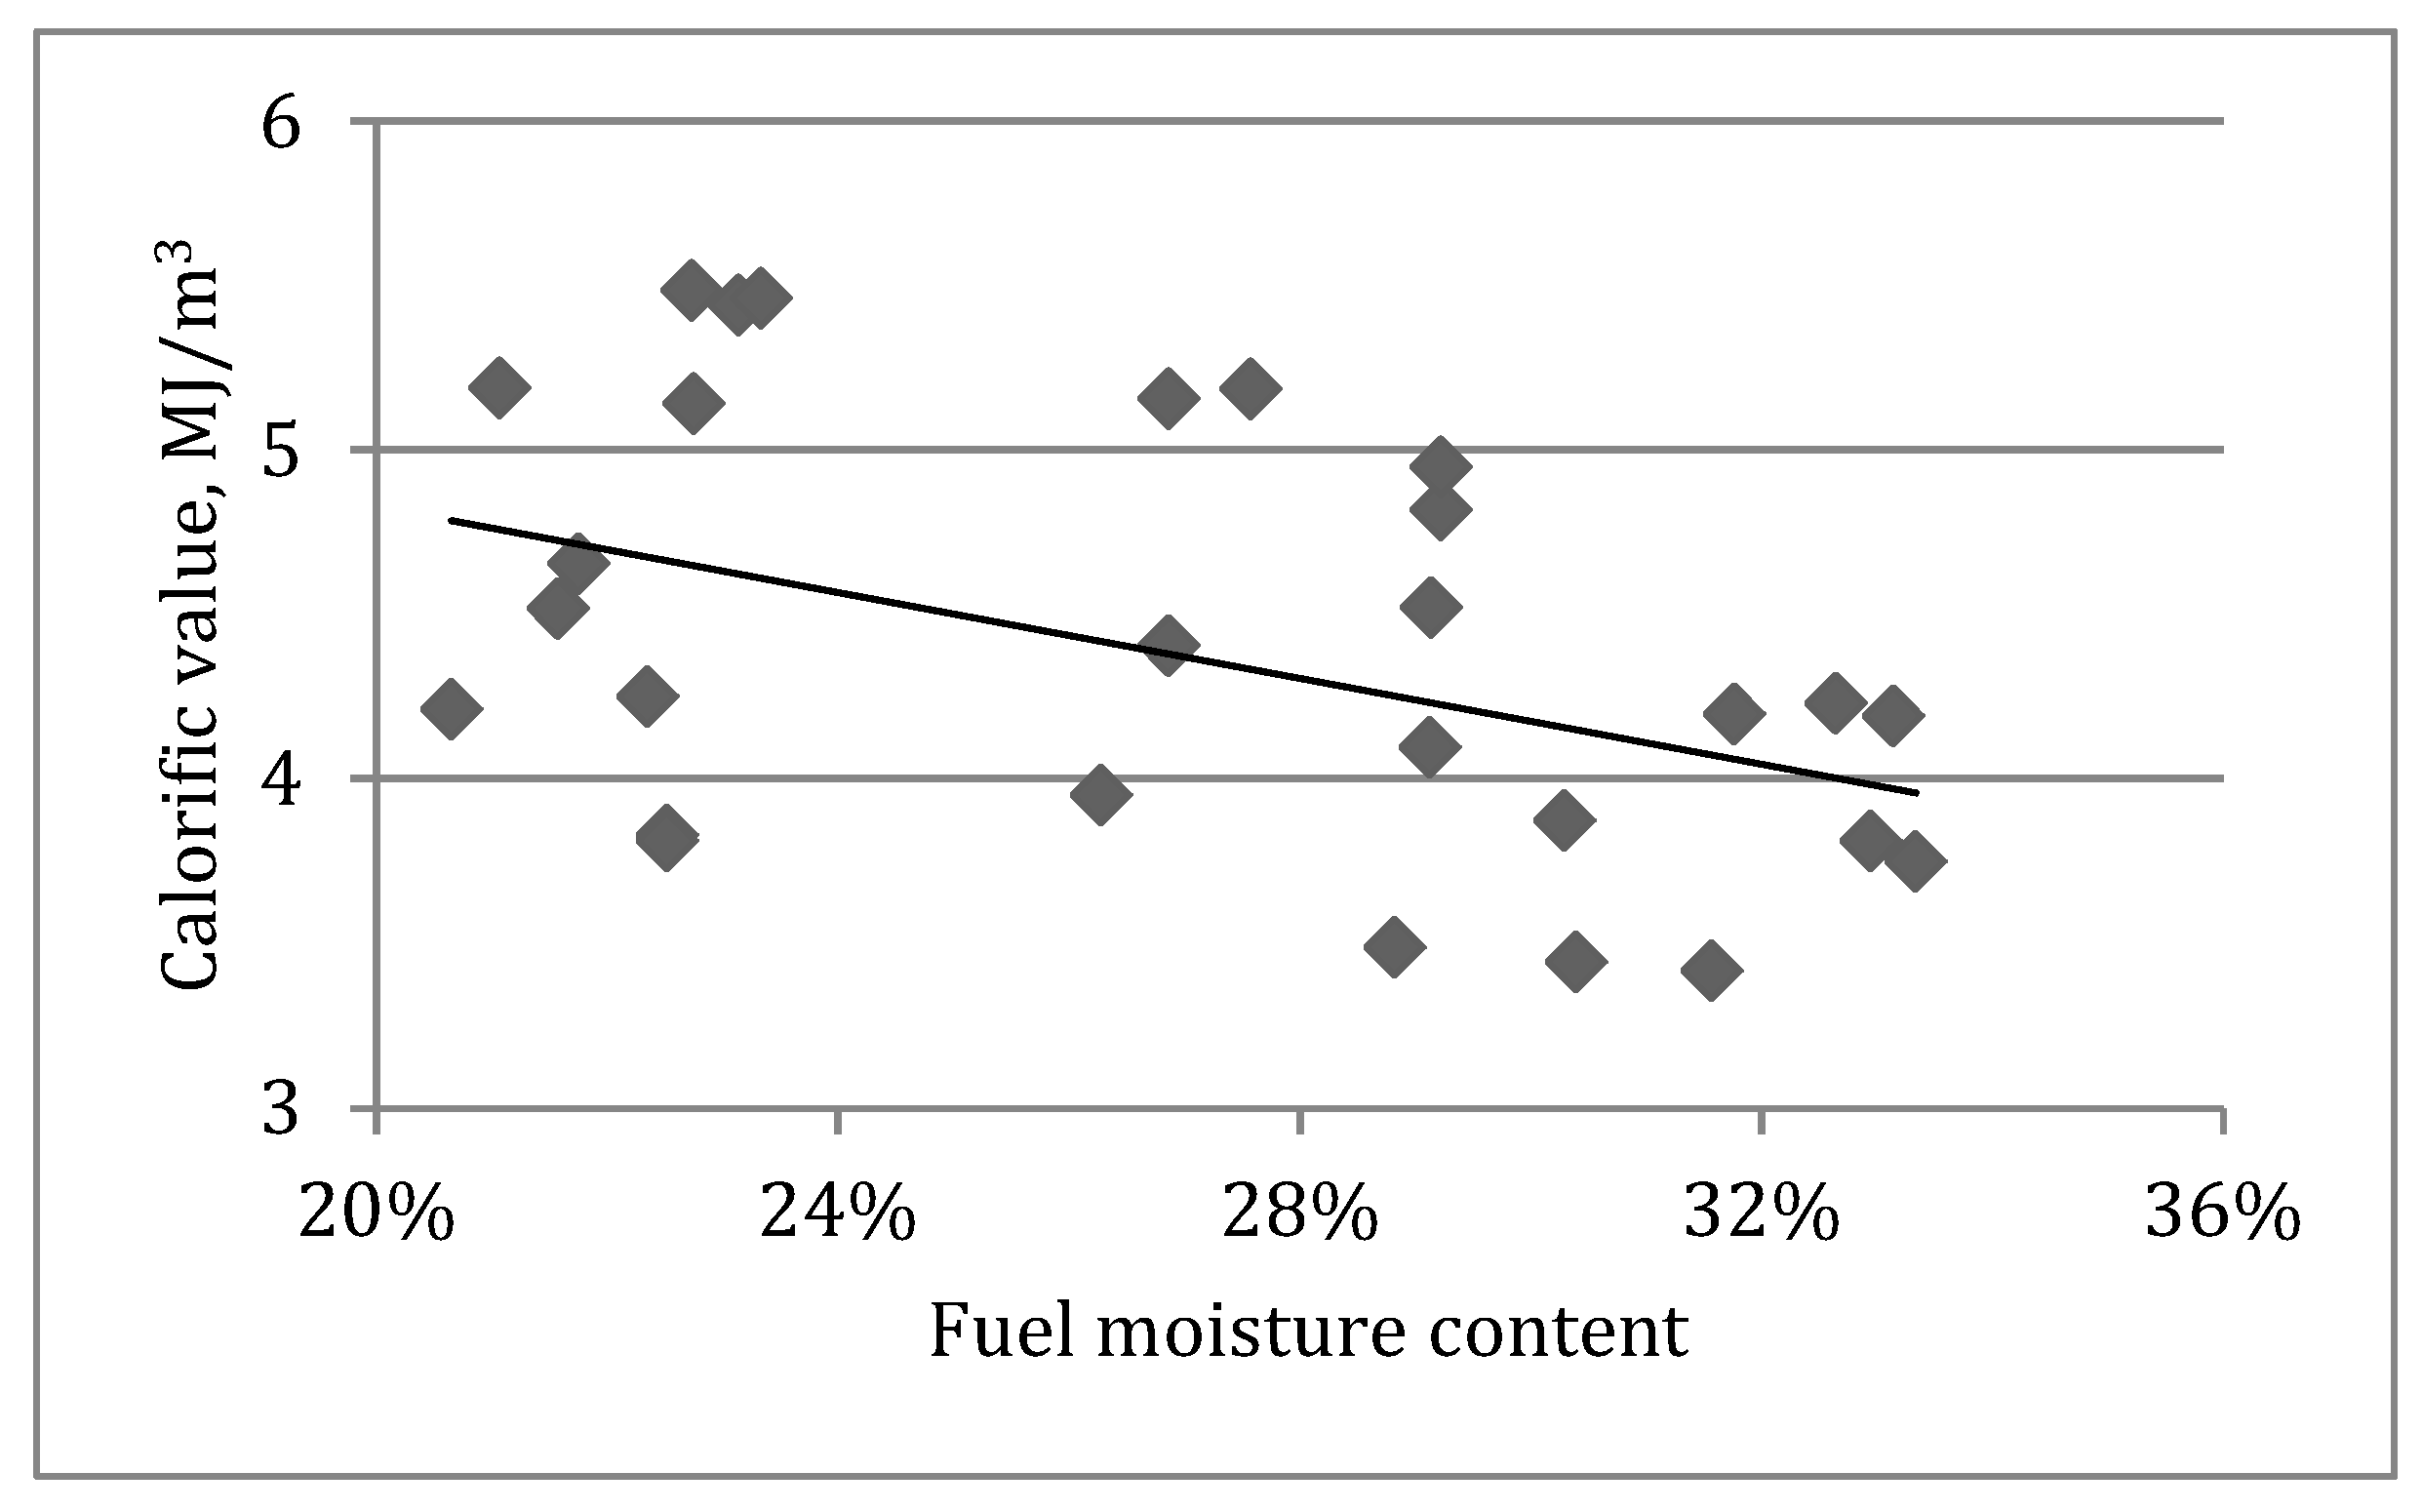
3.2. Syngas Composition

Visual observations and lab results show that no char or unburnt biomass remained in the ash collected from the UBC gasifier. Thus, only results relevant to syngas and tar production are presented in this section and the following section.
Table 3 lists the average, minimum, and maximum concentrations of the syngas components (H2, CH4, CO, CO2) for the two sampling techniques used at the tissue plant. During each sampling event, syngas was collected using sampling bags. Insignificant differences in the syngas composition were observed for the two methods. Moreover, the syngas calorific value of 3.7 MJ/m3 on day 1 was in the neighbourhood of 4.1 MJ/m3 measured on day 2.
The UBC gasification system was routinely managed to ensure the gasifier bed temperature remained relatively constant between 875 and 1050 °C as fuel moisture content varied from 20% to 35% wb, and this was achieved by raising the ER from 0.11 to 0.22 in order to increase the O2 level and hence promote the combustion reaction.

Syngas Composition and Fuel Properties

Figure 5 highlights the variability in parameters from the UBC gasifier. The plot of syngas component concentrations vs. MC shows that as MC increases from 20% to 35%, CO concentration drops from about 30% to 20% (v/v). CO2 concentration increases mildly. H2 and CH4 show a mild decrease. The H2/CO ratio ranging from 0.26 to 0.54 is consistently less than 1.0. The correlation coefficients pertinent to (CO, CH4, H2) vs. syngas calorific value are 0.91, 0.85, 0.76 respectively, indicating that CO has the strongest correlation with MC. Figure 6 shows the effect of moisture content on syngas calorific value. Despite a wide variation in the calorific values vs. MC, the calorific value shows a mild overall decrease from about 5.5 to 3.5 MJ/m3 as MC increases from 20% to 35%.
The gas content is on a volume (v/v) basis. Tests done at the UBC gasifier.

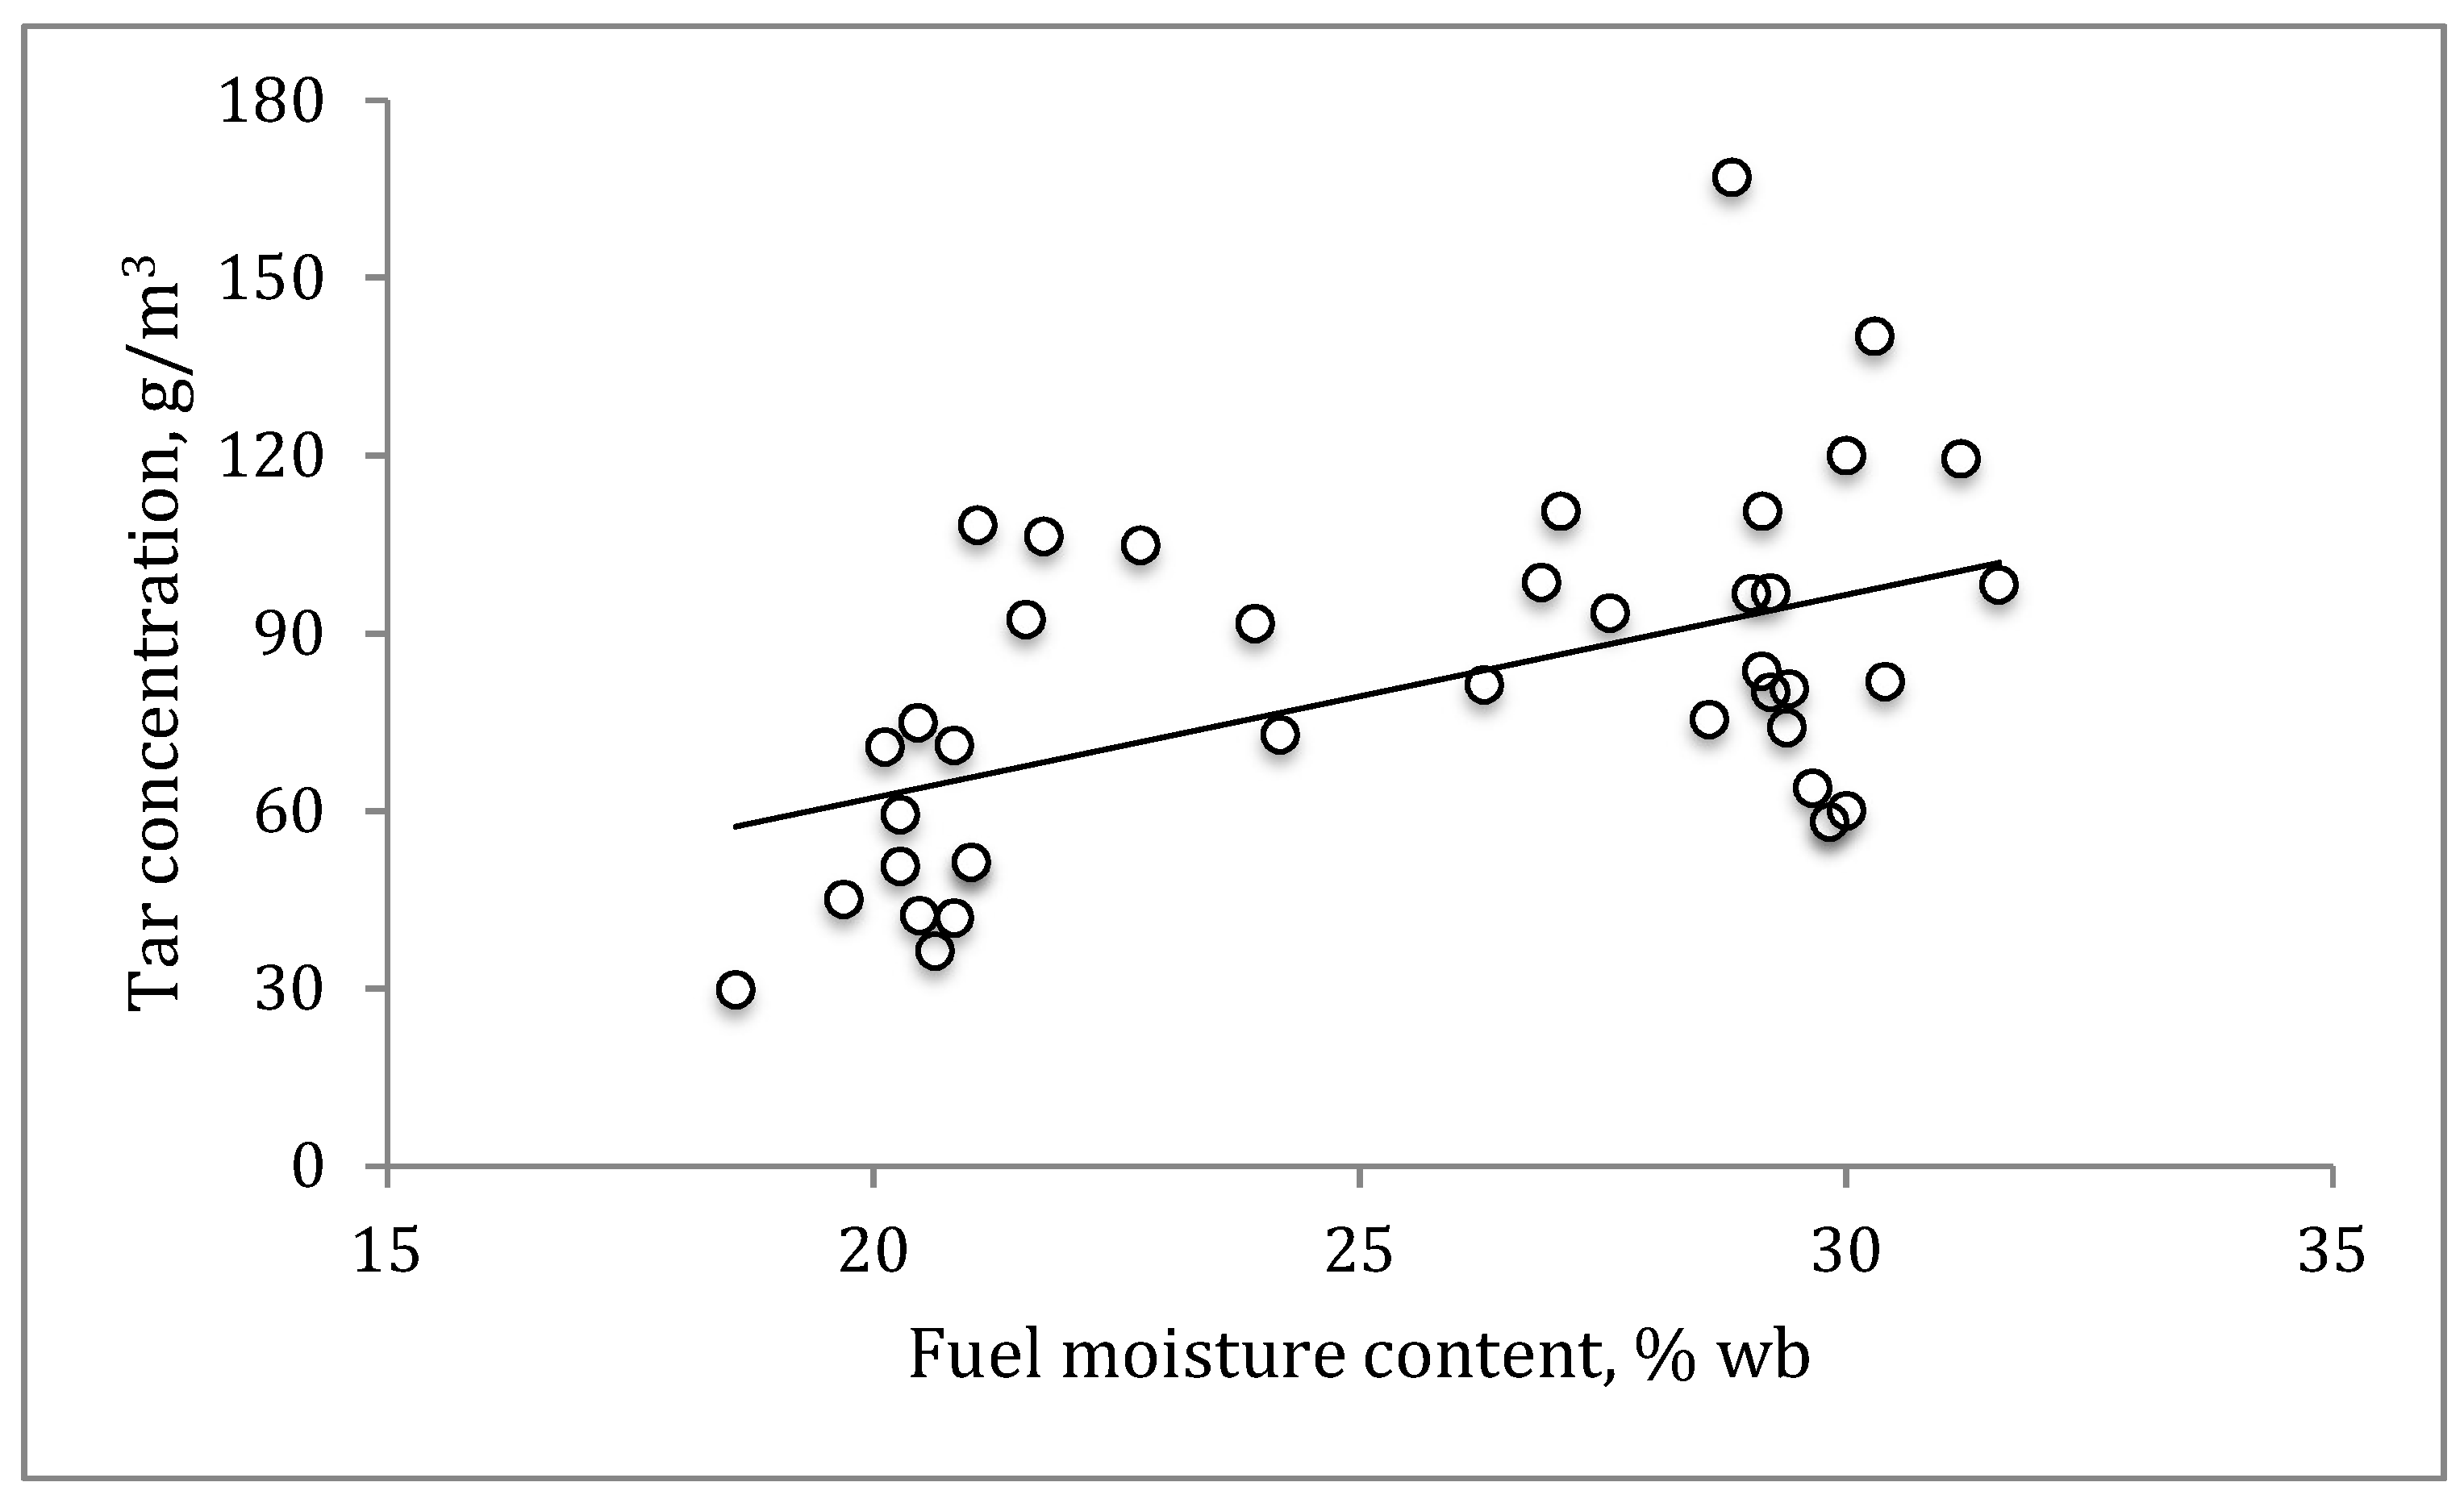
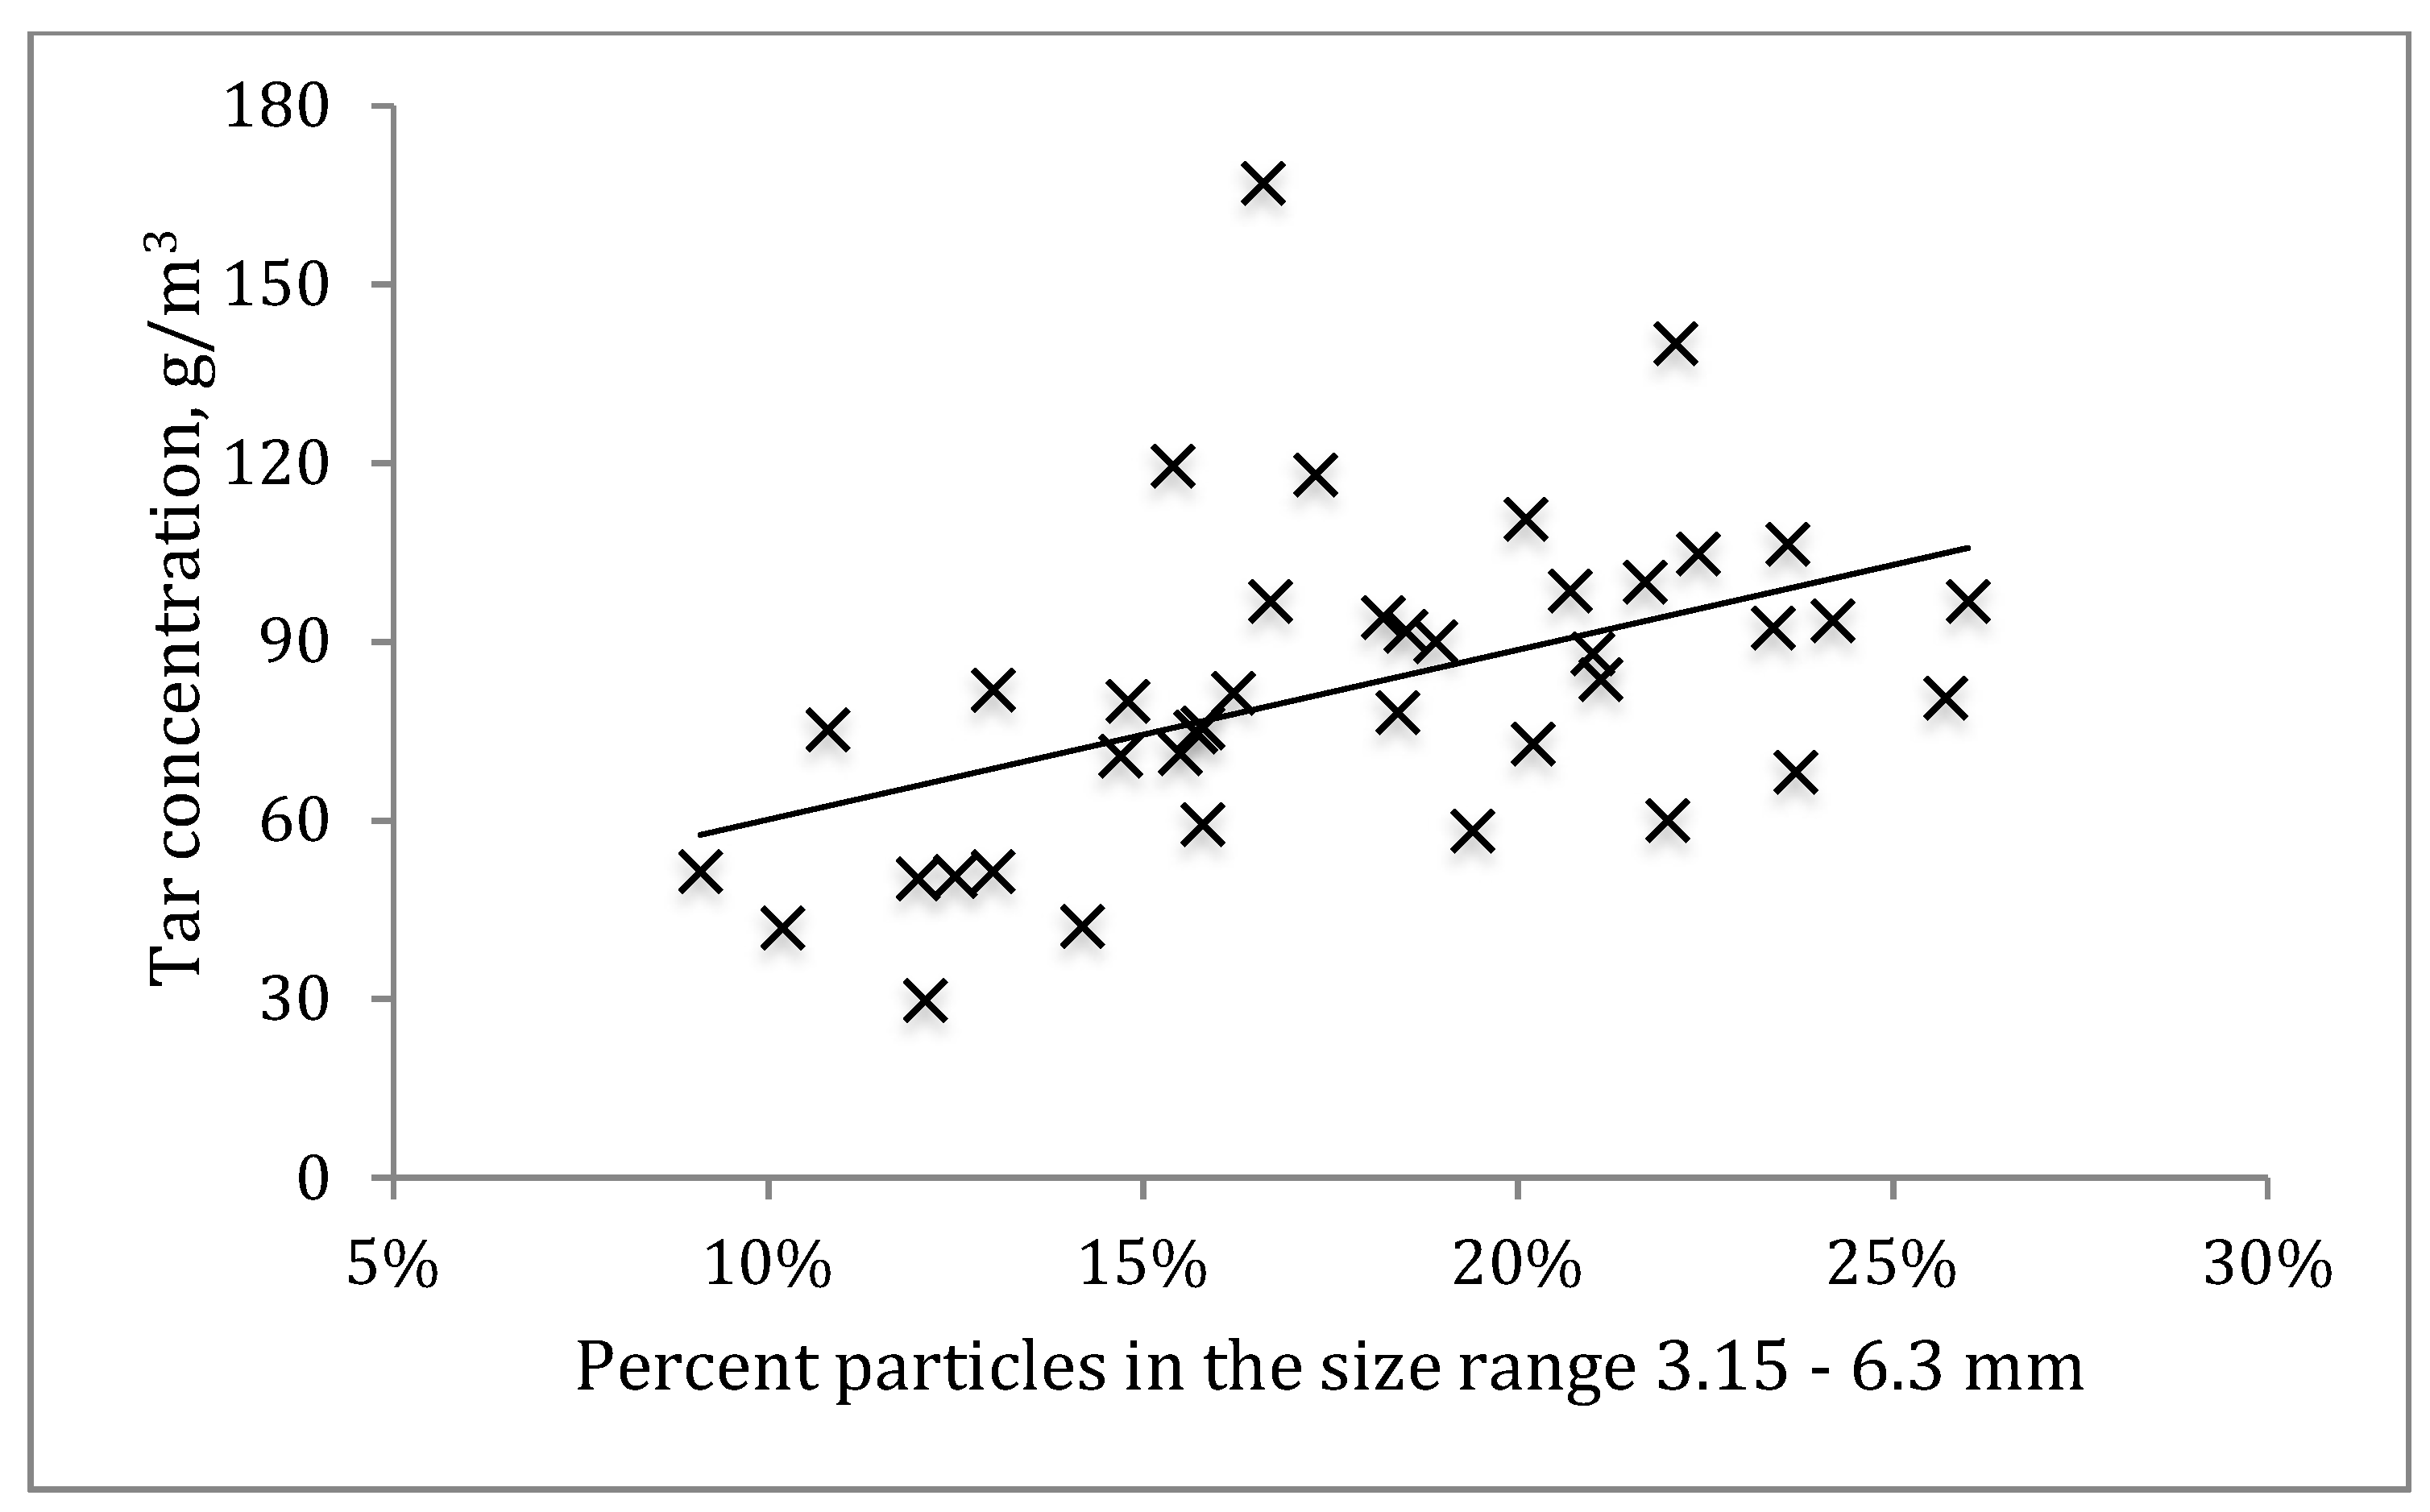
3.3. Tar Concentration

For the gasifier at the tissue plant, the measured tar concentration varied from 23.5 to 100 g/m3. Lower tar was observed on day 2 along with a higher gasifier temperature. On day 2, a lesser quantity of fuel was fed to the gasifier; hence the O2 content in the gasifier was higher, resulting in a greater combustion. The average tar concentration derived from the impingers was 90.6 and 11.5 g / m 3 on day 1 and day 2, respectively. By comparison, the corresponding average tar concentration for the CE-O device was 82.1 and 23.4 g / m 3 , respectively. Tar concentration has been estimated to be of the order of 100 g tar/m3 of gas for updraft gasifiers, 10 g/m3 for fluidized beds, and 1 g/m3 for downdraft gasifiers [36]. Downdraft gasifiers generate the lowest tar concentration because the produced tar has to pass through the combustion zone [37,38,39].
A wider range of tar concentration (24–170 g/m3) with an average value of 78 g/m3 was observed during the 40 sampling events at the UBC gasifier. The gasifier bed temperature remained within the range of 875–1050 °C. Since the system attempts to keep the bed temperature relatively constant, there are more data points around 900 °C. Overall, tar concentration increased slightly with fuel MC (Figure 7), but the correlation coefficient was low at around 0.50. Moisture evaporation led to a decrease in temperature and hence a slight increase in g / m 3 ar yield. Our mea g / m 3 urements also revealed that at somewhat higher fuel MC (27–32% wb), a small increase in the gasifier temperature from 875–925 °C to 925–1050 °C led to a decrease in the tar concentration from 100–160 to 60–100 g/m3.
Particle size distribution analysis of the fuel samples indicated that particle percentages in the four size ranges (3.15–25 mm) varied from 17.8 ± 4.3%, to 28.5 ± 5.6%. Roughly 27% of particles had a size greater than 25 mm, and roughly 6% of particles were below 3.15 mm. Figure 8 illustrates that particle percentages in the small size range (3.15–6.3 mm) had a weak correlation with tar concentration (correlation coefficient = 0.48). Overall, as the particle percentages in this size range increased from 10% to over 25%, the tar concentration increased also from approximately 40 g/m3 to above 90 g/m3.

4. Discussion

Results pertinent to syngas composition indicate that the variation of CO as a syngas component with fuel moisture content is in line with studies performed by other researchers [8,19,20,21,23]. Specifically, as fuel MC increases from 20% to 35%, CO concentration has a pronounced drop and this leads to a reduction in the syngas HHV. While our results indicate a mild decrease in H2 and CH4 content with an increase in fuel MC, Atnaw et al. [21] and James et al. [22] reported marginal or negligible changes in H2 and CH4, though Li et al. [19] observed a decrease, and Paasen and Kiel [20] found a modest increase in H2. The increase in CO2 concentration with increasing MC is similar to findings by Huang et al. [8].
Our tar measurements for the industrial updraft gasifier demonstrate a similar relationship between tar formation and gasifier temperature, in that published lab-scale and pilot-scale studies on fluidized bed and downdraft gasifiers [19,20,21,40] have also indicated that a higher gasifier bed temperature led to a lower tar concentration. Moreover, our findings are aligned with Bronson et al. [25], in that biomass fuel with higher portion of small particles caused higher tar concentration.
Overall, our findings suggested that even for a gasifier operating under commercial conditions, syngas quality would be enhanced if the biomass fuel moisture content could be maintained at around 20%. The CO concentration (~30%) and calorific value (>4 MJ/m3) will be high while tar concentration is kept below 60–70 g/m3 for the commercial gasifier. However, unlike the published data from controlled laboratory experiments, the data collected from a commercial unit indicate a wide variation. This may be due to conditions under which the use of automation for process control are difficult. Further research is required to develop robust relations among various operating conditions and the quality of syngas.

5. Conclusions

Two industrial updraft gasifiers were used in this study. Field data on the variability of urban woody biomass fuel vs. syngas composition and tar concentration were analyzed. No efforts were made to adjust the properties of biomass and operational conditions of the gasifier. The measured data is characterized by its wide variations from one test to the next. This shows that actual operating conditions produce data that have much more variation than the highly controlled laboratory tests.
For the industrial gasifier at UBC with a longer period of gasifier run and sampling events, the gasifier temperature ranged between 875 and 1075 °C during the testing period. Results indicated that as the fuel moisture content increases from 20% to 35%, CO concentration drops from about 30% to 20% and CO2 concentration has a mild increase, H2 and CH4 concentrations decrease slightly. The H2/CO ratio of 0.26–0.54 is consistently less than 1.0 since air was used as the gasifying agent for the industrial gasifier. Tar concentration varied from 24 to 170 g/m3 with an average value of 78 g/m3.
The 20–35% range of fuel moisture content did not have a significant effect on the tar concentration, while particle percentages in the smaller size range of (3.15–6.3 mm) was found to have a mild correlation with tar concentration. As the particle percentages in this size range increased from 10% to more than 25%, tar concentration also increased from 40 g/m3 to more than 90 g/m3. Our results are in line with the trends reported in the literature for lab-scale and pilot-scale studies, despite the different operating conditions and types of gasifiers which were used.
Based on the findings of this study, biomass fuel moisture content of ±20% is recommended for the industrial updraft gasifier in order to achieve higher syngas quality and lower tar concentration.

Author Contributions

Investigation, E.O., S.S. and A.L.; Methodology, J.L. and F.P.; Resources, F.P.; Supervision, S.S. and A.L.; Writing–original draft, E.O.; Writing–review & editing, S.S., A.L., X.B. and C.M.

Funding

The research of this article was funded in part by BioFuelNet Canada grant number 65 and Natural Sciences and Engineering Research Council of Canada grant number RGPIN 42377-12, and CanmetENERGY of NRCan.

Acknowledgments

The authors gratefully acknowledge the continuing support from Cloverdale Fuel Ltd. (Cloverdale, BC) and the personnel at the UBC Bioenergy Research and Demonstration Facility. Thanks is also extended to Serge Milaire, electronics technician and Bahman Ghiasi, doctoral candidate for their help with the syngas sampling system installation, and Indah Andriani for assistance with the sampling events.

Conflicts of Interest

The authors declare no conflict of interest.

References

  1. Heidenreich, S.; Foscolo, P.U. New concepts in biomass gasification. Prog. Energy Combust. Sci. 2015, 46, 72–95. [Google Scholar] [CrossRef]
  2. Oveisi, E.; Sokhansanj, S.; Lau, A.; Lim, C.J.; Bi, X.; Ebadian, M.; Preto, F.; Mui, C.; Gill, R. In-depot upgrading the quality of fuel chips for a commercial gasification plant. Biomass Bioenergy 2018, 108, 138–145. [Google Scholar] [CrossRef]
  3. Bridgwater, A.V. The technical and economic feasibility of biomass gasification for power generation. Fuel 1995, 74, 631–653. [Google Scholar] [CrossRef]
  4. Monteiro, E.; Sotton, J.; Bellenoue, M.; Moreira, N.A.; Malheiro, S. Experimental study of syngas combustion at engine-like conditions in a rapid compression machine. Exp. Therm. Fluid Sci. 2011, 35, 1473–1479. [Google Scholar] [CrossRef]
  5. Rajvanshi, A.K. Biomass gasification. Altern. Energy Agric. 1986, 2, 82–102. [Google Scholar]
  6. Molino, A.; Larocca, V.; Chianese, S.; Musmarra, D. Biofuels production by biomass gasification: A review. Energies 2018, 11, 811. [Google Scholar] [CrossRef]
  7. Van Der Drift, A.; Van Doorn, J.; Vermeulen, J.W. Ten residual biomass fuels for circulating fluidized-bed gasification. Biomass Bioenergy 2001, 20, 45–56. [Google Scholar] [CrossRef]
  8. Huang, S.; Wu, S.; Wu, Y.; Gao, J. Structure characteristics and gasification activity of residual carbon from updraft fixed-bed biomass gasification ash. Energy Convers. Manag. 2017, 136, 108–118. [Google Scholar] [CrossRef]
  9. Carpenter, D.L.; Bain, R.L.; Davis, R.E.; Dutta, A.; Feik, C.J.; Gaston, K.R.; Jablonski, W.; Phillips, S.D.; Nimlos, M.R. Pilot-scale gasification of corn stover, switchgrass, wheat straw, and wood: 1. Parametric study and comparison with literature. Ind. Eng. Chem. Res. 2010, 49, 1859–1871. [Google Scholar] [CrossRef]
  10. Chopra, S.; Jain, A. A review of fixed bed gasification systems for biomass. Agric. Eng. Int. CIGR 2007, 9, 1–23. [Google Scholar]
  11. Bharadwaj, A.; Baxter, L.L.; Robinson, A.L. Effects of intraparticle heat and mass transfer on biomass devolatilization: Experimental results and model predictions. Energy Fuels 2004, 18, 1021–1031. [Google Scholar] [CrossRef]
  12. Chan, W.C.R.; Kelbon, M.; Krieger, B.B. Modelling and experimental verification of physical and chemical processes during pyrolysis of a large biomass particle. Fuel 1985, 64, 1505–1513. [Google Scholar] [CrossRef]
  13. Couto, N.D.; Silva, V.B.; Monteiro, E.; Rouboa, A. Assessment of municipal solid wastes gasification in a semi-industrial gasifier using syngas quality indices. Energy 2015, 93, 864–873. [Google Scholar] [CrossRef]
  14. Qin, Y.H.; Feng, J.; Li, W.Y. Formation of tar and its characterization during air-steam gasification of sawdust in a fluidized bed reactor. Fuel 2010, 89, 1344–1347. [Google Scholar] [CrossRef]
  15. Palma, C.F. Model for biomass gasification including tar formation and evolution. Energy Fuels 2013. [Google Scholar] [CrossRef]
  16. Abu El-Rub, Z.; Bramer, E.; Brem, G. Review of catalysts for tar elimination in biomass gasification processes. Ind. Eng. Chem. Res. 2004, 45, 75–80. [Google Scholar] [CrossRef]
  17. Milne, T.A; Evans, R.J. Biomass gasifier “tars”: Their nature, formation, and conversion. Constraints 1998. [Google Scholar] [CrossRef]
  18. Basu, P. Biomass Gasification, Pyrolysis and Torrefaction: Practical Design and Theory; Academic Press: London, UK, 2013; ISBN 9780123964885. [Google Scholar]
  19. Li, X.T.; Grace, J.R.; Lim, C.J.; Watkinson, A.P.; Chen, H.P.; Kim, J.R. Biomass gasification in a circulating fluidized bed. Biomass Bioenergy 2004, 26, 171–193. [Google Scholar] [CrossRef]
  20. Van Paasen, S.V.B.; Kiel, J.H.A. Tar formation in a fluidised-bed gasifier: Impact of fuel properties and operating conditions. Kardiol. Pol. 2004, 67, 58. [Google Scholar]
  21. Atnaw, S.M.; Sulaiman, S.A.; Yusup, S. Influence of fuel moisture content and reactor temperature on the calorific value of Syngas resulted from gasification of oil palm fronds. Sci. World J. 2014. [Google Scholar] [CrossRef] [PubMed]
  22. James, R.; Arthur, M.; Yuan, W.; Boyette, M.D. The Effect of Biomass Physical Properties on Top-Lit Updraft Gasification of Woodchips. Energies 2016, 9, 283. [Google Scholar] [CrossRef]
  23. James, A.M.; Yuan, W.; Boyette, M.D.; Wang, D. The effect of air flow rate and biomass type on the performance of an updraft biomass gasifier. BioResources 2015, 10, 3615–3624. [Google Scholar] [CrossRef]
  24. Chianese, S.; Fail, S.; Binder, M.; Rauch, R.; Hofbauer, H.; Molino, A.; Blasi, A.; Musmara, D. Experimental investigations of hydrogen production from CO catalytic conversion of tar rich syngas by biomass gasification. Catal. Today 2016, 277, 182–191. [Google Scholar] [CrossRef]
  25. Bronson, B.; Gogolek, P.; Mehrani, P.; Preto, F. Experimental investigation of the effect of physical pre-treatment on air-blown fluidized bed biomass gasification. Biomass Bioenergy 2016, 88, 77–88. [Google Scholar] [CrossRef]
  26. McKendry, P. Energy production from biomass (part 1): Overview of biomass. Bioresour. Technol. 2002, 83, 37–46. [Google Scholar] [CrossRef]
  27. McKendry, P. Energy production from biomass (part 3): Gasification technologies. Bioresour. Technol. 2002, 83, 55–63. [Google Scholar] [CrossRef]
  28. Dai, J.; Cui, H.; Grace, J.R. Biomass feeding for thermochemical reactors. Prog. Energy Combust. Sci. 2012, 38, 716–736. [Google Scholar] [CrossRef]
  29. Tourigny, G.; Bronson, B.; Robinson, T.; Preto, F. Design and Operation of a New Sampling Device for the Measurement of Tar in Biomass Producer Gas; Confidential CanmetENERGY-Ottawa report No. CanmetENERGY-Ottawa/BIOLAB 2013-07; NRCan: Ottawa, ON, Canada, 2013.
  30. Kiel, J.; Van Paasen, S.; Neeft, J. Primary Measures to Reduce tar Formation in Fluidised-Bed Biomass Gasifiers; Report No. Ecn-C-04-014; Energy Research Centre of the Netherlands: Petten, The Netherlands, 2004. [Google Scholar]
  31. Van de Kamp, W.; De Wild, P.; Zielke, U.; Suomalainen, M.; Knoef, H.; Good, J.; Liliedahl, T.; Unger, C.; Whitehouse, M.; Neeft, J.; et al. Tar measurement standard for sampling and analysis of tars and particles in biomass gasification product gas. In Proceedings of the 14th European Biomass Conference & Exhibition, Paris, France, 17–21 October 2005; pp. 791–794. [Google Scholar]
  32. European Comitte for Standardisation (CEN). Biomass Gasification–Tar and Particles in Product Gases—Sampling and Analysis; CEN/TS 15439; European Comitte for Standardisation: Brussels, Belgium, 2006. [Google Scholar]
  33. Robinson, T. Bubbling Fluidized Bed Gasification of Biomass and Refuse Derived Fuel; University of Ottawa: Ottawa, ON, Canada, 2015. [Google Scholar]
  34. European Comitte for Standardisation (CEN). Solid biofuels—Sampling—Part 1: Methods for Sampling; CEN/TS 14778-1; European Comitte for Standardisation: Brussels, Belgium, 2005. [Google Scholar]
  35. European Comitte for Standardisation (CEN). Solid Biofuels—Methods for the Determination of Moisture Content: Oven Dry Method; CEN/TS 14774; European Comitte for Standardisation: Brussels, Belgium, 2005. [Google Scholar]
  36. Sun, Q.; Yu, S.; Wang, F.; Wang, J. Decomposition and gasification of pyrolysis volatiles from pine wood through a bed of hot char. Fuel 2011, 90, 1041–1048. [Google Scholar] [CrossRef]
  37. Maniatis, K. Progress in Biomass Gasification: An Overview. Prog. Thermochem. Biomass Convers. 2008, 1–31. [Google Scholar] [CrossRef]
  38. Zhang, L.; Xu, C.; Champagne, P. Overview of recent advances in thermo-chemical conversion of biomass. Energy Convers. Manag. 2010, 51, 969–982. [Google Scholar] [CrossRef]
  39. Zhang, W. Automotive fuels from biomass via gasification. Fuel Process. Technol. 2010, 91, 866–876. [Google Scholar] [CrossRef]
  40. Phuphuakrat, T.; Nipattummakul, N.; Namioka, T.; Kerdsuwan, S.; Yoshikawa, K. Characterization of tar content in the syngas produced in a downdraft type fixed bed gasification system from dried sewage sludge. Fuel 2010, 89, 2278–2284. [Google Scholar] [CrossRef]
Figure 1. The updraft gasifier at the University of British Columbia, Vancouver campus.
Environments 05 00084 g001
Figure 2. Side-by-side syngas and tar sampling arrangement using impingers and the CE-O (CanmetENERGY-Ottawa) device. The sampling port is located about 2/3 distance from the bottom of the reactor.
Environments 05 00084 g002
Figure 3. The fuel samples were separated into five sizes. Particle size (x) from the top left to the bottom: x > 25 mm, 12.5 < x < 25 mm, 6.3 < x < 12.5 mm, 3.15 < x < 6.3 mm, and x < 3.15 mm.
Environments 05 00084 g003
Figure 4. Mass fraction of the biomass particles and their size distribution for each day of the test conducted at the tissue plant.
Environments 05 00084 g004
Figure 5. Variation of gas contents with fuel moisture content: (a) CO, (b) H2, (c) CH4, (d) CO2.
Environments 05 00084 g005
Figure 6. Syngas caloric value vs. fuel moisture content.
Environments 05 00084 g006
Figure 7. Tar concentration vs. fuel moisture content. Tests done at the UBC gasifier.
Environments 05 00084 g007
Figure 8. Tar concentration vs. percent particles with a smaller size range Tests done at the UBC gasifier.
Environments 05 00084 g008
Table 1. Properties of fuel based on samples taken at University of British Columbia.
ParameterMoisture Content (% wb)Bulk Density (kg/m3)Ash Content (% db)Calorific Value (MJ/kg)
Average26.8150.71.0619.20
Standard deviation4.317.30.280.65
Coefficient of variation0.150.110.270.03
wb: wet basis; db: dry basis.
Table 2. Ultimate and proximate analysis of fuel.
ParameterMeasured Value (%)Expected Range from Gasifier Specs (%)
Volatiles83.070–85
Fixed carbon16.515–25
Carbon54.648–52
Hydrogen5.805–6
Oxygen39.036–44
Nitrogen0.09<0.2
Sulphur0.02<0.025
Chlorine0.04<0.025
Table 3. Comparison of gas composition using the impingers and CE-O sampling techniques.
SpeciesCEN/TS 15439 MethodCE-O Device
AveStdDevMinMaxAveStdDevMinMax
H29.10.58.49.98.01.26.09.8
O20.70.60.32.10.70.40.31.3
N257.31.954.661.357.22.353.761.7
CH41.30.30.81.92.00.51.12.7
CO19.82.016.721.920.11.618.022.7
CO211.90.710.812.712.00.810.713.2

