Study on the Appraisal of Tourism Demands and Recreation Benefits for Nanwan Beach, Kenting, Taiwan


1
Department of Recreation and Healthcare Management, Chia Nan University of Pharmacy & Science, Tainan City 71710, Taiwan
2
Department of Tourism, Food & Beverage Management, Chang Jung Christian University, Tainan City 71101, Taiwan
*
Author to whom correspondence should be addressed.
Environments 2018, 5(9), 97; https://0-doi-org.brum.beds.ac.uk/10.3390/environments5090097
Submission received: 25 July 2018
/
Revised: 15 August 2018
/
Accepted: 18 August 2018
/
Published: 25 August 2018
Abstract
:This study implemented a questionnaire survey on tourists to the Nanwan Beach, Kenting, Taiwan and then applied the travel cost method to appraise the recreation benefits of the Nanwan Beach. The truncated Poisson model (TPOIS), truncated negative binomial distribution model, and on-site Poisson model were applied in view of the errors caused by truncated samples and endogenous stratification, and the results indicated that: (1) The on-site Poisson model was more suitable than the other two models for estimating the recreation benefits of Nanwan; (2) the three recreational benefit indicators (consumer surplus, compensation variation, and equivalent variation) estimated using the TPOIS model were all significantly greater than those of the on-site Poisson model; (3) the on-site Poisson model estimated the price elasticity and income elasticity of the tourism demands for Nanwan as −0.329 and 0.187, respectively; and (4) on the basis of the on-site Poisson model, the consumer surplus for Nanwan was NT$9639 (approximately US$289) per person per visit, and the annual gross recreation benefits were approximate NT$8.022 billion. The results are expected to provide a valuable reference for management and planning policies of the Kenting National Park.
1. Introduction
The rapid economic growth in Taiwan has raised the national income and enabled its people to pursue a higher quality of life. The policy that allows people to have two days off every week, which came into effect in 2001, has also increased the number of people engaging in recreational activities because people have more free time. Consequently, the beaches have become a primary public leisure and recreation resource frequented by the people. As an island, Taiwan has been endowed with widely diversifying coastal landforms, which provide much potential for the recreational use of beaches. The appraisal of recreation benefits is a primary reference for developing beach recreational industries and improving environmental quality; however, most studies on the recreational use of beaches in Taiwan focus on resource survey or recreational behavior analysis; few have investigated its recreation benefits. That said, the recreation benefits of beaches represent a critical topic for sustainably using this public resource. However, because the “public goods” nature of recreational resources often results in difficulties in obtaining adequate pricing information from the market, benefit appraisal must be conducted by viewing such resources as nonmarket goods. The most common current methods for recreational benefit appraisal are either the “travel cost method (TCM)”, which uses tourism demand functions to estimate the use values of recreation through tourists’ consumer surplus (CS) or the “contingent valuation method (CVM)”, which estimates the use and nonuse values of recreational environmental recovery and environmental protection. The present study primarily relied on the TCM to establish an effective recreation benefit appraisal model for the Nanwan Beach in Kenting. The annual gross recreation benefits thus estimated can be expected to provide a valuable reference for the Kenting National Park.
2. Literature Review
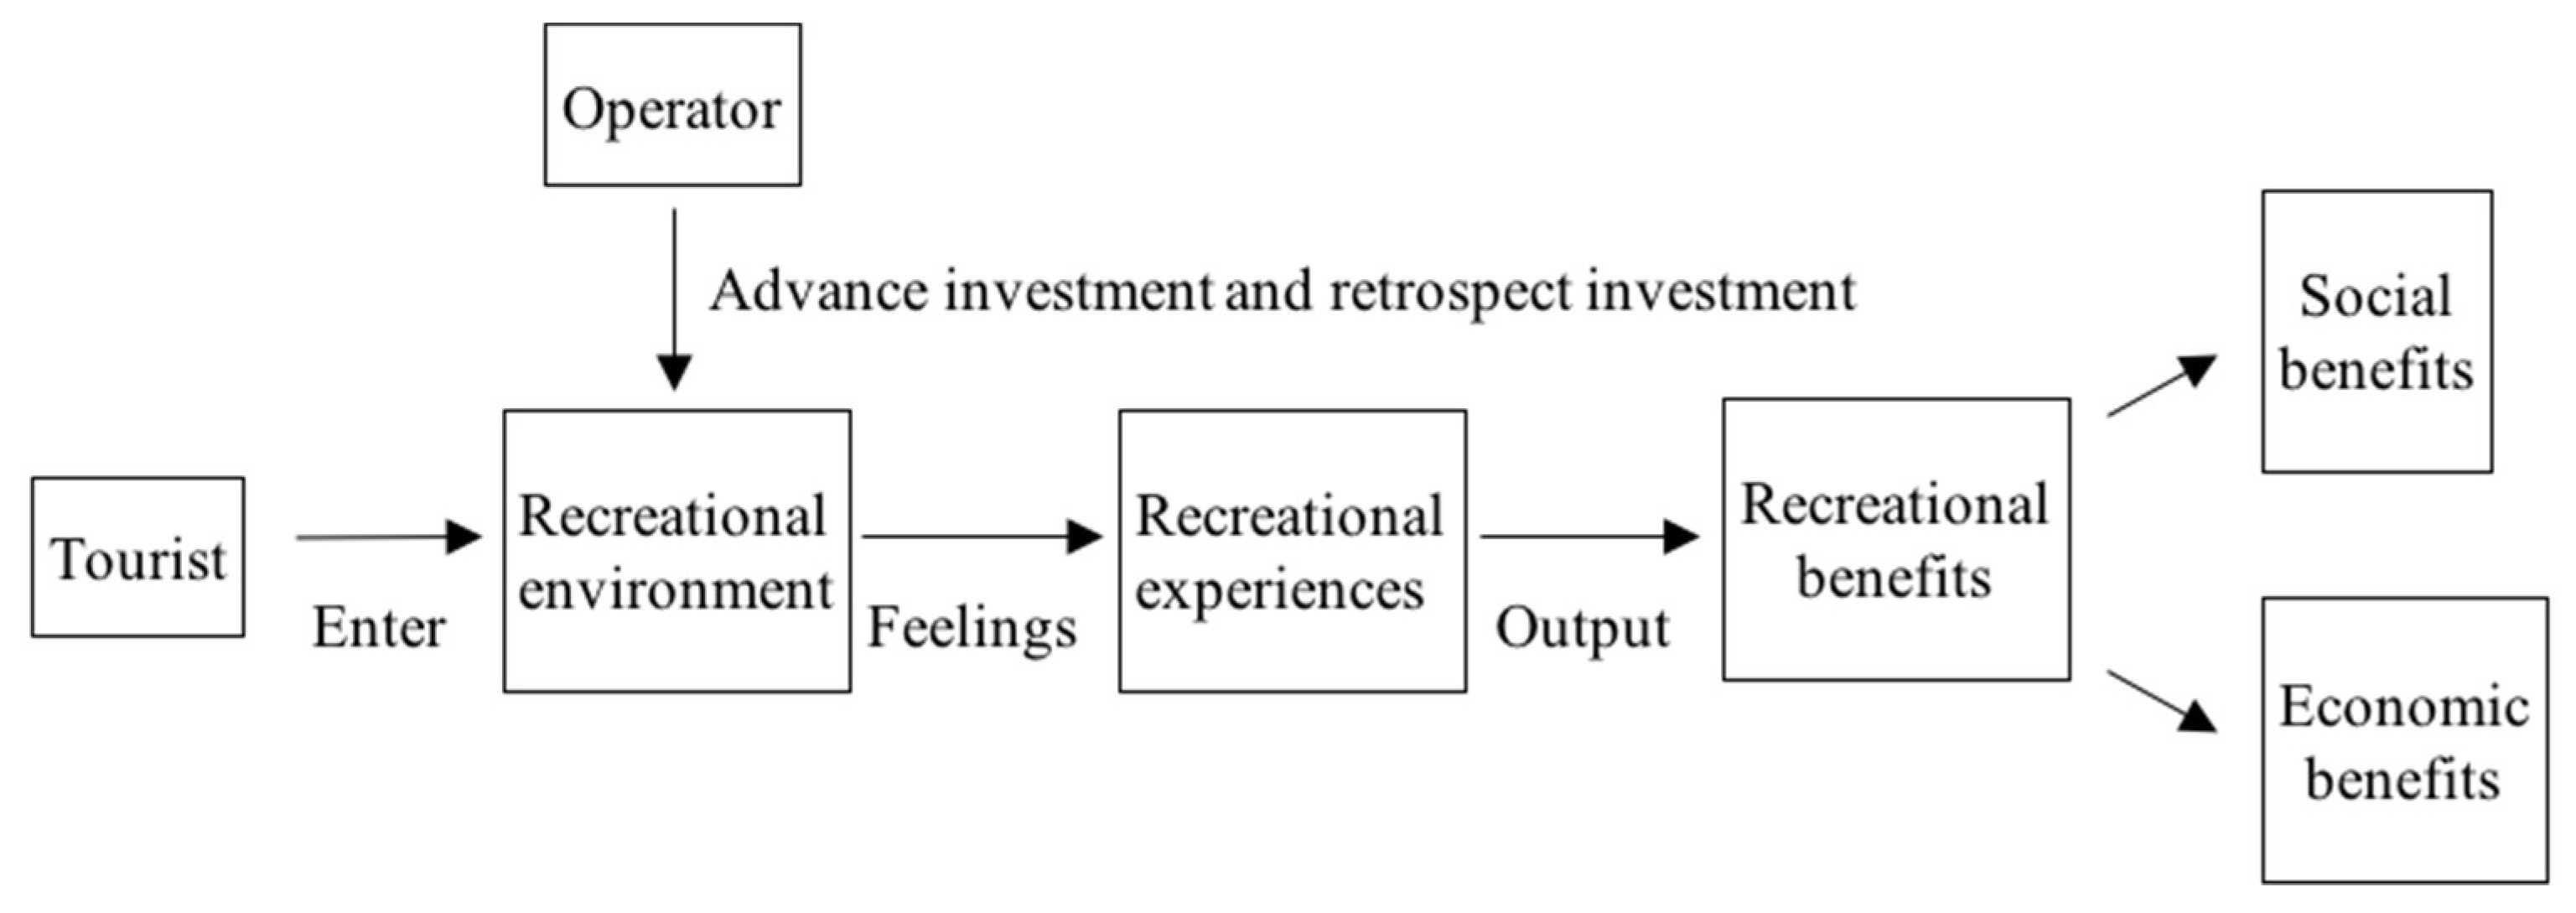
Recreation benefits refer to the benefits of satisfying certain demands, such as visual pleasure or refreshment. Recreation benefits generate social benefits and economic benefits, such as mental satisfaction and substantial income. From the standpoint of recreational experiences, the benefits stemming from the gratifying recreational experiences of a tourist going to a recreation spot and engaging in certain recreational activities can be defined as recreation benefits. The generation of recreation benefits is shown in Figure 1 [1].
Theoretically, recreation benefits are psychological benefits that derive from satisfying people’s mental or physical needs; thus, they are intangible and non-measurable. However, they can be appraised with substituted values, such as substituted expense, opportunity cost, willingness to pay, and marginal utility, by monetizing consumer behaviors in related markets. In economic theories, the benefits of nonmarket goods can be appraised using the income compensation approach or the expenditure function approach, of which the most commonly used are the CVM in the income compensation approach, and the hedonic price method and TCM in the expenditure function approach [2]. The TCM involves using tourism demand functions to calculate the CS of tourists to estimate the recreation benefits of a recreational area. The following is a more detailed literature review for the TCM.
TCM’s conceptualization can be traced to Hotelling [3], who derived recreational demand functions from the travel distances and visit rates from different “zones” for estimating recreation benefits. Clawson [4] and Knetsch [5] derived the recreational demand functions from CS, and thus established the theoretical application of the TCM. Later, McConnell [6] and Cesario and Kentsch [7] all contributed to refining the method, eventually making it widely accepted and implemented. In recent years, the TCM has seen wide application to numerous tourism-related fields in the studies of Wilman [8], Hof and Rosenthal [9], Bergstrom and Cordell [10], Freeman [11], Loomis and Walsh [12], and Enriquez-Acevedo et al. [13] to name a few. In Taiwan, the TCM has also been widely applied in the past two decades in studies on national parks, forest recreational areas, festivals, and tourist attractions. Notable examples include the studies of Huang [14], Huang [15], Lin [16], Chen [17], Huang [18], Jeng et al. [19], Liao [20], Chen and Lin [21], Lee and Chen [22], and Dong et al. [23]. According to the literature, the TCM views a tourist’s travel costs as the price for using the recreational resource, which serves as the basis for estimating the demands for the resource and in turn its economic benefits.
In the West, beaches have long been considered a valuable recreational resource, with the derived demands for 3S tourism (sand, sun, and sea) and numerous studies on the recreation benefits of beaches, such as Lew and Larson [24], Blackwell [25], Du Preez et al. [26], Rolfe and Gregg [27], Parsons et al. [28], and Zambrano-Monserrate et al. [29]. By contrast, in Taiwan, studies on the recreational use of beaches have concentrated on four major aspects: (1) Attributes, quality, and carrying capacity of a beach: notable examples are the studies on the environmental attributes of the Nanwan Recreational Area in Kenting [30], application of the CVM and Kano quality model for tourist acceptance of the beach eco-labeling certification of the beaches in Kenting [31], and field investigation of the carrying capacity of Baisha Beach in Kenting [32]; (2) Recreation behaviors on the beach: Notable examples include the studies on the tourist recreation behaviors on the coast of Nanwan Recreational Area [33], and the application of the push-pull theory on the motives of travel and beach environmental attributes [34]; (3) Beach evaluation indicators or deterioration factors: Notable examples include the studies on the deterioration of beaches in Dingliao, Yilan based on sustainable development principles [35], and the use of the fuzzy analytic hierarchy process on beach evaluation indicators [36]; and (4) Beach safety: Notable examples include the studies on beach safety management for the Baishawan, Fulong, and Greenbay Beaches on Taiwan’s northern coast [37], and the application of wave dynamics on beach safety assessment for the Fulong Beach [38]. Compared with these, studies on the recreation benefits of beaches are relatively lacking; so far, the present authors have only been able to locate a study that applies the CVM for an economic evaluation of the recreation benefits of the Waiao Beach in Yilan [39]. Therefore, the recreation benefits of other major beaches in Taiwan still await in-depth investigation.
The present study adopted the TCM to establish a tourism demand model for the Nanwan Beach, which was then used for appraising the recreation benefits. The results are expected to provide a valuable reference for the Kenting National Park.
3. Object of Study and Methodology
3.1. Object of Study
Located on a peninsula, the Kenting National Park, which features both lands-and marine-based attractions, is one of the most popular tourist destinations in Taiwan. Among its rich recreational marine resources are several well-known coastal recreational areas, the most famous of which is the Nanwan Bay. According to the Tourism Bureau (Visitors to the Principal Scenic Spots in Taiwan, 2015), Nanwan had 512,000 visitors in 2015, which was the most in Southern Taiwan. Nationwide, the number was far higher than the 357,000 visitors to the famous Fulong Beach on the northeastern coast, and second only to the 985,000 visitors to Baishawan on the northern coast of Taiwan. Geographically, Nanwan, which literally means “south bay,” is the boundary point of Taiwan’s two southernmost capes, the Eluanbi and the Maobitou. It has a beach in the cove formed between the two capes, and its old name, Da Ban Le, which means a massive sunken rock plate, also reflects this feature. The place is also known as Lanwan, or blue bay, because of the azure blue sea along its beautiful sandy beach, which extends for approximately 600 m, the longest and the most celebrated in the Kenting National Park. Today, the village of Nanwan is a busy hub for water activities, but in the past, it was a quiet little fishing village, although during the Japanese occupation era it was once used as a base for whaling ships. The Kuroshio Current flowing nearby keeps the seawater in Nanwan in a steadily warm state, which is suitable for the growth of aquatic life, particularly for corals. The high biodiversity in the intertidal zone also makes it a popular spot for snorkeling.
3.2. Methodology
3.2.1. Travel Cost Model
The concept of the TCM is that the total tourism-related costs of a consumer’s trip to a tourist destination reflect the price of recreational activities in that particular tourist destination. Generally, tourist destinations with higher travel costs have lower tourism demands, which is in accordance with the law of demand. Assuming a consumer’s recreation benefits are affected by the number of visits (q), travel cost per visit (p), and composite commodity price (Z), then, under the restriction of personal income (Y), the consumer’s utility maximization problem will be
From the utility maximization problem in Equation (1), the consumer’s tourism demand function q* for the tourist destination can be derived as,
Empirically, other than travel cost, personal socioeconomic characters can also be explanatory variables for tourism demands, hence the following regression model:
in which x1, x2,…, xn represent personal socioeconomic characters (independent variables such as gender, age, and educational background), p represents travel cost, and Y represents personal income.
In terms of value appraisal, when goods price or personal income are changed, the utility can be used as the indicator for benefit appraisal. However, because the utility cannot be readily observed, in practice it must be monetized to facilitate appraising recreation benefits with the concept of CS. Thus, once a tourist’s personal tourism demand function q is derived, integrating q will be the tourist’s CS, which is considered the economic benefits of the tourist destination.
where f(x1, x2,…, xn, p, Y) is the tourism demand function, pH the highest travel cost in all of the samples, and pL the lowest travel cost in all of the samples.
3.2.2. The Empirical Model for Tourism Demand
Because the participants for the survey were tourists in Nanwan who had visited the location more than once, the dependent variable in the tourism demand function, which is the number of visits, would be above 0, and at least equal to 1. This is in accordance with the requirement for variables in a count data model to be independent and nonnegative integers. Because the number of visits in the questionnaire survey was presented as “the number of visits to Nanwan in the past one year,” the data had a specific time frame. Other than that, because the number of visits is a nonnegative integer truncated at 0, the data were also truncated at 0. Consequently, the Truncated Poisson model (TPOIS) [19] was deemed an ideal analytic tool for this study. However, TPOIS application must satisfy the requirements that the events occurring in a certain time frame must be mutually independent, and their mean value must equal the variance to avoid the risk of overdispersion. If the data of tourists exhibit a considerable variance, negative binomial distribution (NB) can be introduced for corrections, and an estimated α can be obtained from its results; if the α is greater than 0, TPOIS estimation is overly dispersed, and a negative binomial regression model is more suitable for estimating tourist recreation benefits. Because the data of this study were truncated at 0, the truncated negative binomial distribution model (TNB) [19] would be more appropriate for its purpose. Furthermore, because tourists frequently engaging in recreational activities have a higher chance of being interviewed, endogenous stratification is a real possibility. Some researchers have proposed using the on-site Poisson model to simultaneously resolve the problems of truncated samples and endogenous stratification. The following is a more detailed description of the three count data models used in this study.
• TPOIS:
Because the dependent variable q, which represents the number of visits to Nanwan, is a nonnegative integer, the standard Poisson model for the tourism demand for Nanwan can be expressed as,
where λ is the mean and variance of q, and it can be expressed as,
where x represents the exogenous variable matrix (including personal socioeconomic characters, such as gender, age, and educational background as well as travel cost and personal income), and β represents the parameter vector corresponding to the exogenous variable. In this study, because the data were left-truncated at 0, multiplying the standard Poisson model with can eliminate the estimation error of tourists who were not on-site. The truncated Poisson model can be expressed as,
• TNB:
Because the Poisson distribution model is a distribution model of nonnegative integers, when the mean of the data does not equal the variance, overdispersion consequently occurs, which must be corrected by NB. NB can be expressed as
where γ is the Gamma distribution, and α the disturbance coefficient. The mean and variance of number of visits q have the following properties:
For data that are left-truncated at 0, the TNB can be expressed as,
• On-Site Poisson Model:
If tourists on-site at Nanwan are to be directly targeted for the survey, endogenous stratification will occur as a consequence, because those who frequent Nanwan have a higher chance of being interviewed, and neither TPOIS nor TNB can resolve this problem. For this reason, some researchers propose using the on-site Poisson model to simultaneously eliminate the problems of truncated data and endogenous stratification. If g(q) is the probability density function for the number of times a tourist visits Nanwan, the conditional probability density function can be expressed as [40],
The probability of the tourist’s jth visit, h(j), can be expressed as,
Bringing Equation (11) into Equation (12) results in the following:
From Equation (13), the tourism demand for Nanwan must be weighted by the reciprocal of the expected value of q because the sampling was conducted on-site, which entails endogenous stratification. Assuming g(q) to be the distribution of personal tourism attributes, substituting the standard Poisson model Equation (5) and the expected value E(q) = λ into Equation (13) results in the probability distribution of the on-site Poisson model as,
The tourism demand for Nanwan can be estimated through the likelihood function of Equations (7), (10), and (14), with the maximum likelihood estimation for Equation (3).
3.2.3. Research Tools
To construct the functional model for tourism demand, this study relied on a questionnaire survey for empirical analysis. The contents of the questionnaire were adapted from the one used by Chen and Lin [41], and it comprised three parts: Tourist’s demographic information, tourist’s recreational behaviors and travel expenses, and tourist’s level of satisfaction and intention of revisit.
• Tourist’s demographic information:
The demographic information included gender, age, educational background, marital status, occupation, personal monthly income, work days per month, average household monthly income, and place of residence.
• Tourist’s recreational behaviors and travel expense:
This section was designed to investigate the tourist’s actual travel experience. The question items covered the number of visits to Nanwan in the past one year, visiting Nanwan as the sole destination or one of numerous destinations in the present trip, travel time, transportation expenses, duration of stay, accommodation and food expenses, and other expenses.
• Tourist level of satisfaction and intention of revisit:
This section covered the tourist’s satisfaction over the recreation activities in Nanwan, the intention of engaging in such activities again, and the willingness of recommending the activities to others.
4. Results and Discussion
4.1. Distribution and Response of Questionnaires
The questionnaire was distributed in accordance with convenience sampling principles. It was distributed in Nanwan between April and September 2010, and of the 600 copies distributed, 23 were deemed invalid and 577 valid, representing a response rate of 96.2%. Because 122 of the valid copies claimed Nanwan to be just one of numerous destinations of the trip, the travel costs in them had to be specially weighted for accuracy. However, the proper weights were difficult to determine, for which reason this study followed the method suggested by Hanley and Spash [42] and discarded these 122 copies. Consequently, only 455 valid copies were ultimately adopted for analysis; if the Churchill formula was applied at a 95% confidence interval, the margin of sampling error could be determined to be 4.6% (please refer to the Appendix for details), satisfying the requirement for the margin to be <5%.
4.2. Demographic Composition of Tourists
Descriptive statistics were used for preliminary analysis of the tourists’ demographic data, chiefly concerning their gender, age, educational background, marital status, occupation, personal monthly income, work days per month, average household monthly income, and place of residence. The results are shown in Table 1.
Table 1 shows that of the 455 valid samples, 43.3% were male and 56.7% were female; the majority were between 21 and 30 years old (51.3%), followed by those less than 20 years old (23.4%), with the average age being 26.9 years old; 68.1% had university/junior college education and 18.7% had high school/vocational school education, indicating that the educational background of the majority of the tourists were between high school and university education (86.8%); 76.4% were unmarried and 23.63% were married; 45.4% listed their occupation as student, and another 31.7% worked in industrial or commercial services; the majority had a monthly income of less than NT$10,000 (44.2%), followed by NT$20,001–30,000 (16.8%), with the average being NT$20,544.3; the majority worked 21–25 days per month (39.3%), followed by less than 10 days (29.6), with the average being 16.8 days; the majority had an average household monthly income of NT$50,001–70,000 (22.2%), followed by NT$70,001–100,000 (19.1%), with the average being NT$63,121.3; the majority lived in Southern Taiwan (43.2%), followed by those living in Northern Taiwan (30.5%).
4.3. Tourist’s Recreational Behaviors and Travel Expense
According to Table 2, which indicates tourists’ recreational behaviors and travel expenses in Nanwan, most of the tourists were on their first visit to Nanwan (51.3%), followed by the second visit (25.1%), with the average being 1.9 and the standard deviation being 1.2; regarding travel time, the majority of tourists spent 2–4 h (44.5%), followed by 4–6 h (23.1%), with the average being 4.0 h and the standard deviation being 1.9 h, corroborating the demographic distribution that indicates that most of the tourists resided in Southern Taiwan; regarding transportation expenses, the majority of tourists spent NT$501–1000 (25.8%), followed by NT$1001–1500 (17.6%), with the average being NT$1724.6 and the standard deviation being NT$1222.1; most of the tourists stayed in the area for more than 2 days (34.0%), followed by staying for 1 day (28.1%), with the average being 18.1 h and the standard deviation being 13.9 h, indicating that most of the tourists stayed in Nanwan for more than 1 day because of its abundant recreational resources; regarding accommodation and food expenses, most of the tourists spent NT$501–1000 (20.5%), followed by >NT$3001 (19.8%), with the average being NT$2004.9 and the standard deviation being NT$1247.0; as for other expenses, most of the tourists spent NT$501–1000 (26.7%), followed by NT$1001–1500 (22.2%), with the average being NT$1613.1 and the standard deviation being NT$1193.5.
Therefore, of the travel expenses, the lowest was “other expenses” which averaged NT$1613.1; by contrast, the highest was accommodation and food expenses, which averaged NT$2004.9. This suggests that most of the tourists spend more on accommodation and food but much less on “other” expenses.
4.4. Tourist’s Level of Satisfaction and Intention of Revisit
Table 3, which shows tourist’s level of satisfaction and intention of revisit, indicates that in terms of overall satisfaction for the recreational activities in Nanwan, the majority of tourists said that they were “satisfied” (51.8%), which is followed by “neutral” (36.5%). As for the two questions concerning their intention of revisit, the one that investigated tourists’ willingness to “come back to Nanwan for beach activities again” saw a majority answer “high” (57.7%), with the second highest being the “neutral” group (23.7%); similarly, 58.9% responded that they had a “high” willingness to recommend Nanwan to friends and relatives, whereas 21.8% gave a “neutral” answer.
Both Zeithaml et al. [43] and Thorsten et al. [44] have confirmed that customer satisfaction and behavioral intentions are positively correlated. In the present study, the behavioral intentions were the “willingness to return to Nanwan for more beach activities” and “willingness to recommend Nanwan to friends and relatives,” which represent the tourists’ intention of revisit, and their intention of recommending it to others, respectively. To effectively represent the relationships between satisfaction and the two intentions, Pearson’s correlation coefficient matrix was used, the results of which are shown in Table 4. Table 4 shows that satisfaction exhibited a highly significant positive correlation with both of the intentions (both had an r of 0.638, and p ≤ 0.01). This corroborates the aforementioned studies, and it also suggests that the higher the tourist satisfaction with the recreational activities in Nanwan was, the higher were the intentions of revisit and recommendation. Furthermore, a highly significant positive correlation between the intentions of revisit and recommendation was observed (r = 0.784, p ≤ 0.01), indicating a reciprocity between them.
4.5. Empirical Model for Tourism Demands
The present study used the NLOGIT 5.0 software (Econometric Software, Inc., NY, USA) for estimation, and TPOIS, TNB, and on-site Poisson models for the tourism demand functions. The selection of independent variables was per Chen, K. L. and Lin, Y. Q. [21,41]; the independent variables were gender, age, educational background, marital status, average household monthly income, average travel cost per trip, and level of satisfaction. The reason why average household monthly income was chosen over personal monthly income was the high percentage of young tourists, as Nanwan has been a popular tourist destination for younger generations (as could be verified by the composition of tourists shown in Table 1). Although these young tourists generally do not have a high monthly income, their tourism demands should not be underestimated because most of them receive financial support from their family, hence the choice of average household monthly income to reflect this fact. In terms of travel cost, the calculated costs covered transportation costs, food and accommodation costs, other costs (e.g., entrance fee), and opportunity costs; opportunity costs were calculated by adding travel time and duration of stay and then multiplying the sum by one-third of the wage rate per the suggestion of Cesario and Kentsch [7]. Additionally, tourists with higher satisfaction were expected to generate higher tourism demands. The definitions of the aforementioned independent variables are shown in Table 5.
Table 6 shows the results of the three count data models. Because the results of the TNB suggested that α was positive, at the significance level of 5%, denying that the null hypothesis of α = 0 was not possible, which suggested no overdispersion among the data collected. For this reason, the TPOIS and the on-site Poisson models were chosen as the appropriate models for tourism demands.
The TPOIS model had the following results: The negative coefficient for gender and the 10% significance of the t value indicated that male tourists made more trips to Nanwan than female tourists, which could probably be attributed to male tourists’ greater inclination to beach activities than female tourists’. The negative coefficient for age and the 5% significance of the t value indicated that younger tourists made more trips to Nanwan than did older tourists, which could probably be attributed to younger tourists’ greater inclination to Nanwan’s renowned exciting beach activities than older tourists. The positive coefficient for Edu2 and the 5% significance of the t value indicated that tourists with a master’s or a Ph.D. degree made more trips to Nanwan than others, probably because such tourists have a higher socioeconomic status, which allows them more time and financial resources to engage in recreational activities in Nanwan. The positive coefficient for Marry and the 1% significance of the t value indicated that married tourists made more trips to Nanwan than unmarried tourists, which could probably be attributed to married tourists’ greater financial status, which enables more trips. The positive coefficient for F-Income and the 10% significance of the t value indicated that tourists with a higher average household monthly income made more trips to Nanwan than those without. The negative coefficient for travel cost P and the 1% significance of the t value indicated that when travel cost was increased, the number of trips decreased, which is in accordance with economic principles. The positive coefficient for satisfy and the 10% significance of the t value indicated that the higher the tourist satisfaction was, the greater was the increase in trips to Nanwan, which implies that if the recreational experience in Nanwan can meet tourist expectations, tourism demands increase, which is beneficial for the local economy. These results infer that male, younger, with a master’s or Ph.D. degree, married, high average household monthly income, low travel cost, and high tourist satisfaction are all factors that can increase tourism demands.
The results of the on-site Poisson model generally conform to those of the TPOIS model; their variable symbols generally match expectations and attain significance, and both models pass the goodness-to-fit test at 1% significance. It suggests that both have excellent explanatory power for tourism demands for Nanwan. However, a close examination of the significance of travel cost and socioeconomic variable coefficients reveals that part of the on-site Poisson model’s variables that have attained significance have significantly lower significance levels than the TPOIS model. This means the on-site Poisson model has a stronger explanatory power in general. Moreover, because Shaw [45] reported that the on-site Poisson model can counter the errors caused by endogenous stratification and enhance estimation effectiveness, the on-site Poisson model is deemed more appropriate for estimating tourism demands for Nanwan.
After the discussion on the tourism demand models, the next step is to estimate the price elasticity and income elasticity of tourism demands for Nanwan. The price elasticity (Ed) and income elasticity (EI) are defined as follows:
where P represents the travel cost, and q the number of visits that is an exponential demand function q = exp(β0 + β1P + β2Y), in which β0 is a constant term, β1 the coefficient for estimating travel cost, and β2 the coefficient for estimation of income. By substituting q into Equations (15) and (16), the price elasticity and income elasticity can be obtained as,
If the coefficient for travel cost (−5.46 × 10⁻⁵) in the on-site Poisson model is adopted for estimation, and the goods price is set as a tourist’s travel cost to Nanwan, the product of the coefficient multiplying the average travel cost per person is the price elasticity, which is −0.329, as shown in Table 7. It indicates that for every 1% increase in travel cost to Nanwan, a 0.329% decrease in the number of visits results. Similarly, the income elasticity, which is 0.187 as shown in Table 7, is calculated by multiplying the income coefficient by the average household monthly income. This indicates that for every 1% increase in tourist household monthly income, a 0.187% increase in the number of visits to Nanwan results. Because the income elasticity is between 0 and 1, microeconomic theories suggest that with the improved living standards and recreation cognitions, recreational activities on a beach such as Nanwan have become something akin to the necessities of life. However, the discussion does imply that any change in travel cost and household income can change the tourism demands for Nanwan.
4.6. Analysis of Recreation Benefits
In this study, recreation benefits were appraised using the TPOIS and on-site Poisson models with the aforementioned estimation results. According to Bockstael and Strand [46] and Lee, C. H. and Chen, C. C. [22], the CS of the ith interviewed tourist can be expressed as,
where P0 is the current travel cost. Thus, the compensation variation (CV) and equivalent variation (EV) of the ith interviewed tourist are: [47]
The present study used these functions to estimate the recreation benefits of Nanwan. However, because the mean of the estimated recreation benefits would be prone to the influence of extreme values, the recreational benefit of each questionnaire had to be estimated first, to identify the median and then calculate the mean value. The results were as shown in Table 8: The TPOIS model estimated the CS to be NT$21,505 per person per year, and the 95% confidence interval would be NT$19,163–23,848 per person per year; the on-site Poisson model estimated the CS to be NT$18,315 per person per year, and the 95% confidence interval would be NT$16,320–20,310 per person per year.
According to Table 8, the CS estimated by the TPOIS model was greater than that of the on-site Poisson model. Subsequently, a paired-sample t-test was conducted, and the results, as shown in Table 9, showed that the three types of recreation benefits estimated by the TPOIS model were all significantly greater than those by the on-site Poisson model. Because the on-site Poisson model can simultaneously adjust the errors caused by truncated samples and endogenous stratification, this observation indicates that without a correcting measure against endogenous stratification, recreation benefits would be overestimated, just like the estimations of the TPOIS model.
Furthermore, results of the paired-sample t-test on the three recreational benefit indicators (CS, CV, and EV) under the same model, as shown in Table 10 and Table 11, showed that at 1% significance, the CV of either the TPOIS model or on-site Poisson model was significantly greater than CS, and the CS was significantly greater than EV. That is, at 1% significance, CV > CS > EV for both models, which means significant differences between the three recreational benefit indicators exist in an identical model. According to the theories of microeconomics and cost-benefit analysis, for normal goods with a rising price, the CV will be greater than CS, and the CS will be greater than EV [48]; therefore, if the recreational resources of Nanwan are restricted or spoilt, people are willing to pay a price greater than the current travel cost for their protection or maintenance.
Following the tourist-based recreational benefit appraisal, the present study proceeded to compare the results with empirical studies in other countries, which are listed in Table 12. In Table 12, the recreation benefits of Chen and Liaw [39], which were estimated with the CVM, were categorically lower than those of the other studies, which used TCM. This corresponds with the findings of Du Preez et al. [26], who noticed in the study on King’s Beach, South Africa that the recreation benefits estimated with the CVM would be one order lower than the results of TCM. In the present study, the CS of Nanwan estimated using the on-site Poisson model was NT$18,315 per person per year, and dividing it by 1.9, which was the average number of visits, as shown in Table 2, would result in the CS of NT$9639 per person per visit (approximately US$289), relatively close to the results of Leeworthy and Wiley [49]. A closer examination at the CS of the present study would reveal that the reason it was higher was that up to 34% of the interviewed tourists stayed for more than 2 days, which would entail higher costs for foods and accommodations. Moreover, because Nanwan is at the southernmost tip of Taiwan, it also requires substantial transportation costs to reach. Both of these factors contributed to the high travel cost and indirectly caused the absolute value of coefficients for estimating travel cost to become low, which is why the CS became relatively high. Nevertheless, a comparison with the data in Table 12 suggests that the CS of the present study remains within an acceptable range.
Last, the present study also used the on-site Poisson model to assess the annual recreation benefits of the Nanwan Beach. This was calculated by multiplying the gross recreation benefits per person per visit, which is the sum of gross travel cost per person per visit (NT$6029) and the per person per visit CS (NT$9639), by the number of tourists visiting Nanwan in 2015 (512,000 people per time); the result revealed that the annual recreation benefits amounted to approximately NT$8.022 billion.
5. Conclusions and Suggestion
5.1. Conclusions
The azure waters and exquisite coastline of Nanwan attract many young people for water activities each year. Moreover, the Kuroshio also engenders a high biodiversity that makes Nanwan a popular snorkeling destination. This study applied the TCM to establish empirical models for the tourism demands, then employed the TPOIS, TNB, and on-site Poisson models to estimate the recreation benefits of Nanwan.
The results indicated that in terms of travel cost, most tourists spend more on food and accommodation, but less on other expenses; the positive correlation between customer satisfaction and behavioral intentions means that the greater tourists’ satisfaction is over Nanwan, the more positive their intentions are to revisit, which in turn causes them to revisit more frequently and become more willing to recommend Nanwan to other people. This corroborates satisfactorily with previous studies.
Of the three models, the on-site Poisson model exhibited the greatest goodness-to-fit, making it an ideal tool for the estimation of tourism demands for Nanwan. The estimation results suggested that male, younger of age, with a master’s or Ph.D. degree, married, high average household monthly income, low travel cost, and high tourist satisfaction are all factors that can increase tourism demands. The on-site Poisson model estimated the price elasticity and income elasticity for Nanwan to be −0.329 and 0.187, respectively. On the basis of these figures, the CS could be inferred to be NT$9639 per person per visit.
Regarding the recreation benefits, the three indicators (CS, CV, and EV) of the TPOIS model were all significantly greater than those of the on-site Poisson model. Moreover, under the same model, the paired-sample t-test results of the three indicators showed that for either model, the order of the indicators would be CV > CS > EV at 1% significance.
This study proceeded to compare the results with empirical studies in other studies which used CVM. We found that the recreation benefits estimated with the CVM are lower than the results from the TCM. This corresponds with the findings of other researchers. Moreover, the reason why this study has a higher CS is that 34% of the interviewed tourists stayed for more than 2 days, which would result in a higher cost in foods, accommodations, and transportations. However, a comparison with other studies shows that the CS of this study remains within a reasonable range.
When the statistics of the Tourism Bureau (Visitors to the Principal Scenic Spots in Taiwan, 2015) were incorporated into the estimation, the annual gross recreation benefits of Nanwan were NT$8.022 billion, which is substantial. This should provide a valuable reference for the management and planning policies of the Kenting National Park.
5.2. Suggestions
The present study demonstrated that different estimation models lead to different results, and the difference can be substantial. Therefore, future studies should use other estimation models and analyze their differences. Additionally, because Nanwan is a recreational area oriented toward water activities, tourism there tends to be concentrated in the summer months, which results in significant difference in seasonal output values. The authorities are therefore advised to sponsor appropriate events for shoulder and off-peak seasons to balance out tourism revenue.
Author Contributions
Formal analysis, C.-M.D.; Investigation, C.-C.L. and S.-P.L.
Funding
This research received no external funding.
Conflicts of Interest
The authors declare no conflict of interest.
References
- Chen, C.M. An Evaluation on Recreation Benefits of Northern Coast Tours in Taiwan. Master’s Thesis, National Taiwan Ocean University, Keelung, Taiwan, 2005. [Google Scholar]
- Lu, Y. Estimation of the economic benefit of environmental resources. Acad. Econ. Pap. 1990, 18, 93–129. [Google Scholar]
- Hotelling, H. Letter to the National Parks Service in Economic Studies of Outdoor Recreation; Outdoor Recreation Review Commission: Washington, DC, USA, 1947. [Google Scholar]
- Clawson, M. Methods of Measuring the Demand for and Value of Outdoor Recreation; Resources for the Future Press: Washington, DC, USA, 1959. [Google Scholar]
- Knetsch, J.L. Outdoor recreation demands and benefits. Land Econ. 1963, 39, 387–396. [Google Scholar] [CrossRef]
- McConnell, K.E. Some problems in estimating the demand for outdoor recreation. Am. J. Agric. Econ. 1975, 57, 330–334. [Google Scholar] [CrossRef]
- Cesario, F.J.; Kentsch, J.L. A recreation site demand and benefit estimation model. Reg. Stud. 1976, 10, 97–104. [Google Scholar] [CrossRef]
- Wilman, E.A. Hedonic prices and beach recreational values. Adv. Appl. Microecon. 1981, 1, 77–103. [Google Scholar]
- Hof, J.G.; Rosenthal, D.H. Valuing the opportunity cost of travel time in recreation demand models: An application to aggregate data. J. Leisure Res. 1987, 19, 174–188. [Google Scholar] [CrossRef]
- Bergstrom, J.C.; Cordell, H.K. An analysis of the demand for and value of outdoor recreation in the United States. J. Leisure Res. 1991, 23, 67–86. [Google Scholar] [CrossRef]
- Freeman, A.M. The Measurement of Environmental and Resource Values: Theory and Methods; Resources for the Future Press: Washington, DC, USA, 1993. [Google Scholar]
- Loomis, J.B.; Walsh, R.G. Recreation Economic Decisions: Comparing Benefits and Costs, 2nd ed.; Venture Publishing Inc.: State College, Philadelphia, PA, USA, 1997. [Google Scholar]
- Enriquez-Acevedo, T.; Botero, C.M.; Cantero-Rodelo, R.; Pertuz, A.; Suarez, A. Willingness to pay for Beach Ecosystem Services: The case study of three Colombian beaches. Ocean Coast. Manag. 2018, 161, 96–104. [Google Scholar] [CrossRef]
- Huang, R.S. Economic Evaluation of Recreational Benefit in Urban Park: A Case Study in Youth Park. Master’s Thesis, Chung Hsing University, Taichung, Taiwan, 1988. [Google Scholar]
- Huang, C.H. Evaluation of recreation value at Taiwan national parks. J. Bank Taiwan Q. Publ. 1989, 41, 282–303. [Google Scholar]
- Lin, S.Y. The Evaluation of Recreational Effects: A Case Study of Shei-Pa National Park. Master’s Thesis, National Chung Hsing University, Taichung, Taiwan, 1996. [Google Scholar]
- Chen, K.L. Application of Economic Valuation of Recreation Sites-An Example of Toucheng Leisure Farm. J. I-lan Inst. Technol. 1996, 12, 23–39. [Google Scholar]
- Huang, S.H. Estimation of the Recreational Economic Benefit of National Park—An Example of the Yang-Ming-Sun National Park. Master’s Thesis, National Chang Kung University, Taoyuan City, Taiwan, 1998. [Google Scholar]
- Jeng, H.Y.; Chang, W.Y.; Lin, C.T. Recreational benefits and time costs of Syh-Tsao wildlife sanctuary: An application of truncated Poisson model. J. Agric. Econ. 2000, 67, 161–178. [Google Scholar]
- Liao, H.H. Estimation of the Travel Economic Benefit of Yang-Ming-Sun National Park. Master’s Thesis, Chinese Culture University, Taipei, Taiwan, 2003. [Google Scholar]
- Chen, K.L.; Lin, Y.C. Evaluation on the recreation value of the I-Lan recreational sites. Q. J. Chin. For. 2004, 37, 293–302. [Google Scholar]
- Lee, C.H.; Chen, C.C. Evaluation of visitor travel demand and recreation benefits in the special event-a case of Yi-Lan green exposition. Agric. Econ. 2007, 39, 137–166. [Google Scholar]
- Dong, C.M.; Ho, T.P.; Hu, S.Y.; Shih, H.Y.; Huang, W.T. Estimation of the recreation benefit of Tainan first-grade historical sites. Chia Nan Ann. Bull. 2011, 37, 539–549. [Google Scholar]
- Lew, D.K.; Larson, D.M. Valuing recreation and amenities at San Diego County beaches. Coast. Manag. 2005, 33, 71–86. [Google Scholar] [CrossRef]
- Blackwell, B. The value of a recreational beach visit: An application to Mooloolaba Beach and comparisons with other outdoor recreation sites. Econ. Anal. Policy 2007, 37, 77–98. [Google Scholar] [CrossRef]
- Du Preez, M.; Lee, D.E.; Hosking, S.G. The recreational value of beaches in the Nelson Mandela Bay area, South Africa. Stud. Econ. Econ. 2011, 35, 85–102. [Google Scholar]
- Rolfe, J.; Gregg, D. Valuing beach recreation across a regional area: The Great Barrier Reef in Australia. Ocean Coast. Manag. 2012, 69, 282–290. [Google Scholar] [CrossRef]
- Zambrano-Monserrate, M.A.; Silva-Zambrano, C.A.; Ruano, M.A. The economic value of natural protected areas in Ecuador: A case of Villamil Beach National Recreation area. Ocean Coast. Manag. 2018, 157, 193–202. [Google Scholar] [CrossRef]
- Parsons, G.R.; Chen, Z.; Hidrue, M.K.; Standing, N.; Lilley, J. Valuing beach width for recreational use: Combining revealed and stated preference data. Mar. Res. Econ. 2013, 28, 221–241. [Google Scholar] [CrossRef]
- Chen, L.R. The Study on Tourist’s Demand for Setting Attributes of Shore Zone: Nan-Wan Recreational Zone in Kenting National Park as a Case Study. Master’s Thesis, Feng Chia University, Taichung, Taiwan, 1993. [Google Scholar]
- Cheng, H.W. Kenting Tourist’s Acceptance Toward the Beach Eco-Labeling Certification-Contingent Valuation Method and Kano Quality Model. Master’s Thesis, National University of Tainan, Tainan, Taiwan, 2009. [Google Scholar]
- Teng, N. Assessment of Beach Recreational Capacity: An Example of Baisha, Kenting. Master’s Thesis, National Cheng Kung University, Tainan, Taiwan, 2014. [Google Scholar]
- Chan, F.W. Tourists’ Behavior on the coastline Recreation: A Case Study of Kenting Nanwan Recreational Area. Master’s Thesis, Southern Taiwan University of Science and Technology, Tainan, Taiwan, 2009. [Google Scholar]
- Chen, Y.C. The Relationship of Travel Motivation and the Value of Setting Attributes on Beach. Master’s Thesis, Providence University, Taichung, Taiwan, 2010. [Google Scholar]
- Huang, Y.T. Selection and Operation of Beach Degradation Indicators—A Case Study of Dingliao Village, Yilan. Master’s Thesis, Institute of Geography, National Taiwan Normal University, Taipei, Taiwan, 2009. [Google Scholar]
- Bau, Y.P. Establishing Beach Evaluation Indicators by Using Fuzzy Analytic Hierarchy Process. Master’s Thesis, National Cheng Kung University, Tainan, Taiwan, 2013. [Google Scholar]
- Wu, T.M. Beach Safety Management in Taiwan. Master’s Thesis, National Taiwan University of Physical Education and Sport Department, Taipei, Taiwan, 2005. [Google Scholar]
- Xiao, R. The study of a Beach Safety Assessment. Master’s Thesis, Huang Kuang University, Taichung, Taiwan, 2013. [Google Scholar]
- Chen, W.J.; Liaw, S.C. Economic evaluation of recreational benefit in Yilan coastal area: A case study in Waiao Beach. J. Eng. Environ. 2011, 27, 19–37. [Google Scholar]
- Haab, T.C.; McConnell, K.E. Valuing Environmental and Natural Resources—The Econometrics of Non-Market Valuation; Edward Elgar Press: Cheltenham, UK, 2002. [Google Scholar]
- Chen, K.L.; Lin, Y.C. A comparison on recreational values under different recreational demand functions—An example of I-lan county. Agric. Econ. 2005, 34, 91–120. [Google Scholar]
- Hanley, N.; Spash, C.L. Cost-Benefit Analysis and the Environment; Edward Elgar Publishing Ltd.: Hampshire, UK, 1993. [Google Scholar]
- Zeithaml, V.A.; Berry, L.L.; Parasuraman, A. The behavioral consequences of service quality. J. Mark. 1996, 60, 31–46. [Google Scholar] [CrossRef]
- Thorsten, H.T.; Gwinner, K.P.; Gremler, D.D. Understanding relationship marketing outcomes: An integration of relational benefits and relationship quality. J. Serv. Res. 2002, 4, 230–247. [Google Scholar]
- Shaw, D. On-site samples, regression: Problems of non-negative integers, truncation, and endogenous stratification. J. Econ. 1988, 37, 211–223. [Google Scholar] [CrossRef]
- Bockstael, N.E.; Strand, I.E. The effect of common sources of regression error on benefit estimation. Land Econ. 1987, 63, 11–20. [Google Scholar] [CrossRef]
- Huang, J.C. Exact Welfare Measures for a Policy Ban Revisited; Working Paper, Institute of Economics, Academia Sinica: Taipei, Taiwan, 2004. [Google Scholar]
- Shaw, D.G.; Jeng, H.Y.; Wu, P.I.; Chie, Y.L.; Wen, L.C. An Analysis of the Costs and Benefits of Environmental Protection-Theory, Method, and Application; Jun Jie Academy: Taipei, Taiwan, 2002. [Google Scholar]
- Leeworthy, V.R.; Wiley, P.C. Recreational Use Value for Three Southern California Beaches; Strategic Environmental Assessments Division, Office of Ocean Resource Conservation and Assessment, National Oceanic and Atmospheric Administration: Washington, DC, USA, 1993. [Google Scholar]
- Pendleton, L.; Kildow, J.; Rote, J.W. The non-market value of beach recreation in California. Shore Beach 2006, 74, 34–44. [Google Scholar]
- Bin, O.; Landry, C.E.; Ellis, C.L.; Vogelsong, H. Some consumer surplus estimates for North Carolina beaches. Mar. Res. Econ. 2005, 20, 145–161. [Google Scholar] [CrossRef]
Figure 1.
Generation of recreation benefits.


Table 1.
Demographic distribution of the tourists.
| Segment | Subsegment | % | Mean |
|---|---|---|---|
| Gender | Male Female | 43.3 56.7 | - |
| Age (year) | <20 20–30 31–40 41–50 >50 | 23.4 51.3 17.9 6.4 1.0 | 26.9 |
| Educational background | Junior high school or below High school/vocational school University/junior college Masters/Ph.D. | 3.3 18.7 68.1 9.9 | - |
| Marital status | Unmarried Married | 76.4 23.6 | - |
| Occupation | Student Military/Teacher/Civil servant Medical or self-employed Industrial/commercial services Homemaker/retired/unemployed Agricultural/forestry/fishery/husbandry/other | 45.4 6.6 5.4 31.7 4.3 6.6 | - |
| Personal monthly income (NT$) | ≤10,000 10,001–20,000 20,001–30,000 30,001–40,000 40,001–50,000 50,001–60,000 ≥60,001 | 44.2 11.1 16.8 12.1 8.5 3.8 3.5 | 20,544.3 |
| Work days per month | <10 10–15 15–20 21–25 ≥26 | 29.6 8.3 12.1 39.3 10.7 | 16.8 |
| Average household monthly income (NT$) | ≤20,000 20,001–30,000 30,001–40,000 40,001–50,000 50,001–70,000 70,001–100,000 ≥100,001 | 5.7 13.6 12.5 11.5 22.2 19.1 15.4 | 63,121.3 |
| Place of residence | Northern Taiwan Central Taiwan Southern Taiwan Eastern Taiwan Outlying islands | 30.5 23.4 43.2 1.0 1.9 | - |
Table 2.
Tourist’s recreational behaviors and travel expense.
| Item | Answer | % | Mean | SD |
|---|---|---|---|---|
| Number of visits | 1 2 3 4 ≥5 | 51.3 25.1 11.6 1.6 10.4 | 1.9 | 1.2 |
| Travel time (h) | <2 2–4 4–6 6–8 >8 | 15.6 44.5 23.1 15.1 1.7 | 4.0 | 1.9 |
| Transportation expenses (NT$) | ≤500 501–1000 1001–1500 1501–2000 2001–3000 >3001 | 14.6 25.8 17.6 13.3 13.3 15.4 | 1724.6 | 1222.1 |
| Duration of stay | <2 h 2–4 h 4–6 h 6–8 h 1 day ≥2 days | 7.4 16.6 10.1 3.8 28.1 34.0 | 18.1 | 13.9 |
| Accommodation and food expenses (NT$) | ≤500 501–1000 1001–1500 1501–2000 2001–3000 ≥3001 | 8.0 20.4 19.6 16.3 15.9 19.8 | 2004.9 | 1247.0 |
| Other expenses (NT$) | ≤500 501–1000 1001–1500 1501–2000 2001–3000 ≥3001 | 15.6 26.7 22.2 11.3 10.2 14.0 | 1613.1 | 1193.5 |
Table 3.
Tourist’s level of satisfaction and intention of revisit.
| Item | Answer | % | Mean | SD |
|---|---|---|---|---|
| Overall satisfaction | Very satisfied Satisfied Neutral Dissatisfied Very dissatisfied | 10.1 51.8 36.5 1.4 0.2 | 3.7 | 0.7 |
| Willingness to return to Nanwan for more beach activities | Very high High Neutral Low Very low | 17.9 57.7 23.7 0.7 0.0 | 3.9 | 0.7 |
| Willingness to recommend Nanwan to friends and relatives | Very high High Neutral Low Very low | 17.9 58.9 21.8 1.2 0.2 | 3.9 | 0.7 |
Table 4.
Correlation Coefficient Matrix for tourist satisfaction and behavioral intentions.
| Item | 1 | 2 | 3 |
|---|---|---|---|
| 1. Overall satisfaction | --- | 0.638 *** | 0.638 *** |
| 2. Willingness to return to Nanwan for more beach activities | --- | 0.784 *** | |
| 3. Willingness to recommend Nanwan to friends and relatives | --- |
*** p < 0.01.
Table 5.
Definitions for the independent variables in the empirical model.
| Variable | Definition |
|---|---|
| Gender | Dummy variable for gender; 1 represents “female” and 0 represents “male” |
| Age | Age (year) |
| Eud1 | Dummy variable for educational background; 1 represents “university/junior college”, and 0 represents “others” |
| Eud2 | Dummy variable for educational background; 1 represents “Masters/Ph.D.”, and 0 represents “others” |
| Marry | Dummy variable for marital status; 1 represents “married” and 0 represents “unmarried” |
| F-Income | Average household monthly income (NT$) |
| P | Average travel cost per trip (NT$) |
| Satisfy | Level of satisfaction; 5, 4, 3, 2, and 1 represent “very satisfied”, “satisfied”, “neutral”, “dissatisfied”, and “very dissatisfied”, respectively |
Table 6.
Results of the tourism demand models.
| TPOIS | TNB | On-Site POIS | ||
|---|---|---|---|---|
| Travel cost and socioeconomic variables | Constant term | 4.23 × 10⁻¹ (1.10) | 2.95 × 10⁻¹ (0.72) | −4.90 × 10⁻² (−1.17) |
| Gender | −1.68 × 10⁻¹ (−1.80) * | −1.69 × 10⁻¹ (−1.65) * | −1.99 × 10⁻¹ (−1.96) * | |
| Age | −1.79 × 10⁻² (−2.03) ** | −1.85 × 10⁻² (−2.21) ** | −2.10 × 10⁻² (−2.20) ** | |
| Edu1 | −6.63 × 10⁻² (−0.56) | −5.47 × 10⁻² (−0.43) | −7.77 × 10⁻² (−0.61) | |
| Edu2 | 4.24 × 10⁻¹ (2.51) ** | 4.11 × 10⁻¹ (2.20) ** | 5.06 × 10⁻¹ (2.74) *** | |
| Marry | 4.03 × 10⁻¹ (2.788) *** | 4.38 × 10⁻¹ (2.69) *** | 4.75 × 10⁻¹ (3.01) *** | |
| F-Income | 2.52 × 10⁻⁶ (1.68) * | 2.72 × 10⁻⁶ (1.64) | 2.97 × 10⁻⁶ (1.82) * | |
| P | −4.65 × 10⁻⁵ (−2.69) *** | −4.70 × 10⁻⁵ (−2.80) *** | −5.46 × 10⁻⁵ (−2.92) *** | |
| Satisfy | 1.37 × 10⁻¹ (1.91) * | 1.56 × 10⁻¹ (1.89) * | 1.61 × 10⁻¹ (2.07) ** | |
| Log-likelihood | −586.10 | −581.39 | −599.93 | |
| Restricted logLikelihood | −697.13 | −586.10 | −619.47 | |
| Chi-squared | 222.06 *** | 9.43 ** | 39.08 *** | |
| 1.46 × 10⁻¹(1.31) |
* p < 0.1; ** p < 0.05; and *** p < 0.01.
Table 7.
Price elasticity and income elasticity of the variables in the on-site Poisson model.
| Item | Coefficient | Average Travel Cost Per Person (Average Household Monthly Income) | Elasticity of Demand | |
|---|---|---|---|---|
| Model | ||||
| P | −5.46 × 10⁻⁵ | 6029 | −0.329 | |
| F-Income | 2.97 × 10⁻⁶ | 63,121 | 0.187 | |
Table 8.
Estimated recreation benefits of Nanwan.
| Model | TPOIS | On-Site POIS | |
|---|---|---|---|
| Indicator | |||
| CS (NT$/person/year) | 21,505 | 18,315 | |
| 95% confidence interval (NT$/person/year) | (19,163~23,848) | (16,320~20,310) | |
| CV (NT$/person/year) | 22,110 | 18,832 | |
| 95% confidence interval (NT$/person/year) | (19,344~24,877) | (16,474~21,190) | |
| EV (NT$/person/year) | 20,943 | 17,834 | |
| 95% confidence interval (NT$/person/year) | (18,896~22,990) | (16,092~19,577) | |
Table 9.
Results of paired-sample t-test for the two models.
| Paired Samples | Mean | SD | t |
|---|---|---|---|
| CS (TPOIS—On-Site POIS) | 6016.10 | 3782.17 | 33.93 *** |
| CV (TPOIS—On-Site POIS) | 6496.51 | 4448.52 | 31.15 *** |
| EV (TPOIS—On-Site POIS) | 5640.60 | 3313.82 | 36.31 *** |
*** p < 0.01.
Table 10.
Results of paired-sample t-test for the truncated Poisson model (TPOIS) model.
| Paired Samples | Mean | SD | t |
|---|---|---|---|
| CS—CV | −3320.62 | 4754.29 | −14.90 *** |
| CS—EV | 2580.65 | 3295.16 | 16.71 *** |
| CV—EV | 5901.27 | 8045.71 | 15.65 *** |
*** p < 0.01.
Table 11.
Results of paired-sample t-test for the on-site Poisson model.
| Paired Samples | Mean | SD | t |
|---|---|---|---|
| CS—CV | −2840.21 | 4067.61 | −14.89 *** |
| CS—EV | 2205.15 | 2815.23 | 16.71 *** |
| CV—EV | 5045.36 | 6879.62 | 15.64 *** |
*** p < 0.01.
Table 12.
Empirical studies on beaches in Taiwan and other countries.
| Researchers | Object of Study | CS | Willingness to Pay | Estimation Method |
|---|---|---|---|---|
| Leeworthy & Wiley [49] | Beaches in California, United States | 12.16–217.64 US$/person/visit (Pendleton et al. [50] changed the base year price of this study to that of 2005) | --- | TCM |
| Bin et al. [51] | Beaches in North Carolina, United States | 11–80 US$/person/visit (base-year price of 2003) | --- | TCM |
| Lew & Larson [24] | Beaches in San Diego, United States | 28.27 US$/person/visit (base-year price of 2001) | --- | TCM |
| Blackwell [25] | Beaches in Queensland, Australia | 119.95 AU$/person/visit (base-year price of 2000) | --- | TCM |
| Chen, W. J. and Liaw, S. C. [39] | Waiao Beach, Taiwan | --- | 552.97 NT$/person/visit | CVM |
Note: NT$1 = US$0.03 = AU$0.042 (2 March 2016)
© 2018 by the authors. Licensee MDPI, Basel, Switzerland. This article is an open access article distributed under the terms and conditions of the Creative Commons Attribution (CC BY) license (http://creativecommons.org/licenses/by/4.0/).
Share and Cite
MDPI and ACS Style
Dong, C.-M.; Lin, C.-C.; Lin, S.-P. Study on the Appraisal of Tourism Demands and Recreation Benefits for Nanwan Beach, Kenting, Taiwan. Environments 2018, 5, 97. https://0-doi-org.brum.beds.ac.uk/10.3390/environments5090097
AMA Style
Dong C-M, Lin C-C, Lin S-P. Study on the Appraisal of Tourism Demands and Recreation Benefits for Nanwan Beach, Kenting, Taiwan. Environments. 2018; 5(9):97. https://0-doi-org.brum.beds.ac.uk/10.3390/environments5090097
Chicago/Turabian StyleDong, Chih-Ming, Chien-Chi Lin, and Shu-Ping Lin. 2018. "Study on the Appraisal of Tourism Demands and Recreation Benefits for Nanwan Beach, Kenting, Taiwan" Environments 5, no. 9: 97. https://0-doi-org.brum.beds.ac.uk/10.3390/environments5090097
Note that from the first issue of 2016, this journal uses article numbers instead of page numbers. See further details here.