Article

Application of Gas-Permeable Membranes For-Semi-Continuous Ammonia Recovery from Swine Manure

by
Berta Riaño
1,*,
Beatriz Molinuevo-Salces
1,
Matías B. Vanotti
2 and
María Cruz García-González
1
1
Agricultural Technological Institute of Castilla y Léon. Ctra. Burgos, km. 119, 47071 Valladolid, Spain
2
United States Department of Agriculture, Agricultural Research Service, Coastal Plains Soil, Water and Plant Research Center, 2611, W. Lucas St., Florence, SC 29501, USA
*
Author to whom correspondence should be addressed.
Submission received: 30 January 2019 / Revised: 1 March 2019 / Accepted: 3 March 2019 / Published: 6 March 2019

Abstract

:
Gas-permeable membrane technology is a new strategy to minimize ammonia losses from manure, reducing pollution and recovering N in the form of an ammonium salt fertilizer. In this work, a new operational configuration to recover N using the gas-permeable membrane technology from swine manure was tested in a semi-continuous mode. It treated swine manure with a total ammonia nitrogen (TAN) concentration of 3451 mg L−1. The system was operated with low aeration rate (to raise pH), and with hydraulic retention times (HRT) of seven days (Period I) and five days (Period II) that provided total ammonia nitrogen loading rate (ALR) treatments of 491 and 696 mg TAN per L of reactor per day, respectively. Results showed a uniform TAN recovery rate of 27 g per m2 of membrane surface per day regardless of the ALR applied and the manure TAN concentration in the reactor. TAN removal reached 79% for Period I and 56% for Period II, with 90% of recovery by the membrane in both periods. Water capture in the acidic solution was also uniform during the experimental period. An increase in temperature of 3 °C of the acidic solution relative to the wastewater reduced 34% the osmotic distillation and water dilution of the product. These results suggested that the gas-permeable membrane technology operating in a semi-continuous mode has a great potential for TAN recovery from manure.

Graphical Abstract

1. Introduction

Ammonia (NH3) is a cause of air pollution and can potentially contribute to acidification and eutrophication, both of which can damage sensitive vegetation, biodiversity, water quality and human health [1,2,3]. The agricultural sector was the responsible for 93% of NH3 emissions in the European Union (EU) in 2013, resulting in 3.6 million tons. NH3 volatilization from livestock wastes accounted for almost 64% of the agricultural NH3 emissions [2]. Significant efforts are required to abate NH3 emissions from agricultural sources, mainly those coming from livestock wastes [4]. On the other hand, current practices used for production of nitrogen (N) fertilizers via the Haber–Bosch process are cost and energy intensive and contribute to global warming [5,6]. There is a renewed interest in recent years to recover nutrients from waste streams due to a combination of economic, environmental, and energy considerations [7,8].
Different technologies have been investigated for capture and recovery of NH3 emissions from livestock wastes. These technologies include: reverse osmosis using high pressure and hydrophilic membranes [9], ammonia stripping using stripping towers and acid absorption [10], zeolite adsorption through ion exchange [11], struvite precipitation through co-precipitation with phosphate and magnesium [12], and, more recently, gas-permeable membrane technology [13]. Traditional processes present some limitations: (1) reverse osmosis requires high pressure; (2) air stripping towers and zeolite adsorption techniques need pre-treatment of manure; and (3) struvite precipitation requires the addition of Mg2+and PO43+ to balance the stoichiometry of struvite precipitation [14]. The technology based on gas-permeable membranes presents several advantages over traditional processes such as (1) low energy consumption (0.18 kWh kg NH3−1), (2) it is carried out at low pressure, (3) it does not require pre-treatment of wastewater, and (4) it does not need addition of any alkali reagent [15,16,17].
The most important phenomenon related to gas-permeable membranes is the mass transfer driven by the difference in NH3 gas concentration between both sides of the microporous, hydrophobic membrane [14,18]. More specifically, NH3 contained in the livestock wastes passes through the membrane, being captured and concentrated in an acidic stripping solution on the other side of the membrane. The efficiency of the gas-permeable membrane is directly related to the availability of NH3 in the waste, where the total ammonia nitrogen species (TAN) NH3 and NH4+, are in equilibrium [19,20,21]. This equilibrium depends on the pH and temperature of the livestock waste, having the pH a greater influence [15,21]. Alkaline pH causes dissociation of NH4+ and forms free NH3 that can cross the membrane and be captured by the acidic solution.
The gas-permeable membrane technology has been successfully applied to recover up to 99% of TAN from swine manure and anaerobically digested swine manure [5,14,21,22,23]. Previous research mainly focused on the influence of operational conditions such as animal waste strength and pH on TAN recovery using gas-permeable membranes always operated at batch mode. However, there is no experience operating this type of system in a semi-continuous mode. Thus, gathering more experience and experimental data on the use of gas-permeable membranes with new configurations for recovering TAN from livestock wastes is of major importance towards the development and demonstration of this technology.
The objective of this study was to determine TAN recovery from swine manure using a gas-permeable membrane system operating at semi-continuous mode. The semi-continuous gas-permeable system was tested with decreasing hydraulic retention times (HRT) from seven to five days and increasing total ammonia nitrogen loading rates (ALR) in the range of 38.5 and 54.6 g TAN per m2 of membrane surface per day. The system was monitored in terms of removal and recovery of TAN as well as in changes of organic matter and solids in the swine manure during operation.

2. Materials and Methods

2.1. Origin of Manure

Swine manure was collected from a farm located in Narros de Cuellar (Segovia, Spain). The manure was a centrate collected after on-farm centrifugation. The mean concentrations for centrifuged manure were pH of 7.6 ± 0.2, 33.3 ± 3.5 g total solids (TS) L−1, 23.5 ± 3.2 g volatile solids (VS) L−1, 67.1 ± 10.1 g total chemical oxygen demand (CODt) L−1, 3451 ± 132 mg TAN L−1, 253 ± 59 mg total phosphorous (TP) L−1 and 3119 ± 4 mg potassium L−1. The liquid centrifuged manure was collected in plastic containers, transported in coolers to the laboratory and subsequently stored at 4 °C for further use.

2.2. Semi-Continuous Recovery of Ammonia from Manure

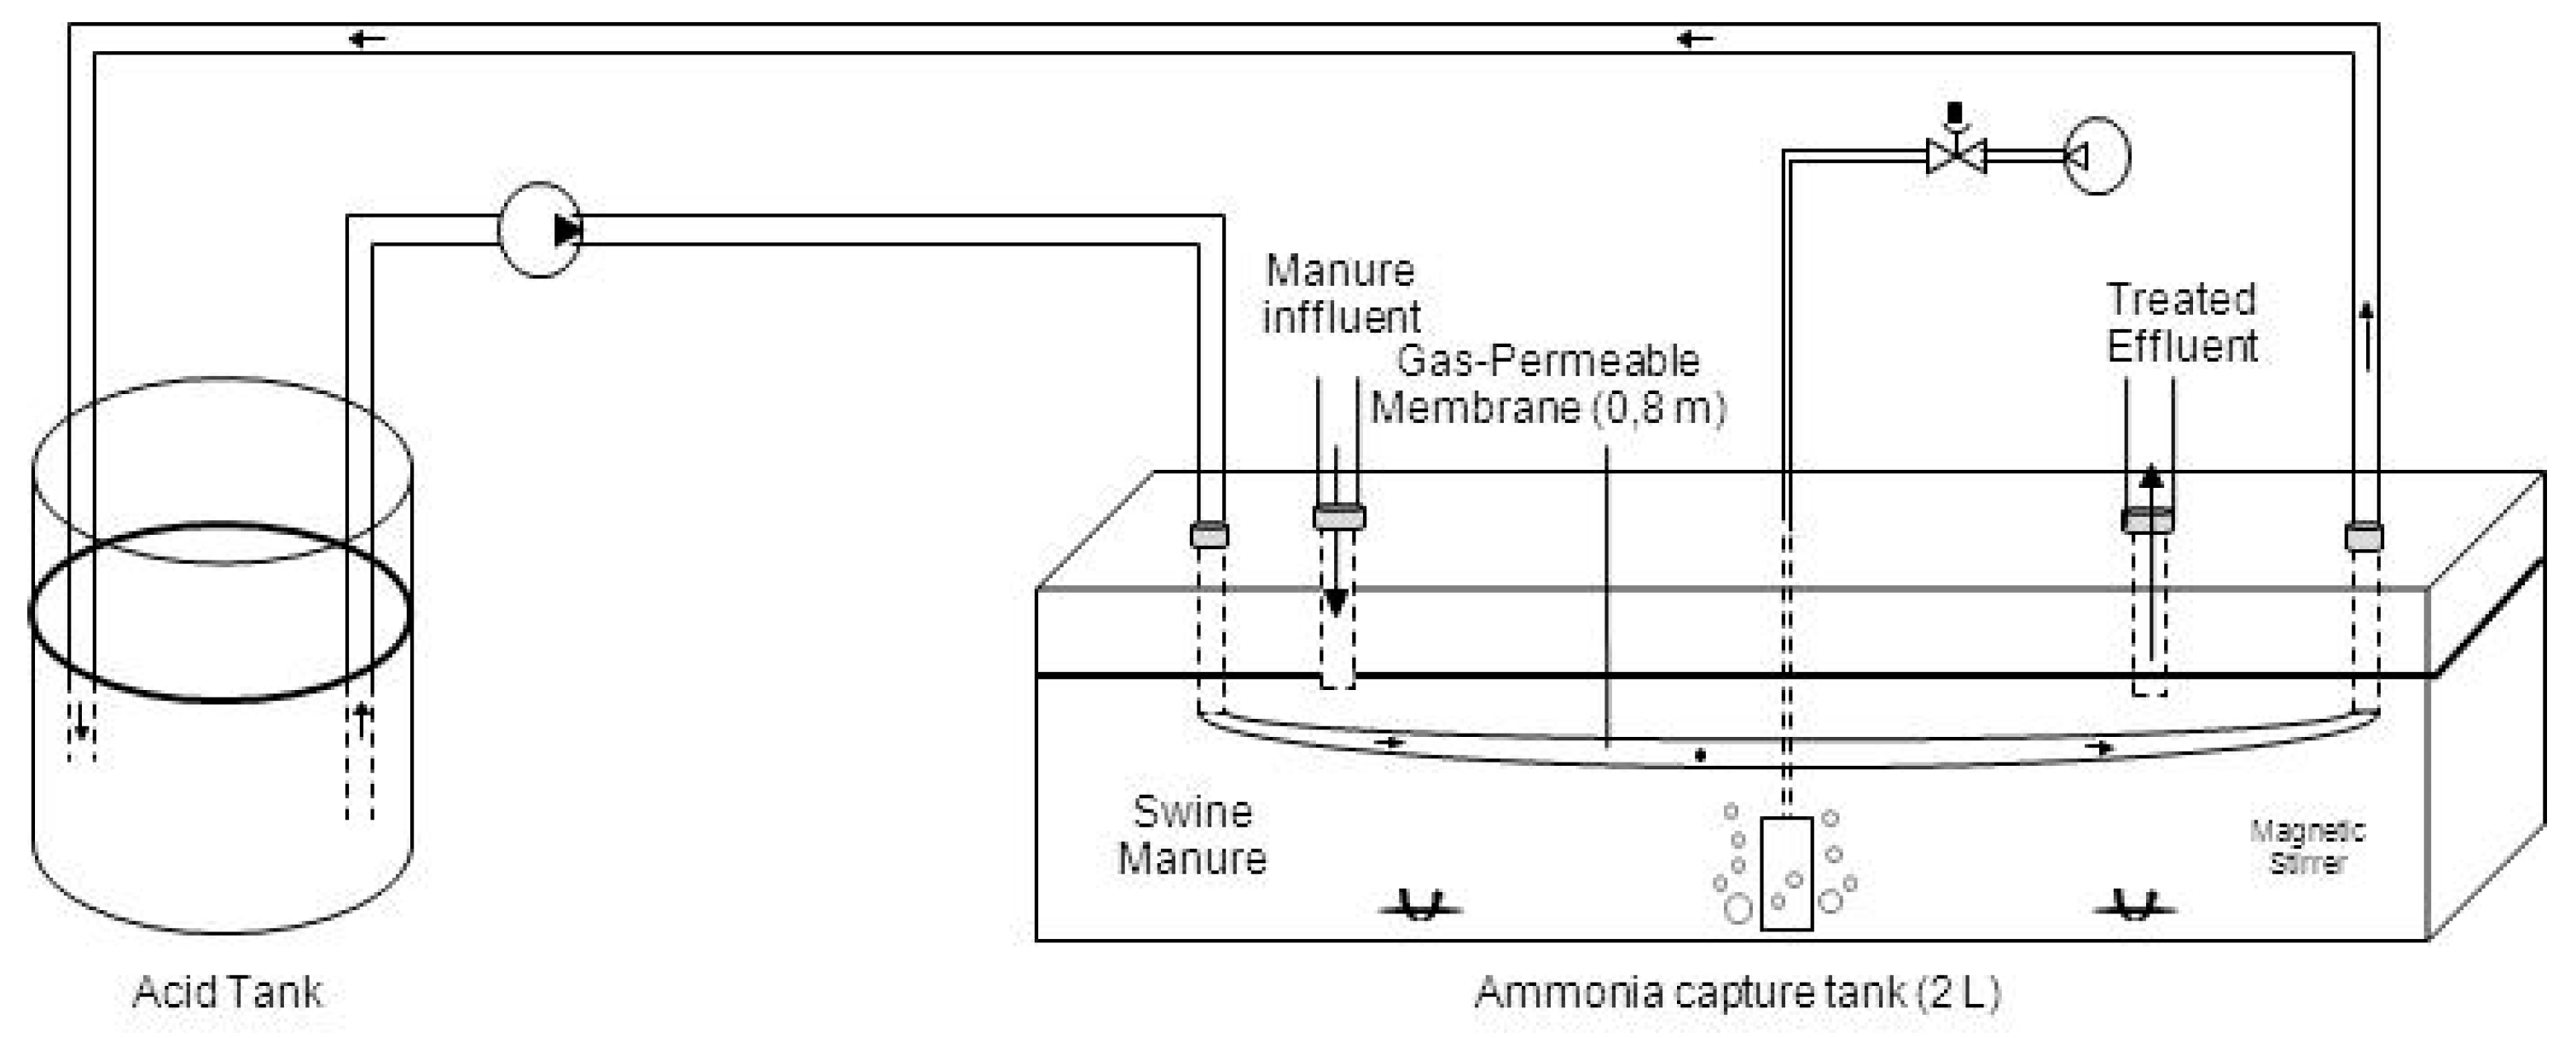
2.2.1. Experimental Set-Up

The experimental set-up consisted of a reactor with a total working volume of 2 L of fresh centrifuged swine manure (30 cm long, 20 cm wide, 4 cm high) (Figure 1). The acid tank used to concentrate TAN consisted of a 500 mL Erlenmeyer flask containing an acidic solution (300 mL of 1 N H2SO4) which was replaced by a bigger flask. This was due to the increase of the volume of the acidic solution with time as a consequence of the occurrence of osmotic distillation (OD). This acidic solution was continuously recirculated using a peristaltic pump (Pumpdrive 5001, Heidolph, Schwabach, Germany) at 11 L d−1 through a tubular gas-permeable membrane submerged in the reactor. The tubular membrane was made of expanded polytetrafluoroethylene (e-PTFE) material (Zeus Industrial Products Inc., Orangeburg, SC, USA). Membrane specifications are provided in Table 1. The ratio of the e-PTFE membrane length per effective reactor volume was 0.4 m L−1 and the ratio of the e-PTFE membrane area per reactor volume was 0.013 m2 L−1. The tubular membrane was placed in a bended horizontal configuration and held submerged by plastic connections. Low-rate aeration was used to naturally increased manure pH without chemicals according to previous work [15]. Air was supplied using an aquarium air pump (Hailea, Aco-2201) from the bottom of the reactor through a porous stone. The airflow rate was controlled at 0.24 L-air L manure−1 min−1 using an airflow meter (Aalborg, Orangeburg, NY, USA). The lid of the reactors was not sealed, having one open port that allowed air to escape. In order to ensure nitrification inhibition, a nitrification inhibitor (allythiourea) was added to the manure at a concentration of 10 mg L−1. The manure was continuously agitated using magnetic stirrers.
The volume of the reactor was checked daily and any water lost was replenished. The reactor was manually fed in semi-continuous mode five times per week: from Monday to Thursday with a load equivalent to one day each day, and Fridays with a load equivalent to three days. Prior to each feeding event, a volume equal to the feeding volume was removed from the reactor. The reactor was fed at an hydraulic retention time (HRT) of 7 d (total 2.0 L per week) during Period I (1–30 d) and at a HRT of 5 d (total 2.8 L per week) during Period II (31–50 d), corresponding to total ammonia nitrogen loading rates (ALR) of 491 and 696 mg TAN per L of the reactor per day (i.e., 38.5 and 54.6 g TAN per m2 of membrane surface per day, respectively). As TAN was depleted from manure and transferred to the acid tank, the pH of the acidic solution increased. A protocol was established: concentrated H2SO4 (96–98%, Panreac) was added to the acidic solution to an endpoint of pH < 1 whenever the pH of the acidic solution increased up to 2. The experiment was performed at a temperature of 22.0 ± 1.7 °C in duplicate reactors and the results were expressed as means and standard deviations.

2.2.2. Manure and Acidic Solution Sampling

Samples of 50 mL were daily taken from the influent and from the effluent of the reactor. pH and TAN concentration were determined daily in both the influent and the effluent of the reactor. For each experimental day, TAN removal efficiency was calculated using Equation (1):
TAN removal efficiency (%) = 100 × (TANin − TANeff)/TANeff
where TANin is influent TAN concentration and TANeff is TAN concentration in the effluent for each experimental day.
Total alkalinity in influent and effluent was also determined twice a week, and analyses of total Kjeldahl nitrogen (TKN), TS, VS, and CODt were performed on samples collected once a week. Acidic solution samples of 6 mL from the acid tank were also collected daily to monitor pH and TAN. The acidic solution was analyzed at the end of the experiment for conductivity, CODt, total volatile fatty acids (TVFA), TP, sulfur, potassium, magnesium, calcium, zinc, copper, and iron.

2.3. Effect of Differential Heating on Osmotic Distillation

Two assays were performed in order to evaluate the effect of differential heating of the acidic solution on osmotic distillation, which is the passage of water vapor through the gas-permeable membrane from the wastewater into the acid trap. In the first assay (control assay) the acidic solution was not heated. The measured temperature of the acidic solution was 23.2 ± 0.5 °C and that of the wastewater in the reactor was 24.3 ± 0.8 °C. In the second assay, the temperature of the acidic solution (30.0 ± 0.8 °C) was kept at 3 °C above the temperature of the reactor (26.9 ± 0.8 °C) using a heated water bath.
For these assays, the experimental set-up consisted of a reactor with a total working volume of 0.7 L (diameter 20 cm, height 3 cm). In this case, a synthetic solution having a balanced TAN to alkalinity ratio > 4.1 [24] was used to simulate swine manure, consisting of NH4Cl at a concentration of 3.47 ± 0.07 g TAN L−1 and NaHCO3 at a concentration of 15.6 ± 0.2 g CaCO3 L−1. In order to ensure nitrification inhibition, a nitrification inhibitor (allythiourea) was added at a concentration of 10 mg L−1. Average pH of this synthetic solution was 8.3 ± 0.3. The tank used to concentrate TAN in each reactor consisted of a 500 mL Erlenmeyer flask initially containing 90 mL of 1 N H2SO4. This stripping solution was continuously recirculated using a peristaltic pump (Pumpdrive 5001, Heidolph, Schwabach, Germany) through a tubular gas-permeable membrane submerged in the reactors at a flow rate of 12 L d−1. The tubular membrane was made of e-PTFE material (Zeus Industrial Products Inc., Orangeburg, SC, USA) and their characteristics are provided in Table 1. The ratio of the tubular membrane length per synthetic wastewater volume was 0.8 m L−1 and the ratio of the membrane area per volume of synthetic wastewater was 0.013 m2 L−1. Reactors were fed at a HRT of 7 d during a period of 7 d each assay. The evaluation of the performance of the system and the sampling method was identical to those described in Section 2.2.1 and Section 2.2.2, respectively. Each assay was conducted in duplicate.

2.4. Analytical Methods and Statistical Analysis

Total alkalinity and pH were monitored using a pH meter Crison Basic 20 (Crison Instruments S.A., Barcelona, Spain). Total alkalinity was determined by measuring the amount of standard sulfuric acid needed to bring the sample to pH of 4.5. Analyses of TS, VS, CODt, TAN, and TP were performed in accordance with Standard Methods [25], according to methods 2540 B for VS, 5220-D for CODt, 4500-NH3 E for TAN and 4500-P C for TP.
Conductivity was measured using a conductimeter Crison 524 (Crison Instruments S.A., Barcelona, Spain). Magnesium, calcium, zinc, copper, and iron were analyzed using an atomic absorption spectrometer (AA 240 FS, Varian). Potassium was analyzed using an atomic emission spectrometer (AA 240 FS, Varian). These compounds were analysed following the methods described by USEPA [26]: for magnesium EPA method 215.1, for calcium EPA method 242.1; for zinc EPA method 289.1, for iron EPA method 236.1 and for potassium EPA 258.1. Sulfur was measured by combustion and infrared detection (LECO CNS 2000). The concentration of TVFA (i.e., sum of acetic, propionic, butyric, iso-butyric, valeric, iso-valeric, hexanoic and heptanoic acids) was determined using a gas chromatograph (Agilent 7890A) equipped with a Teknokroma TRB-FFAP column of 30 m length and 0.25 mm i.d. followed by a flame ionization detector (FID). The carrier gas was helium (1 mL min−1). The temperature of the detector and the injector was 280 °C. The temperature of the oven was set at 100 °C for 4 min, then increased to 150 °C for 2 min and thereafter increased to 210 °C.
Free ammonia (FA) was quantified according to Hansen et al. [27] (Equation (2)):
[NH3]/[TAN] = (1 + (10−pH/10−(0.09018 + 2729.92/T)))−1
where NH3 was the FA content, T was the manure reactor temperature, and pH was measured in the effluent.
The mass transfer coefficient (Km; m d−1) has been calculated using Equation (3) [18]:
J= Km (C1 − C2)
where J is the TAN mass flux per area (g m−2 d−1), and C1 and C2 are the concentrations of free ammonia. The Km coefficient depends on several factors, including the flow rate of the acidic solution and membrane characteristics such as porosity or thickness [18].
Results obtained were analysed using one-way analysis of variance (ANOVA) with significance at p < 0.05.

3. Results and Discussion

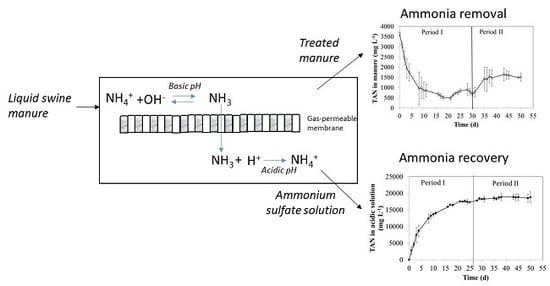
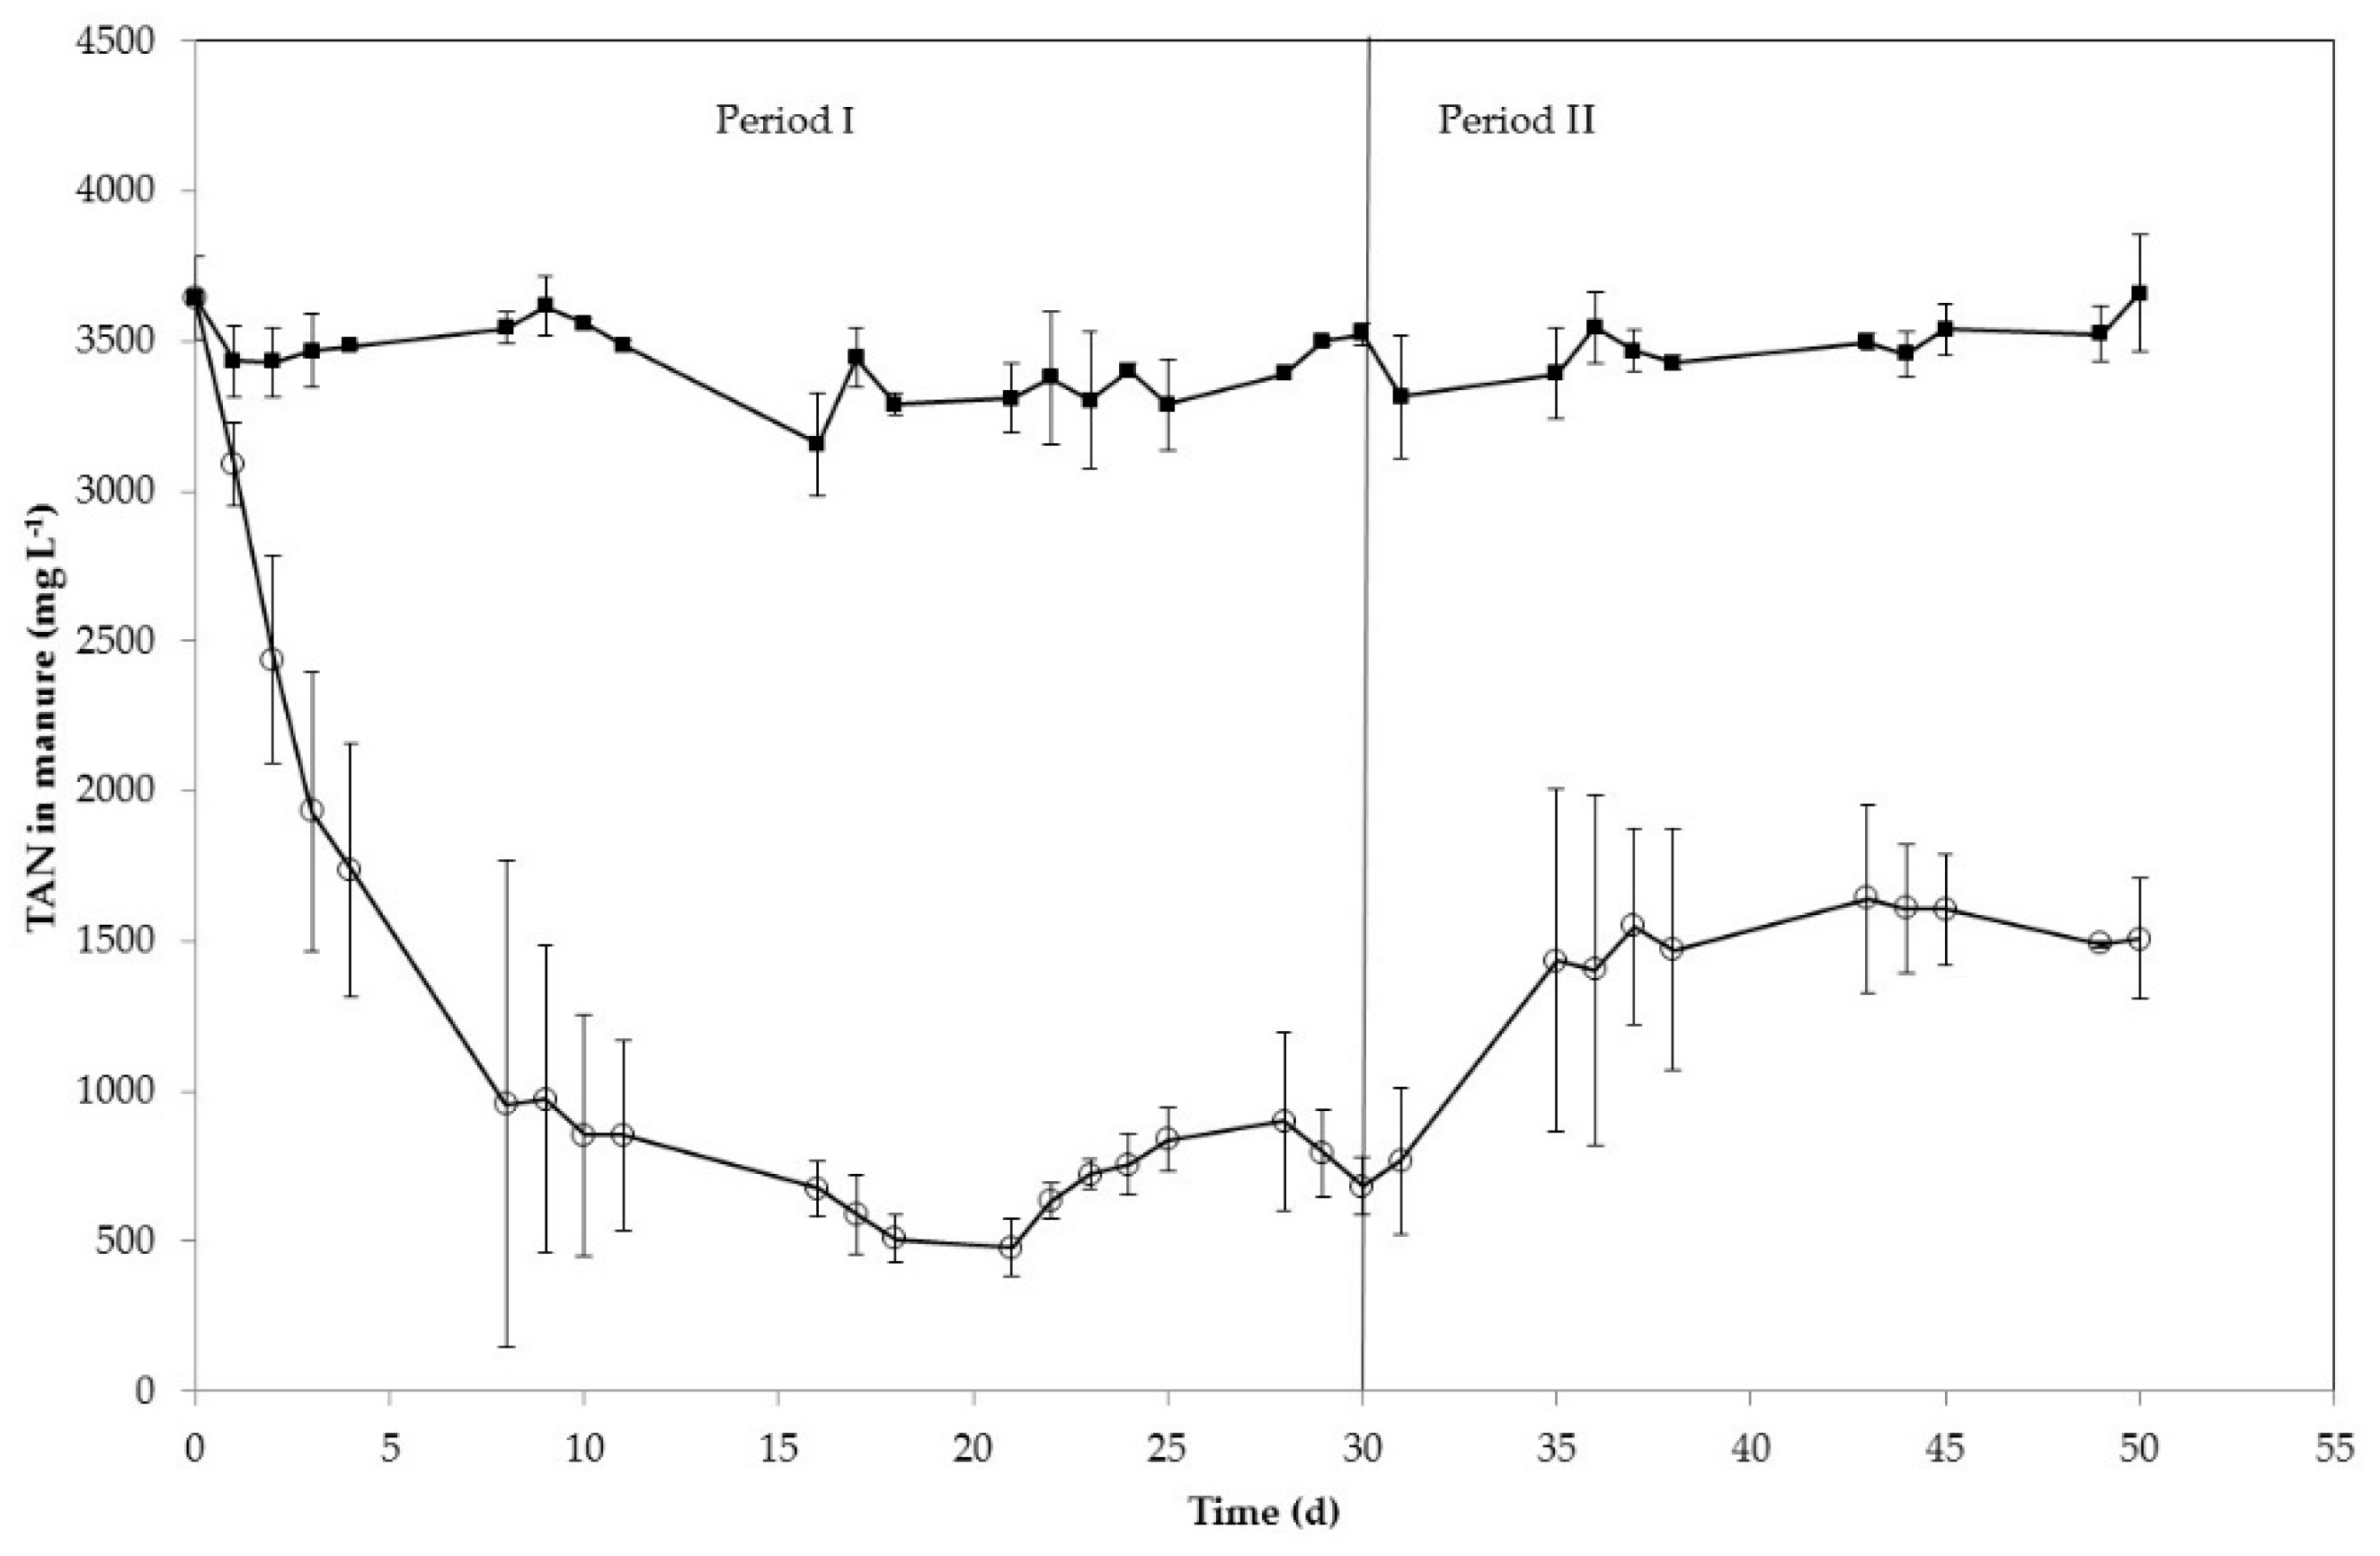
3.1. TAN Removal and Recovery by the Gas-Permeable System in Semi-Continuous Mode: Effect of Total Ammonia Nitrogen Loading Rate

In this study, the TAN removal from centrifuged swine manure was evaluated using a gas-permeable membrane with low-rate aeration at semi-continuous mode. The semi-continuous system was evaluated with two different ALRs: 491 mg TAN L−1 d−1 for Period I (1–30 d) and 696 mg TAN L−1 d−1 for Period II (31–50 d). Corresponding HRTs were 7 d during Period I and 5 d during Period II. As shown in Figure 2, TAN concentration in the manure effluent decreased steadily from 3646 mg L−1 to 611 mg L−1 in the first 16 days. After this day, TAN concentration remained approximately constant (average value of 690 ± 139 mg L−1). When ALR was increased in Period II, TAN concentration in the effluent significantly (p < 0.05) increased up to a constant concentration of about 1500 mg L−1. Free ammonia concentration during the process inside the reactor (calculated according to Equation (2)) also varied between periods with average values of 195 ± 61 mg L−1 for Period I and 328 ± 56 mg L−1 for Period II. As an average, TAN removal was 79 ± 5% for Period I (days 10–30) and 56 ± 7% for Period II (days 35–50). However, the rate of TAN mass removal (mg TAN per day) from manure was the same during the whole experimentation time regardless of the ALR applied, as it can be seen from the uniform linear trend (R2 = 0.9962) of the mass TAN removal vs. time data presented in Figure 3 that fits well both periods. No significant differences (p = 0.41) were found among TAN removal rates of the two periods. The slope present in Figure 3 leads to a TAN removal rate of 387 mg L−1 d−1.
The results displayed the same trend for TAN recovery in the acidic solution (Figure 3). A linear (R2 = 0.9976) TAN recovery rate by the gas-permeable membrane with a mass recovery rate of 347 mg L−1 d−1 (27.1 g m−2 d−1), and an average TAN recovery efficiency of 90%, were evidenced during the whole experimentation time regardless of ALR and TAN content in reactor (Figure 3). No significant differences (p = 0.71) in TAN recovery rates was observed between both periods. The mass transfer coefficient (km) was calculated according to Equation (3), resulting in an average value of 1.5 × 10⁻⁶ m s−1. This value was in the range of that reported by Samani-Majd et al. [18] for an e-PTFE membrane system operating at different pH values. The loss of TAN by the system (mass difference between TAN removal and TAN recovery) was 10% of TAN removal and could be due to volatilized N loss as the system was not closed. A nitrogen mass balance was carried out and no organic nitrogen degradation was evidenced (Table 2), thus an increase of initial TAN concentration did not occur due to biological activity.
Although the TAN concentration in the reactors varied significantly between periods, the TAN mass recovery rate was constant. This is surprising because previous research in batch systems indicated a marked effect of TAN concentration on the mass N recovery rate by the gas-permeable membrane system [14]. Table 3 shows a comparison of recovery efficiencies obtained by other authors operating gas-permeable membranes systems in batch mode and the results of this study operating in semi-continuous mode. Operating at batch mode, Vanotti et al. [28] treated anaerobically digested swine wastewater containing 2350 mg TAN L−1 using submerged membranes plus low-rate aeration to recover NH3. TAN reduction obtained at five to six days was higher than 93%. Dube et al. [5] studied the effect of aeration on pH increased when treating digested effluents from covered anaerobic swine lagoons with different TAN concentrations. The pH of digested effluents with aeration increased to 9.2, achieving TAN recovery efficiencies of 96–98% in five days of batch operation. In that study, the recovery of TAN was five times faster with aeration compared with treatment without aeration. García-González et al. [15] also tested in batch mode operation the application of low-rate aeration as an alternative to the use of alkali to recover NH3 from raw swine manure with 2390 mg TAN L−1. Under these conditions, the manure pH increased above 8.5 with 99% TAN recovery efficiency. Table 3 shows the comparison between these studies and the present study all based on the average TAN recovery rate per membrane area (in g of TAN m−2 membrane d−1). The average TAN recovery in the semi-continuous system accounted for 27.1 g m−2 d−1 that was in the range (22.7–30.7 g m−2 d−1) of recoveries obtained in batch studies with similar treatment time (Table 3). This good performance in semi-continuous mode was obtained with a process pH of 8.46 that was about one unit lower than the pH obtained with aeration using batch mode (up to 9.5) (Table 3). pH was the most critical variable determining the amount of free NH3 available to pass through the gas-permeable membrane [14]. In batch mode, ammonia capture efficiency decreased as TAN concentration was depleted from the reactors [14]. However, in semi-continuous mode the daily supply of TAN maintained a consistently high TAN recovery rate in spite of the lower pH process.

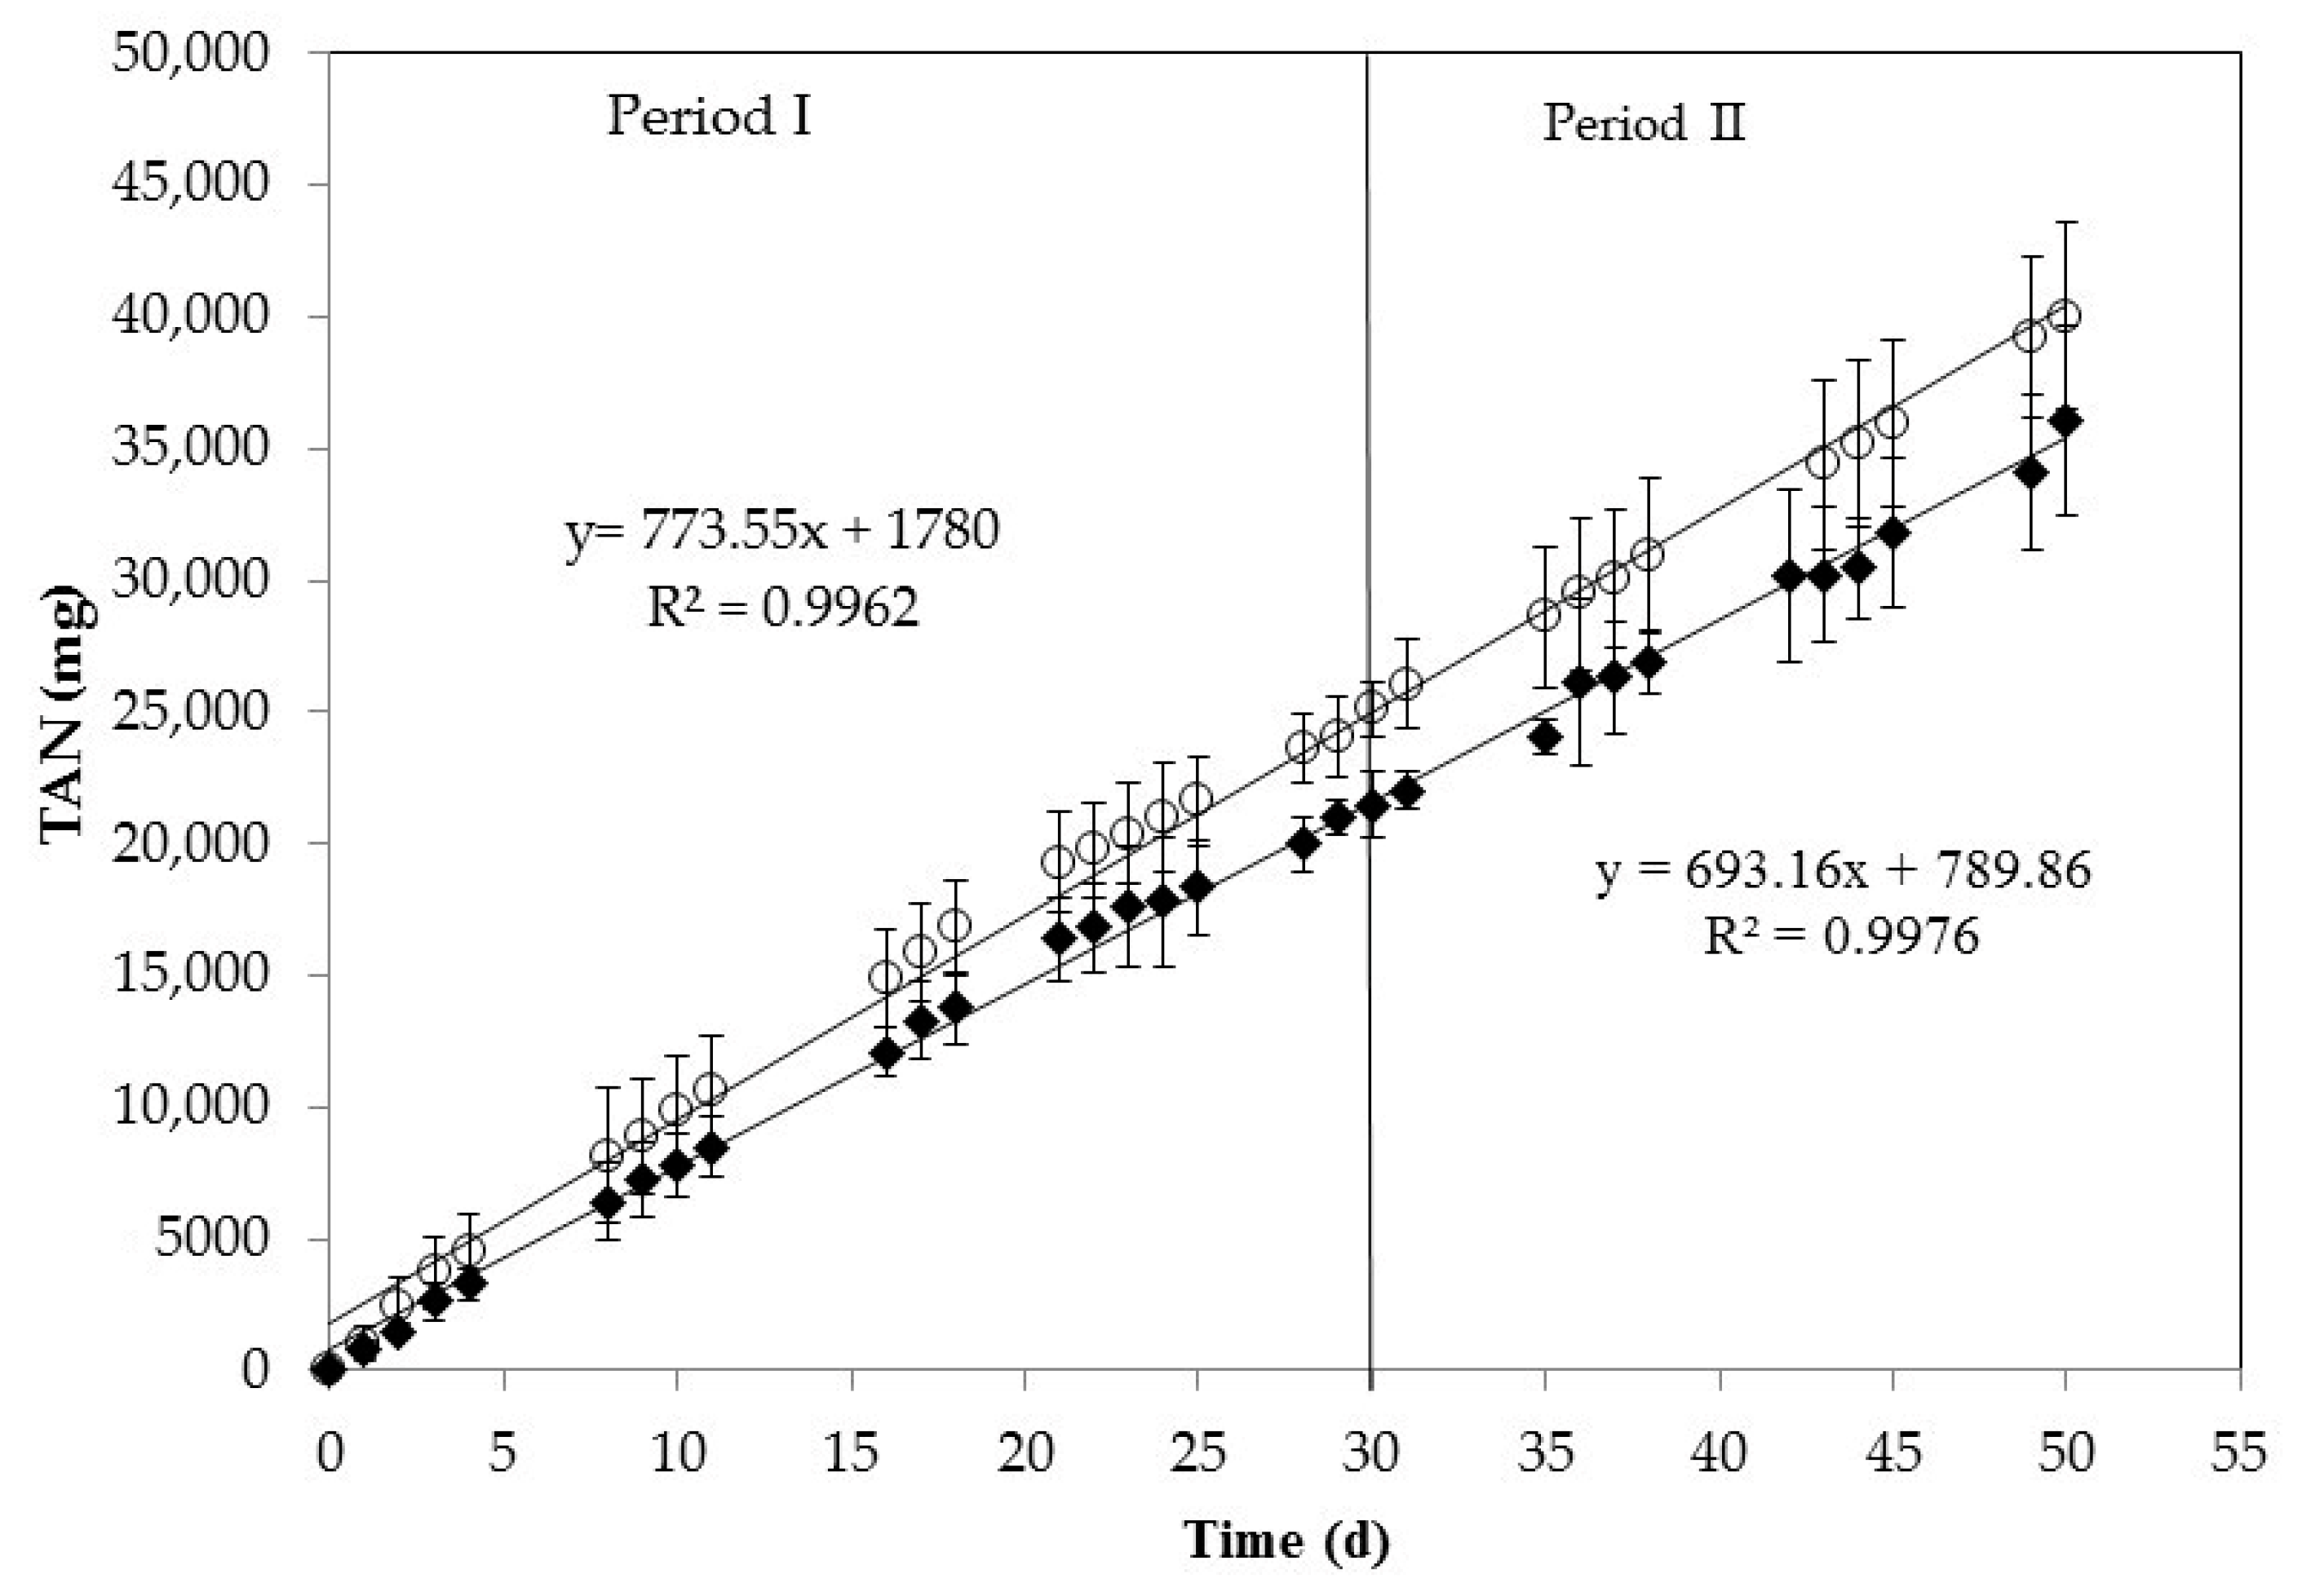
3.2. Characterization of the Acidic Solution Containing the Concentrated Ammonia Product

TAN concentration in the acidic solution rapidly increased in the first 16 days to values near 16,000 mg L−1, increasing much slower after that time and reaching an approximately constant concentration from day 21 close to 19,000 mg L−1 (Figure 4). This is attributed to the diffusion of water vapor gas through the membrane, averaging 16 g per day and liter of manure in reactor, corresponding to 1252 g of water per day and m2 of membrane surface (Figure 4). Similar to TAN recovery, water capture in the acidic solution was uniform during the whole experimental period, with no significant differences between the two periods (p = 0.53). This led to a continuous dilution of the acidic solution and increased its volume. Thus, the weight of the acidic solution was more than 6-fold higher after 50 days of experimentation compared to the initial weight (Figure 4). Darestani et al. [29] pointed out that the transfer of water vapor may occur during the TAN removal process using hydrophobic membranes due to differences in vapor pressure between both sides of the membrane (i.e., osmotic distillation or OD). This process could have a great impact on the economy of the process. Firstly, TAN could not be concentrated in the acidic solution as expected and a further process will be required to concentrate ammonium sulfate and to reduce transportation cost to export this fertilizer outside the farm. Secondly, OD also affects the design of the acid tank that must foresee increasing volume of the acidic solution. A possible strategy to counteract and effectively inhibit osmotic distillation could be heating the stripping solution and/or cooling the feed solution [19,30]. Therefore, this strategy was evaluated with a new assay shown in Table 4. A temperature increment of the acidic solution of only 3 °C caused a decrease of approximately 34% of the OD as represented by the reduced water recovery in the acidic solution, with no significant differences in ammonia recovery (Table 3). Thus, heating of the acidic tank by a few °C offers a good and cheap alternative for reducing OD during recovery of ammonia using gas-permeable membranes.
The acidic solution contained about 24% (dry weight) of sulfur, which is also a valuable nutrient for fertilization. Regarding the presence of other inorganic compounds, among potassium, magnesium, calcium, zinc, copper, and iron, only K+ was detected in average value of 28 mg L−1. The high salt concentrations lead to a conductivity of the acidic solution of 90 mS cm−1.
After some days of testing, the acidic solution changed from transparent to brownish. The same visual observation was made by Zarebska et al. [31]. The quantification of COD concentration of this solution indicated a low level (139 ± 12 mg L−1). Such a result is consistent with the analysis of total VFA by gas chromatography, in which only acetic acid was detected among seven VFA determinations, at a concentration of 60 ± 25 mg acetic acid L−1 equivalent to 64 mg COD L−1 (using a conversion factor of 1.07 [32]). Xie et al. [8] indicated that volatile organic compounds, such as VFA that exert partial vapor pressures comparable to or higher than water, are transported across hydrophobic membranes with the water vapor.

3.3. Practical Considerations and Further Research

Different ALRs (i.e., HRTs) could be applied to the gas-permeable system operated at semi-continuous mode depending on the TAN concentration required in the effluent. From an agronomic point of view, the three main nutrients (N, P, and K) presented in swine manure in Spanish farms are not balanced in relation to crop needs, occasionally containing an excess of N [33]. In those cases, nitrogen capture through the implementation of gas-permeable membrane technologies could balance swine manure nutrients, enhancing the fertilizing properties of the by-product. Moreover, gas-permeable membranes for capturing N from swine manure can also be combined with other treatment technologies to improve their performance, such as anaerobic digestion process [15,34] or phosphorous recovery [24,28]. In the first case, the use of gas-permeable membrane technology for treating swine manure or other wastes with high ammonia concentration could diminish the ammonia toxicity in anaerobic digestion [35]. With regard to P recovery, the increase in pH together with the reduction of TAN concentration and alkalinity after the recovery of N using gas-permeable membranes could promote P recovery using precipitation processes [28]. More specifically, manure aeration without nitrification causes a pH increase due to OH release after bicarbonate destruction. This rise in the pH increases the formation of NH3 [5]. As shown in Figure 5, alkalinity was consumed due to the TAN removal by the process. In Period I, alkalinity consumption was higher than in Period II. This can be attributed to the higher percentage of TAN removed in Period I, thus consuming higher alkalinity. In this way, the combination of both the increasing of pH and reduction of ammonia and alkalinity using gas-permeable membranes encourage P recovery from swine manure and municipal wastewaters using Ca or Mg compounds [24].
Although the main objective of the semi-continuous gas-permeable system was to remove nitrogen from manure, the treatment also reduced organic matter and solid content (Table 5). During Period I, CODt, TS, and VS removals were 37 ± 12%, 15 ± 7%, and 17 ± 8%, respectively (average values from 10 to 30 d). During Period II, corresponding removal efficiencies were slightly lower: 27 ± 3%, 6 ± 4% and 7 ± 5%, respectively (average values from 35–50 d). Only a very low (<0.1%) amount of the organic matter (CODt) lost from manure was recovered in the acidic solution. Thus, the removal of organic and VS compounds could be attributed to biological degradation processes that take place at room temperature. This organic degradation has been reported in previous assays working with gas-permeable membranes. Dube et al. [5] obtained CODt from negligible to 24% for anaerobically digested effluents after treatment with gas-permeable membranes and low-rate aeration. García-González et al. [15] found consistent CODt removals (60–65%) when recovering ammonia from fresh swine manure using in a gas-permeable membrane system with or without aeration. Differences among studies could be attributed to the different biodegradability of the livestock wastes used (digested vs. fresh manure). COD removal could have consequences from a practical point of view. For instance, the reduction of organic content in treated manure will reduce methane production in a further anaerobic process.
Membrane fouling is an important consideration that determines useful life of the gas-permeable membranes and affects its economic viability [31]. In the present work, the surface of the membrane on the manure side changed color from white to brownish during the 50 days of semi-continuous operation using manure. However, reduction of the rate of TAN recovery over time was not detected. This observation suggests that the membrane soiling did not block membrane pores and did not impact TAN recovery.
The results obtained in the present study are very promising, being the first study (to the best of our knowledge) evaluating gas-membrane technology to recover nitrogen from manure in semi-continuous mode. Nevertheless, further research is needed in order to optimize the process before scaling up this technology. Particularly, in view of the obtained results, the effect of different aeration rates over the pH increase for enhancing N recovery should be evaluated.

4. Conclusions

TAN was successfully removed and recovered from swine manure using gas-permeable membrane system operated at semi-continuous mode. A uniform TAN recovery rate of 27 g m−2 d−1 was obtained, regardless of the TAN loading rate applied and the manure TAN concentration in reactor. TAN removal reached 79% for Period I (HRT = 7 d) and 56% for Period II (HRT = 5 d), with 90% of recovery by the semi-continuous membrane system in both periods. Simultaneously, ammonia was converted to ammonium sulfate, obtaining a solution of up to 1.9% of N. Osmotic distillation during the recovery process led to the dilution of this acidic solution, reducing the N concentration of the fertilizer product. However, an increase in temperature of 3 °C of the acidic solution relative to the wastewater reduced 34% the osmotic distillation and water dilution of the product.

Author Contributions

The conceptualization of this research was made by B.R. The formal analysis, investigation, and data curation was conducted by B.R. and B.M.-S. Supervision was made by M.C.G.-G. Original draft presentation was done by B.R. Finally, review and editing of the manuscript were prepared by B.R., B.M.-S., M.B.V., and M.C.G.-G.

Funding

This work has been funded by the European Union under the Project Life+ AMMONIA TRAPPING (LIFE15-ENV/ES/000284) “Development of membrane devices to reduce ammonia emissions generated by manure in poultry and pig farms”. Cooperation with USDA-ARS Project 6082-13630-001-00D “Improvement of Soil Management Practices and Manure Treatment/Handling System of the Southern Coastal Plains” is acknowledged. Mention of trade names or commercial products in this article is solely for the purpose of providing specific information and does not imply recommendation or endorsement by the USDA.

Conflicts of Interest

The authors declare no conflict of interest.

References

  1. Webb, J.; Menzi, H.; Pain, B.F.; Misselbrook, T.H.; Dämmgen, U.; Hendriks, H.; Döhler, H. Managing ammonia emissions from livestock production in Europe. Environ. Pollut. 2005, 135, 399–406. [Google Scholar] [CrossRef]
  2. European Environment Agency (EEA). Agriculture, Ammonia Emissions Statistics- Data Extracted in June 2015. Available online: http://ec.europa.eu/eurostat/statistics-explained/index.php/Agriculture_-_ammonia_emission_statistics (accessed on 30 June 2017).
  3. Wing, S.; Wolf, S. Intensive livestock operations, health, and quality of life among eastern North Carolina residents. Environ. Health. Perspect. 2000, 108, 233–238. [Google Scholar] [CrossRef]
  4. Directive (EU) 2016/2284 of the European Parlament and of the Council of 14 December 2016 on the reduction of national emissions of certain atmospheric pollutants, amending Directive 2003/35/EC and repeling Directive 2001/81/EC. Off. J. Eur. Commun. 2016, L344, 1–31.
  5. Dube, P.J.; Vanotti, M.B.; Szogi, A.A.; Garcia-González, M.C. Enhancing recovery of ammonia from swine manure anaerobic digester effluent using gas-permeable membrane technology. Waste Manag. 2016, 49, 372–377. [Google Scholar] [CrossRef]
  6. Funderburg, E. Why Are Nitrogen Prices So High? Agriculture News and Views 2001; The Samuel Roberts Noble Foundation: Ardmore, OK, USA, 2013; Available online: www.noble.org/ag/soils/nitrogenprices/ (accessed on 30 June 2017).
  7. Sareer, O.; Mazahar, S.; Khanum Al Akbari, W.M.; Umar, S. Nitrogen pollution, plants and human health. In Plants, Pollutants and Remediation; Springer: Dordrecht, The Netherlands, 2016; pp. 47–57. [Google Scholar]
  8. Xie, M.; Shon, H.K.; Gray, S.R.; Elimelech, M. Membrane-based processes for wastewater nutrient recovery: Technology, challenges, and future directions. Water Res. 2016, 89, 210–221. [Google Scholar] [CrossRef]
  9. Masse, L.; Massé, D.I.; Pellerin, Y.; Dubreuil, J. Osmotic pressure and substrate resistance during the concentration of manure nutrients by reverse osmosis membranes. J. Membr. Sci. 2010, 348, 28–33. [Google Scholar] [CrossRef]
  10. Bonmatí, A.; Flotats, X. Air stripping of ammonia from pig slurry: Characterization and feasibility as a pre-or post-treatment to mesophilic anaerobic digestion. Waste Manag. 2003, 23, 261–272. [Google Scholar] [CrossRef]
  11. Milan, Z.; Sánchez, E.; Weiland, P.; de Las Pozas, C.; Borja, R.; Mayari, R.; Rovirosa, N. Ammonia removal from anaerobically treated piggery manure by ion exchange in columns packed with homoionic zeolites. Chem. Eng. J. 1997, 66, 65–71. [Google Scholar] [CrossRef]
  12. Uludag-Demirer, S.; Demirer, G.N.; Chen, S. Ammonia removal from anaerobically digested dairy manure by struvite precipitation. Process Biochem. 2005, 40, 3667–3674. [Google Scholar] [CrossRef]
  13. Vanotti, M.B.; Szogi, A.A. Systems and Methods for Reducing Ammonia Emissions from Liquid Effluents and for Recovering the Ammonia. U.S. Patent 9,005,333 B1, 14 April 2015. [Google Scholar]
  14. García-González, M.C.; Vanotti, M.B. Recovery of ammonia from swine manure using gas-permeable membranes: Effect of waste strength and pH. Waste Manag. 2015, 38, 455–461. [Google Scholar] [CrossRef]
  15. García-González, M.C.; Vanotti, M.B.; Szogi, A.A. Recovery of ammonia from swine manure using gas-permeable membranes: Effect of aeration. J. Environ. Manag. 2015, 152, 19–26. [Google Scholar] [CrossRef]
  16. Zarebska, A.; Romero Nieto, D.; Chirstensen, K.V.; Fjerbaek Sotoft, L.; Norddahl, B. Ammonium fertilizers production from manure: A critical review. Crit. Rev. Environ. Sci. Technol. 2015, 45, 1469–1521. [Google Scholar] [CrossRef]
  17. Daguerre-Martini, S.; Vanotti, M.B.; Rodríguez-Pastor, M.; Rosal, A.; Moral, R. Nitrogen recovery from wastewater using gas-permeable membranes: Impact of inorganic carbon content and natural organic matter. Water Res. 2018, 137, 2010–2210. [Google Scholar] [CrossRef]
  18. Samani Majd, A.M.; Mukhtar, S. Ammonia recovery enhancement using a tubular gar-permeable membrane system in laboratory and field-scale studies. Trans. ASABE 2013, 56, 1951–1958. [Google Scholar]
  19. Ahn, Y.T.; Hwang, Y.H.; Shin, H.S. Application of PTFE membrane for ammonia removal in a membrane contactor. Water Sci. Technol. 2011, 63, 2944–2948. [Google Scholar] [CrossRef]
  20. Rothrock, M.J.; Szögi, A.A.; Vanotti, M.B. Recovery of ammonia from poultry litter using gas-permeable membranes. Trans. ASABE 2010, 53, 1267–1275. [Google Scholar] [CrossRef]
  21. Samani Majd, A.M.; Mukhtar, S. Ammonia diffusion and capture into a tubular gas-permeable membrane using diluted acids. Trans. ASABE 2013, 56, 1943–1950. [Google Scholar]
  22. García-González, M.C.; Vanotti, M.B.; Szogi, A.A. Recovery of ammonia from anaerobically digested manure using gas-permeable membranes. Sci. Agric. 2016, 73, 434–438. [Google Scholar] [CrossRef]
  23. Oliveira Filho, J.D.S.; Daguerre-Martini, S.; Vanotti, M.B.; Saez-Tovar, J.; Rosal, A.; Pérez-Murcia, M.D.; Bustamante, M.A.; Moral, R. Recovery of ammonia in raw and co-digested swine manure using gas-permeable membrane technology. Front. Sustain. Food Syst. 2018, 2, 30. [Google Scholar] [CrossRef]
  24. Vanotti, M.B.; Szogi, A.A.; Dube, P.J. Systems and Methods for Recovering Ammonium and Phosphorous from Liquid Effluents. U.S. Patent 20160347630 A1, 1 December 2016. [Google Scholar]
  25. American Public Health Association. Standard Methods for the Examination of Water, Wastewater APHA. In American Water Works Association and Water Environment Federation, 21st ed.; American Public Health Association: Washington, DC, USA, 2005. [Google Scholar]
  26. US Environmental Protection Agency (EPA). Methods for Chemical Analysis of Water and Waste, EPA/600/4-79/020; US Environmental Protection Agency: Cincinnati, Ohio, 1983.
  27. Hansen, K.H.; Angelidaki, I.; Ahring, B.K. Anaerobic digestion of swine manure. Inhibition by ammonia. Water Res. 1998, 32, 5–12. [Google Scholar] [CrossRef]
  28. Vanotti, M.B.; Dube, P.J.; Szogi, A.A.; García-González, M.C. Recovery of ammonia and phosphate minerals from swine wastewater using gas-permeable membranes. Water Res. 2017, 112, 137–146. [Google Scholar] [CrossRef]
  29. Darestani, M.; Haigh, V.; Couperthwaite, S.J.; Millar, G.J.; Nghiem, L.D. Hollow fibre membrane contactors for ammonia recovery: Current status and future development. J. Environ. Chem. Eng. 2017, 5, 1349–1359. [Google Scholar] [CrossRef]
  30. Wang, G.; Shi, H.; Shen, Z. Influence of osmotic distillation on membrane absorption for the treatment of high strength ammonia wastewater. J. Environ. Sci. 2004, 16, 651–655. [Google Scholar]
  31. Zarebska, A.; Romero Nieto, D.; Christensen, K.V.; Norddahl, B. Ammonia recovery from agricultural wastes by membrane distillation: Fouling characterization and mechanism. Water Res. 2014, 56, 1–10. [Google Scholar] [CrossRef]
  32. Cokgor, E.U.; Zengin, G.E.; Tas, D.O.; Oktay, S.; Randall, C.; Orhon, D. Respirometric assessment of primary sludge fermentation product. J. Environ. Eng. 2006, 132, 68–74. [Google Scholar] [CrossRef]
  33. Antezana, W.; De Blas, C.; García-Rebollar, P.; Rodríguez, C.; Beccaccia, A.; Ferrer, P.; Cerisuelo, A.; Moset, V.; Estellés, F.; Cambra-López, M.; et al. Composition, potential emissions and agriculture value of pig slurry from Spanish commercial farms. Nutr. Cycl. Agroecosyst. 2016, 104, 159–173. [Google Scholar] [CrossRef]
  34. Lauterböck, B.; Nikolausz, M.; Lv, Z.; Baumgartner, M.; Liebhard, G.; Fuchs, W. Improvement of anaerobic digestion performance by continuous nitrogen removal with a membrane contactor treating substrate rich in ammonia and sulfide. Bioresour. Technol. 2014, 158, 209–216. [Google Scholar] [CrossRef]
  35. Lauterböck, B.; Ortner, M.; Haider, R.; Fuchs, W. Counteracting ammonia inhibition in anaerobic digestion by removal with a hollow fiber membrane contactor. Water Res. 2012, 46, 4861–4869. [Google Scholar] [CrossRef]
Figure 1. Process diagram of gas-permeable system operating at semi-continuous mode.
Environments 06 00032 g001
Figure 2. TAN concentration in the influent swine manure (■) and in effluent of the gas-permeable membrane system (○). The error bars represent the standard deviation of duplicate experiments.
Environments 06 00032 g002
Figure 3. Mass of TAN removed from swine manure (○) and recovered in the acid tank (♦). Linear equations and R2 are represented. The error bars represent the standard deviation of duplicate experiments.
Environments 06 00032 g003
Figure 4. TAN concentration in the acid tank (■) and weight of the acidic solution (◇) during the experimental time. The error bars represent the standard deviation of duplicate experiments.
Environments 06 00032 g004
Figure 5. Alkalinity (×) and pH (●) of manure in reactor during the experiment. The error bars represent the standard deviation of duplicate experiments.
Environments 06 00032 g005
Table 1. Specifications of the gas-permeable membranes used in experiments described in Section 2.2 and Section 2.3.
Membranes PropertiesFirst Experiment (Section 2.2)Second Experiment (Section 2.3)
Inner diameter (mm)8.644.08
Wall thickness (mm)0.760.56
Pore size (µm)2.5-
Bubble point (kPa)207-
Density (g cm3)0.450.95
Length (m)0.80.61
Surface area (m2)0.0260.091
Table 2. Nitrogen mass balance for the system for Period I and Period II.
PeriodTKNin (mg L−1)TANin (mg L−1)N orgin (mg L−1)TKNeff (mg L−1)TANeff (mg L−1)N orgeff (mg L−1)
I4481 ± 1823425 ± 12210291830 ± 381748 ± 1531082
II4685 ± 2223486 ± 13411992745 ± 3451525 ± 831220
TKNin is influent TKN concentration; Norgin is the influent organic N concentration; TKNeff is the TKN concentration in the effluent; Norgeff is the organic N concentration in the effluent.
Table 3. Comparison of results from this study operating in semi-continuous mode with previous studies also recovering TAN using gas-permeable membranes from livestock wastewaters applying low-rate aeration but operating in batch mode.
Type of WastewaterOperation Mode aTreatment Time (d)Ratio Membrane Surface/Manure Volume (m2 L−1)Aeration Rate (Lair Lwaste−1 min−1)Initial TAN Concentration (mg L−1)TAN Removal (%)TAN Recovery over Removed (%)Average TAN Recovery (g m−2 d−1) bInitial pHFinal pH Reference
Digested swine effluentBatch 60.0130.1223509793 c25.1 c8.369.47[28]
Anaerobically digested swine manureBatch50.0130.122097979830.78.719.26[5]
Anaerobically digested swine manureBatch50.0130.121465999622.78.479.17[5]
Raw swine manureBatch180.0130.24239099999.57.509.20[15]
Raw swine manure centrateSemi-continuous70.0130.243451799027.17.608.46Present study (period I)
a Operational temperatures were laboratory room temperatures between 22–25 °C in all studies. b TAN recovery efficiency was equal to TAN recovered in the acidic solution divided by TAN removed from manure multiplied by 100. c 7.8% TAN was recovered in phosphorous precipitate.
Table 4. Effect of heating the acidic solution (3 °C warmer than wastewater in the reactor) on the recovery of both water and ammonia. Data are means of duplicate experiments ± standard deviations.
No heatingHeating
Water recovery (g m−2 d−1)921 ± 185612 ± 22
Ammonia recovery (g m−2 d−1)49.5 ± 0.351.8 ± 2.6
Table 5. Average COD, TS, and VS removal efficiencies (± standard deviations) during Period I and II.
Period I Period II
COD removal (%)36.6 ± 11.626.5 ± 3.2
TS removal (%)15.4 ± 7.16.2 ± 3.7
VS removal (%)17. 1 ± 7.56.6 ± 5.3

