Diatom Deformities and Tolerance to Cadmium Contamination in Four Species
by
 , ,
, ,
Sandra Kim Tiam
1,*,† ,
,
Isabelle Lavoie
1,
Fengjie Liu
1,
Paul B. Hamilton
2 and
Claude Fortin
1,*
1
Institut national de la recherche scientifique, 490 rue de la Couronne, Québec, QC G1K 9A9, Canada
2
Research and Collections, Canadian Museum of Nature, P.O. Box 3443, Station D, Ottawa, ON K1P 6P4, Canada
*
Authors to whom correspondence should be addressed.
†
Present address: UMR 7245 MNHN/CNRS Molécules de communication et adaptation des microorganismes, équipe Cyanobactéries, Cyanotoxines et Environnement, Muséum National d’Histoire Naturelle, 12 rue Buffon, F-75231 Paris CEDEX 05, France.
Environments 2019, 6(9), 102; https://0-doi-org.brum.beds.ac.uk/10.3390/environments6090102
Submission received: 11 June 2019
/
Revised: 21 August 2019
/
Accepted: 28 August 2019
/
Published: 2 September 2019
(This article belongs to the Special Issue Aquatic Microbial Ecotoxicology)
Abstract
:The relative tolerance of four diatoms (Nitzschia palea, Pinnularia mesolepta, Mayamaea atomus, and Gomphonema truncatum) to Cd was evaluated, including their proneness to deformities, and the severity of the abnormalities in relation to Cd concentration. The indirect effect of Cd on photosynthetic capacities was assessed during a short time exposure experiment using a dose-response approach to evaluate the relative tolerance of the four diatom species. The EC25 were 9 (3, 23), 606 (348, 926), 1179 (1015, 1349) and 2394 (1890, 2896) µg/L for P. mesolepta, G. truncatum, N. palea, and M. atomus respectively. P. mesolepta was by far the most Cd sensitive species while M. atomus was the most tolerant. In addition, diatoms were exposed to a single concentration of Cd comparable to a heavily contaminated environment for a longer duration to evaluate the effect of Cd on growth kinetics and the deformities induced. N. palea, P. mesolepta, and M. atomus were able to grow when cultivated with Cd while G. truncatum was not. Cadmium strongly affected the effective quantum yield in G. truncatum (4.8 ± 5.9% of the control) and P. mesolepta cultures (29.2 ± 6.9% of the control). The effects were moderate for N. palea (88.3 ± 0.7% of the control) and no impact was observed for M. atomus. The results from the two approaches were in accordance since they identified N. palea and M. atomus as the two most tolerant species to Cd, while P. mesolepta and G. truncatum were the most sensitive. The microscopy analyses revealed that P. mesolepta was more impacted by Cd than N. palea and M. atomus considering both the quantity of abnormal cells and the severity of the deformities. Overall, this research shows that not all deformities can be considered equal for a water quality bio-assessment. The work highlights a need to take into account metal-tolerance/sensitivity of the species and the severity of the deformities.
1. Introduction
Diatoms are ubiquitous photosynthetic microorganisms that play a fundamental role in ecosystem functions. They are often the dominant algal group, particularly in benthic environments, and are at the base of the food web. Diatoms have an outer bio-siliceous shell (frustule, composed of two valves) with particular morphological characteristics used for taxonomical identification. These primary producers are of special interest for the water quality bioassessment because they have a short generation time (they respond quickly to environmental changes), are cost-effective to collect, have species-specific environmental requirements, and are relatively easy to identify and enumerate. For these reasons, biological monitoring protocols of fluvial ecosystems, using diatoms, have been adopted in numerous countries (e.g., Biological Diatom Index IBD, Trophic Diatom Index TDI, Eastern Canadian Diatom Index IDEC [1,2,3]). Diatom-based indices routinely used in monitoring programs were developed to assess water quality, i.e., mostly documenting nutrient, salinity, and organic matter enrichment. To date, these commonly used indices are not designed to assess contamination by compounds such as pesticides, pharmaceuticals, or metals [4,5]. However, diatoms are sensitive to contaminants and have shown their usefulness to assess exposure to toxic agents such as metals. Many studies have investigated the responses of diatom assemblages to metal contamination (e.g., [6,7,8]), and have shown impacts at structural and functional levels. In a review paper on the effects of metals on diatoms, Morin et al. [9] presented several diatom-related biological descriptors that can be of interest in monitoring metal contamination. The authors further suggested that the occurrence of diatom deformities (deformed frustules) were good indicators of metal contamination. Other studies also support the use of deformities as a morphological endpoint reflecting a response to metals [10,11].
Although the presence of deformities in contaminated environments is considered a good indication of stress, the detection and quantification of deformities can sometimes be challenging and interpreting the ecological signal is not always straightforward [12]. In a review/opinion paper, Lavoie et al. [4] discussed certain limitations related to the use of deformities in bioassessments and raised several questions such as “Are deformities equal between different species? Are all types of deformities equal within the same species? Should a deformity observed on a tolerant species have more weight as an indicator of stress? How should the severity of a teratology be assessed?”. As discussed in Lavoie et al. [4], the current uncertainties concerning diatom deformities and their ecological significance have implications for biomonitoring. Based on the number of studies that successfully identified contamination using deformities, it is clear that this biomarker has great potential to differentiate contaminated and reference conditions. However, linking the magnitude of the response to the level of contamination is difficult [12]. A better understanding of diatom deformities and their significance could improve the sensitivity of this biological descriptor. In particular, species proneness to deformities together with tolerance to stress are potentially important aspects to consider when using deformities and stress as indicators of contamination.
The objective of this study was to evaluate the relative tolerance to Cd of four diatoms collected in the field (Nitzschia palea (Kütz.) W.Sm., Pinnularia mesolepta (Ehrenb.) W.Sm., Mayamaea atomus (Kütz.) Lange-Bert., or from a culture (Gomphonema truncatum Ehrenb.). The measured tolerances included proneness to deformities and the severity of the abnormalities in relation to Cd concentration. We evaluated the responses of the four diatoms to Cd based on two experiments. The purpose of the first experiment was to assess the effects of Cd at high concentrations during a short time (acute exposure) using a dose-response approach. In the second experiment, diatoms were exposed to Cd for a longer duration (chronic exposure), which is similar to concentrations reported in heavily contaminated European rivers. The effects of Cd on growth, bioaccumulation, photosynthetic efficiency, and deformities were then assessed.
2. Materials and Methods
2.1. Algal Cultures
The species N. palea, P. mesolepta, and M. atomus were isolated from river biofilms collected in the Mauricie region (Québec, QC, Canada) in a tributary of the Charest River located about 3 km downstream of the Lake Ste Anne outlet. For each species, one individual was isolated from the periphytic biofilm growing on an agarose gel, and cultured in sterile Dauta medium [13] modified with an addition of silica (final concentration of 10 mg/L), without ethylenediaminetetraacetic acid (EDTA). An axenic culture of G. truncatum was provided by the UTEX algal collection (Texas University, Austin, TX, USA). The cultures were maintained at 18 °C in a thermostatic room with a photon flux density of 100 μmol/m2/s and a 12:12 h light:dark cycle. Fresh cultures were inoculated with medium every seven days to promote adequate growth of the diatom population.
N. palea is a widely distributed diatom and can be found in harsh environments. This pennate diatom is 12–43 µm in length and 2.5–4.5 µm in width. The raphe is located within a canal on the valve margin and is not evident by light microscopy (raphe system fibulate). The stria density ranges from 32–47/10 µm [14]. N. palea has been described as relatively tolerant to metals [6,15] and to pesticides [16,17,18]. This taxon is considered to be one of the most pollution tolerant species.
P. mesolepta is a poorly understood species from North America. This taxon is possibly more widely distributed, but is in need of a more complete species description. The valves are ca. 85 µm long, 13 µm wide, with 13 striae/10 µm. The species is identified by triundulate margins, capitate apices, a linear raphe with bent central ends, and a broad central region with no markings. This is an oligotrophic species preferring low specific conductance and pH environments. The species is not recognized as a pollution tolerant species.
M. atomus is abundant and cosmopolitan. The species is small, 8.5–13 µm long, and 4–5.5 µm wide with 19–22 striae/10 µm. The valves are elliptical, with striae that radiate away from the central area. The raphe is fine and narrow with expanded round central pore endings. The species is tolerant to many environments, aerophilous to alkalilphilous, and is considered, along with N. palea, one of the more pollution tolerant species [19].
G. truncatum is cosmopolitan in distribution and commonly observed in Eastern North America. This species is 17–48 µm long, 8.5–13.5 µm in width, and come with 10–15 striae/10 µm. The species has a unique club-like shape, with a flattened-round end and central expansion. The striae radiate from the center, but are less radiating at the ends. In light microscopy, the raphe is composed of two wavy lines indicating the internal and external valve surfaces. One isolated pore (stigmata) can be observed in the center [20]. This species can be found in disturbed and metal contaminated environments [21]. Note that the cultured G. truncatum cells purchased from UTEX do not match the normal shape description of the species.
2.2. Dose-Response Approach
Diatom suspensions of 2.8 mL with a final concentration of 31.2 ± 2.4 µg chlorophyll-a (chl-a)/mL in modified Dauta medium were exposed to Cd in 10 mL test tubes. Six concentrations of Cd (C1 = 8.6 ± 1.0, C2 = 31.3 ± 2.4, C3 = 101.9 ± 8.0, C4 = 335 ± 22, C5 = 1107 ± 75 and C6 = 3200 ± 130 µg/L) were prepared from a 1000 mg Cd/L standard solution (Plasma CAL, SCP Science, Baie-d’Urfé, QC, Canada). Concentrations were chosen to reach 50% inhibition, based on EC50 values calculated for N. palea (data not shown) prior to the exposure experiment. The lowest exposure concentration (C1) was close to concentrations in metal-contaminated watersheds such as those of the Massawippi River (Quebec, QC, Canada) [22] and the Riou-Mort River (France) [23]. Higher concentrations (C2 and C3) were comparable to those reported in more heavily contaminated European rivers [24]. Each condition was repeated in triplicate. Control conditions (C0 = 0 µg Cd/L, diatoms in the test tubes in the modified Dauta medium without Cd) were also repeated in triplicate. During the Cd exposure experiment, cultures were maintained at 18 °C in a thermostatic room with a photon flux density of 100 μmol/m2/s under continuous light. In vivo fluorescence was measured after a period of 19 h of exposure to the various Cd concentrations. Cadmium concentrations were measured in the solutions prior to exposure, as detailed below.
2.3. Chronic Cd Exposure Experiment
A volume of 250 mL of diatoms in suspension with a final concentration of 4.4 ± 0.2 µg chl-a/mL in modified Dauta medium were transferred into 500 mL Erlenmeyer flasks. A lower initial chl-a concentration was chosen for good diatom growth in non-limiting nutrient conditions during 21 days of the experiment. The four diatom species were exposed to Cd at a concentration of 100 µg Cd/L (Cd100) prepared from a 1000 mg Cd/L standard solution (Plasma CAL, SCP Science, Baie-d’Urfé, QC, Canada). Contaminated and control (C0 = 0 µg Cd/L) conditions were triplicated. During the experiment, cultures were maintained at 18 °C in a thermostatic room with a photon flux density of 100 μmol/m2/s and a 12:12 h light: dark cycle. The Erlenmeyer flasks were capped with sterile cotton wool and kept on an orbital shaker (60 rpm). Cultures were sampled one hour after Cd addition (day 0) and after 7, 14, and 21 days of exposure. For each sample, 10 mL was sub-sampled for Cd analysis and 3 mL for in vivo fluorescence measurements and microscopic analyses.
2.4. Cadmium Measurements
Cadmium concentrations in growth medium and in diatoms were determined with an Inductively Coupled Plasma Atomic Emission Spectrometer (ICP-AES) (Varian Vista AX CCD, Mississauga, ON, Canada). The analytical method was simultaneously validated for each sample series by analyzing multi-element calibration standards for ICP-AES (Plasma CAL, SCP Science). For the dose-response curve experiment, 10 mL of the solutions were sampled and filtered on 0.2 µm polycarbonate filter membranes (Merck Millipore Ltd. Burlington, USA). For the evaluation of Cd effects during the chronic experiment, the 10 mL water samples were centrifuged at 3220 g for 10 min at room temperature, and the supernatant was filtered as above. The filtered supernatant was then used to determine dissolved Cd concentrations. In order to determine bioaccumulation of Cd (e.g., intracellular cadmium concentration), 10 mL of Ethylenediaminetetraacetic acid (EDTA) (1 mM) was added to the pellet (to remove adsorbed Cd) and was filtered after 10 min [25,26,27]. Filters were digested with nitric acid (5 mL of HNO3, ACS) overnight, and 1 mL of hydrogen peroxide (Baker, ultra-pure reagent) was subsequently added, which was followed by an incubation at 95 °C for 2 h. A flow chart illustrating sample management and analytical measurements during the chronic experiment is given in Supplementary Information 1.
2.5. In Vivo Fluorescence Measurements
Total chl-a and effective quantum yield (ΦpsII) were determined by using a Pulse Amplified Modulated fluorometer (PhytoPAM, Heinz Walz GmbH, Pfullingen, Germany) based on the method described by Schreiber [28]. Total chl-a was used as a proxy for the growth rate [29]. The effective quantum yield was used to assess the physiological state of cells regarding the photosynthetic apparatus. This parameter is widely used to evaluate the effects of toxicants on photosynthetic micro-organisms [30]. The values of ΦpsII were recorded at an excitation wavelength of 665 nm. Samples were exposed to actinic light and ΦpsII was calculated according to Genty et al. [31].
where Ft is the minimum fluorescence determined just before saturation with a white light pulse, and Fm′ is the maximum level of fluorescence measured during the saturation pulse under actinic light.
ΦpsII = (Fm′ − Ft)/Fm′
2.6. Morphological Analysis
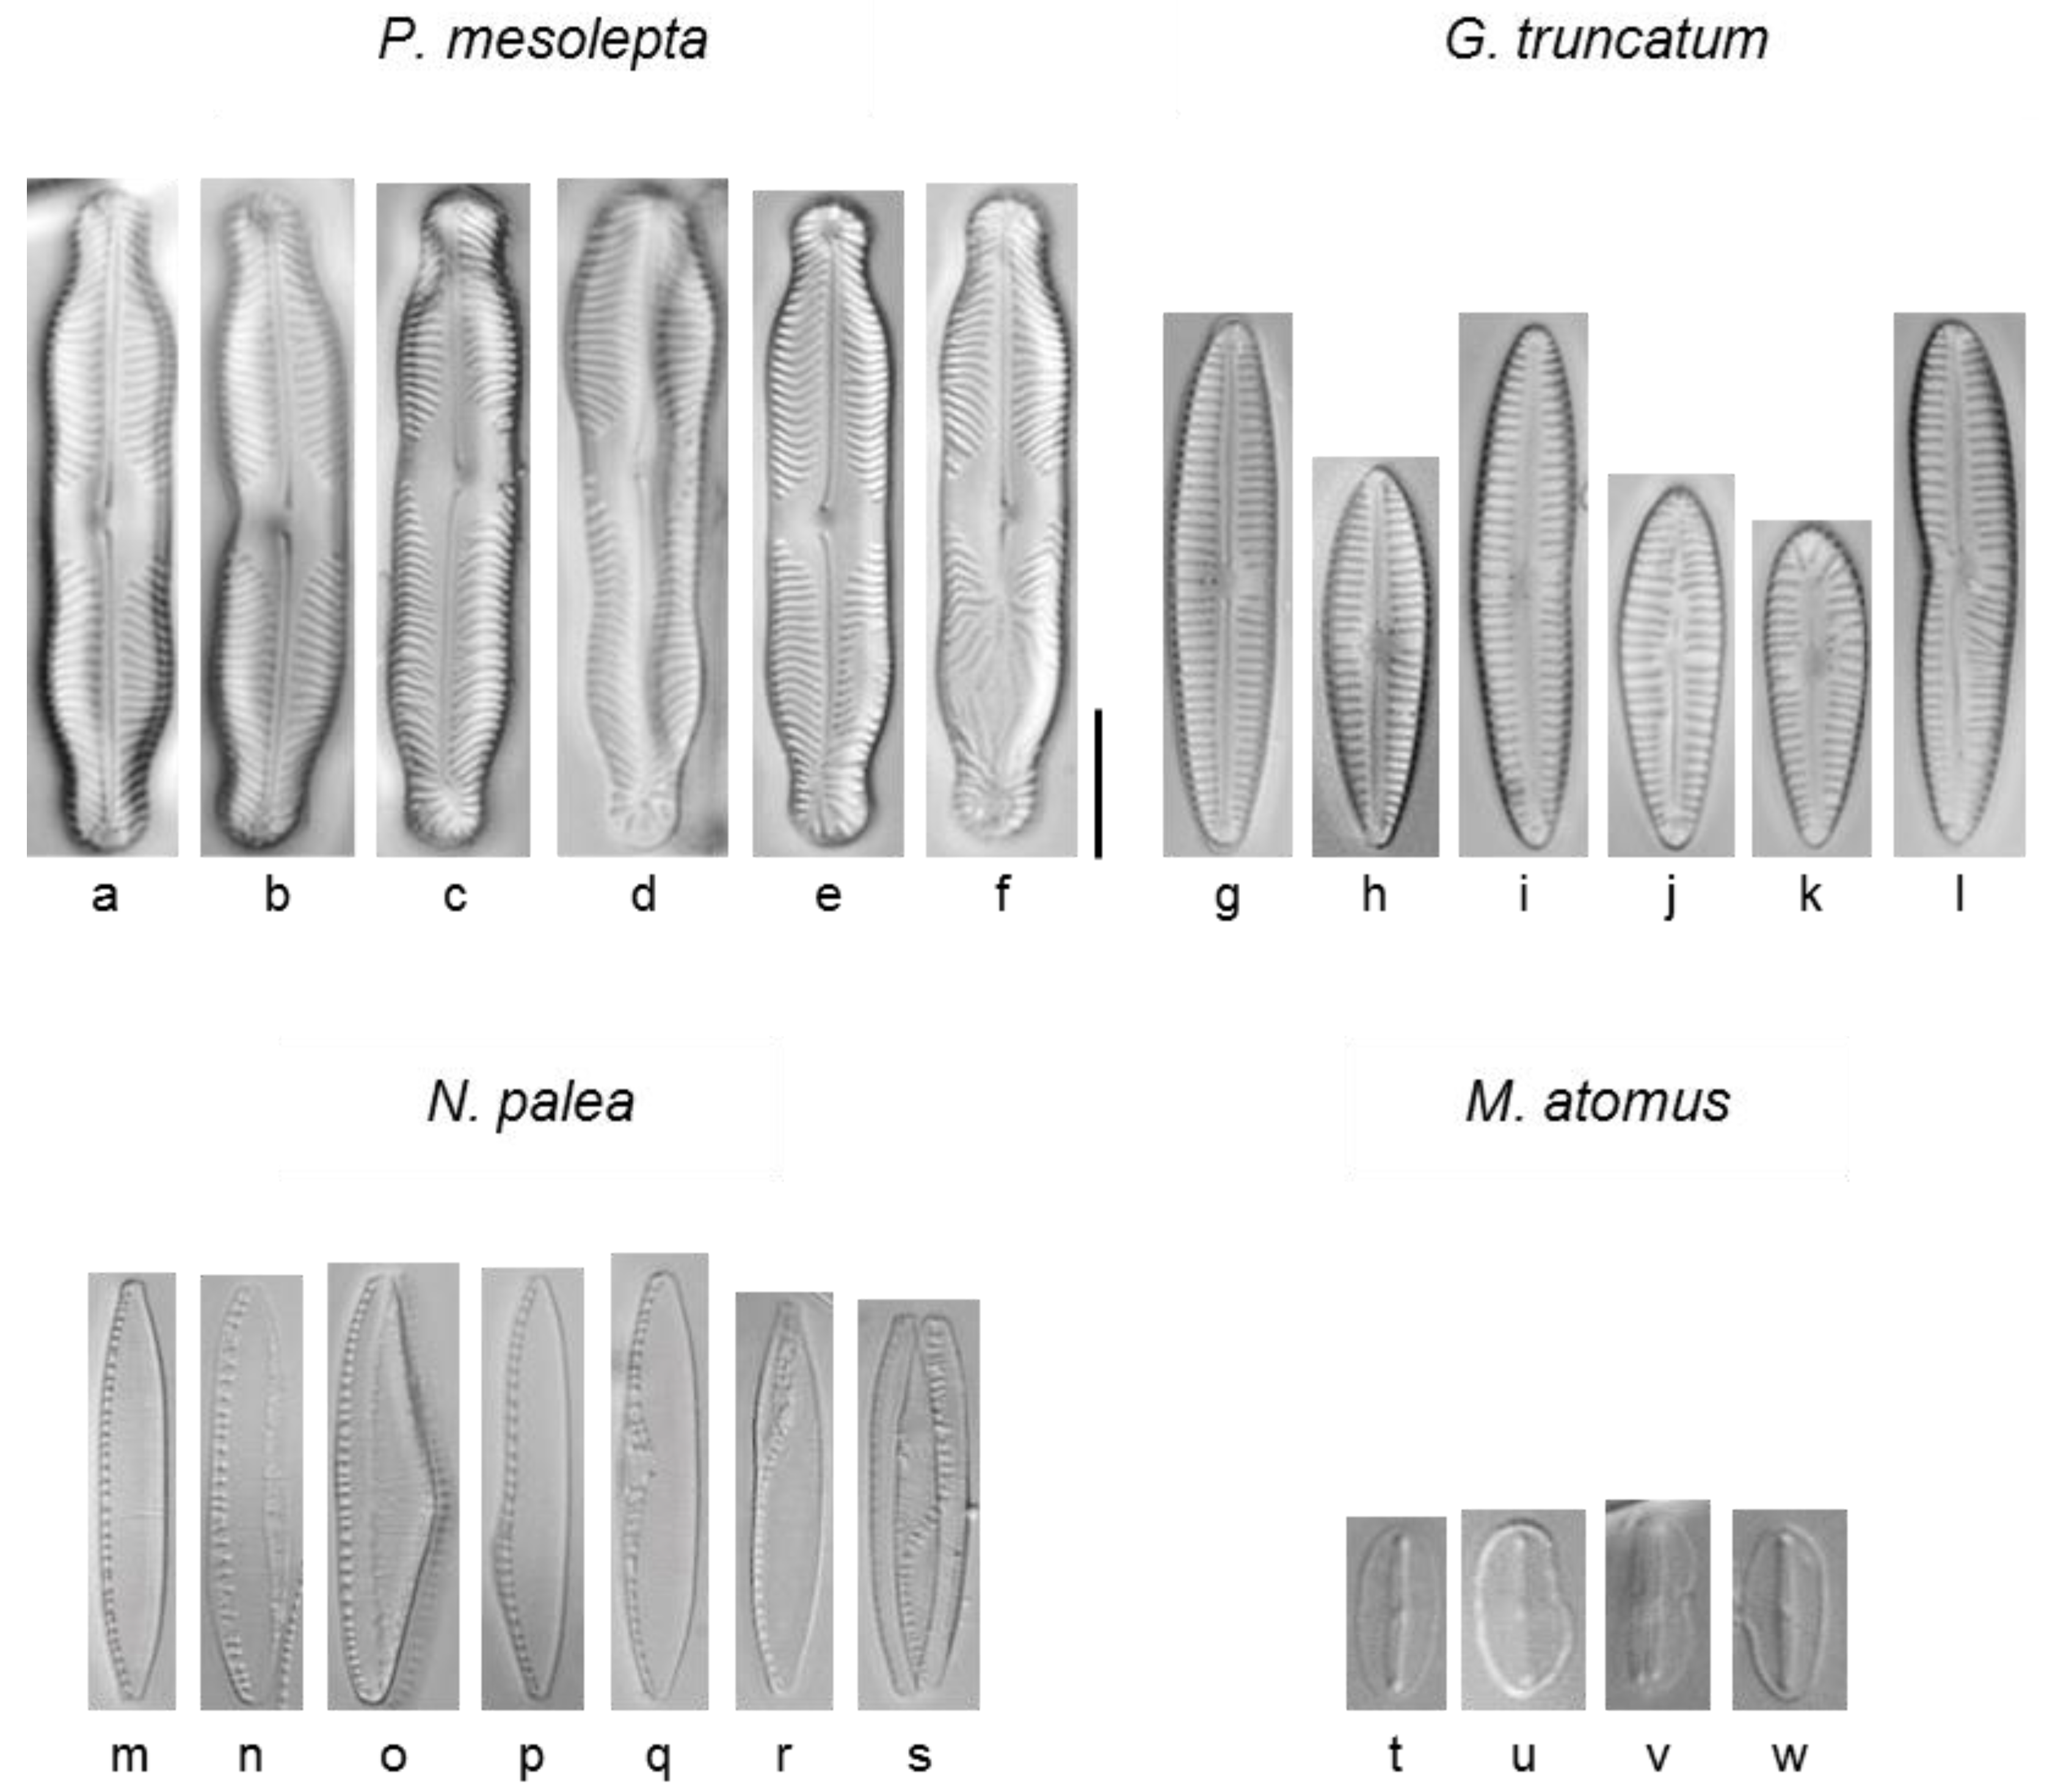
Diatoms were digested in nitric acid (70% by volume) at 70 °C for 2 h. The nitric acid was removed after centrifugation at 3220 g for 10 min and the settled diatom valves were rinsed with de-ionised water. This procedure was repeated several times until the solution reached pH values >6. Microscope slides with the diatom valves were mounted using Naphrax (Brunel Microscopes LTD, Chippenham, Wiltshire, UK). Approximately 400 valves per slide were observed at 1250x magnification under a light microscope (Reichert-Jung Polyvar, Wetzlar; Germany) equipped with differential interference contrast optics and a Nikon digital camera. However, a lower number of valves (~200–250) was observed for certain samples under Cd contamination due to low cell densities (P. mesolepta and G. truncatum). Each aberration in valve morphology was noted. Due to the small size of M. atomus, its high striae density and its poorly silicified frustule, deformities of this species were difficult to assess under a light microscope. For these reasons, the percentage of the deformities was potentially underestimated. To overcome this limitation, 200 valves were observed under light microscopy and about 150 valves were observed using a scanning electron microscope (SEM) with backscatter (T1) and secondary electron (ETD) image recoveries using 5 kV and a working distance of <5 mm (APREO, FEI, Hillsborough, OR, USA). Deformity types were classified into categories based on the diversity of aberrations observed in the four species. In summary, deformities were linked to valve formation processes (Figure 1).
Early deformities (raphe related) were assigned to the initial development of the diatom frustule after asexual reproduction. Striae (actually interstriae) development was considered to be a mid-morphogenesis developmental stage, while valve shape was assigned to the late morphogenesis valve and frustule development. Specific deformities included raphe interruptions, secondary raphe formations, striae interruptions, secondary striae formations, fibulae disruptions, asymmetrical deformed valve outlines, deformed terminal ends of the valve, and a mixture of deformities. Deformities were assessed after 21 days of exposure to Cd.
2.7. Statistical Analysis
The effects of Cd exposure on chl-a fluorescence signal (n = 3), effective quantum yield (n = 3), and bioaccumulation (n = 3) were tested by multifactorial analysis of variance (two-way ANOVA) and multiple comparisons were conducted with Tukey-HSD tests. Unilateral T-tests were conducted to determine if the percentages of diatom deformities were higher under Cd contamination (n = 3). Normality and homogeneity of variance were verified before to data analysis. Statistical analyses were performed using the freeware R [32]. EC25 and confidence intervals α5% were calculated using REGTOX 7.0.5 [33].
3. Results and Discussion
3.1. Dose-Response Curves
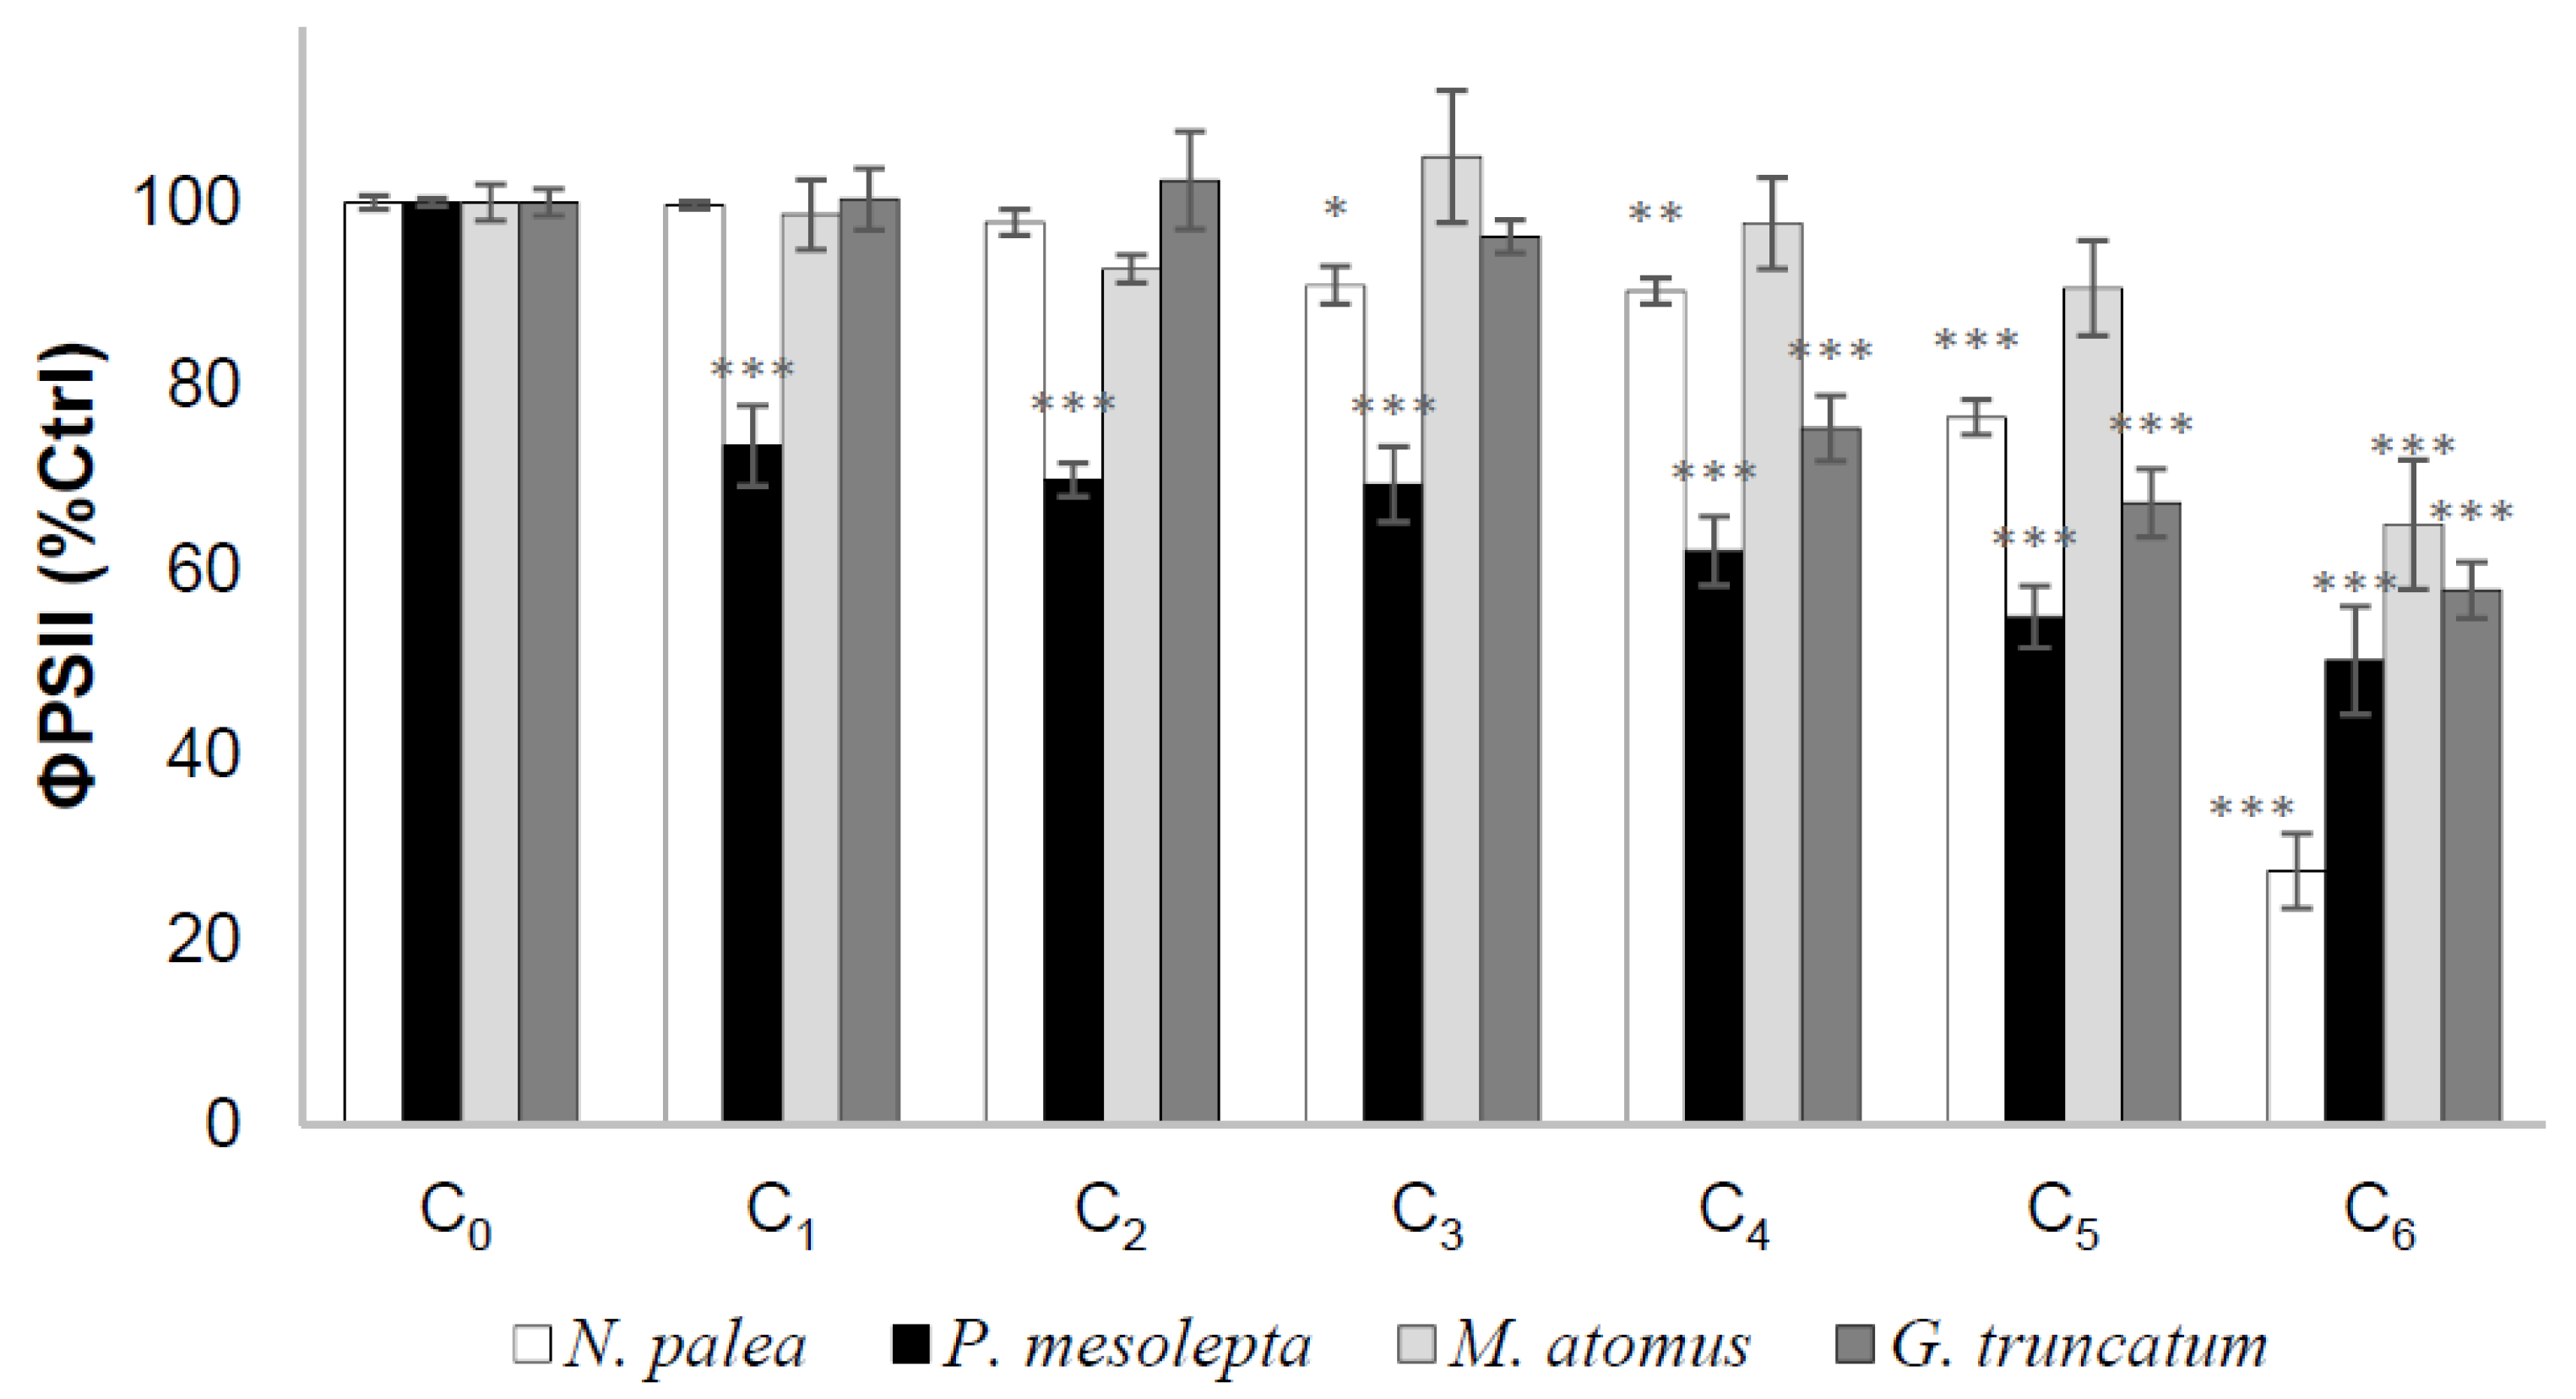
Effective quantum yield as a function of Cd concentration for each species is presented in Figure 2. For all species, Cd had a significant effect on ΦpsII after 19 h of exposure. The values of ΦpsII decreased with increasing Cd concentrations. P. mesolepta was particularly sensitive at a low concentration as ΦpsII reached values <80% of the control at the lowest Cd concentration (C1). In contrast, such levels of photosynthesis inhibition (<80% of the control) were reached only at C4, C5, and C6 for G. truncatum, N. palea, and M. atomus, respectively. Maximal inhibition was reached at the highest Cd exposure (C6) and was higher for N. palea (27.5 ± 4.0% of the control) compared to the three other species (50.3 ± 5.8, 57.9 ± 3.0, and 65.0 ± 7.0% of the control, respectively, for P. mesolepta, G. truncatum, and M. atomus). Hence, P. mesolepta was the most sensitive species at an environmental relevant Cd concentration (C1) while N. palea was the most sensitive at the highest concentration (C6) not typically encountered in natural environments.
In order to rank the four diatoms based on their sensitivity to Cd, we compared their EC25 (concentration needed to affect 25% of ΦpsII compared to the control) (Table 1). The Cd treatments created stressful conditions for cell productivity. A direct impact of Cd on the photosystem of diatoms should not be evident (as opposed to herbicide exposure). Thus, impacts on productivity are likely secondary stress events [9].
M. atomus (EC25 = 2394 µg/L) appeared to be more tolerant than N. palea (EC25 = 1179 µg/L), which was itself more tolerant than G. truncatum (EC25 = 606 µg/L). Lastly, P. mesolepta (EC25 = 9 µg/L) was by far the most sensitive species to Cd. These results are in accordance with the literature because N. palea and M. atomus have been encountered in metal contaminated environments ([9,34] referred to as Mayamaea permitis in the review). Pinnularia mesolepta is not recognized as a metal tolerant species, even though other taxa like Pinnularia parvulissima have been reported in waters with high Zn and Cd concentrations [35].
3.2. Chronic Cd Exposure Experiment
3.2.1. Cadmium Concentration in Growth Medium
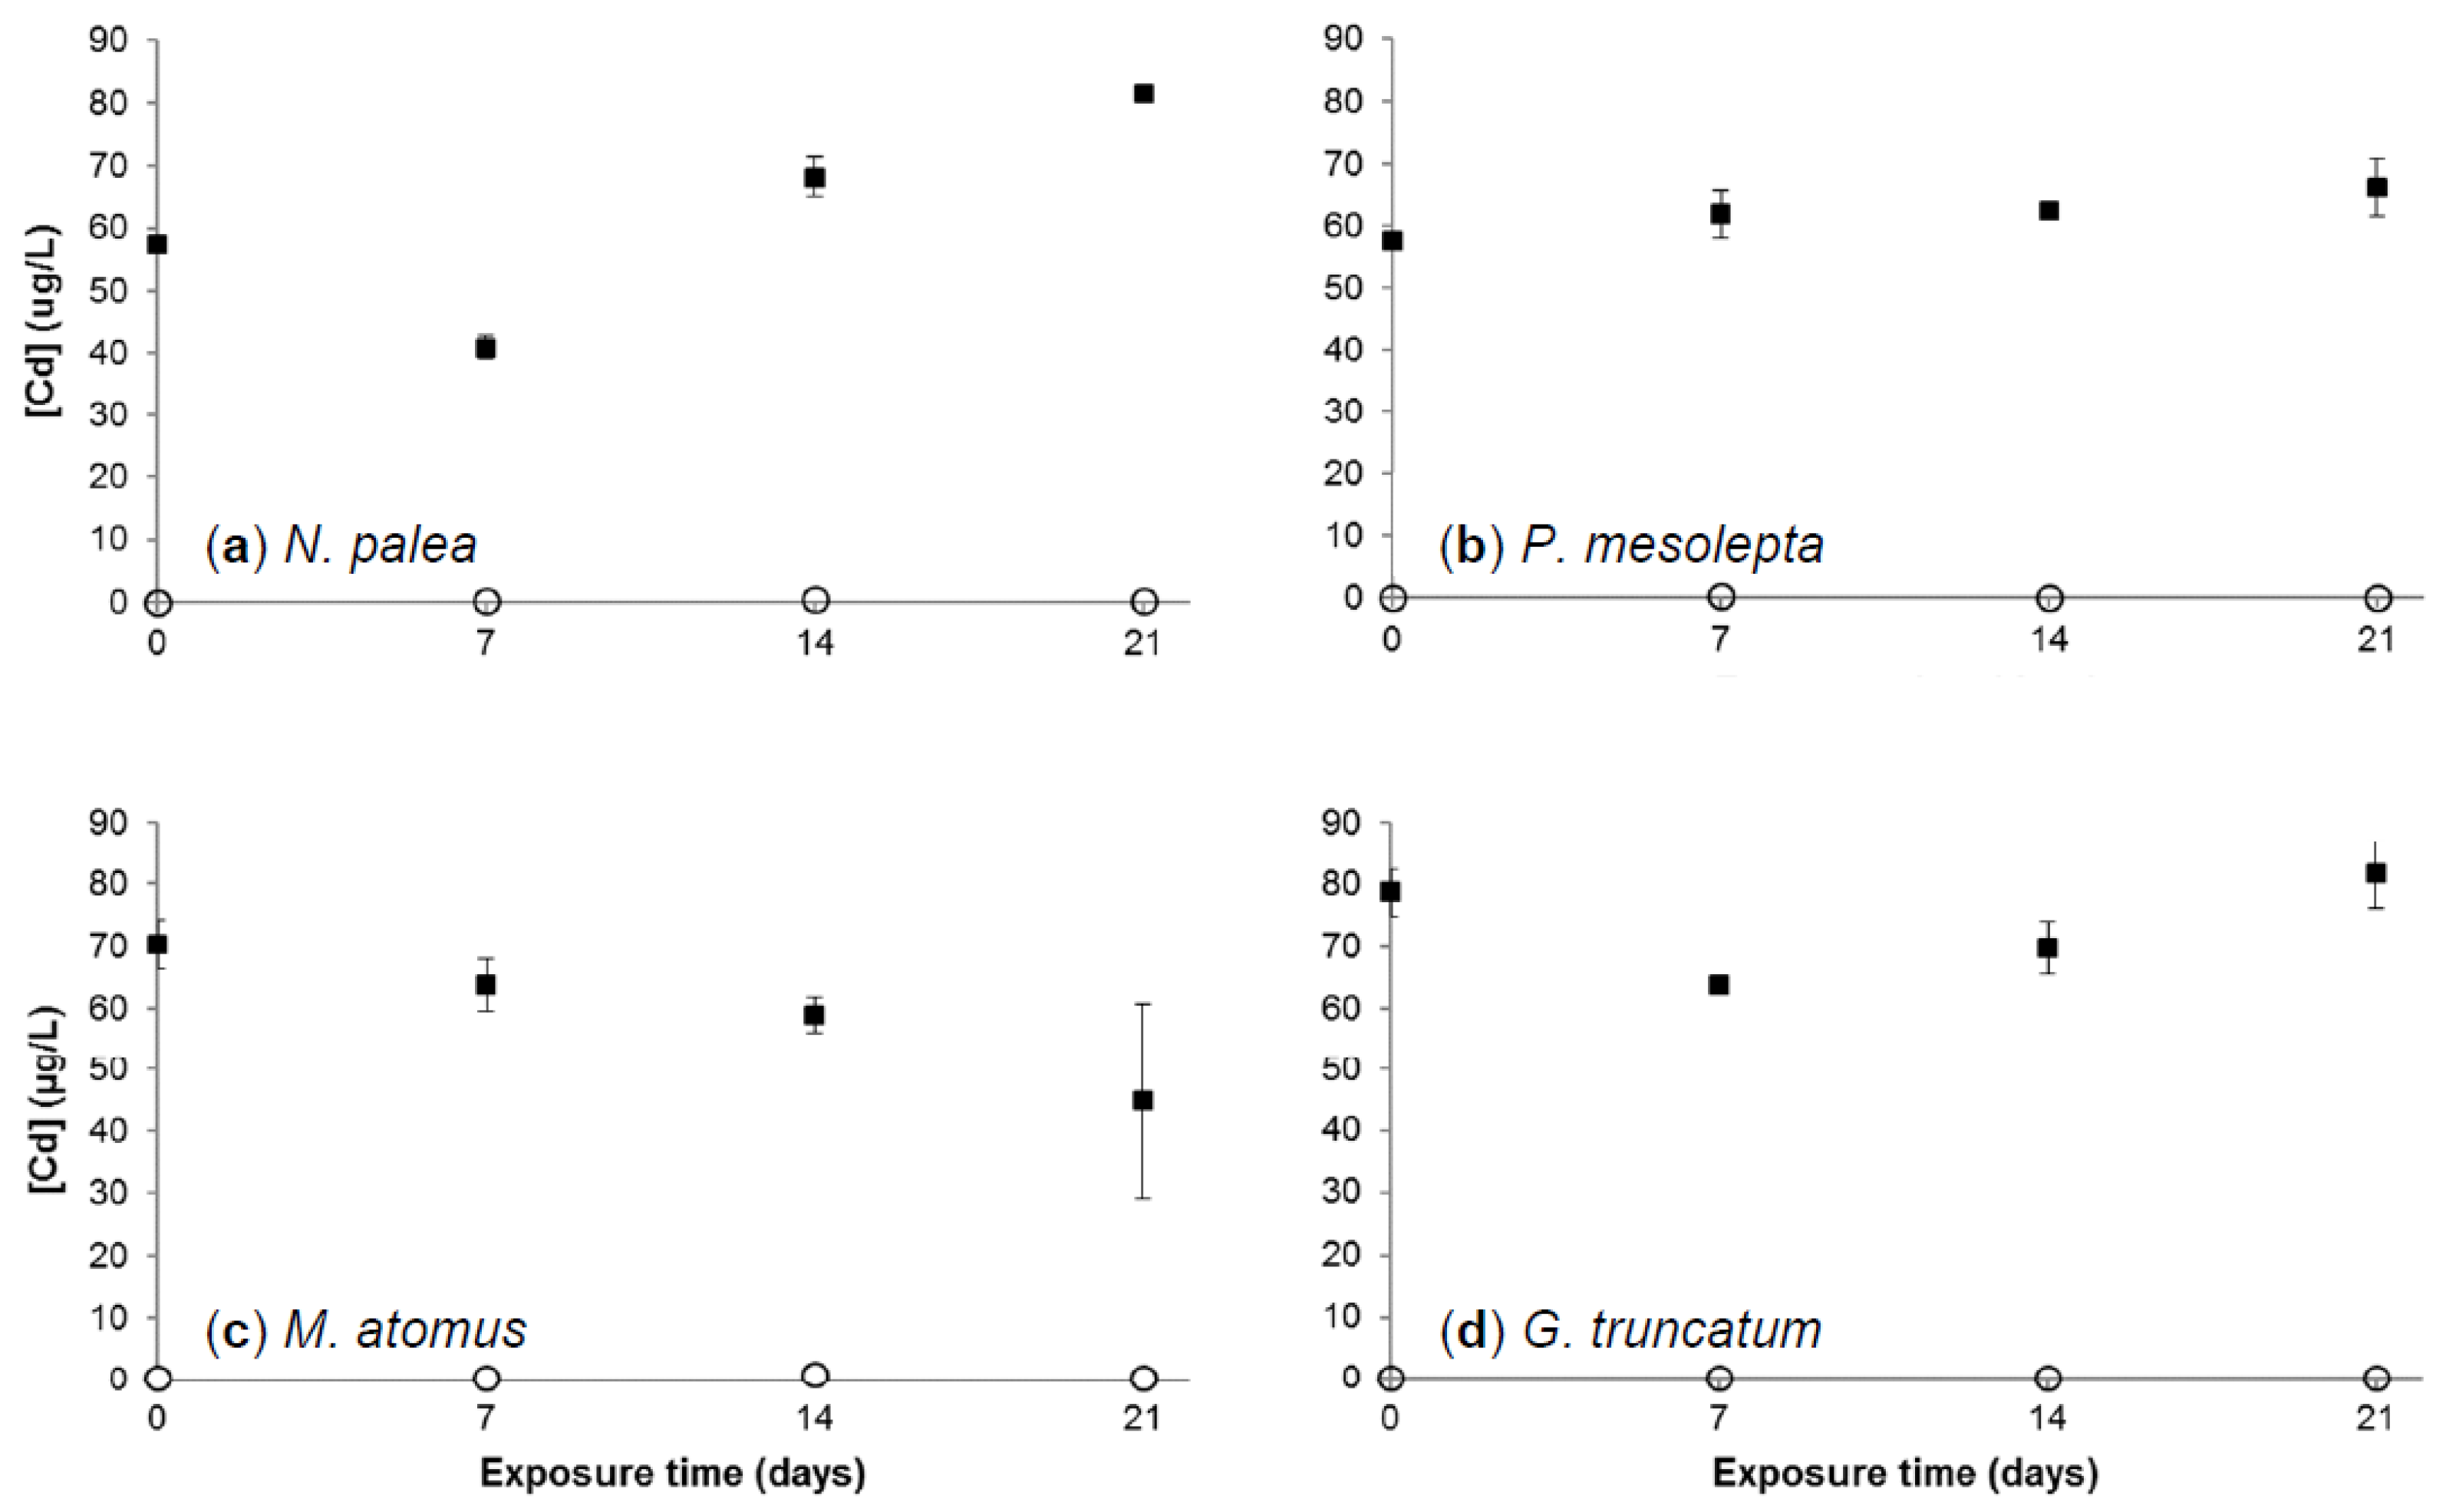
Dissolved (<0.2 µm) Cd concentrations for the two different treatments (control and Cd) are plotted against time (Figure 3) for the experiment with the four diatom species. During the 21 days of exposure, mean Cd concentrations in the control treatment growth medium were always inferior to the quantification limit (0.35 µg Cd/L). Dissolved Cd concentrations in exposure treatments at day 0 were 57.3 ± 0.8, 57.7 ± 1.3, 70.2 ± 3.9, and 78.6 ± 3.8 µg Cd/L, respectively, in the cultures of N. palea, P. mesolepta, M. atomus, and G. truncatum. Measured concentrations were lower than nominal concentrations. This result could be explained by Cd adsorption to the container walls and to possible iron precipitates due to the absence of EDTA in the exposure medium [29]. Moreover, the measured concentrations were different, depending on the species exposed, which reveals different trends in dissolved Cd concentrations in growth medium even at the first sampling time of 1 h. These observed losses could be linked, among other factors, to Cd adsorption on extracellular polymeric substances (EPS) produced by diatoms or to Cd internalization inside the cells.
The dissolved Cd concentrations varied with time and depended on the species exposed. In N. palea and G. truncatum cultures, similar decreasing trends were observed from day 0 to 7, which was followed by an increase from day 7 to 21. In contrast, Cd concentrations in M. atomus cultures showed a tendency to decrease from day 0 to day 21. In P. mesolepta cultures, Cd concentrations remained stable over the entire experiment. In order to understand these variations in Cd concentrations, the results have to be linked to growth and bioaccumulation data.
3.2.2. Effects of Cadmium on Diatoms’ Growth Kinetics
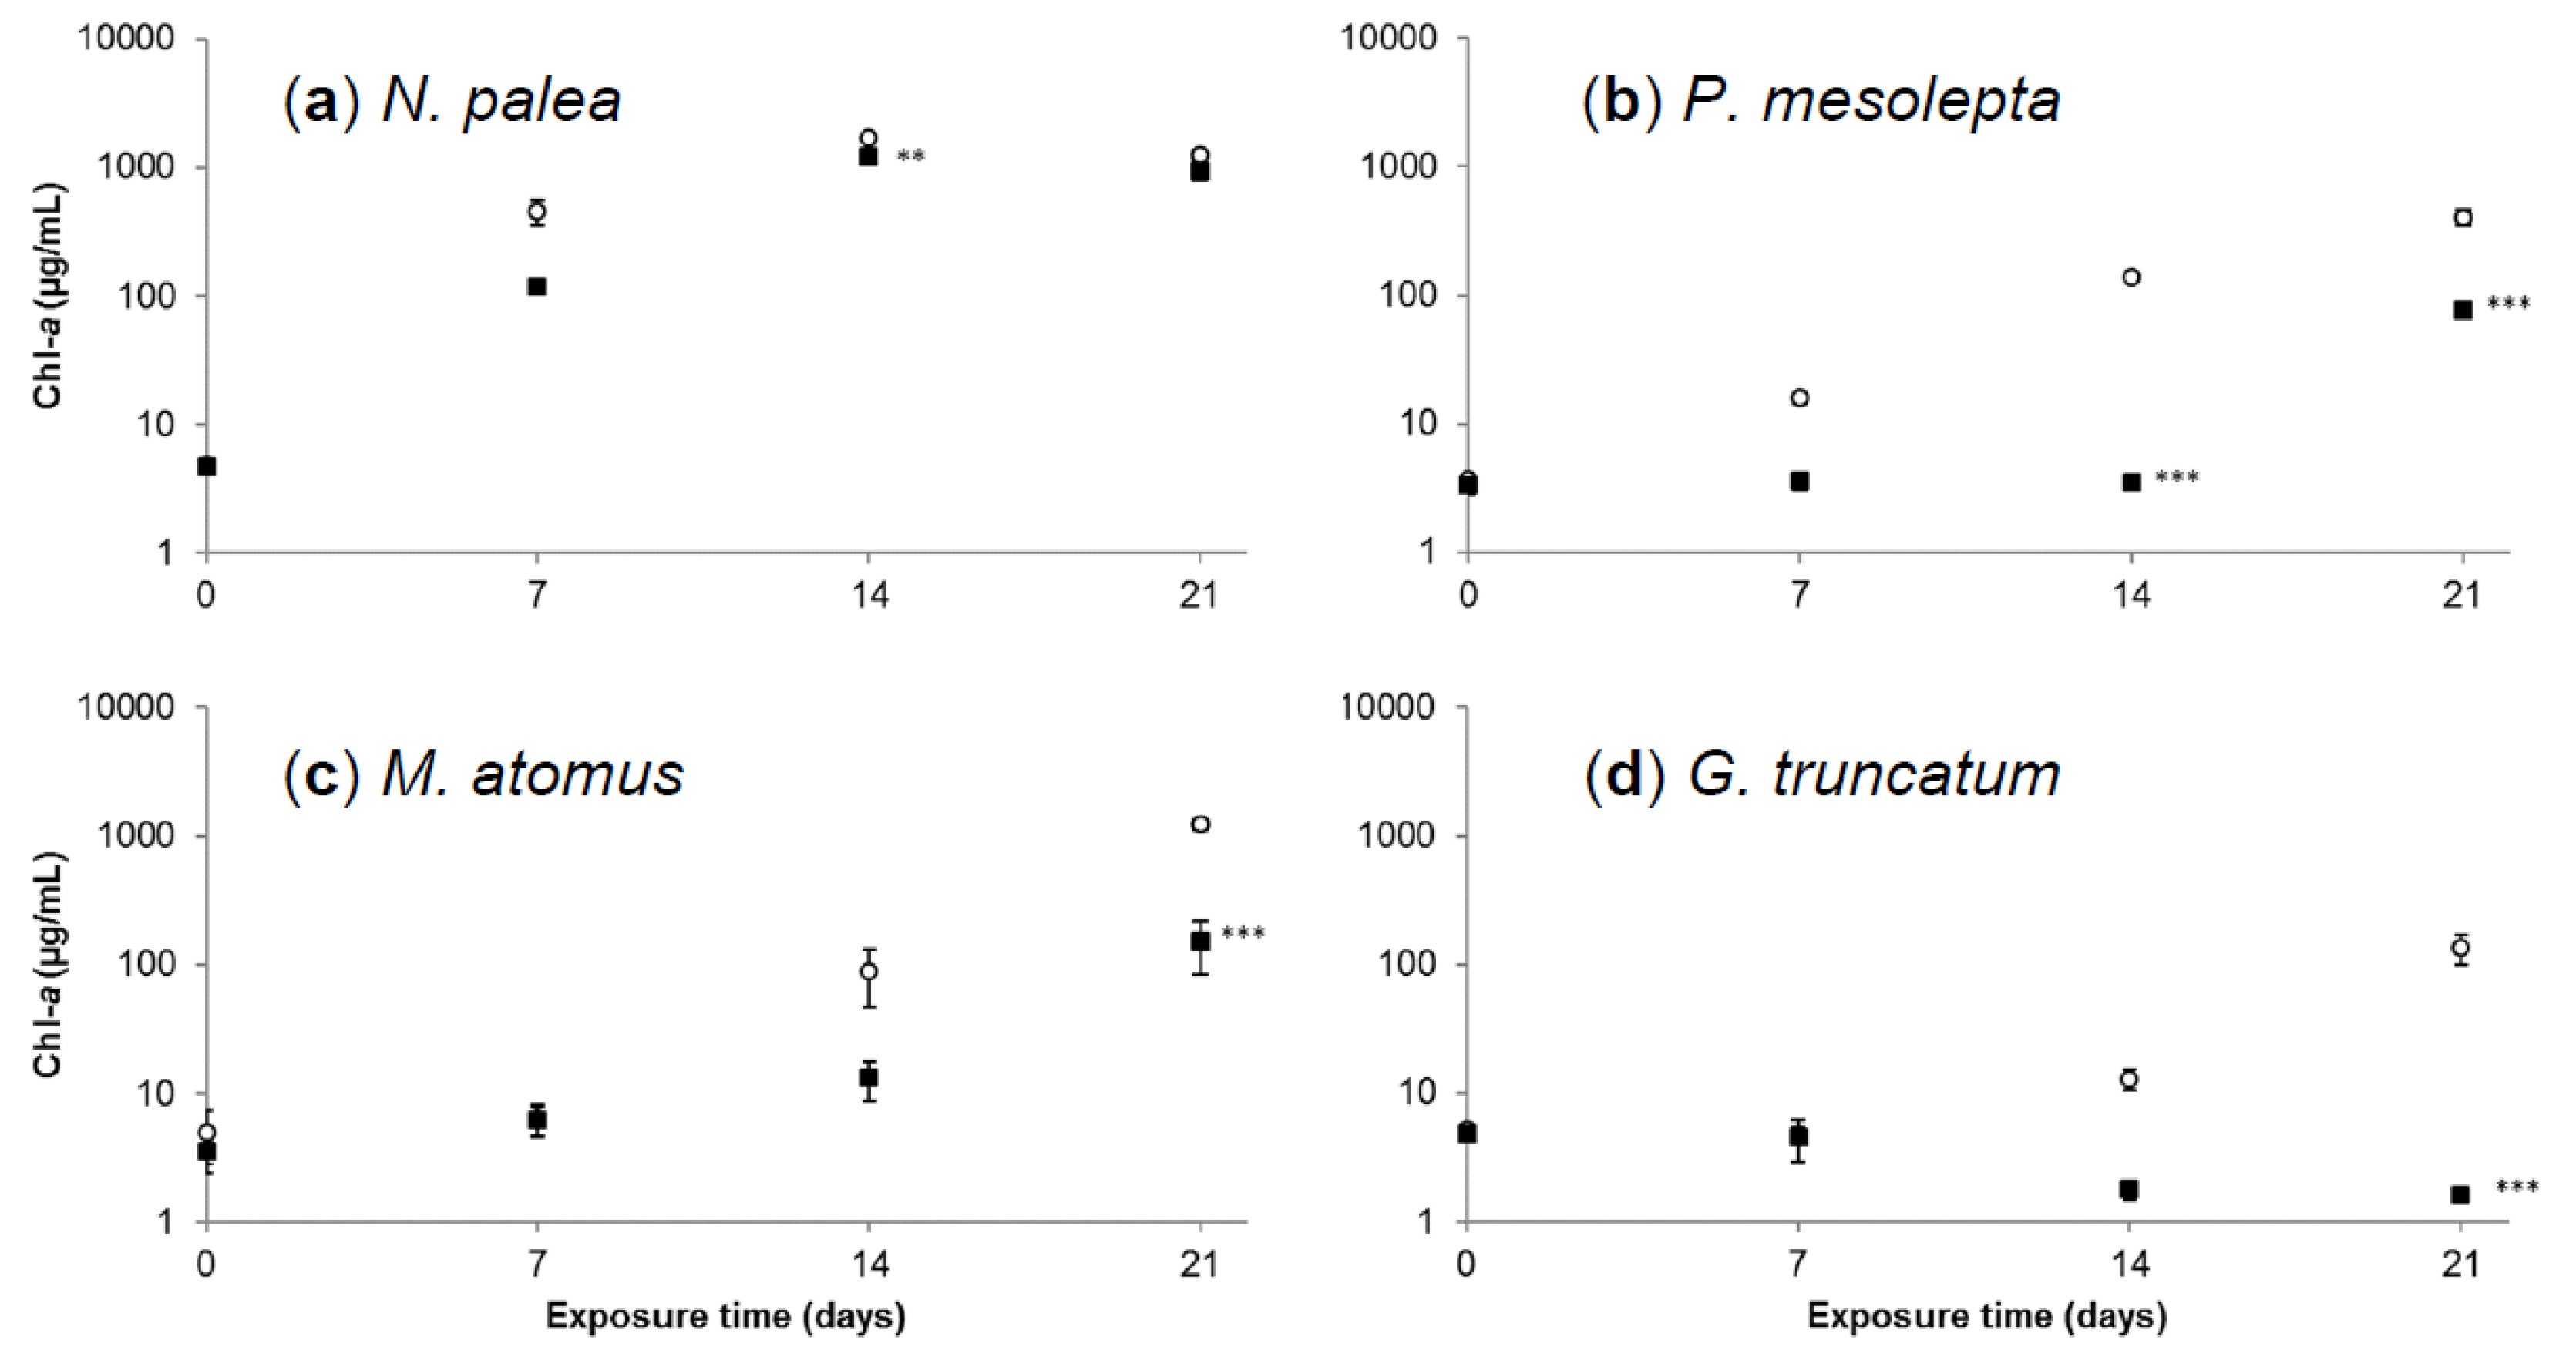
Total Chl-a as a function of time for each species is presented in Figure 4. In control conditions, the Chl-a values increased from day 0 to day 14 to reach a maximal value of 1690 ± 170 µg Chl-a/mL and then decreased from day 14 to day 21 for N. palea. In contrast, such a decrease in Chl-a concentration at the end of the experiment was not observed for P. mesolepta, M. atomus, and G. truncatum cultivated under control conditions. This could indicate that nutrient concentration became limiting in N. palea cultures while still being sufficient to maintain growth for the three other species. Maximum Chl-a concentrations were reached at day 21, with 402 ± 53, 1220 ± 120 and 134 ± 35 µg Chl-a/mL for P. mesolepta, M. atomus, and G. truncatum, respectively. This result illustrates the marked difference in growth kinetics between diatom species. We found that the P. mesolepta growth kinetics was low in comparison to N. palea and M. atomus. This was not surprising since small species like N. palea and M. atomus tend to have a high growth rate. Actually, an inverse relationship between growth rates and cell sizes are often observed [36]. It is generally accepted that large-size diatom species have longer cell cycles than smaller ones [36]. Furthermore, P. mesolepta is not an abundant species in natural populations, so we would not expect to see fast growth rates in this study.
Cadmium exposure negatively affected growth for all four species. The general shape of the growth curves for N. palea was the same under Cd and control treatments. However, Chl-a concentrations were lower at day 14 for the Cd compared to the control treatments. Effects of Cd were observed from day 14 and from day 21 for P. mesolepta and M. atomus, respectively, with lower Chl-a concentrations for the Cd treatment compared to the control. For G. truncatum, growth was not observed in contaminated cultures.
After 21 days of exposure, N. palea, P. mesolepta, and M. atomus were able to grow when exposed to Cd concentrations of 100 µg Cd/L, which is a concentration representative of highly contaminated sites [23,24]. In particular, N. palea and M. atomus cultures reached higher concentrations at the end of the experiment. This result is in accordance with the literature suggesting that N. palea and M. atomus are metal tolerant species because they are frequently encountered in metal contaminated sites [9,34]. No growth was observed for G. truncatum exposed to Cd during the 21 days of experiment, which suggests that this species is metal sensitive.
3.2.3. Cadmium Bioaccumulation in Diatoms
Mean cadmium concentrations in diatoms at the different sampling times for the Cd100 treatment are presented in Table 2.
In the control treatments, Cd concentrations in diatom cells were below the detection limit at all sampling times (data not shown), while, for the Cd100 treatment, concentrations were below the quantification limit at day 0. The bioaccumulation of Cd in N. palea was maximal after seven days of exposure (25.9 ± 3.1 ng Cd/mg Chl-a), decreased at day 14 (5.29 ± 0.92 ng Cd/mg Chl-a), and then remained relatively stable to reach 8.74 ± 0.77 ng Cd/mg Chl-a at day 21. For M. atomus, bioaccumulation was quantifiable after 14 days of exposure and reached 201 ± 32 ng Cd/mg Chl-a. Bioaccumulation in M. atomus then decreased at day 21 (73 ± 14 ng Cd/mg Chl-a). The decrease in bioaccumulation values observed for N. palea and M. atomus could be explained (i) by excretion of Cd out of the cell [37,38], (ii) by biodilution due to cell division-based population growth, and (iii) by potential changes in metal bioavailability over time due to binding of Cd to cell exudates [39]. These mechanisms likely occurred together. Nevertheless, in N. palea cultures, bio-dilution can be excluded since growth was not observed between day 14 and day 21. Our results are in accordance with those of Kim Tiam et al. [29] where a decrease in bioaccumulation was observed over time in N. palea cultures exposed to Cd. On the other hand, our results contrast with those of Kim Tiam et al. [40] and Arini et al. [41] who observed that cadmium bioaccumulation was continuously increasing over time (14 and 21 days of exposure, respectively) in monocultures of Eolimna minima and Planothidium frequentissimum. These results suggest that different diatoms do not have the same efficiency to excrete metals out of the cell. Excretion mechanisms are dependent of the phyto-chelatin production, as shown by Lee et al. [37], who exposed the marine diatom T. weissflogii to Cd at a high concentration. The authors observed the efflux of Cd and phyto-chelatin from the cell and hypothesized that diatoms export the phyto-chelatin-cadmium complex as a detoxification mechanism. It was also demonstrated that the sensitivity of diatoms and other micro-algae to metals was linked to their capacity to synthetize phytochelatin and other thiols [42,43]. Others studies have shown that phytochelatins are also produced by green algae [44,45] and detected at the level of the entire biofilm [46].
The Cd intracellular concentrations in P. mesolepta were below a detection limit at day 7 and day 14 and reached 12.36 ± 0.87 ng Cd/mg Chl-a at day 21. From these results, it is not possible to surmise variations in Cd accumulation for this species because the concentrations were the below detection limit at day 7 and day 14. These low concentrations could be due to the low biomass available for quantification (about 1400 µg Chl-a at day 14). The same reasoning is valid for G. truncatum for which internalized Cd concentrations were below the quantification limit at all sampling points (maximal biomass at day 21 with about 1300 µg Chl-a). Hence, for these two species, the available biomass was likely insufficient for Cd quantification. In order to improve the assessment of bioaccumulation variations over time and to relate theses variations to possible detoxification mechanisms, we recommend to increase algal biomass for Cd measurements (from our results, at least 4000 µg Chl-a is needed for a reliable quantification). Nevertheless, since impacts on growth kinetics (see Section 3.2.2) were observed in all cultures, all four species likely internalized Cd since it is generally admitted that compounds need to enter the cell to exert toxic effects [25]. Hence, the Cd concentrations below the quantification limit likely resulted from an insufficient biomass used for analyses.
The bioaccumulation results observed together with the growth kinetics can, in part, explain the variations in growth medium Cd concentrations with time. For N. palea, the decrease in intracellular Cd concentration was associated with an increase in dissolved Cd concentration. For M. atomus, the concomitant decrease in intracellular Cd concentration and dissolved Cd concentration may be partly explained by bio-dilution due to culture growth. However, in order to adequately document variations in dissolved Cd concentrations, it would be important to perform mass-balance studies. This approach allows for a more complete picture of metal distribution in the different compartments considered (absorbed into the cells, adsorbed on EPS, cells, or other particular matter (e.g., nutrients)).
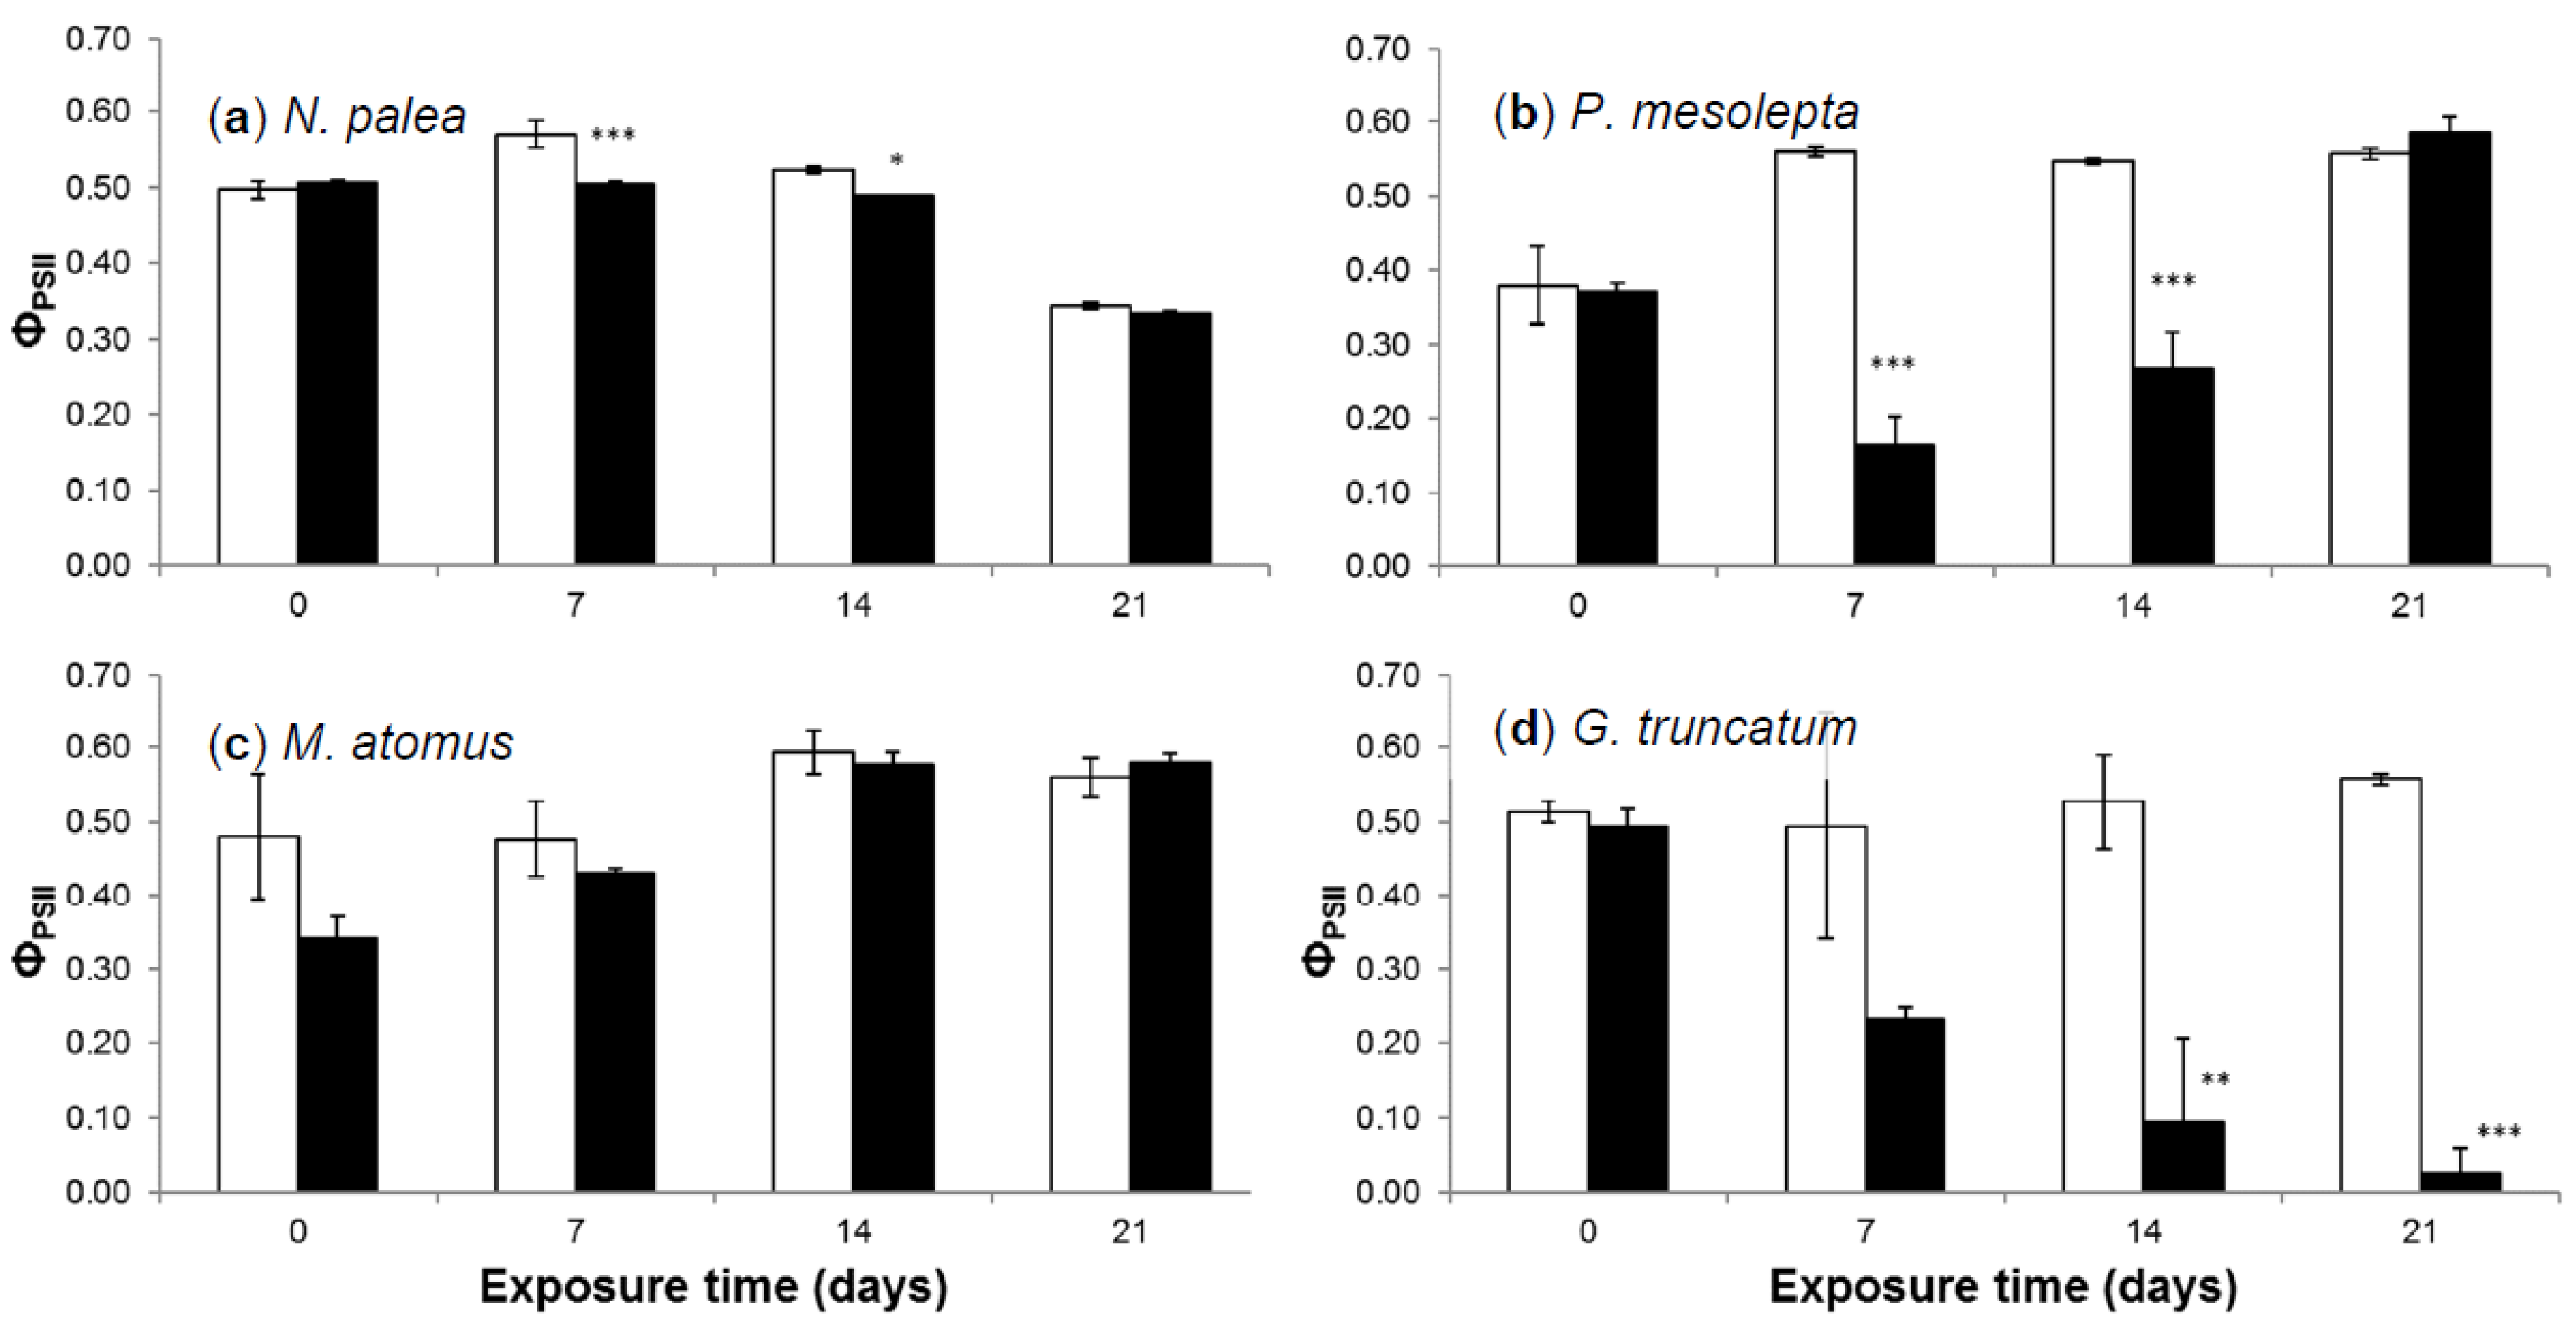
3.2.4. Effective Quantum Yield
Measured ΦpsII values for the control and cadmium treatments for the four species are presented in Figure 5. For the controls, ΦpsII values were always superior to 0.38 ± 0.05 (P. mesolepta at day 0), which reveals a good photosynthetic state of the cells. These observations were in the range of those recorded for non-exposed phototrophic biofilms [47,48,49]. For N. palea, values increased slightly from day 0 to day 7, returned to initial values at day 14, and decreased from day 14 to day 21. The slight decrease in ΦpsII values for the control at day 21 compared to previous sampling times may be explained by the physiological state of cells that were in the senescence phase (e.g., decrease of Chl-a concentration from day 14 to 21 in both conditions, Figure 4). For P. mesolepta, M. atomus, and G. truncatum, ΦpsII values increased between day 0 and day 21. Similar results were observed by Kim Tiam et al. [29] where the authors hypothesized that when the lower values of effective quantum yield observed at day 0, it was compared to the following sampling time that was likely due to a slight photoinhibition caused by the low cell concentration at the beginning of the experiment (see also Qiang et al. [50]).
Significant effects of Cd exposure were observed on ΦpsII values for N. palea, P. mesolepta, and G. truncatum. Cd had only a low effect on N. palea (88.3 ± 0.7% and 93.6 ± 0.1% of the control at day 7 and 14, respectively). This relatively low Cd effect suggests that N. palea maintained consistent photosynthesis mechanisms when exposed to Cd, and, hence, its ability to cope with stress generated by Cd exposure at concentrations representative of heavily contaminated aquatic environments. Note that diatom growth kinetics limited observations on the impact of Cd before day 14, which highlights the interest of Chl-a fluorescence parameters as early markers of metal stress or toxicity [10]. Conversely, Cd had strong effects on ΦpsII for P. mesolepta and even stronger effects for G. truncatum. The ΦpsII values for P. mesolepta were affected by Cd at day 7 (29.2 ± 6.9% of the control), increased at day 14 (48.8 ± 9.2% of the control), and reached values comparable to those of the control at day 21. This decrease in the response to Cd with time could be attributed to triggering efficient detoxifying mechanisms allowing for the survival and growth of cells (but low growth compared to the control). Out of the four species, G. truncatum was the most affected by Cd. The ΦpsII values continuously decreased from day 0 to day 21 to reach extremely low values (4.8 ± 5.9% of the control) at the end of the experiment. This species may not have efficient mechanisms to cope with stress exerted by Cd at concentrations close to 100 µg Cd/L. This almost completed inhibition of ΦpsII had an impact at a more integrative level since no growth was observed over the 21 days of the experiment for G. truncatum.
In our experiment, it is difficult to evaluate the relationship between photosynthetic capacities and bioaccumulation stress because the bioaccumulation values are only available for a limited number of samples (see Section 3.2.3). At the population level, it has been shown that bioaccumulation and toxicity are correlated [29]. In this previous study, the effects of Cd on photosynthetic capacities of the diatom N. palea were maximized when bioaccumulation was maximal. Hence, the more diatoms accumulate Cd, the more the toxic effects are marked. Conversely, it has also has been shown that the toxicity of Cd could be more related to its internal partitioning than to overall bioaccumulation [43]. These authors evaluated the sensitivity of Cd to two freshwater green algae. They observed that the more resistant algae were also the ones with the higher bioaccumulation. Their results showed that subcellular Cd distribution and the synthesis of metal-binding thiolated peptides could explain, at least partially, the different sensitivity to Cd of two freshwater green algae. Hence, they showed that toxicity could be modulated by intracellular detoxification mechanisms. Such intracellular detoxification mechanisms were not evaluated in this scenario but are likely to occur and explain, at least in part, the differences between the four studied species. G. truncatum was clearly affected by Cd, as revealed by the absence of growth (Section 3.2.2) and the extremely low ΦpsII values (Section 3.2.4). These results suggest that G. truncatum does not have efficient mechanisms to cope with stress exerted by Cd at concentrations close to 100 µg Cd/L. Hence, we hypothesize that this could be linked to a subcellular distribution of Cd preferentially in cellular pools potentially associated with toxicity (i.e., heat denaturable proteins, organelles) than with detoxification (i.e., granules, heat stable proteins) and/or a low synthesis of metal-binding thiolated peptides [43].
3.2.5. Deformities
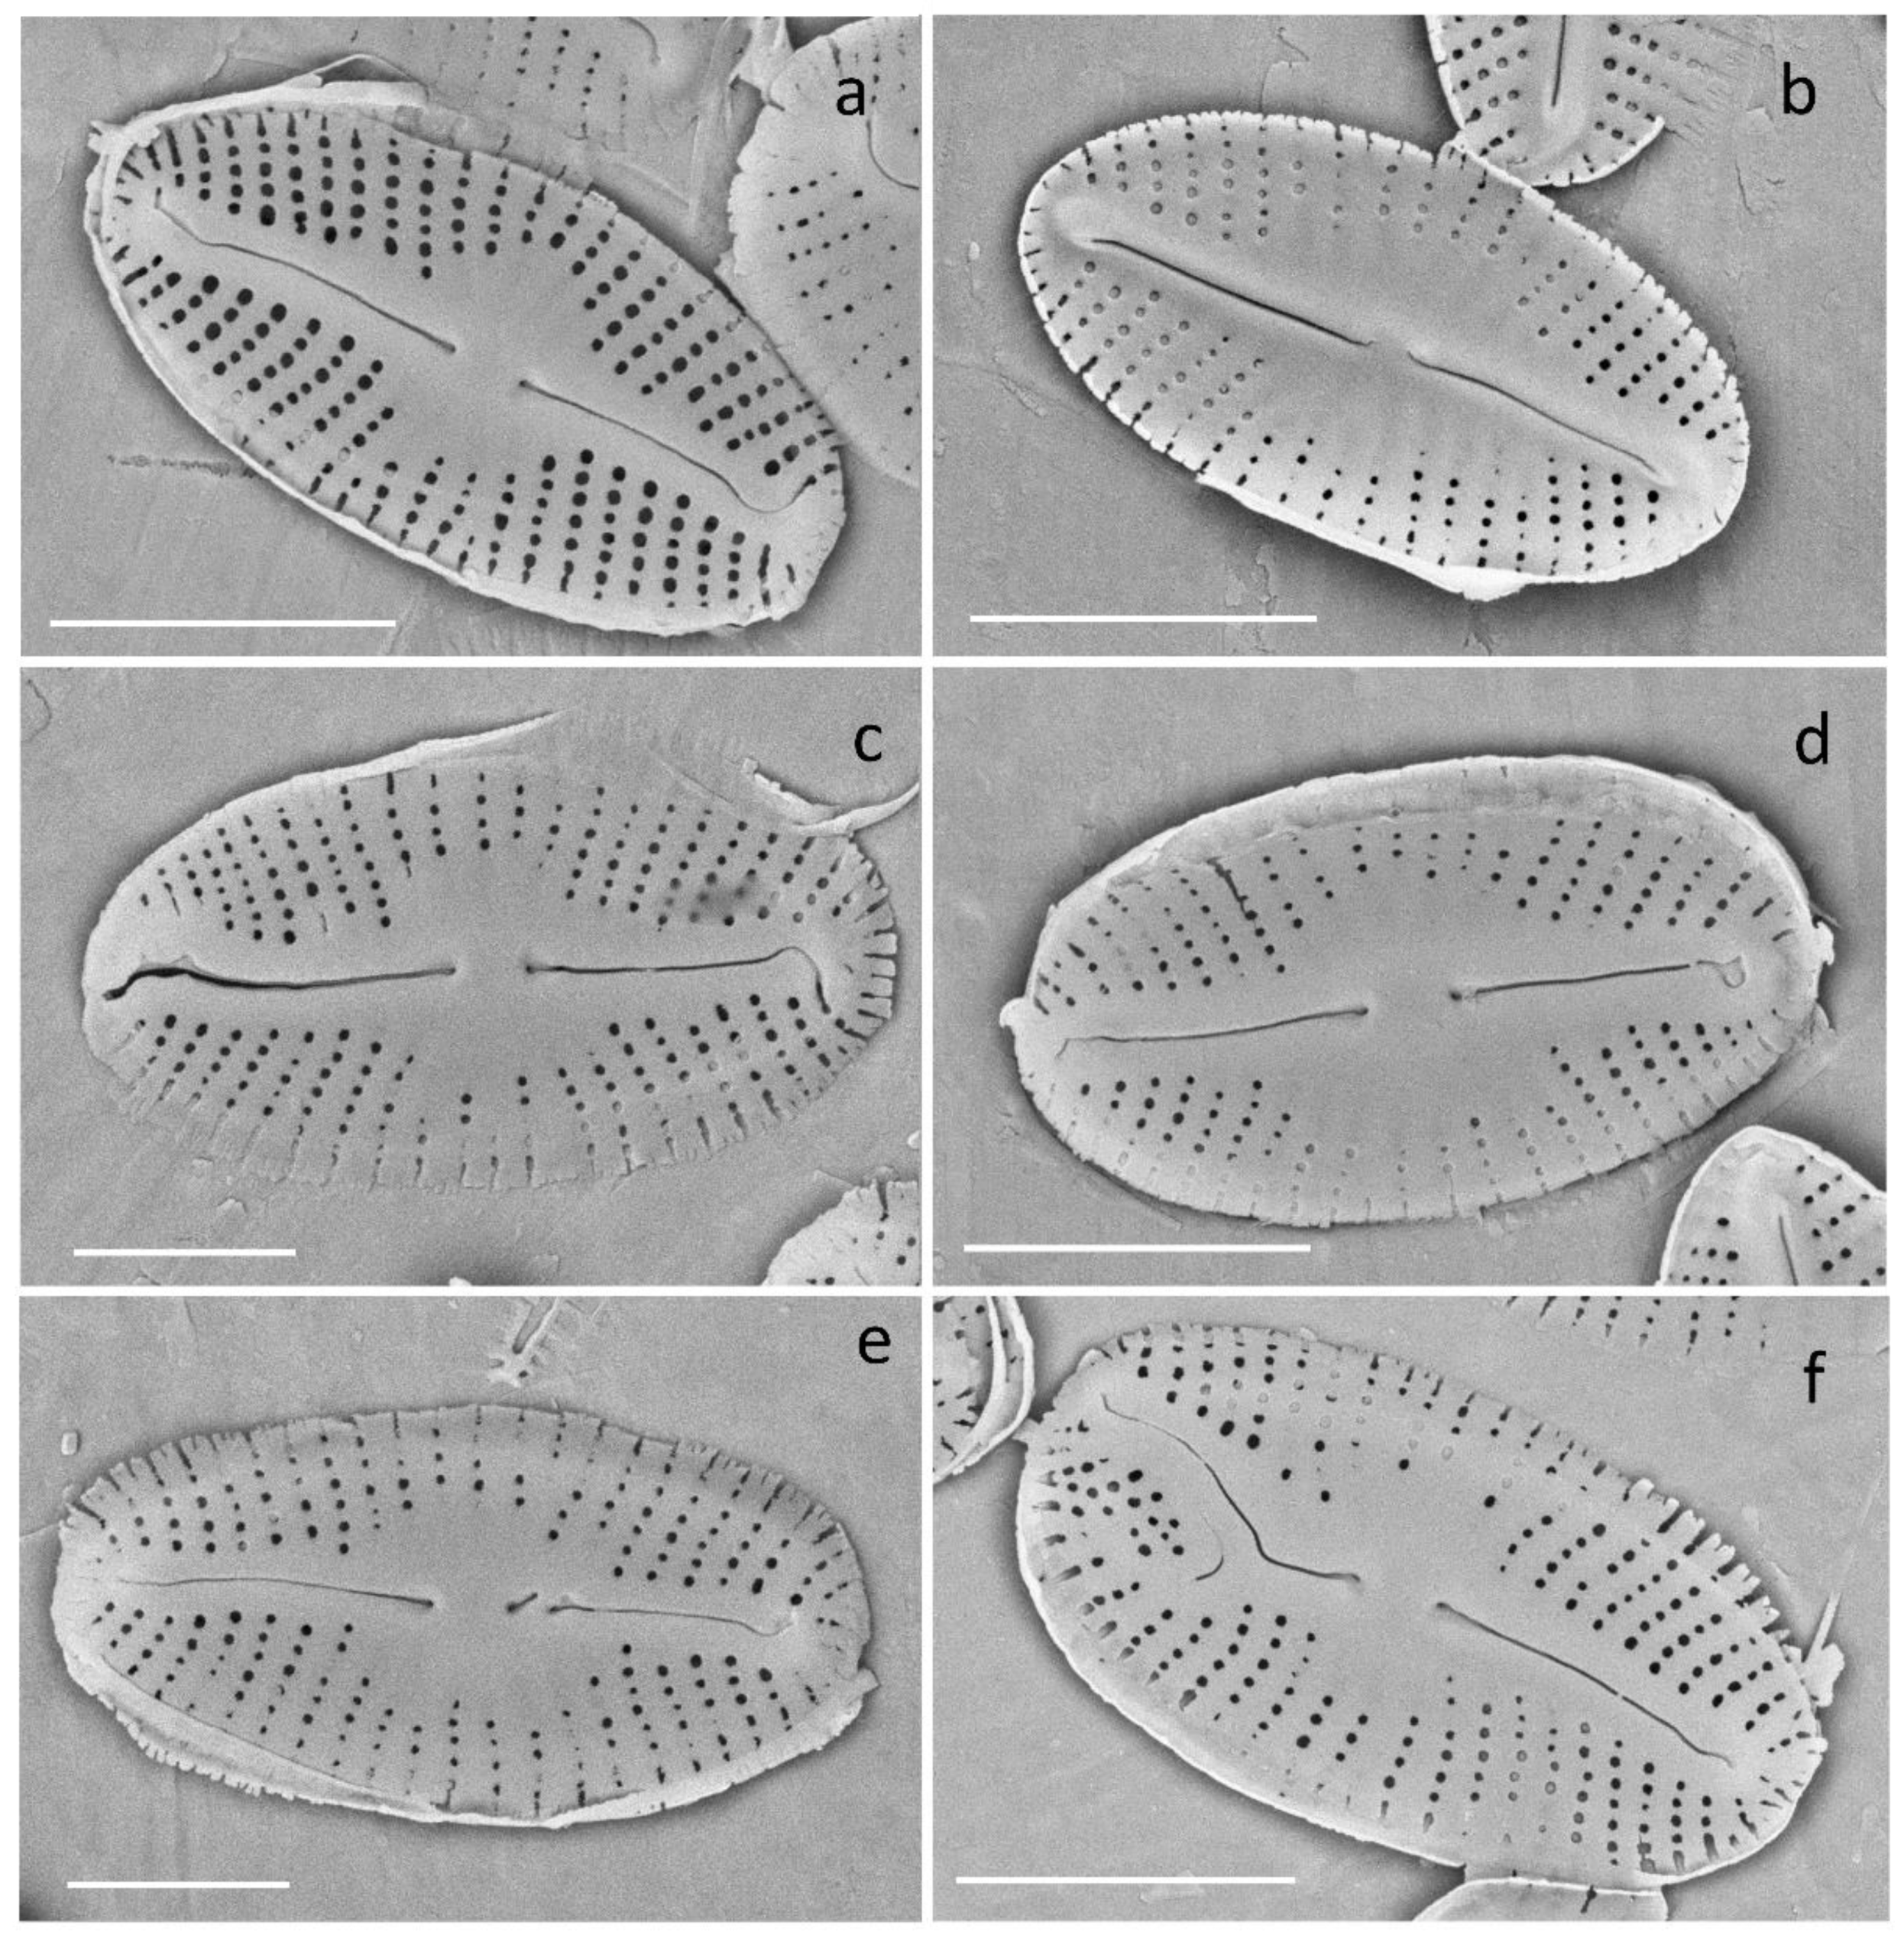
Examination of the samples under the light and scanning electron microscopes revealed the presence of deformities in the control cultures of the four diatom species. Deformities in diatoms under culture conditions have frequently been observed [51]. These deformities can be caused by unnatural exposure levels to nutrients and micronutrients and/or the optimized (accelerated) conditions for cell/population growth. Among the four species studied, G. truncatum showed the highest frequency of abnormal valves in the controls (15.6 ± 1.2%). This species was purchased from an alga collection with an unknown age of origin. The purchased culture showed multiple problematic individuals even before we started culturing for the experiment. Because most deformities observed in the control samples of G. truncatum affected the general shape of the valves in the study, this type of deformity (valve shape) was not considered for the comparison of percentage deformities between the controls and the Cd treatments. M. atomus observed under the SEM revealed a large proportion of individuals (roughly about 40%) with an atypical raphe where one end normally curved while the other end did not (Figure 6). Since this minor aberration was frequently encountered under control and treatment conditions, we did not consider this trait to be a deformity.
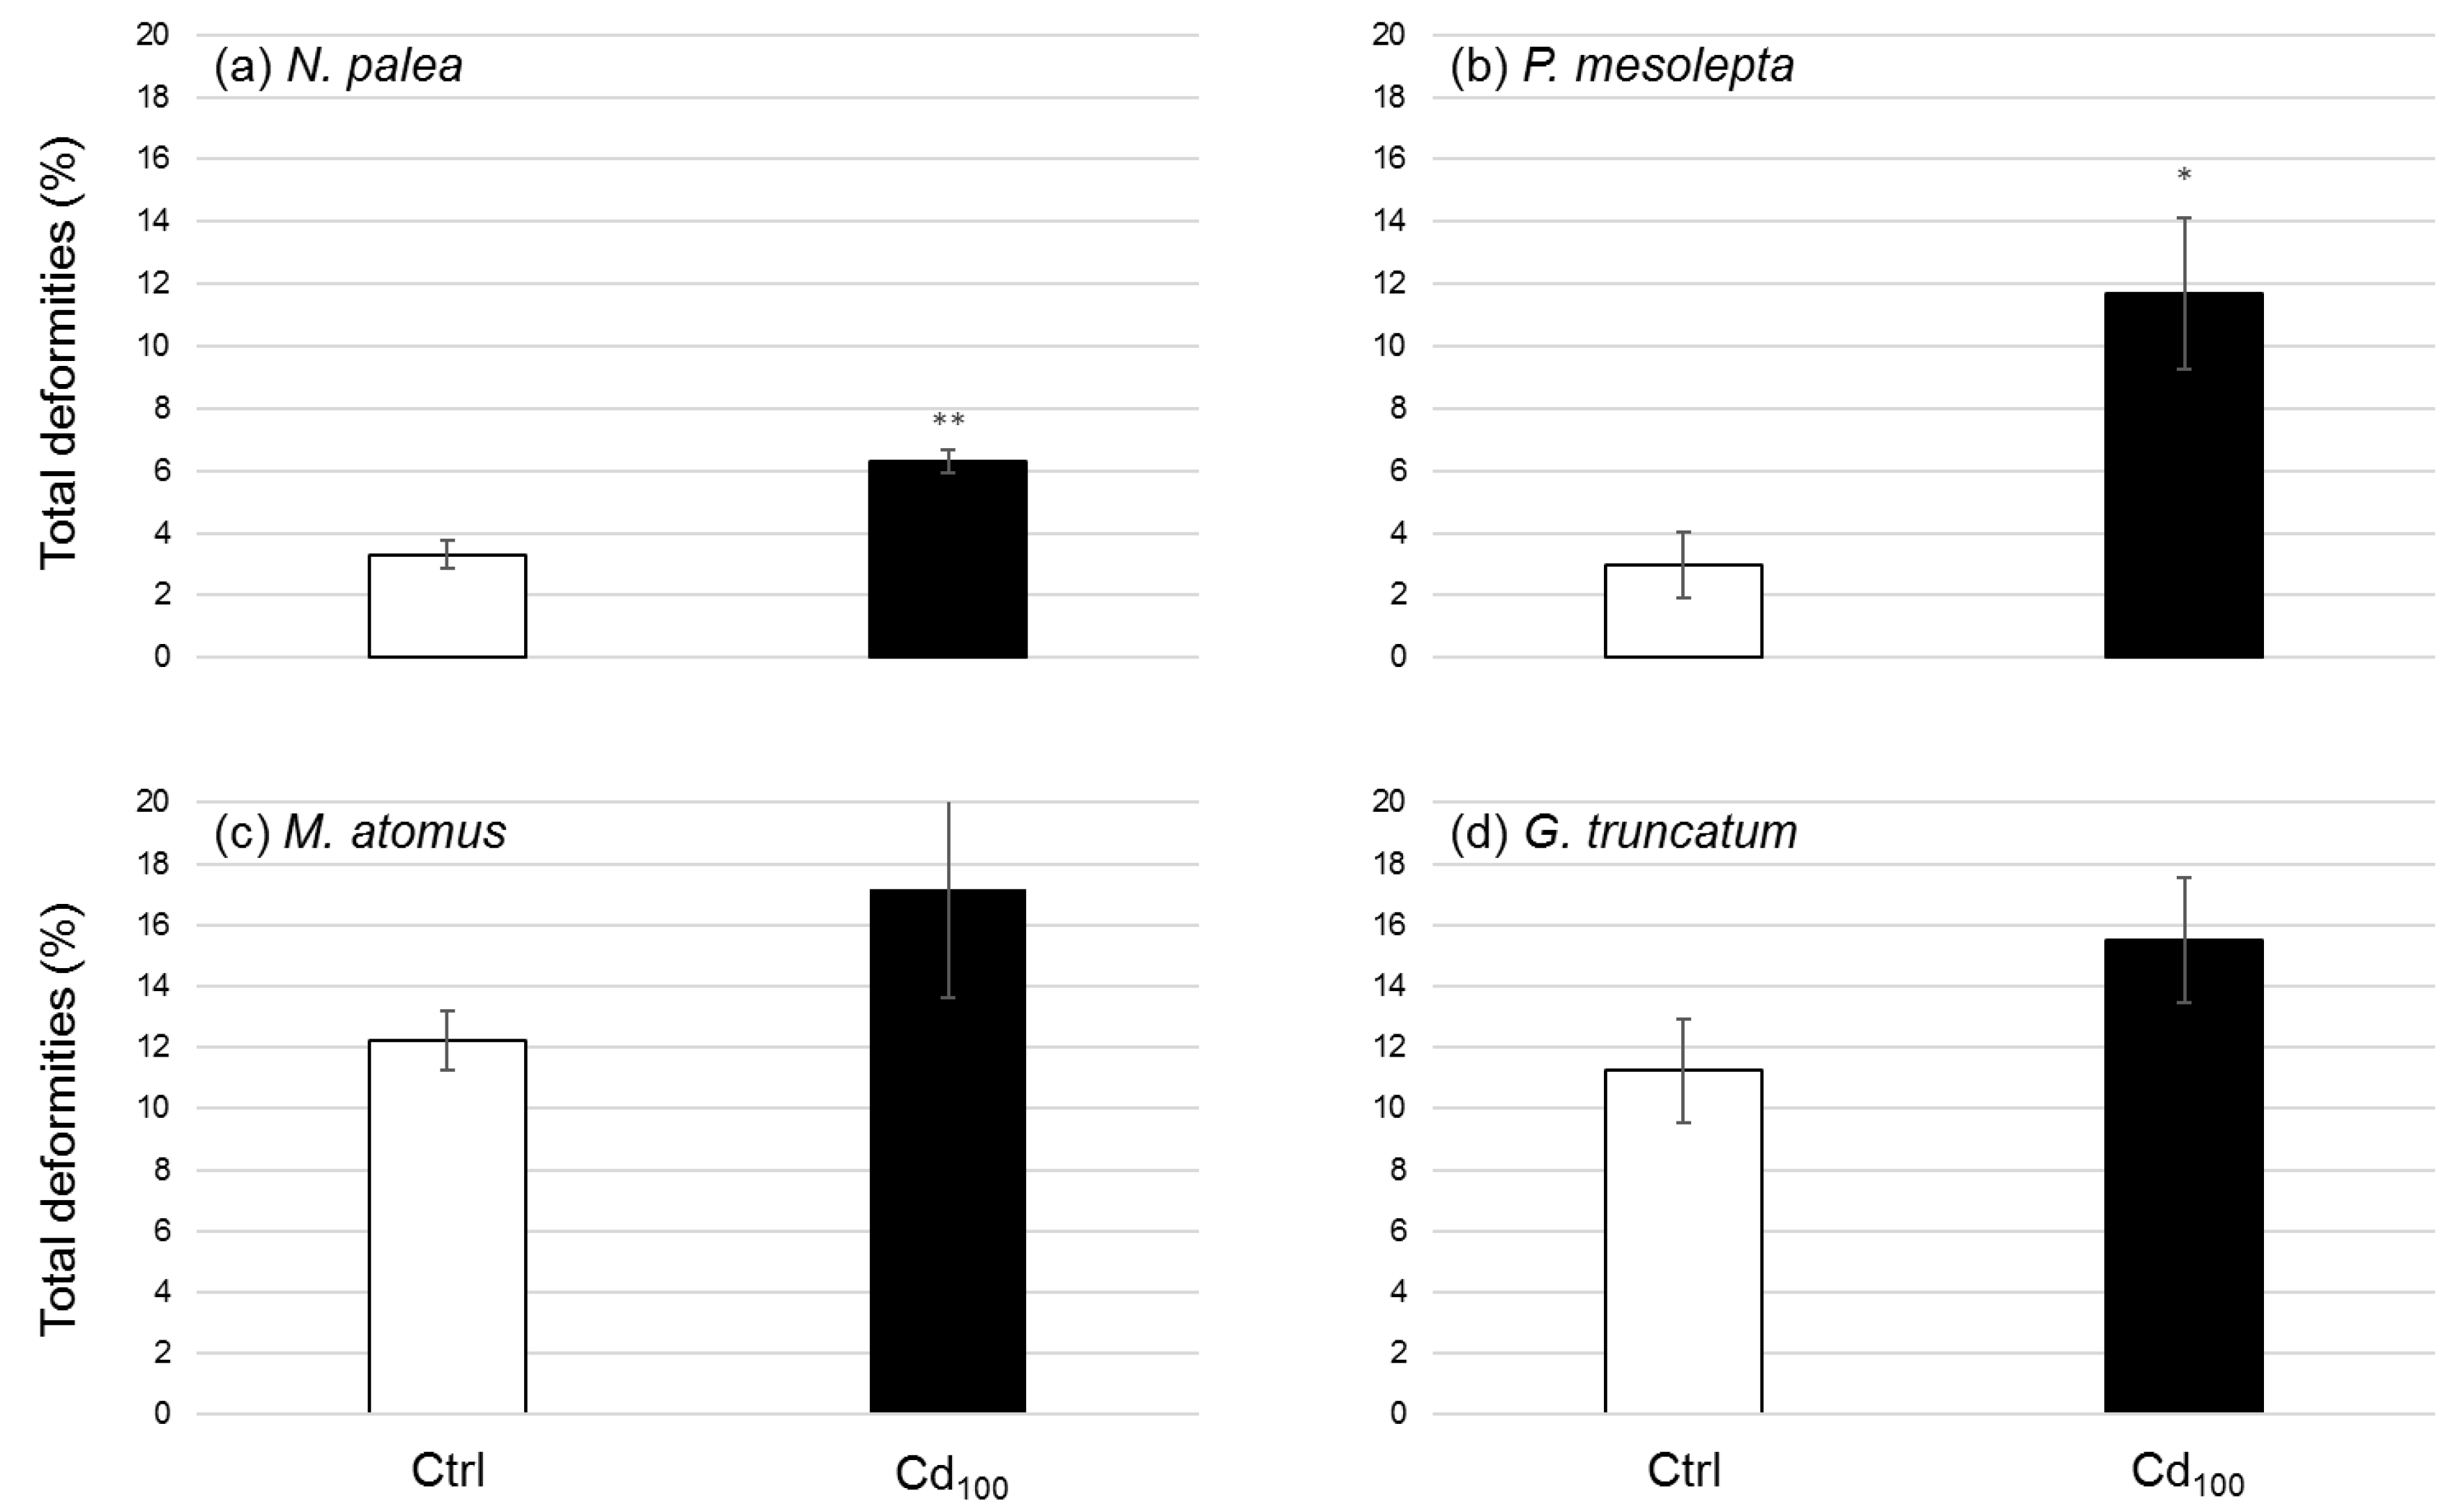
The number of deformities and their types are presented for each species (Table 3). Deformities were classified into different groups related to frustule formation (early, mid, or late morphogenesis) and the type of deformities (e.g., raphe interruptions, secondary raphe formations, striae interruptions, fibulae disruptions, asymmetrical deformed valve outlines, deformed terminal ends of the valve, and mixture of deformities). The most prominent deformities in M. atomus were raphe disruptions, and raphe canal deformities were the most common for N. palea. P. mesolepta showed frequent raphe and striae disruptions while G. truncatum showed no consistent deformities compared to the control (Table 3). The frequency of total deformities for control and Cd conditions is presented (Figure 7). P. mesolepta showed a significant increase (p < 0.05) in the amount of deformities in the treatment with approximately four times more deformities under the Cd treatment (Figure 7). N. palea and M. atomus showed mainly early morphogenesis (raphe and canal) disruptions, with 1.9 and 1.4 times more deformities compared to the control for N. palea (significant increase, p < 0.01) and M. atomus (no significant increase, p > 0.05), respectively. In the case of M. atomus and G. truncatum, the high number of deformities in the control created enhanced variability, which limited the evaluation of Cd impacts. The quality and age of the culture containing G. truncatum may explain the non-typical shape form for the species in control and treatments, which shows that the valves were already shape-altered prior to the study. The more tolerant species to environmental stress, N. palea and M. atomus, showed evidence of Cd stress, but it was the less tolerant P. mesolepta that had the greatest degree of deformities. This supports the observation that less tolerant species to environmental stressors will be the most impacted. It is worth noting that early morphogenesis deformities were more evident in the tolerant species, while more mixed (early–mid morphogenesis) deformities were present in the less tolerant P. mesolepta. Tolerant species appear to be more resistant to valve shape and stria changes.
Hence, our results showed that P. mesolepta was more impacted by Cd than N. palea and M. atomus. These impacts are measured by both quantity (percentage of abnormal cells) and severity (early and mid-morphogenesis deformities for P. mesolepta and mainly early deformities for N. palea and M. atomus). The deformity results together with results of diatoms’ growth kinetics make us wonder about the capacity for cells to divide when aberrations are present. We speculate that the early and mid-morphogeneis deformities observed in P. mesolepta cultures had an effect on diatom division by inducing a lower division rate or even by preventing cell division. Actually, almost nothing is known about the impact on growth kinetics of the presence of deformed cells in a diatom population. Do deformed diatoms have a lower division rate than non-deformed diatoms? From what degree of deformity severity are the damaged cells unable to survive?
4. Conclusions
The effects of Cd on four diatoms were evaluated through two experiments: a dose-response toxicity test and a chronic Cd exposure experiment. The results of the dose-response approach (Section 3.1) revealed differences in Cd sensitivity among the four species. M. atomus appeared to be more tolerant than N. palea, which was more tolerant than G. truncatum. The diatom P. mesolepta was the most sensitive species. The results of the chronic Cd exposure experiment (Section 3.2) based on the effective quantum yield and diatom growth kinetics revealed that N. palea was more tolerant than M. atomus, which was more tolerant than P. mesolepta. G. truncatum was, by far, the most sensitive species to Cd based on these later two end-points. Overall, the results from the two approaches were in accordance since they identified N. palea and M. atomus as the two most tolerant species to Cd, while P. mesolepta and G. truncatum were the most sensitive. Lastly, deformities showed that P. mesolepta (the more Cd-sensitive species) was the most structurally impacted while N. palea and M. atomus (the more Cd-tolerant species) were prone to early morphogenesis deformities.
Overall, our results show that all deformities cannot be considered equally for bioassessment regarding metal contamination. This research highlights the need to take into account the species (metal tolerant or sensitive) and the severity of the deformities.
Supplementary Materials
The following are available online at https://0-www-mdpi-com.brum.beds.ac.uk/2076-3298/6/9/102/s1, Supplementary Information 1. Flow chart illustrating sample management and analytical measurements during the chronic experiment.
Author Contributions
Experimental design and methodology, S.K.T. and I.L. Data analysis, S.K.T., I.L., F.L., and P.B.H. Writing—original draft preparation, S.K.T., I.L., and P.B.H. Writing—review and editing, F.L. and C.F. Supervision, C.F. Funding acquisition, C.F.
Funding
The Mine of Knowledge CREATE program (www.mine.umontreal.ca) supported Kim Tiam S. The Canada Research Chair program (grant number 950-231107) supported Fortin C.
Conflicts of Interest
The authors declare no conflict of interest. The funders had no role in the design of the study, in the collection, analyses, or interpretation of data, in the writing of the manuscript, or in the decision to publish the results.
References
- Coste, M.; Boutry, S.; Tison-Rosebery, J.; Delmas, F. Improvements of the Biological Diatom Index (BDI): Description and efficiency of the new version (BDI-2006). Ecol. Indic. 2009, 9, 621–650. [Google Scholar] [CrossRef]
- Kelly, M.; Whitton, B.A. The trophic diatom index: A new index for monitoring eutrophication in rivers. J. Appl. Phycol. 1995, 7, 433–444. [Google Scholar] [CrossRef]
- Lavoie, I.; Campeau, S.; Zugic-Drakulic, N.; Winter, J.G.; Fortin, C. Using diatoms to monitor stream biological integrity in Eastern Canada: An overview of 10 years of index development and ongoing challenges. Sci. Total Environ. 2014, 475, 187–200. [Google Scholar] [CrossRef] [PubMed]
- Lavoie, I.; Hamilton, P.B.; Morin, S.; Kim Tiam, S.; Kahlert, M.; Gonçalves, S.; Falasco, E.; Fortin, C.; Gontero, B.; Heudre, D.; et al. Diatom teratologies as biomarkers of contamination: Are all deformities ecologically meaningful? Ecol. Indic. 2017, 82, 539–550. [Google Scholar] [CrossRef]
- Stoermer, E.F.; Smol, J.P. Applications and uses of diatoms: Prologue. Diatoms Appl. Environ. Earth Sci. 1999, 2, 3–10. [Google Scholar]
- Arini, A.; Feurtet-Mazel, A.; Maury-Brachet, R.; Pokrovsky, O.S.; Coste, M.; Delmas, F. Recovery potential of periphytic biofilms translocated in artificial streams after industrial contamination (Cd and Zn). Ecotoxicology 2012, 21, 1403–1414. [Google Scholar] [CrossRef]
- Bere, T.; Tundisi, J.G. Cadmium and lead toxicity on tropical freshwater periphyton communities under laboratory-based mesocosm experiments. Hydrobiologia 2012, 680, 187–197. [Google Scholar] [CrossRef]
- Duong, T.T.; Morin, S.; Herlory, O.; Feurtet-Mazel, A.; Coste, M.; Boudou, A. Seasonal effects of cadmium accumulation in periphytic diatom communities of freshwater biofilms. Aquat. Toxicol. 2008, 90, 19–28. [Google Scholar] [CrossRef]
- Morin, S.; Cordonier, A.; Lavoie, I.; Arini, A.; Blanco, S.; Duong, T.T.; Tornés, E.; Bonet, B.; Corcoll, N.; Faggiano, L.; et al. Consistency in diatom response to metal-contaminated environments. In Emerging and Priority Pollutants in Rivers; Springer: Berlin/Heidelberg, Germany, 2012; pp. 117–146. [Google Scholar]
- Corcoll, N.; Bonet, B.; Morin, S.; Tlili, A.; Leira, M.; Guasch, H. The effect of metals on photosynthesis processes and diatom metrics of biofilm from a metal-contaminated river: A translocation experiment. Ecol. Indic. 2012, 18, 620–631. [Google Scholar] [CrossRef]
- Falasco, E.; Bona, F.; Badino, G.; Hoffmann, L.; Ector, L. Diatom teratological forms and environmental alterations: A review. Hydrobiologia 2009, 623, 1–35. [Google Scholar] [CrossRef]
- Fernández, M.; Martín, G.; Corzo, J.; de la Linde, A.; García, E.; López, M.; Sousa, M. Design and testing of a new diatom-based index for heavy metal pollution. Arch. Environ. Contam. Toxicol. 2018, 74, 170–192. [Google Scholar] [CrossRef] [PubMed]
- Dauta Conditions de développement du phytopancton. Etude comparative du comportement de huit espèces en culture. I. Détermination des paramètres de croissance en fonction de la lumière et de la température. Ann. Limnol. 1982, 18, 217–262. [Google Scholar] [CrossRef]
- Trobajo, R.; Clavero, E.; Chepurnov, V.A.; Sabbe, K.; Mann, D.G.; Ishihara, S.; Cox, E.J. Morphological, genetic and mating diversity within the widespread bioindicator Nitzschia palea (Bacillariophyceae). Phycologia 2009, 48, 443–459. [Google Scholar] [CrossRef]
- Morin, S.; Vivas-Nogues, M.; Duong, T.T.; Boudou, A.; Coste, M.; Delmas, F. Dynamics of benthic diatom colonization in a cadmium/zinc-polluted river (Riou-Mort, France). Fundam. Appl. Limnol. Arch. Hydrobiol. 2007, 168, 179–187. [Google Scholar] [CrossRef]
- Kim Tiam, S.; Morin, S.; Pesce, S.; Feurtet-Mazel, A.; Moreira, A.; Gonzalez, P.; Mazzella, N. Environmental effects of realistic pesticide mixtures on natural biofilm communities with different exposure histories. Sci. Total Environ. 2014, 473, 496–506. [Google Scholar] [CrossRef] [PubMed]
- Larras, F.; Bouchez, A.; Rimet, F.; Montuelle, B. Using bioassays and Species Sensitivity Distributions to assess herbicide toxicity towards benthic diatoms. PLoS ONE 2012, 7, e44458. [Google Scholar] [CrossRef] [PubMed]
- Moisset, S.; Kim Tiam, S.; Feurtet-Mazel, A.; Morin, S.; Delmas, F.; Mazzella, N.; Gonzalez, P. Genetic and physiological responses of three freshwater diatoms to realistic diuron exposures. Environ. Sci. Pollut. Res. 2015, 22, 4046–4055. [Google Scholar] [CrossRef]
- Lange-Bertalot, H. Navicula sensu stricto, 10 genera separated from Navicula sensu lato, Frustulia. In Diatoms of Europe—Diatoms of European Inland Waters and Comparable Habitats; Lange-Bertalot, H., Ed.; Gantner: Ruggell, Liechtenstein, 2001; Volume 2, p. 526. [Google Scholar]
- Reichardt, E. Revision der Arten um Gomphonema truncatum und G. capitatum. Lange Bertalot Festschr 2001, 187–224. [Google Scholar]
- Peres-Weerts, F. Mise en évidence des Effets Toxiques des Métaux Lourds sur les Diatomées par L’étude des Formes Tératogenes; Agence L Eau Artois Picardie Douai: Douai, France, 2000; 24p. [Google Scholar]
- Leguay, S.; Lavoie, I.; Levy, J.L.; Fortin, C. Using biofilms for monitoring metal contamination in lotic ecosystems: The protective effects of hardness and pH on metal bioaccumulation. Environ. Toxicol. Chem. 2016, 35, 1489–1501. [Google Scholar] [CrossRef]
- Feurtet-Mazel, A.; Gold, C.; Coste, M.; Boudou, A. Study of periphytic diatoms communities exposed to metallic contamination through complementary field and laboratory experiments. J. Phys. 2003, 107, 467–470. [Google Scholar] [CrossRef]
- Ivorra, N.; Hettelaar, J.; Tubbing, G.M.J.; Kraak, M.H.S.; Sabater, S.; Admiraal, W. Translocation of microbenthic algal assemblages used for in situ analysis of metal pollution in rivers. Arch. Environ. Contam. Toxicol. 1999, 37, 19–28. [Google Scholar] [CrossRef] [PubMed]
- Campbell, P.G.; Errécalde, O.; Fortin, C.; Hiriart-Baer, V.P.; Vigneault, B. Metal bioavailability to phytoplankton—Applicability of the biotic ligand model. Comp. Biochem. Physiol. Part C Toxicol. Pharmacol. 2002, 133, 189–206. [Google Scholar] [CrossRef]
- Hassler, C.S.; Slaveykova, V.I.; Wilkinson, K.J. Discriminating between intra-and extracellular metals using chemical extractions. Limnol. Oceanogr. Methods 2004, 2, 237–247. [Google Scholar] [CrossRef]
- Twiss, M.R.; Errécalde, O.; Fortin, C.; Campbell, P.G.; Jumarie, C.; Denizeau, F.; Berkelaar, E.; Hale, B.; van Rees, K. Coupling the use of computer chemical speciation models and culture techniques in laboratory investigations of trace metal toxicity. Chem. Speciat. Bioavailab. 2001, 13, 9–24. [Google Scholar] [CrossRef]
- Schreiber, U. Chlorophyll fluorescence: New instruments for special applications. In Photosynthesis: Mechanisms and Effects; Springer: Dordrecht, The Netherlands, 1998; pp. 4253–4258. [Google Scholar]
- Kim Tiam, S.; Lavoie, I.; Doose, C.; Hamilton, P.B.; Fortin, C. Morphological, physiological and molecular responses of Nitzschia palea under cadmium stress. Ecotoxicology 2018, 27, 675–688. [Google Scholar] [CrossRef] [PubMed]
- Corcoll, N.; Ricart, M.; Franz, S.; Sans-Piché, F.; Schmitt-Jansen, M.; Guasch, H. The use of photosynthetic fluorescence parameters from autotrophic biofilms for monitoring the effect of chemicals in river ecosystems. In Handbook of Environmental Chemistry; Guasch, H., Ginebreda, A., Geiszinger, A., Eds.; Springer: Heidelberg, Germany, 2012; Volume 19, pp. 86–114. [Google Scholar]
- Genty, B.; Briantais, J.M.; Baker, N.R. The relationship between the quantum yield of photosynthetic electron transport and quenching of chlorophyll fluorescence. Biochim. Biophys. Acta 1989, 990, 87–92. [Google Scholar] [CrossRef]
- R Development Core Team. R: A Language and Environment for Statistical Computing; R Foundation for Statistical Computing: Vienna, Austria, 2008. [Google Scholar]
- Vindimian, E. REGTOX: Macro Excel™ for Dose-Response Modelling 2003. Available online: http://www.normalesup.org/~vindimian/en_index.html (accessed on 9 July 2019).
- Lavoie, I.; Lavoie, M.; Fortin, C. A mine of information: Benthic algal communities as biomonitors of metal contamination from abandoned tailings. Sci. Total Environ. 2012, 425, 231–241. [Google Scholar] [CrossRef]
- Morin, S.; Duong, T.T.; Dabrin, A.; Coynel, A.; Herlory, O.; Baudrimont, M.; Delmas, F.; Durrieu, G.; Schäfer, J.; Winterton, P.; et al. Long-term survey of heavy-metal pollution, biofilm contamination and diatom community structure in the Riou Mort watershed, South-West France. Environ. Pollut. 2008, 151, 532–542. [Google Scholar] [CrossRef]
- Morin, S.; Coste, M.; Delmas, F. A comparison of specific growth rates of periphytic diatoms of varying cell size under laboratory and field conditions. Hydrobiologia 2008, 614, 285–297. [Google Scholar] [CrossRef] [Green Version]
- Lee, J.G.; Ahner, B.A.; Morel, F.M. Export of cadmium and phytochelatin by the marine diatom Thalassiosira weissflogii. Environ. Sci. Technol. 1996, 30, 1814–1821. [Google Scholar] [CrossRef]
- Teitzel, G.M.; Parsek, M.R. Heavy metal resistance of biofilm and planktonic Pseudomonas aeruginosa. Appl. Environ. Microbiol. 2003, 69, 2313–2320. [Google Scholar] [CrossRef] [PubMed]
- Paquet, N.; Lavoie, M.; Maloney, F.; Duval, J.F.L.; Campbell, P.G.C.; Fortin, C. Cadmium accumulation and toxicity in the unicellular alga Pseudokirchneriella subcapitata: Influence of metal-binding exudates and exposure time. Environ. Toxicol. Chem. 2015, 34, 1524–1532. [Google Scholar] [CrossRef]
- Kim Tiam, S.; Feurtet-Mazel, A.; Delmas, F.; Mazzella, N.; Morin, S.; Daffe, G.; Gonzalez, P. Development of q-PCR approaches to assess water quality: Effects of cadmium on gene expression of the diatom Eolimna minima. Water Res. 2012, 46, 934–942. [Google Scholar] [CrossRef] [PubMed]
- Arini, A.; Durant, F.; Coste, M.; Delmas, F.; Feurtet-Mazel, A. Cadmium decontamination and reversal potential of teratological forms of the diatom Planothidium frequentissimum (Bacillariophyceae) after experimental contamination. J. Phycol. 2013, 49, 361–370. [Google Scholar] [CrossRef] [PubMed]
- Rijstenbil, J.W.; Sandee, A.; Van Drie, J.; Wijnholds, J.A. Interaction of toxic trace metals and mechanisms of detoxification in the planktonic diatoms Ditylum brightwellii and Thalassiosira pseudonana. FEMS Microbiol. Rev. 1994, 14, 387–396. [Google Scholar] [CrossRef] [PubMed]
- Lavoie, M.; Le Faucheur, S.; Fortin, C.; Campbell, P.G.C. Cadmium detoxification strategies in two phytoplankton species: Metal binding by newly synthesized thiolated peptides and metal sequestration in granules. Aquat. Toxicol. 2009, 92, 65–75. [Google Scholar] [CrossRef]
- Le Faucheur, S.; Behra, R.; Sigg, L. Phytochelatin induction, cadmium accumulation, and algal sensitivity to free cadmium ion in Scenedesmus vacuolatus. Environ. Toxicol. Chem. 2005, 24, 1731–1737. [Google Scholar] [CrossRef]
- Le Faucheur, S.; Schildknecht, F.; Behra, R.; Sigg, L. Thiols in Scenedesmus vacuolatus upon exposure to metals and metalloids. Aquat. Toxicol. 2006, 80, 355–361. [Google Scholar] [CrossRef]
- Le Faucheur, S.; Behra, R.; Sigg, L. Thiol and metal contents in periphyton exposed to elevated copper and zinc concentrations: A field and microcosm study. Environ. Sci. Technol. 2005, 39, 8099–8107. [Google Scholar] [CrossRef]
- Kim Tiam, S.; Laviale, M.; Feurtet-Mazel, A.; Jan, G.; Gonzalez, P.; Mazzella, N.; Morin, S. Herbicide toxicity on river biofilms assessed by pulse amplitude modulated (PAM) fluorometry. Aquat. Toxicol. 2015, 165, 160–171. [Google Scholar] [CrossRef] [PubMed]
- Laviale, M.; Prygiel, J.; Créach, A. Light modulated toxicity of isoproturon toward natural stream periphyton photosynthesis: A comparison between constant and dynamic light conditions. Aquat. Toxicol. 2010, 97, 334–342. [Google Scholar] [CrossRef] [PubMed]
- Pesce, S.; Margoum, C.; Montuelle, B. In situ relationships between spatio-temporal variations in diuron concentrations and phototrophic biofilm tolerance in a contaminated river. Water Res. 2010, 44, 1941–1949. [Google Scholar] [CrossRef] [PubMed]
- Qiang, H.; Guterman, H.; Richmond, A. Physiological characteristics of Spirulina platensis (cyanobacteria) cultured at ultrahigh cell densities. J. Phycol. 1996, 32, 1066–1073. [Google Scholar] [CrossRef]
- Falasco, E.; Bona, F.; Ginepro, M.; Hlúbiková, D.; Hoffmann, L.; Ector, L. Morphological abnormalities of diatom silica walls in relation to heavy metal contamination and artificial growth conditions. Water SA 2009, 35, 595–606. [Google Scholar] [CrossRef]
Figure 1.
Examples of morphological aberrations observed on valves for the four diatom species studied. Pinnularia mesolepta: (a) normal, (b) shape, (c) asymmetry, (d) asymmetry + shape, (e) raphe + stria (minor), (f) raphe + stria (major), Gomphonema truncatum: (g) normal, (h) normal, (i) shape, (j) raphe, (k) raphe + stria, (l) shape + stria, Nitzschia palea: (m) normal, (n) fibulae, (o) shape, (p) shape, (q) raphe canal, (r) raphe canal, (s) raphe canal, Mayamae atomus: (t) normal, (u) shape, (v) shape, and (w) shape. Scale bar: 10 µm.

Figure 2.
Mean effective quantum yield (percentage of the control (Ctrl), ± standard error) as a function of Cd concentration for N. palea, P. mesolepta, M. atomus, and G. truncatum after 19 h of exposure to Cd (n = 3, * p < 0.05, ** p < 0.01, *** p < 0.001).
Figure 2.
Mean effective quantum yield (percentage of the control (Ctrl), ± standard error) as a function of Cd concentration for N. palea, P. mesolepta, M. atomus, and G. truncatum after 19 h of exposure to Cd (n = 3, * p < 0.05, ** p < 0.01, *** p < 0.001).

Figure 3.
Cadmium concentrations in growth medium (µg Cd/L ± standard error, n = 3) for each exposure time for the control and the Cd treatment (Cd100) in (a) N. palea, (b) P. mesolepta, (c) M. atomus, and (d) G. truncatum cultures. White circles represent the control and black squares represent Cd treatment (Cd100). Detection and quantification limits were 0.06 and 0.35 µg Cd/L, respectively. Nominal concentrations were 0 and 100 µg Cd/L for the control and Cd100.

Figure 4.
Mean Chl-a concentration in (a) N. palea, (b) P. mesolepta, (c) M. atomus, and (d) G. truncatum cultures (μg Chl-a/mL ± standard error) at each exposure time for the cadmium treatment and the control. Stars indicate statistical differences from the control (n = 3, ** p < 0.01, *** p < 0.001). Black squares represent Cd exposure media (Cd100) and white circles represent the control.

Figure 5.
Mean effective quantum yield (±standard error) at each exposure time for the cadmium treatment and the control in (a) N. palea, (b) P. mesolepta, (c) M. atomus, and (d) G. truncatum cultures. Stars indicate statistical differences from the control (n = 3, * p < 0.05, ** p < 0.01, *** p < 0.001). Black bars represent Cd exposure media (Cd100) and white bars represent the control (Ctrl).

Figure 6.
Mayamaea atomus SEM images of normal and deformed valves. (a) External valve view, typical valve raphe apices not equally formed. (b) Internal valve view, typical valve formation. (c) Axial and central areas symmetric, selected areolae deformed linear-slits. (d) Typical valve with deformed terminal raphe end. (e) Broken raphe at the central area. (f) Double raphe formation on one side of the valve and asymmetry of the valve. Scale bars: (a,b,d,f) = 5 µm, (c,e): 2 µm.

Figure 7.
Mean effective percentage of total deformities (±standard error) in (a) N. palea, (b) P. mesolepta, (c) M. atomus, and (d) G. truncatum cultures after 21 days of the experiment for the control (Ctrl) and the Cd treatment (Cd100). The deformities affecting the shape of G. truncatum were not considered in the calculation of the percentage of total deformities. Stars indicate statistical differences from the control (n = 3, * p < 0.05, ** p < 0.01).


Table 1.
Mean EC25 (µg/L, confidence intervals α5%) effect on quantum yield of PSII for N. palea, P. mesolepta, M. atomus, and G. truncatum after 19 h of exposure to Cd (n = 3).
Table 1.
Mean EC25 (µg/L, confidence intervals α5%) effect on quantum yield of PSII for N. palea, P. mesolepta, M. atomus, and G. truncatum after 19 h of exposure to Cd (n = 3).
| EC25 (µg/L); α5% | |
|---|---|
| N. palea | 1179 (1015, 1349) |
| P. mesolepta | 9 (3, 23) |
| M. atomus | 2394 (1890, 2896) |
| G. truncatum | 606 (348, 926) |
Table 2.
Mean cadmium bioaccumulation levels in the diatoms (ng Cd/mg Chl-a ± standard error) at the different sampling times for Cd100 treatment. Detection (d.l.) and quantification (q.l.) limits were 0.09 and 0.56 µg Cd/L, respectively (after digestion in the solution of nitric acid and hydrogen peroxide). Cd concentrations for control treatment were below the detection limit at all sampling times and are not presented.
| Cadmium Bioaccumulation for Cd100 Treatment (ng Cd/mg Chl-a) | ||||
|---|---|---|---|---|
| T0 | T7 | T14 | T21 | |
| N. palea | <q.l. | 25.9 ± 3.1 | 5.29 ± 0.92 | 8.74 ± 0.77 |
| P. mesolepta | <q.l. | <d.l. | <d.l. | 12.36 ± 0.87 |
| M. atomus | <q.l. | <q.l. | 201 ± 32 | 73 ± 14 |
| G. truncatum | <q.l. | <d.l. | <d.l. | <d.l. |
Table 3.
Deformities observed on the four diatom species (N. palea, P. mesolepta, M. atomus, and G. truncatum) after 21 days of the experiment for the control (Ctrl) and the Cd treatment (Cd100). Microscopic observations were conducted on triplicate samples (labeled R1 to R3). The number of valves counted for each sample is indicated between brackets. Early-morphogenesis *, mid-morphogenesis **, late-morphogeneis ***, mixed ****.
| Species/Type of Deformity | Ctrl | Cd100 | ||||
|---|---|---|---|---|---|---|
| Ctrl-R1 | Ctrl-R2 | Ctrl-R3 | Cd100-R1 | Cd100-R2 | Cd100-R3 | |
| Nitzchia palea | ||||||
| Shape *** | 2 | 2 | 2 | 2 | 4 | 5 |
| minor deviation of the raphe canal * | 3 | 2 | 6 | 6 | 12 | 1 |
| moderate deviation of the raphe canal * | 2 | 2 | 4 | 3 | 9 | |
| major deviation of the raphe canal * | 1 | 5 | ||||
| fibule/canal interruption * | 1 | 2 | 2 | 2 | ||
| irregular fibulae * | 4 | 5 | 4 | 4 | 3 | 6 |
| irregula striation pattern ** | 1 | 1 | 3 | 1 | 1 | |
| mixed (deviation of the raphe canal + shape) **** | 1 | 1 | 1 | |||
| (valves counted) | (401) | (406) | (403) | (401) | (405) | (400) |
| Pinnularia mesolepta | ||||||
| Shape *** | 3 | 1 | 5 | 1 | 2 | 2 |
| striation pattern ** | 3 | 7 | 7 | 13 | 8 | |
| wide central area or lack of central area * | 1 | 2 | 1 | 3 | ||
| Asymmetry * | 4 | 2 | ||||
| Raphe * | 3 | 1 | 8 | 3 | 4 | |
| raphe and stria *,** | 2 | 3 | 4 | 8 | 6 | 3 |
| mixed (shape/asymetry + raphe + stria) **** | 1 | 5 | 5 | 2 | ||
| (valves counted) | (400) | (407) | (406) | (244) | (238) | (273) |
| Mayamaea atomus | ||||||
| Shape *** | 1 | 2 | 1 | 1 | 1 | |
| striation pattern ** | 6 | 1 | 2 | 3 | 1 | |
| raphe + stria *,** | 2 | 4 | 3 | 4 | ||
| raphe * | 9 | 9 | 18 | 27 | 16 | 24 |
| mixed (shape + raphe + stria) **** | 3 | 1 | 1 | |||
| (valves counted) | (159) | (159) | (164) | (148) | (182) | (153) |
| Gomphonema truncatum | ||||||
| Shape *** | 15 | 13 | 25 | 5 | 9 | 4 |
| striation pattern ** | 22 | 21 | 17 | 12 | 13 | 5 |
| Raphe * | 10 | 2 | 7 | 7 | 11 | 7 |
| mixed (shape + raphe + stria) **** | 24 | 18 | 14 | 16 | 21 | 12 |
| (valves counted) | (401) | (400) | (401) | (229) | (243) | (189) |
© 2019 by the authors. Licensee MDPI, Basel, Switzerland. This article is an open access article distributed under the terms and conditions of the Creative Commons Attribution (CC BY) license (http://creativecommons.org/licenses/by/4.0/).
Share and Cite
MDPI and ACS Style
Kim Tiam, S.; Lavoie, I.; Liu, F.; Hamilton, P.B.; Fortin, C. Diatom Deformities and Tolerance to Cadmium Contamination in Four Species. Environments 2019, 6, 102. https://0-doi-org.brum.beds.ac.uk/10.3390/environments6090102
AMA Style
Kim Tiam S, Lavoie I, Liu F, Hamilton PB, Fortin C. Diatom Deformities and Tolerance to Cadmium Contamination in Four Species. Environments. 2019; 6(9):102. https://0-doi-org.brum.beds.ac.uk/10.3390/environments6090102
Chicago/Turabian StyleKim Tiam, Sandra, Isabelle Lavoie, Fengjie Liu, Paul B. Hamilton, and Claude Fortin. 2019. "Diatom Deformities and Tolerance to Cadmium Contamination in Four Species" Environments 6, no. 9: 102. https://0-doi-org.brum.beds.ac.uk/10.3390/environments6090102
Note that from the first issue of 2016, this journal uses article numbers instead of page numbers. See further details here.