The Way of Macroplastic through the Environment


1
Institute of Hydraulic Engineering and Water Resources Management, RWTH Aachen University, 52062 Aachen, Germany
2
Department of Geography, Physical Geography and Geoecology, RWTH Aachen University, 52062 Aachen, Germany
*
Author to whom correspondence should be addressed.
Environments 2020, 7(10), 73; https://0-doi-org.brum.beds.ac.uk/10.3390/environments7100073
Submission received: 28 August 2020
/
Revised: 18 September 2020
/
Accepted: 22 September 2020
/
Published: 24 September 2020
(This article belongs to the Special Issue Bioplastics in the Environment)
Abstract
:With the focus on microplastic in current research, macroplastic is often not further considered. Thus, this review paper is the first to analyse the entry paths, accumulation zones, and sinks of macroplastic in the aquatic, terrestrial, and atmospheric environment by presenting transport paths and concentrations in the environment as well as related risks. This is done by applying the Source–Pathway–Receptor model on macroplastic in the environment. Based on this model, the life cycle of macroplastic is structurally described, and knowledge gaps are identified. Hence, current research aspects on macroplastic as well as a sound delimitation between macro- and microplastic that can be applied to future research are indicated. The results can be used as basic information for further research and show a qualitative assessment of the impact of macroplastic that ends up in the environment and accumulates there. Furthermore, the applied model allows for the first time a quantitative and structured approach to macroplastic in the environment.
1. Introduction
Plastics are synthetic macromolecules consisting of compounds of monomers produced synthetically or by natural product conversion [1]. Due to their high economic and technological importance, they have a larger production volume (in m³) worldwide than steel and aluminium [2]. However, the great advantages of the material—its lightness, durability and low-cost production—are leading to an ever-increasing environmental problem: due to large production values, short product life, and unconscious handling of the material, 3% of the produced plastic leaks into the marine environment and accumulates there due to its persistence [3,4].
In order to carry out a sound analysis of this problem, some information is still missing: How is plastic waste distributed in the environment, where are hotspots and sinks in the environment, and which organisms are affected [5,6,7,8,9]? Furthermore, the question of “missing plastic” comes into focus [3,10], as measured concentrations of (micro-) plastic in some environmental areas do not appear to increase [11,12,13]. This can be explained by an overestimation of the input of macroplastic (MaP) into the ocean as well as an underestimation of plastics that accumulates at the ocean surface, the water column of the oceans, or the removal of plastic from the ocean surface by degradation, fragmentation, and increase in density [14,15]. For this reason, the question of possible sinks within the life cycle is particularly important for further understanding.
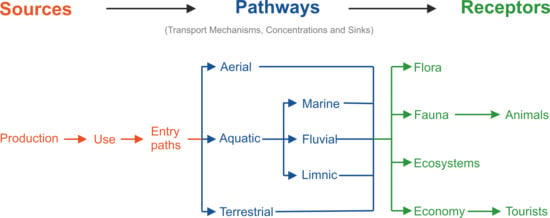
In this paper, the Source–Pathway–Receptor (SPR) model is used to summarise the current state of knowledge and to reveal further research areas. The model was already applied to microplastics [16]. So this paper is a further step towards a comprehensive consideration of plastics in the environment. The initially unidirectional model can be extended over time to a multidirectional model by adding new insights on sources, transport routes, and receptors as well as interdependencies between the different components. The SPR model is built up on the basis of sources, pathways and receptors and can thus be used to assess any environmental pollution [16,17]. The methodical classification of these sections allows a better structuring of the processes and a stepwise extension. The SPR model is characterised by its simplicity, its flexibility, and the ability to recognise relationships in complex systems. This makes it possible to consider the path of MaP through all areas of the aquatic, terrestrial, and atmospheric environment. In comparison to existing reviews or research articles of plastic waste and MaP in the environment (marine environments: [18,19]; freshwater environments: [20,21,22]; terrestrial environments: [23] or regarding ecological effects [24,25], this one looks at the whole life cycle and all environmental areas by determining all possible sources, pathways, and receptors (sinks).
Definition Macroplastic. While the size of microplastic is defined as particles with a diameter < 5 mm [26], MaP is commonly defined in distinction to microplastics as items with a diameter ≥ 5 mm [6,27,28,29]. However, both size classifications are not internationally standardised. Regarding MaP, other definitions are also published. For example, Barnes et al. (2009) [30] defined macro-debris with a diameter > 20 mm, the European Commission (2013) [31] defined it as items > 25 mm, while other studies define items > 5 cm as MaP [32] or suggested to define MaP as items > 1 cm [33] (Hartmann et al., 2019). Furthermore, the term mesoplastic is also used with a size classification of >5–25 mm, according to which MaP is defined as a fraction > 25 mm [34]. Due to the large number of publications on microplastic (>4400 papers in Web of Science in August 2020, keyword: microplastic*), the size definition of MaP ≥ 5 mm is preferable and simplifies the distinction with regard to already present research work on microplastics.
In addition to the unstandardised size definitions, the unclarified terminology is also a problem, as numerous terms are used synonymously beyond the term MaP. The terms “macro litter” [35], “anthropogenic litter” [36], “plastic litter” [37], “marine litter” [38], “marine plastic” [39] and “plastic debris” [40] are most frequently used alongside MaP, and the first publication using “macroplastic” in its headline was only published in 2012 [41]. With this variety of terms, a clear focus on the problem with MaP in the environment is difficult to implement within research. Based on a comprehensive literature review, this study suggests to set a new standard with the size limit of particles with a diameter ≥ 5 mm and the classification with the term “macroplastic”.
Bibliographic Collection. The literature for this review was first compiled via searches on the Web of Science on 8 August 2020 (regarding keywords, see Figure 1); then, the suitable references in the papers were included. Additionally, literature was sought via other sources such as Researchgate or the homepages of different journals. Of the papers found, those with a microplastic focus or which did not seem suitable for other reasons were sorted out. Thus, a total of 200 papers were summarised for this review paper (see Figure 1).
2. Sources of Macroplastic
Within the SPR model, the analysis of sources, pathways, and receptors is essential to build up a quantitative model [17]. Regarding plastic in the environment, sources of microplastic were already defined as the place, product, or action that generates it [16]. Transferred to MaP, this covers the entire plastics production as well as the percentage of waste generation of the individual sectors of use. Entry paths of MaP are described afterwards and are defined as the MaP pathway from the source (point of use) into the environment.
2.1. Production of Macroplastic
In 2018, 359 million tons (Mt) of plastic were produced worldwide with more than half (51%) coming from Asia (30% China, 4% Japan, 17% rest of Asia). In Europe, 61.8 Mt, 17.2% of the global production, were manufactured. Here, the packaging industry is the main user group, accounting for 39.9% of the plastic produced, while the construction industry (19.8%), the automotive industry (9.9%), the electronics industry (6.2%), household and leisure use (4.1%), and agriculture (3.4%) require only comparatively small shares [42] (Figure 2).
Polypropylene (PP) accounts for the largest share, followed by low-density polyethylene (LDPE) and high-density polyethylene (HDPE). These three plastics have a lower density than water. The polymers polyvinyl chloride (PVC), polyurethane (PUR), polyethylene terephthalate (PET) and (expanded) polystyrene ((E)PS) have a higher density than water. In Figure 2, five different polymers are covered with the term “Others”, including acrylonitrile–butadiene–styrene (ABS), polybutylene terephthalate (PBT), polycarbonate (PC), polymethyl methacrylate (PMMA), and polytetrafluoroethylene (PTFE), which have densities (ρ) between 1.05 and 2.2 g/cm³.
The mass production of plastics began in 1950, and global plastics production was estimated at 8300 Mt by 2015. Of those, approximately 600 Mt have been recycled into new products. A total of 800 Mt were energetically recovered and 4900 Mt were disposed during this period, which describes both landfilling and improper disposal in the environment [44]. Hoornweg and Bhada-Tata (2012) [45] estimated that while 2.9 billion urban residents generated 0.64 kg of municipal solid waste (MSW) in 2002, it increased to 3 billion residents generating 1.2 kg per person per year in 2012, accumulating to 1.3 billion of tons per year—an increasing trend.
The current literature offers different estimates of the amount of plastic leakage into the environment every year (a):
4.8 Mt/a to 12.7 Mt/a [46]: linking data on solid waste, population density, and economic status; land-based, mismanaged plastic waste entering the ocean from the coastline
8.28 Mt/a [47]: MaP (fishing nets and related losses, littering, mismanaged waste treatment) and microplastics (plastic production, cosmetics and personal care products, fibers, tire abrasion, road marking, city dust, marine coating weathering); plastic losses to the environment
The calculations are largely based on population figures and the proportion of mismanaged plastic waste.
2.2. Entry Paths of Macroplastic into the Environment
Generally, MaP is released into the environment following land-based and ocean-based pathways (Table 1). The land-based entry paths include coastal mismanaged plastic waste (75.5%, 8 Mt/a) and inland mismanaged plastic waste (18.9%, 2 Mt/a), while the ocean-based entry paths include waste from shipping and fishing activities and illegal waste disposal on the open sea (5.6%, 0.6 Mt/a) [4]. The distinction between inland and coastal waste generation is often made, since a large number of people live in coastal areas, and the input paths there are more direct than with inland plastic waste. Coastal is defined here as everything that is at most 50 km away from the coast. This includes residents of 192 countries [4,46].
The sources, entry paths, and pathways as well as sinks of MaP in the environment are shown in Figure 3, giving also information on mass budgets if data are available.
2.2.1. Land-Based Macroplastic: Coastal and Inland Mismanaged Plastic Waste
In general, land-based sources of MaP account for the largest share in plastic pollution. This statement is mainly based on the estimation of waste streams. Jambeck et al. (2015) [46] were the first to provide a global view of land-based plastics entering the marine environment from coasts. Considering the input variables of solid waste, coastal access, world population, and economic status, a volume between 4.8 and 12.7 Mt of plastic waste entering the ocean from 192 coastal countries was estimated for the year 2010. According to Carlton et al. (2017) [50], the expending coastal infrastructure is a global source for the entry of plastic material, as it can be destroyed by natural events, such as storms and tsunamis, and thus directly enter the oceans. Turrell (2020) estimated the percentage of land-based MaP around Scotland in comparison to ocean-based MaP to [58] be between 58 and 99% of the total amount. In Japan, the emission from land into sea of microplastic and MaP is calculated to be 210–4776 t/a [59].
According to Lebreton et al. (2017) [51], depending on population densities and waste management, 1.15 Mt to 2.41 Mt/a are transported across all rivers. Schmidt et al. (2017) [60] estimate between 0.41 and 4 Mt of plastic waste enter the oceans via rivers per year, which highlights the difficulties within the modelling and selection of input variables. Lebreton and Andrady (2019) [29] predict that over 90% of mismanaged plastic waste is transported by rivers that are larger than 100 km².
Disposable plastic products represent a large proportion of the MaP found in the environment, which is mostly due to its short service life and the high production values. According to Winton et al. (2020) [20], the most frequently detected MaP items on European beaches are food wrappers (8.92% of all litter), bottles and lids (7.51% of all litter), bags (5.49% of all litter), cigarette butts (4.02% of all litter), sanitary items (3.72%), and smoking-related packaging (3.40%). The European Commission [61] also names disposable cutlery, cotton bud sticks, cups, balloon (rods), and lightweight plastic carrier bags as frequently found MaP products. Overall, compiled on a detailed review paper, around 71% of the detected environmental litter was plastic, and 59% was identified as consumer-related MaP [20].
Littering. Littering is the deliberate, improper disposal of waste into the environment. Inputs of MaP to terrestrial areas occur largely via littering, which includes both small quantities of unintentional disposal and the illegal dumping of waste in large quantities. The exact amount of litter that is released into the environment each year is difficult to determine. Estimations are around 1.3–3.5 kg per capita for Germany [62] or 540 g ± 140 g per capita for soil and 13.3 g ± 4.9 g per capita for freshwater in Switzerland [28]. Using the conservative value estimated for Switzerland, an extrapolation to the world population of 7.59 billion people results in an annual plastic input via littering of 4.2 Mt. As a comparison, Ryberg et al. (2019) [52] calculated the amount of annual littering entering the environment at 0.8 Mt. A large share of the littered plastic are PET bottles [28] and cigarette butts. Cigarette butts, mostly consisting of the polymer cellulose acetate (CA), are declared as the most common waste item, and it is assumed that 4.5 trillion cigarette butts are released into the environment each year worldwide. This corresponds to approximately 80% of the cigarettes consumed [63]. Urban areas and beaches in particular are heavily polluted by cigarette butts and other tobacco product waste [53].
The COVID-19 pandemic is also a new source of litter. A predicted increase in plastic pollution by 2030 already reveals itself in dumped gloves and masks in the environment [64]. The global increase in personal protective equipment as well as single-use plastic can intensify the issues of marine litter and the following consequences for marine biota and its biodiversity [65].
Agriculture. In agriculture, plastic films for greenhouses as well as mulch and silo films are used [27], which can be introduced into the soil by subsequent mechanical cultivation [66]. Worldwide, 6.5 Mt of plastics are used annually in the agricultural sector. The largest areas of film covers of greenhouses in Europe are in Spain (53,235 ha) and Italy (25,000 ha). For mulching, plastics are used for areas of 120,039 ha (Spain), 100,000 ha (France), and 85,000 ha (Italy) [54]. In Europe, the total demand of plastic for agricultural activities is 1.74 Mt/a [42], while the amount of plastic waste is estimated at 0.615 Mt/a [55]. Thus, the global agricultural plastic waste was calculated to be 2.297 Mt/a.
The inputs of MaP from the use of plastics in agriculture can be divided into Northern and Southern Europe with regard to their origin. In the southern European countries, the input is mainly in the form of plastic films for cultivation protection. In the northern European countries, MaP originates mainly from silage films and silage covers [54]. Due to their direct contact with agricultural soils, plastic mulch films offer great potential for the introduction of MaP into the environment. The films consist mainly of PE [67] and PVC [66], and do not degrade in soils after mechanical cultivation and following fragmentation. Exposure to residues of the films in the soil was estimated at 50–260 kg/ha in China [66], in agricultural areas in southeastern Germany, 206 MaP items/ha were detected [27]. Eighty to 99% of plastics entering the waste water treatment plants (WWTP) end up in the sewage sludge, which is partly applied to fields [68,69].
MaP can also be introduced by fertilising with compost. Responsible for this is the disposal of MaP, such as plastic bags, in biowaste [67]. Bläsing and Amelung (2018) [67] quantified for the first time the possible input of MaP through the application of compost in Germany. Plastic concentrations between 2.38 and 180 mg/kg of compost were found.
Waste Water Treatment Plants. In urban areas, MaP items reach sewers and WWTP through surface runoff. In addition, MaP is also thrown into sanitary facilities and thus discharged into the sewage system. In Germany, this waste stream is estimated at 3000 t annually [62]. For MaP, discharge from WWTP into the environment is possible via storm water overflow tanks in the combined system [28] or via stormwater tanks, which have an overflow, in the separation system [70]. As no data are available on the input of MaP into wastewater or the quantity of stormwater discharged, a quantification of MaP entering the environment via sewage is not yet possible.
Landfills. A further entry into the environment arises from landfills near coasts and rivers [48]. Landfills seem to be a potential entry path due to the proximity to rivers and due to the degradation and fragmentation of MaP into microplastic [71,72]. Furthermore, MaP can enter the environment during the transport of waste to the landfill or as a result of accidents [30], which makes it difficult to estimate the input. In the European Union (EU), 440,000 t of plastic waste were landfilled in 2016, which was less than in 2012 (1370,000 t) [73]. Based on several other studies, Ryberg et al. (2019) [52] estimated the annual input of plastic into the environment due to mismanaged plastic waste at 3.9 Mt.
2.2.2. Ocean-Based Macroplastic
Abandoned or Lost Fishing Gear. Deliberately left behind or unintentionally lost fishing gear, as well as abrasion from fishing nets, also lead to the release of plastic into the environment [49]. Annually, about 640,000 t of fishing gear are discharged into the environment, which corresponds to about 10% of the marine debris [52,74]. An important part of this is accounted for by ghost nets, which swim around in the marine environment and in which living organisms can become entangled. The most commonly found fishing gear are nets, lines, fishing rods, hooks, ropes, and traps [75]. A further entry is also coming from coastal fish farming (aquaculture), leading to an accumulation of plastic in marine sediments [76].
Regarding ghost nets, they are sometimes filled with lead to sink in water, which can be slowly washed out into the environment. According to Lebreton et al. (2018) [77], 46% of the plastics that float in the North Pacific garbage patch are fishing nets. García-Rivera et al. (2017) [78] identified 68% of the plastic on the seafloor of the Gulf of Alicante being fishing-related. In 1975, the sinking of a fishing fleet resulted in the deposition of 135,400 t of plastic fishing gear and 23,600 t of synthetic packaging material into the sea (Cawthorn, 1989). A total quantification of the annual input of abandoned or lost fishing gear in the oceans is difficult for several reasons, especially due to missing standards for recording gear loss and the undeliberate nature of gear loss [49].
Lost Cargo. Repeatedly, large amounts of lost cargo are also released into the environment. An example of this are 28,000 bath toys such as rubber ducks, which were introduced into the Pacific ocean in 1992 when a container went overboard and are still being washed up on the coasts in, for example, Alaska, Australia, and Scotland [79]. Due to the material’s durability, these so-called ‘friendly floatees’ are almost unaltered when washed up on the coast. A more recent example of lost cargo is the loss of 342 containers from MSC Zoe in January 2019 in the North Sea, which polluted the Wadden Sea considerably with microplastic (among others, 22.5 t PE pellets) and MaP (consumer goods and packaging materials) [80].
Waste management in the marine environment. The dumping of waste on sea is internationally banned by the MARPOL Annex V since its adoption in 1991 [81], which has led to an expected decrease in MaP from ship-generated waste since then [30]. Nevertheless, it is expected that waste from ships is still illegally dumped at sea, with an estimate of 5.6 Mt solely from merchant shipping in 1997 [49]. Especially mentionable in this context are leisure cruises [82]. According to Herz and Davis (2002) [83], about 50 tons of solid waste can be generated by one typical cruise ship (3000 people) in a week, of which a big percentage is plastic.
3. Pathways of Macroplastic
When MaP is introduced into the environment, it can be further distributed in aquatic, terrestrial, or atmospheric environments. Therefore, the following section shows the transport routes in the individual environmental compartments and then compiles environmental concentrations of MaP.
3.1. Transport Paths of Macroplastic
MaP can be distributed via different transport routes, and this distribution in the environment generally occurs via drift, which is defined as passive dispersion by wind and water currents [84].
3.1.1. Transport in Aquatic Environments
In the following, the aquatic environment is divided into freshwater and saltwater environments, with this distinction being based on the different densities of the water and on the different dominating currents. The fate of MaP in the aquatic environment is a combination of vertical transport, which is mainly influenced by density, surface area, and MaP size, and horizontal transport, which depends mainly on the prevailing currents [85].
Freshwater Environments. The vertical transport of MaP in rivers is mainly dependent on its density, with about half of the plastic produced being heavier than water and therefore expected to settle to the river bed [86]. However, in a comparison of the polymer types found in rivers and in the oceans, Schwarz et al. (2019) [85] were able to demonstrate that the stronger turbulences in rivers hinder MaP from settling, which leads to increased horizontal transport. In this context, van Emmerik et al. (2019) [87] investigated the horizontal distribution of MaP in the Saigon River and found strong variations in where the plastic is transported throughout the year. They concluded that the horizontal plastic distribution is mainly influenced by the river’s flow velocity, wind speed, and direction as well as navigation. They also noted a different distribution between ebb tide and flood tide, with the MaP being more evenly distributed over the river width during flood tide. Regarding the vertical distribution of MaP in rivers, they detected around 90% of the MaP in the upper 0.5 m. Based on their studies, they also assume that films and foils are more affected by turbulence due to their larger surface-to-volume ratio and are therefore more easily distributed in the water column. Similar to Schwarz et al. (2019) [85], they conclude that the vertical distribution of MaP is somewhat independent of the item’s density, as they found many plastic items with densities less than water below 0.5 depth, which was possibly due to density changes after biofilm development or, as already mentioned, turbulence [87].
Increased flow velocities due to extreme events cause settled MaP to be remobilised from the river bottom and transported further [88]. Such extreme events, similar to floods, are an important factor in the distribution of MaP, as it can be deposited at higher places on the banks or in floodplains due to higher flow rates or flooding [67].
Besides short-term extreme events, there is also a temporal variation in MaP transport in rivers over a year: In a study conducted on Saigon river, van Emmerik et al. (2019) [87] observed a steady decrease in MaP transport from March to August, and an increase afterwards until December, where the highest amount of MaP was transported (21% of the yearly transport). The authors could not identify correlations between flow regime, precipitation intensity, or annual tidal range variation but assumed a combination of the processes affecting the amount of MaP transport. Additionally, significantly more MaP was found in the Wonorejo River in Indonesia in the rainy season than in the dry season [89]. The geographical location of a river also has a major influence on MaP transport, as the occurrence of dry and rainy seasons (monsoon season) and the influence of tidal range depend on it [87].
Horizontal transport of MaP can be hindered by hydraulic structures such as weirs [51] or biological obstacles such as hanging branches of water hyacinths [87,90]. However, if horizontal transport is not impeded and the plastic item does not settle to the riverbed, the MaP will eventually end up in the sea [46,51,60]. It has not yet been possible to quantify the percentages of MaP retained in rivers.
Lakes. The number of studies on MaP transport in lakes is currently still very low, and the focus is more often on accumulations of MaP in shore areas. Still, due to the input paths of MaP and especially the transport via drifting, a contamination of limnic waters with MaP can also be assumed. Driedger et al. (2015) [91] identified surface current patterns as a mechanism for the distribution of MaP in lakes, but they pointed out that there has been no systematic research of this process yet. Ghaffari et al. (2019) [92] identified urbanisation and population, and to a lesser part slope and substrate, as the driving factors for MaP distribution in the Caspian Sea. The density of the plastic items has a big influence on the vertical distribution of MaP in lakes [91]. However, in freshwater lakes—especially in warm seasons—a biofilm might develop on the surface of plastic waste, which causes a large part of it to sink [93] and thus influences the MaP load on the water surface.
Estuaries. Tramoy et al. (2020) [94] investigated residence times and dynamics for MaP in the Seine estuary. According to their estimates, MaP stays in the estuary for decades (up to four decades), in a reoccurring sequence of transport, deposit, and remobilisation. Due to flood events, debris in estuaries can be transported into disconnected channels [94]. According to Ryan (2020) [95] river mouths count as one of the major emission points of MaP.
Marine Environments. In the oceans, MaP is transported both horizontally and vertically. About half of the plastic produced is lighter than water and is supposed to float in the oceans [44], especially since many plastic products also trap air (e.g., EPS, bottles), further reducing their density. According to Eriksen et al. (2014) [56], currently, 0.23 Mt of plastic are floating in the oceans.
Trade routes are an important factor in the initial MaP transport [18], as some MaP is introduced into the marine environment directly by ships, which influences the initial position in the ocean. The remaining MaP is discharged into the marine environment from coasts or estuaries and transported from there over long distances by ocean processes driven by surface winds, waves, and the earth’s rotation.
As wind and waves typically act simultaneously on a floating plastic item, an effect called leeway occurs, describing the wind and wave-induced motion of a drifting object relative to the current [96]. Additionally, wind-induced waves cause a so-called Stokes drift, in which MaP can travel long distances [96] and windage, the effect of wind on items with a freeboard, which influences MaP transport as well. The influence of wind on transport varies depending on the shape of the MaP: while large, highly buoyant items such as bottles offer large contact surfaces for the wind, films and flat packaging materials are protected from the wind and are thus more influenced by the current [95,97].
Due to the Ekman drift, which is influenced by wind and the Coriolis force, large oceanic gyres form in the marine basins, which accumulate debris [11,98,99]. These subtropical gyres are large accumulation zones of millions of km² in area, which are dominated by tiny plastic pieces, but also by MaP items. After a while, these gyres, also termed ‘garbage patches’, can release the plastic back into the open ocean or it settles to the ocean floor [96,100]. For the Great Pacific Garbage Patch (GPGP), an exponentially increasing trend was predicted as an accumulation hot spot compared to the surrounding waters [77].
On the other hand, vertical transport depends on the item’s density as well as on dynamic pressure due to the vertical movement of ocean water [96]. Negatively buoyant MaP will sink to the sea floor, while buoyant MaP might only begin to settle when biofouling occurs, as it might change the density [101]. Based on buoyancy being dependent on the volume of an item, while biofouling occurs on the item’s surface, Ryan (2020) [95] speaks of size-selective removal, as small, low-buoyancy items might tend to sink easily due to biofouling, while larger items stay buoyant. When moving offshore, he observed increasing sizes and amounts of buoyant MaP such as bottles or foamed plastics and a decrease in thin items such as plastic bags [101,102]. Biofouling might not cause MaP to settle all the way down to the ocean floor, but it leads to an oscillating pattern as the biofilm is dependent on sunlight [103,104]. Additionally, to the items’ density, the mixing of the ocean boundary layer, which is in the upper 10 to 100 m of the ocean surface, might transported MaP away from the ocean surface, and hyperpycnal flows can funnel MaP into submarine canyons [96]. Koelmans et al. (2017) [57] estimate that up to 99% of the plastic that has been introduced into the aquatic environment since 1950 has settled to the ocean floor. They expect plastic items to settle after a mean time of only 3 years. Once MaP has settled to the sea floor, it might stay there forever or get transported by gravity-driven turbidity currents [105], which transport terrestrial sediments and organic carbon over thousands of km to the deep sea. This might be the reason why submarine canyons have been reported to be hotspots for MaP and microplastic [105]. Additionally, near-bed thermohaline-driven currents influence the accumulation of plastic items on the seafloor [106].
In coastal regions, MaP can be washed ashore, depending on water depth, wind, waves, tides, coastline morphology, and its interaction with the hydrodynamics [96,107]. 60 to 90% of land-based plastic are expected to strand on beaches after being introduced into the oceans [95,108,109], where it can be buried or transported into backshore vegetation [95]. Lebreton et al. (2019) [14] expect even 96–98% of plastic becoming stranded within 1 year of release. However, both assumptions contradict Koelmans et al.’s (2017) [57] hypothesis that 99% of the plastic ends up on the sea floor, highlighting the high uncertainties of all estimates regarding the fate of plastic debris in the oceans. Regarding the amount of plastic stranding shortly after release, Ryan (2020) [95] point out the importance of flow conditions, as well as the size and buoyancy of the MaP. Ho and Not (2019) [110] investigated if a selective accumulation of plastic debris occurs in nearshore waters and came to the conclusion that the area where waves break and backflush occurs accumulates both MaP and microplastics. This behavior seems to be dependent on the item’s buoyancy, size, and surface area. Lee et al. (2013) [111] found higher amounts of MaP on the backshore than on the high strandline (closer to the water than the backshore), indicating transport processes leading to an accumulation on the backshore. Average residence times for MaP have been measured in several studies [112,113,114,115,116], ranging from 209 [112] to 518 days [113]. While Turrell (2018) [117] proposed that for macro tidal beaches (tidal range > 4 m), no MaP accumulation over time occurs, Garrity and Levings (1993) [116] observed a slow accumulation of plastic debris over time for the Caribbean coast of Panama (average of 3 m tidal range). From their investigations, Kataoka et al. (2015) [113] deduced that the majority of the MaP is transported from the beach along the coast and concentrated in the convergence zone, only to be subsequently washed back by the wave-driven coastal currents, with the mean residence time of MaP on the beach depending on the frequency of the occurrence of a storm event and the near-shore current structures [113]. This process is called backwash. Due to bidirectional flow, MaP might accumulate in estuaries [21,118]. Critchell and Lambrechts (2016) [119] developed a advection–diffusion model to represent the relevant physical processes that are responsible for an accumulation there. However, only a few studies focused on MaP in estuaries so far [120,121].
Cozzolino et al. (2020) [122] compared MaP concentrations in different coastal vegetated habitats, including intertidal (seagrass and saltmarsh) and subtidal habitats (mixed seagrass meadows and rhizophytic macroalga) in Portugal. In their comparison, a trapping effect of MaP only occurred in the saltmarsh habitat, although this might be highly variable and dependent on plastic size, habitat, and tidal position.
Extreme events, such as floods, tsunamis, and storms are supposed to affect MaP transport significantly, but details have not yet been researched [96]. When comparing superficial MaP and buried MaP at two South African beaches, about 6–34% of the MaP items were buried in the upper 15 cm of the beach [95], with the buried MaP items being smaller as they are easier to bury by windblown sand. Ryan (2020) [95] also identified storm drain outfalls as well as river mouths as a major emission point. Carlton et al. (2017) [50] refer to the expansion of coastline infrastructure resulting in an increasing entry paths for plastic material after extreme events, such as tsunamis. With regard to the 2011 tsunami in Japan, they documented a transoceanic dispersal and survival of species of coastal regions by so-called rafting over six years and thousands of kilometres.
Sea ice formation and its transport also influences the distribution of MaP in the marine environment. Due to so-called scavenging, the plastic becomes trapped in the ice and might be released at a different location due to ice melting [96].
3.1.2. Transport in Terrestrial Environments
MaP is transported in the terrestrial environment mainly on farmed fields via anthropogenic activity such as ploughing. With a total amount of 6.5 Mt plastic per year that is used in agricultural areas [54] and an estimated waste generation of 2.297 Mt/a, there is a lot of material for further transport from there. Rain also influences the transport by surface runoff [7], as well as wind influences the distribution in the terrestrial environment.
3.1.3. Transport in Aerial Environments
MaP can be transported with the wind over long distances, leading to an accumulation of MaP also in peripheral regions, such as deserts or mountains [67,123,124]. In aerial transport, the shape of the MaP plays an important role: The majority of plastic in the atmosphere are micro- and nano-size particles, but larger items may be suspended in the atmosphere if they have certain characteristics (e.g., disposable plastic bags and balloons) [7]. The storage and transportation of plastics in the aerial environment are mostly temporal, as they are highly dependent on the prevailing meteorological conditions at different timescales [7].
3.2. Macroplastic Concentrations in the Environment
As MaP accumulates in the different environmental compartments, the different concentrations can be reported separately for freshwater, marine, and terrestrial environments.
3.2.1. Freshwater Environments
Rivers. Rivers are considered the main transport path of land-based MaP [5,51,87,118]. In most cases, the concentration of plastics in river systems is stated in the amount of plastic transported into the ocean. Lebreton et al. (2017) [51] assume an annual input of between 1.15 and 2.41 Mt of plastic waste, based on waste management, population density, and hydrological information, with 74% of the input occurring between May and October.
These data can be compared with studies carried out at 24 sites along rivers in seven different countries in Europe (Italy, The Netherlands, France) and Asia (Vietnam, Indonesia, Thailand, Malaysia), in which the proportion of transported MaP was determined. The averaged values are highest for South-East Asia (1000–10,000 MaP items/h) and significantly lower for Europe (100–1000 MaP items/h), which is due to the heavy pollution of the rivers in Indonesia and Vietnam [125]. This is consistent with the quantities of superficial MaP measured by Vriend et al. (2020) [5] in the Rhine, accounting for 10–75 items/h. The unit of items per hour was also used for calculations of waste transport in the Tiber, Rhone, and Seine. In the Tiber, the load is about 10–50 items/h [126], in the Rhone, it is about 0–20 items/h [127], and in the Seine, it is about 106–160 items/h [87].
In addition to global and cross-national estimates, individual flow systems were also analysed. For example, van Emmerik et al. (2019) [87] investigated the seasonality of fluvial MaP taken in the Saigon River in Vietnam and estimated a total discharge of MaP of 7500 to 13,700 t/a for 2018. In comparison, a plastic discharge into the Black Sea of 4.2 t/d was calculated based on sampling for the Danube, resulting in an annual discharge of 1533 tons [118]. [118] also detected microplastic in shapes of pellets, spheres, and fragments, which accounted for between 12 and 38.4% of the total mass. A study along the Seine River found a proportion of 0.8–5.1% plastics within the waste transported by the river, determining an annual transport of 22 to 36 tons of plastic in the Seine [128]. For the Rhine, MaP transport with a volume of 1.3–9.7 kg/d, resulting in an annual transport of 0.5 to 3.5 tons of MaP was determined [5], while van der Wal et al. (2015) [129] calculated 5.8–58.4 t/a. Additionally, three German rivers were investigated by Schöneich-Argent et al. (2020) [130], with the results indicating high loads of plastic litter being introduced into the North Sea by the Elbe (up to 451 t/a) and lower loads for Ems (up to 1.6 t/a) and Weser (up to 6.3 t/a). Schirinzi et al. (2020) [131] estimated an annual discharge of 0.4–0.6 tons of plastic into the ocean by two Catalan rivers, Llobregat and El Beses. In comparison to the Saigon River, the loads in the Danube, and especially the loads in Seine, Rhine, and the Catalan rivers can be rated as significantly lower.
Figure 4 compares estimates of the annual MaP discharge into the oceans based on numerical modelling and sampling. The majority (91%) of plastic waste that is not disposed properly will be transported via waterways. The plastic freight will be disproportionately high, especially on the African and Asian continents. Thus, the scenarios show that rivers will remain the main input path for plastic waste into the oceans [29].
In fluvial sediments, which also include floodplain sediments, MaP is mainly deposited by flood events. Due to the transport and deposition of MaP in the floodplain area, it can be overlaid by further sedimentation events and thus found in deeper layers. Sampling at the banks of five different rivers in Nigeria has shown high levels of MaP contamination, with 3487 waste items/m² (>5 cm), 59% of which were MaP [133]. Along the Paranà River in Argentina, the average MaP abundance was 5.05 items/m² [134]. With the use of crowd-based observations, van Emmerik et al. (2020) [9] estimated for the riverbanks of the Rhine River (The Netherlands, downstream stretch) a concentration of 573–1033 items/km with an increase towards the estuary.
Lakes. Six lakes in Switzerland were investigated by Faure et al. (2015) [135], and an average of 1800 MaP items/km² was detected on the water surface. In addition to the samples, an input of 55 t of plastics/a was modelled for Lake Geneva [136].
Overall, based on the high load on the shores of lakes, it can be assumed that the water surface is only a temporary concentration point for MaP and that this accumulates mainly on the shore.
During investigations of limnic sediments on the shore of a lake in South America, Blettler et al. (2017) [8] detected 0.87 MaP items/m². Corcoran et al. (2015) [137] were able to demonstrate similar results at Lake Ontario, with 0.8–1 MaP items/m², which is here indicated for non-fragmented particles. In addition, information was provided on plastic pellets, fragments and EPS, which largely corresponded to the size definition of MaP. The load for pellets was between 8.8 and 21.2 pellets/m², for fragments, it was between 3.6 and 4.5 fragments/m², and for EPS, the load was 1.3–1.7 g/m². The accumulation of pellets correlates with weather conditions, as the load was significantly higher after heavy rainfall. In Switzerland, significantly higher loads with 90 MaP items/m² were found on the shores of six different lakes (Lake Geneva, Lake Constance, Lake Neuchâtel, Lake Maggiore, Lake Zurich and Lake Brienz) [135]. In Lake Victoria in Africa, 0–100 items/kg dry sediment (mean: 25.5 items/kg dry sediment) have been found in the shoreline sediment and 0–77 items/kg dry sediment in the lake sediment. Nearly all (95%) of the MaP was fishing related, such as fishing nets and floats [138].
Estuaries. Research regarding MaP pollution in estuaries is still very limited despite being valuable ecosystems and highly populated areas [121]. Browne et al. (2010) [139] found clear patterns of distribution for less dense items (>1 mm), as the MaP items were mostly made of EPS, PE, and PP. The MaP consisted mainly of packaging (50%), sanitary towels (15%), shipping rope (7%), fishing lines (6%), and cotton buds (4%). Regarding the seasonal variation of MaP concentrations in Indonesian estuaries, Kurniawan and Imron (2019) [89] identified significantly higher accumulation rates during the rainy season, as they found between 126.07 and 375.97 g/m² during the dry season and between 443.17 and 1162 g/m² during the rainy season, with PET being the most common polymer type (59.77%).
Yao et al. (2019) [140] investigated a newly formed saltmarsh in the mouth of the Ou river (China) regarding their MaP pollution and found between 200 and 4350 items/m² on the beach and 70 items/m³ in the water. In comparison, Cozzolino et al. (2020) [122] found with 17.3 ± 13.3 items/100 m² in the sediment of a Portuguese saltmarsh considerably less MaP.
3.2.2. Marine Environments
Open Oceans. Plastics represent the largest proportion of floating marine waste (Galgani et al., 2015) and account for about 75% of the total volume (Pieper et al., 2019). In the first scientifically published studies on MaP pollution of the marine environment, Carpenter and Smith (1972) [141] examined the water surface of the Sargasso Sea and detected concentrations of 3500 items/km² or 290 g/km². Colton et al. (1974) [142] investigated the water surface of the northwestern Atlantic and detected an average load of 77.7 g of plastic/km².
In comprehensive investigations on floating waste (>2 cm) in the Mediterranean Sea, the results were divided into natural or anthropogenic sources. Over 95% of the anthropogenic waste was made out of plastic. Based on the investigations, Suaria and Aliani (2014) [143] estimated a pollution of the Mediterranean Sea with 62 million macro-waste items. Regarding floating marine litter, MaP accounts for a share between 68 and 98.8% [144]. Along the European coastal waters, concentrations of plastics ranged between 6.4 (Bay of Seine) and 263 (Adriatic Sea) items/km² [145].
MaP floating on the surface of the oceans worldwide are estimated to be 389.9 billion pieces with a weight of 233,460 tons [56]. Compared to the amount of MaP entering the environment (cf. Figure 3), this seems to be very little, which can be explained by the huge amount that is assumed to have already sedimented on the sea floor [25,57]. The greatest contamination is found in the North Pacific, with a share of 34.6% in terms of the number of MaP and 36.1% in terms of weight of the total global contamination. High densities of MaP were found in the coastal water of the Southeast Pacific, which decreased with higher distance to the coast [146]. However, when reaching the South Pacific Subtropical Gyre (SPSG), the densities of MaP are high again, consisting mainly of large fragments (95.4%), lines (17.7%), and buoys (7.6%) [146]. Probably originating from the SPSG, an accumulation also occurs on island beaches, such as Rapa Nui (Easter Island), where most of the detected litter items were plastic [147].
For the GPGP, a quantity of 79,000 tons and 1.8 × 10¹² items of ocean plastic (46% fishing nets) accumulated with an area of 1.6 million km² was calculated whereof more than 75% were debris > 5 cm [77].
In contrast to the high loads within the garbage patches, Suaria et al. (2020) [148] were able to show by sampling that in a global context, plastic pollution is lowest in the Southern Ocean. They detected south of the Subtropical Front 0.02–0.03 floating MaP/km² assuming that this front acts as a barrier for a further transport.
Shorelines. Coastal zones are particularly affected by plastic [149]. Here, vegetation can influence the retention of MaP and also microplastic [122]. According to European Commission censuses, about half of the waste found on European beaches is disposable plastic items. Of these, 86% of all disposable plastic items correspond to the ten most commonly found products, including food packaging, beverage cups, and disposable cutlery [150].
Already in 1990/91, Bowman et al. (1998) [115] measured the amount of plastic items at the Israeli coast. In their monthly sampling, they identified 71% of all debris being plastic. They apply a pollution density index, which was introduced by several other studies, which classifies the pollution of the beaches into low pollution (<1.0 items per 1 m beach front), medium pollution (1.0–10 items per 1 m beach front), or high pollution (10–100 items per 1 m beach front). The highest pollution they found was 21–35 items per 1 m of beach front or 0.13–0.32 per m², with an average pollution of 0.02–0.062 items/m².
Galgani et al. (2015) [144] estimated the average density of global coastal debris at 1.0 items/m², with 75% of it being plastic. Garrity and Levings (1993) [116] examined stranded debris on the Caribbean coast of Panama and identified 82% as plastic. Gündoğdu and Çevik (2019) measured MaP concentrations on the Turkish part of the Mediterranean coast and found an average concentration of 12.2 ± 3.5 items/m², ranging between 2.3 ± 0.2 and 46.2 ± 7.6 items/m². The items’ mean size was 3.7 ± 0.16 cm. They compared different studies that analysed the Mediterranean coast for MaP (and also mesoplastic) on the beach whereof the highest average plastic pollution was detected on a Turkish beach (Samandağ) with 19.5 items/m² [151], while the lowest density was found on Israeli beaches with 0.02–0.062 items/m² [115] and 0.04–2.09 items/m² [152]. All in all, they concluded, similar to Mansui et al. (2015) [153], that the eastern part of the Mediterranean Sea has a particularly strong accumulation of plastic waste.
Lee et al. (2013) [111] sampled six beaches near the Nakdong River Estuary in South Korea and found 238 items/m² mesoplastic (5–25 mm) and 0.97 items/m² MaP (>25 mm). Gómez et al. (2020) [154] sampled beaches in central Chile and compared concentrations of plastic debris during spring and summer with a higher abundance during summer (4.1 ± 3.7 items/m²) with 42% in a size range from 2.5 to 10 cm. Similar concentrations related to human activities, such as fishing, were found by Jeyasanta et al. (2020) [155] along the Tuticorin coast in India. Regarding MaP (here > 2.5 cm), 1.38 ± 78 to 6.16 ± 94 items/m² were detected, while mesoplastic (5 mm–2.5 cm) had higher concentrations (2 ± 0.8 to 17 ± 0.11 items/m²). Maharana et al. (2020) [156] also analysed Indian beaches and found an average abundance of 194.8 items/m².
Overall, accumulation rates in the southern hemisphere appear lower than in the northern hemisphere [144]. The MaP contamination of coastal areas is influenced by larger cities, land use, hydrodynamics, and maritime activities. This can be exemplified by studies in Indonesia along the Strait of Makassar. There, marine macroscale waste (2.5–100 cm) was collected, of which 82–85% was plastics and rubber. In total, the amount of waste was highest near residential areas (6.03 ± 1.49 items/m²), followed by the contamination of a recreational area (4.13 ± 4.69 items/m²) and the lowest evidence of waste in a private area (0.42 ± 0.34 items/m²) [157].
Monteiro et al. (2018) [82] reviewed the literature on micro- and macroplastic accumulation on islands, and they compiled data on MaP from 17 studies. According to them, marine-based sources of MaP are more important for islands, including fisheries (>40% of debris was fishing gear) and leisure cruises. MaP concentrations reported in the 17 studies were between 0.01 and 11.2 items/m. The Caribbean islands were particularly polluted wit MaP, presumably as a result of strong tourism. Figure 5 summarises the above-mentioned concentrations of MaP on shorelines whereby the study sites are divided into southern and northern hemisphere by colour. This shows that the available data clearly predominate in the northern hemisphere, whereas there are hardly any data in the southern hemisphere.
Sea Floor. The MaP pollution of marine sediments includes accumulation in coastal areas as well as accumulation on the sea floor. Below the light-flooded zone of the oceans, MaP degrades very slowly, which favours accumulation on the sea floor [164]. 90% of the waste detected on the seafloor is plastic [144]. The deepest detection of MaP on the sea floor was photographed in 1998 at a depth of 10,898 metres (Mariana Trench) and shows a plastic bag [165]. If, according to Koelmans et al. (2017) [57], 99% are already sedimented on the seafloor, this amounts to 386,001 million items and about 231,125 tons of MaP on the seafloor worldwide under the assumption of 57 [56].
In the northwestern Mediterranean Sea, Galgani et al. (1996) [166] detected 70.6% MaP within the total waste found, whereof 70% were plastic bags. Along European coastlines, similar results were provided, since 70% of the total amount of waste was MaP consisting mainly of bags and bottles [145].
Pham et al. (2014) [167] found correlations between pollution and seabed morphology in relation to seabed waste within the Atlantic, Mediterranean, and Arctic. Divided into the different physiographic study areas, the load of plastics was highest along the continental shelves and in the submarine canyons. Ocean ridges, seamounts, mounds, and banks were largely polluted by fishing gear (lines and nets).
A comprehensive study was conducted by Chiba et al. (2018) [168] over a period of 30 years on plastic debris in the deep sea of the Pacific, Atlantic, and Indian Oceans. For detection, photographs and video recordings of more than 5000 dives were evaluated, and it was found that more than 33% of all materials found (3245 items) belonged to the category of MaP, and 89% of these were disposable plastics.
As part of a citizen science programme on waste on the Mediterranean seabed in shallow coastal waters, investigations were carried out between 2011 and 2018 [169]. A total of 468 dives were performed at 172 stations in the Mediterranean Sea. A total of 69,104 waste items were detected with a concentration of around 44 articles/100 m². Of these, 55% were plastics, consisting of 33% disposable plastics and 22% non-returnable plastics. In addition to plastics, metal (23%) and glass and ceramics (11%) were also found. The largest absolute shares were plastic fragments with 9.46%, followed by metal beverage cans with 7.45%, glass and ceramic bottles (6.47%), plastic bottles with a volume < 2 l (6.33%), cigarette butts (5.14%) and plastic fishing lines (4.96%).
Polar Waters and Ice. In 2007 and 2008, Barnes et al. (2010) [170] conducted a survey around East and West Antarctica to quantify floating MaP. The marine debris was dominated by plastic, including two plastic bags, plastic packaging, a plastic cup, and a fishing buoy.
3.2.3. Terrestrial Environments
Soils. MaP contamination has been demonstrated both in soils of settlement areas and in soils of peripheral regions. In southeastern Mexico, 74.4 ± 20.4 PE bottles and 7.4 ± 6.5 other MaP items/m² were detected in home gardens due to waste disposal there [171]. Furthermore, the pollution of peripheral regions by MaP shows on the one hand the importance of the various transport processes that can transport MaP over thousands of kilometres [139] and, on the other hand, the high influence of anthropogenic action. A study in Sagarmatha National Park in Nepal, where Mount Everest is located, showed that the main polluters are mountaineers and climbers, followed by accommodation and hotels. The average contamination was 23 MaP items/m² [172]. MaP was also found in deserts, such as the Sonora Desert in southern Arizona. In two areas, concentrations of 5.6–35.4 plastic bags/km² and 39.2–62.7 balloon films/km² were detected there [124].
Rocks. In addition to the contamination of sediments and soils, a solid, deposited plastic layer on rock was detected for the first time in 2014. At Kamilo Beach in Hawaii, so-called ‘plastiglomerates’ were defined by the authors Corcoran et al. (2014) [173] as multilayered material consisting of molten plastic, beach sediments, basaltic lava fragments, and organic matter. Despite the volcanic origin of Hawaii, no flowing lava was recorded at the locations of the detected plastiglomerates during the last century. The reason for the deformation of plastics on the beach is the heat from campfires and the resulting melting and resolidification.
In 2019 and 2020, plastic deposits were found on rocks in two other, different coastal regions. These deposits were called ‘plasticrust’ and are the result of the solidification and subsequent encrustation of marine MaP, which, hydrodynamically induced, continuously collide with the coastal rocks. Due to this formation and a continuous input of MaP into the marine environment, an increase of this contamination at the rocks of the coastal areas can be assumed. The extent of the plasticrust is variable in terms of area and colour. On the coast of Madeira, thicknesses between 0.77 ± 0.1 mm have been detected in the middle to upper tidal zone [174]. Plasticrust on the coast of Giglio was between 0.5 and 0.7 mm thick in the middle tidal zone. Since the maximum tidal amplitude on Madeira (2.6 m) is significantly higher than on Giglio (0.45 m), a correlation between distribution and tidal thickness could be established. Thus, the occurrence of plasticrust depends on the factors MaP occurrence near the coast, wave exposure, and tidal amplitude [175].
3.3. Sinks of Macroplastic
Plastic is highly persistent; thus, it can stay in the environment for a long time. Therefore, there are various temporary sinks along the way of MaP through the environment before it accumulates in permanent sinks.
Temporary Sinks. Regarding temporary sinks of MaP, different areas need to be mentioned. During transport, MaP may deposit in peripheral areas [67], on floodplain areas of rivers [21], on shorelines of lakes [91], and in coastal zones [164], and in addition, it may stay temporarily on the water surface of lakes [135] and oceans [176] before it is transported to the shorelines and coasts or sinks to the sea floor.
In fluvial systems, hydraulic infrastructure, such as dams and sluices, act as sinks for riverine plastic debris [21,51] until it is removed. Temporal sinks might also include ripasoan vegetation [22]. Vermeiren et al. [121] identifies estuaries as temporary sinks for MaP, as it might be retained in bottom and coastal sediment. Furthermore, soils and especially agricultural soils [67] act as a temporary sink. These temporary sinks are already indicated in the described concentrations of MaP mentioned before and are similar to sinks of microplastic [16].
Permanent Sink. The permanent sink for MaP in the environment is the sea floor where numerous investigations already show an accumulation of MaP [144,145,167] Furthermore, especially deep sea areas are highly contaminated [166,168,177]. According to Lebreton et al. (2019) [14], who established a global mass budget for buoyant MaP in the oceans, the development of microplastics from MaP as mass loss in the marine environment can also be considered a permanent sink.
Figure 6 gives an overview of the described pathways and accumulation zones as well as temporal and final sinks.
4. Receptors of Macroplastic
In addition to sources and pathways, receptors are a decisive consideration aspect of the SPR model. Here, fauna and flora are regarded as receptors as well as consequences on ecosystem and economy. Based on the sources and pathways, the receptor analysis shows the further consequences and implications and thus fills the data for a holistic view of MaP in the environment. In addition to the impact on the environment, the extent to which the economy is affected, which is often neglected, also becomes clear. In the future, entry reduction measures can be taken in relation to the identified receptors.
Fauna as Receptors. Gall and Thompson (2015) [178] reviewed the effects of plastic in the oceans and collected more than 240 publications on marine organisms ingesting or becoming entangled by marine debris.
Ingestion of plastic. The ingestion of MaP by organisms can cause a blockage of the intestinal track, inhibit gastric enzyme secretion, reduce feeding stimuli, decrease steroid hormone levels, delay ovulation, and inhibit reproduction. It often does not lead to the direct death of the organisms, but it can cause sub-lethal or chronic effects with long-term consequences [18]. The first study on the uptake of plastics by living organisms was published as early as 1969 [179]. For this purpose, 100 dead albatrosses were examined on the Hawaiian Islands. Of the 91 animals that contained indigestible material in their stomachs, plastic was found in the stomachs of 74 animals with an average volume of 2 g/plastic per bird. Due to the plastic that was wrongly taken in as food, which accumulated in the stomach as indigestible material, further food intake was stopped. Furthermore, investigations in the Gulf of Mannar (India) studied the effects of the deposition of marine waste, with the largest proportion of fishing nets (MaP), on corals. An estimated area of 1152 m² of the coral reef is affected by waste deposits, which lead to fragmentation and tissue loss of the corals [180]. Overall, the number of species within all groups of wildlife that have been affected by entanglement or ingestion has doubled since 1997, from 267 to 557. For sea turtles, the proportion of affected species has risen to 100%, for marine mammals, it has risen to 66%, and for seabirds, it has risen to 50% [181]. Sea turtles are known to mistake plastic bags for jellyfish [182]. Albatross parent are also known to feed plastic items to their chicks, leading to high densities of MaP in their stomachs [183]. Li et al. (2016) [18] collected in a literature review all species (seabird, sea turtle, fish, and other organisms) that ingested plastic (microplastic and MaP), showing a wide range in species, numerous regions, and a high occurrence.
Plastic entanglement. The entanglement of organisms in MaP can lead to drowning, suffocation, laceration, reduced fitness, reduced ability to prey, or an increased probability of being caught [18]. Ropes, nets, other fishing materials, and packaging material are often involved; then, animals get entangled [184,185]. Kühn et al. (2015) [181] estimated that at least 344 marine species have become entangled in marine debris, including invertebrates, sea snakes, sharks, fishes, turtles, marine mammals, and seabirds. Study periods from 1988 to 2013 showed entanglement rates between 0.024 and 5.6% of seals and sea lions, seabirds, and others [18].
Leakage of toxic additives and accumulation of toxins. In addition to additives, which are added during production, pollutants such as persistent organic pollutants (POPs) accumulate on MaP and microplastics in the aquatic environment. POPs refer to synthetic organic compounds, some of which are highly toxic and can cause endocrine (hormone-active) disorders; they can also be mutagenic and carcinogenic. In addition, they are chemically stable and therefore difficult to degrade in the environment and by organisms. Due to lipophilic properties, they can accumulate in the organisms’ fatty tissue and thus in the food chain. Investigations into the interactions between POPs and the marine environment have shown that plastic waste is generally regarded as an accumulation point for POPs [186]. Research on plastic waste in the North Pacific garbage patch detected polychlorinated biphenyls (PCBs), chlorinated pesticides, and polycyclic aromatic hydrocarbons (PAHs) on the plastics, which are classified as both carcinogenic and endocrine disrupting [187]. MaP can also accumulate pollutants in the environment, such as heavy metals [41].
The additives in the plastic waste might leach into the aquatic environments. After being released into the environment, additives such as nonylphenol (NP) and bisphenol A (BPA) can be washed out [188]. In 1972, after the detection of MaP in the marine environment, the discharge of plasticisers and the resulting uptake by marine organisms was already pointed out [141]. The discharge of additives into the environment and the contamination of the environmental media soil, air, and water can take place via various processes [189]. Further investigations concern in particular the leaching of additives and the resulting input into soils [190].
Furthermore, chemicals can be washed out of cigarette butts, which are not only toxic but also pervasive and recalcitrant [191]. Chemicals are already used in the cultivation of tobacco and in the production process of cigarettes. Then, residues of these chemicals can be found in the product. Cigarette butts and waste from tobacco products contain toxins, carcinogens, and nicotine that can be washed out in salt and fresh water [53]. Since filters are made of cellulose acetate, it takes up to ten years for them to decompose, and heavy metals and toxic chemicals such as PAHs can be released during this period [192]. Studies have shown that these components are toxic to aquatic microorganisms and fish. Between 1.8 and 4.3 cigarette butts per litre have already resulted in lethal concentrations for 50% of the fish species studied [63].
Breakdown into microplastics. As already described within the input pathways, MaP in the environment supports the formation of microplastic. Especially in coastal areas, where the UV radiation and mechanical stress caused by wave movement is particularly high, the degradation and fragmentation of MaP occur [193]. Table 2 shows the different categories, processes, and driving factors causing decomposition.
As Figure 7 illustrates, up to 550,000 microplastic particles (films) with dimensions of 0.3 × 0.3 mm can be produced from just one 0.5 L bottle.
Flora as Receptors. Floating plastic waste in the marine environment can serve as a potential vector for the growth and spread of microalgae [195] and bacteria [141]. This is done by the transport of MaP within marine areas. Zettler et al. (2013) [12] found a variety of microbes on marine plastic waste in the North Atlantic, whose habitat they described as “plastisphere”. Thus, the plastics serve as a new, ecological habitat on the open sea. Carlton et al. (2017) [50] discovered 289 living species (coastal marine, 16 phyla) that were transported on infrastructure destroyed by the 2011 tsunami in Japan over six years and thousands of kilometres. The colonisation by microbes also supports the degradation of plastics.
A further interaction of MaP and flora in the terrestrial environment has been demonstrated by plastic mulch films. Using wheat plants as an example, it could be shown that film residues influence both the above and below ground part of the plant during vegetative and reproductive growth [196]. Furthermore, MaP in agricultural soils can generally cause reduced seed germination or impaired root growth [54].
Consequences on Ecosystems. A long-term consequence of MaP in the environment is the emission of climate-relevant trace gases. This is caused by the breaking of macromolecular chains when the plastic is broken down in the environment. In a study, PC, acrylic (AC), PP, PET, PS, HDPE, and LDPE were investigated under terrestrial and aquatic conditions. The release of methane (CH4) and ethylene (C2H4) was twice as high in air for methane and 76 times higher for ethylene than in water, because outside of water, a stronger heating of the plastic compared to the environment is possible [197].
However, in comparison to the global methane budget, the proportion originating from plastics is rather insignificant. Still, an increase in emissions from plastics can be expected as plastics are increasingly released into the environment. Furthermore, the degradation and fragmentation of MaP results in the microplastic fraction, which has a larger surface area and thus promotes and accelerates hydrocarbon production [197].
Woods et al. (2019) [184] propose using life cycle impact assessments (LCIA) to quantify the effects that plastic items have on the environment, including lost/degraded habitats as well as lost/harmed organisms. The basis for this is more precise knowledge of the input quantities and the transport routes or residence times of MaP in the individual environmental compartments.
Economic Consequences. Beaumont et al. (2019) [198] calculated an annual economic damage of 22 billion Euros due to plastic waste in the oceans. Additionally, plastic waste clogs urban drainage infrastructures, increases flood risk and economic losses due to the damage of vessels and fishing gear, has negative effects on the tourism industry, and requires increased shoreline cleaning efforts [21].
Loss of aesthetics. The loss of aesthetics as a direct consequence is given by the accumulation of MaP in the environment [6]. Especially tourist regions whose attractiveness is based on a natural environment in a clean state are confronted with litter and the resulting waste due to the large number of visitors. There is a correlation between the number of tourists and the amount of plastic waste [195].
In Oceania, harmful effects were already pointed out in the 1970s, with ecological and sociological consequential costs that can result from an increase in tourism. Waste disposal, particularly in coastal areas, was cited as the cause. Marine waste was declared to be detrimental to the visual and aesthetic sensitivity of tourists and the local population with reference to a possible health risk. Overall, an increase in littering was noted with the increase in tourist activities [199].
5. Conclusions
By applying the SPR model, the pathway of MaP through the environment can be shown. The model has contributed to differentiating in detail between sources, pathways, and receptors and thus describing the consequences when MaP enters the environment. Here, the source of MaP in the environment is the mismanaged proportion of the plastic production, which is introduced via different entry paths into the environment. Aerial, terrestrial, and aquatic (marine, fluvial, limnic) pathways provide a transport of MaP in these environmental areas or from one area to another. Based on these pathways, the flora, fauna, ecosystems, and economy function as receptors (see Figure 8). A weighting of MaP in comparison to other materials in the environment is difficult, even with the SPR model, as this is a qualitative rather than a quantitative approach. Nevertheless, future areas of action can be identified in this way.
The current research focus is particularly on microplastics, although MaP is often regarded as the starting product of microplastics, and therefore, its behaviour and distribution in the environment is equally important.
By compiling the current state of knowledge on MaP in the environment in a structured way using the SPR model, some knowledge gaps can be highlighted. These can be summarised in the following points:
- How can MaP be meaningfully defined so that the high diversity of items is comprehensively represented?
- How can the individual sources and entry paths of MaP be quantified?
- Is the composition of plastic debris changing over time?
- What are the main influences on aquatic, terrestrial, and aerial transport of MaP?
- How do the temporal changes of the MaP (biofouling, fragmentation) and the surrounding systems (dry/rainfall season, tides, extreme events) influence the transport?
- What influence does the high diversity of MaP items have on ecotoxicology?
- Where and how can MaP be effectively removed from the environment?
The broad definition of MaP is a major problem here, as this makes the items under consideration highly diverse, and they therefore differ greatly in their transport behaviour and ecotoxicological effects. Nevertheless, in the future, research should be increasingly extended to MaP and with the size definition ≥5 mm, a clear delimitation to microplastic is given, which simplifies the differentiation within future research work.
Environmental sampling alone will not enable us to comprehensively address the problem of MaP in the future; hence, we need a combination of modeling, laboratory experiments, and field measurements [200]. It is also essential to include the environmental impact of plastics in the life cycle assessments (LCA) of plastic products [184].
Of particular note is the extremely important and yet lacking knowledge of the transport processes of MaP in the aquatic environment, as it was presented in this review study. Only with a sound knowledge of the influences on the distribution of MaP in the environment can sinks, and thus receptors, be specified. These basic mechanisms of distribution are also indispensable for technologies that address the MaP problem and seek to address it [87]. Therefore, future recommendations will not only include a technical solution, but also educational programmes based on a holistic view regarding MaP in the environment.
Author Contributions
S.L.: Conceptualisation, Writing—Original Draft, Review and Editing; K.W.: Conceptualisation, Writing—Original Draft, Review and Editing; G.S.: Supervision; H.S.: Supervision. All authors have read and agreed to the published version of the manuscript.
Funding
This paper has received no external funding.
Acknowledgments
S.L. gratefully acknowledges the funding of RWTH Scholarships for Doctoral Students. K.W. gratefully acknowledges the funding of DBU.
Conflicts of Interest
The authors declare that they have no known competing financial interests or personal relationships that could have appeared to influence the work reported in this paper.
References
- Hopmann, C.; Michaeli, W. Einführung in die Kunststoffverarbeitung, 7th ed.; Hanser, C., Ed.; Carl Hanser Fachbuchverlag: Munich, Germany, 2015; ISBN 978-3-446-44627-4. [Google Scholar]
- Baur, E.; Osswald, T.A.; Rudolph, N.; Saechtling, H. Saechtling Kunststoff Taschenbuch; Saechtling, H., Ed.; Carl Hanser: Munich, Germany, 2013; ISBN 3446437290. [Google Scholar]
- Thompson, R.C.; Olsen, Y.; Mitchell, R.P.; Davis, A.; Rowland, S.J.; John, A.W.G.; McGonigle, D.; Russell, A.E. Lost at sea: Where is all the plastic? Science 2004, 304, 838. [Google Scholar] [CrossRef] [PubMed]
- Billard, G.; Boucher, J. The Challenges of Measuring Plastic Pollution. Veolia Inst. Rev. Facts Rep. 2019, 68–75. [Google Scholar]
- Vriend, P.; van Calcar, C.; Kooi, M.; Landman, H.; Pikaar, R.; van Emmerik, T. Rapid Assessment of Floating Macroplastic Transport in the Rhine. Front. Mar. Sci. 2020, 7, 10. [Google Scholar] [CrossRef] [Green Version]
- Koelmans, A.A.; Besseling, E.; Foekema, E.; Kooi, M.; Mintenig, S.; Ossendorp, B.C.; Redondo-Hasselerharm, P.E.; Verschoor, A.; van Wezel, A.P.; Scheffer, M. Risks of Plastic Debris: Unravelling Fact, Opinion, Perception, and Belief. Environ. Sci. Technol. 2017, 51, 11513–11519. [Google Scholar] [CrossRef]
- Windsor, F.M.; Durance, I.; Horton, A.A.; Thompson, R.C.; Tyler, C.R.; Ormerod, S.J. A catchment-scale perspective of plastic pollution. Glob. Chang. Biol. 2019, 25. [Google Scholar] [CrossRef] [Green Version]
- Blettler, M.C.M.; Ulla, M.A.; Rabuffetti, A.P.; Garello, N. Plastic pollution in freshwater ecosystems: Macro-, meso-, and microplastic debris in a floodplain lake. Environ. Monit. Assess. 2017, 189, 581. [Google Scholar] [CrossRef]
- Van Emmerik, T.; Seibert, J.; Strobl, B.; Etter, S.; den Oudendammer, T.; Rutten, M.; bin Ab Razak, M.S.; van Meerveld, I. Crowd-Based Observations of Riverine Macroplastic Pollution. Front. Earth Sci. 2020, 8, 382. [Google Scholar] [CrossRef]
- Woodall, L.C.; Sanchez-Vidal, A.; Canals, M.; Paterson, G.L.J.; Coppock, R.; Sleight, V.; Calafat, A.; Rogers, A.D.; Narayanaswamy, B.E.; Thompson, R.C. The deep sea is a major sink for microplastic debris. R. Soc. Open Sci. 2014, 1, 140317. [Google Scholar] [CrossRef] [Green Version]
- Law, K.L.; Morét-Ferguson, S.; Maximenko, N.A.; Proskurowski, G.; Peacock, E.E.; Hafner, J.; Reddy, C.M. Plastic accumulation in the North Atlantic subtropical gyre. Science 2010, 329, 1185–1188. [Google Scholar] [CrossRef] [Green Version]
- Zettler, E.R.; Mincer, T.J.; Amaral-Zettler, L.A. Life in the plastisphere: Microbial communities on plastic marine debris. Environ. Sci. Technol. 2013, 47, 7137–7146. [Google Scholar] [CrossRef]
- Beer, S.; Garm, A.; Huwer, B.; Dierking, J.; Nielsen, T.G. No increase in marine microplastic concentration over the last three decades—A case study from the Baltic Sea. Sci. Total Environ. 2018, 621, 1272–1279. [Google Scholar] [CrossRef] [PubMed]
- Lebreton, L.; Egger, M.; Slat, B. A global mass budget for positively buoyant macroplastic debris in the ocean. Sci. Rep. 2019, 9, 1985. [Google Scholar] [CrossRef] [PubMed] [Green Version]
- Pabortsava, K.; Lampitt, R.S. High concentrations of plastic hidden beneath the surface of the Atlantic Ocean. Nat. Commun. 2020, 11, 339. [Google Scholar] [CrossRef] [PubMed]
- Waldschläger, K.; Lechthaler, S.; Stauch, G.; Schüttrumpf, H. The way of microplastic through the environment—Application of the source-pathway-receptor model (review). Sci. Total Environ. 2020, 713, 136584. [Google Scholar] [CrossRef]
- Narayan, S.; Hanson, S.; Nicholls, R.; Clarke, D.; Horrillo-Caraballo, J.M.; Reeve, D.E.; Simmonds, D.; Pan, S.; Fox, A.; Thompson, R.; et al. Use of the source-pathway-receptor-consequence model in coastal flood risk assessment: Application of a source-pathway-receptor-consequence (S-P-R-C) methodology to the Teign Estuary, UK. Eur. Geosci. Union Gen. Assess. 2011, 165, 1939–1944. [Google Scholar] [CrossRef]
- Li, W.; Tse, H.; Fok, L. Plastic waste in the marine environment: A review of sources, occurrence and effects. Sci. Total. Environ. 2016, 566, 333–349. [Google Scholar] [CrossRef]
- Barboza, L.G.A.; Cózar, A.; Gimenez, B.C.G.; Barros, T.L.; Kershaw, P.J.; Guilhermino, L. Macroplastics Pollution in the Marine Environment. In World Seas: An Environmental Evaluation; Elsevier: Amsterdam, The Netherlands, 2019; pp. 305–328. ISBN 9780128050521. [Google Scholar]
- Winton, D.J.; Anderson, L.G.; Rocliffe, S.; Loiselle, S. Macroplastic pollution in freshwater environments: Focusing public and policy action. Sci. Total Environ. 2020, 704, 135242. [Google Scholar] [CrossRef]
- Van Emmerik, T.; Schwarz, A. Plastic debris in rivers. WIREs Water 2020, 7, 116. [Google Scholar] [CrossRef] [Green Version]
- Liro, M.; van Emmerik, T.; Wyżga, B.; Liro, J.; Mikuś, P. Macroplastic Storage and Remobilization in Rivers. Water 2020, 12, 2055. [Google Scholar] [CrossRef]
- Chae, Y.; An, Y.-J. Current research trends on plastic pollution and ecological impacts on the soil ecosystem: A review. Environ. Pollut. 2018, 240, 387–395. [Google Scholar] [CrossRef]
- Bucci, K.; Tulio, M.; Rochman, C.M. What is known and unknown about the effects of plastic pollution: A meta-analysis and systematic review. Ecol. Appl. 2020, 30, e02044. [Google Scholar] [CrossRef] [PubMed]
- Amaral-Zettler, L.A.; Zettler, E.R.; Mincer, T.J. Ecology of the plastisphere. Nat. Rev. Microbiol. 2020, 18, 139–151. [Google Scholar] [CrossRef] [PubMed]
- Arthur, C.; Baker, J.; Bamford, H. (Eds.) Proceedings of the International Research Workshop on the Occurrence, Effects and Fate of Microplastic Marine Debris, Tacoma, WA, USA, 9–11 September 2008; NOAA Technical Memorandum NOS-OR&R-30; NOAA Marine Debris Division: Silver Spring, MD, USA, 2009. [Google Scholar]
- Piehl, S.; Leibner, A.; Löder, M.G.J.; Dris, R.; Bogner, C.; Laforsch, C. Identification and quantification of macro- and microplastics on an agricultural farmland. Sci. Rep. 2018, 8, 17950. [Google Scholar] [CrossRef] [PubMed] [Green Version]
- Kawecki, D.; Nowack, B. Polymer-Specific Modeling of the Environmental Emissions of Seven Commodity Plastics as Macro- and Microplastics. Environ. Sci. Technol. 2019, 53, 9664–9676. [Google Scholar] [CrossRef] [PubMed]
- Lebreton, L.; Andrady, A. Future scenarios of global plastic waste generation and disposal. Palgrave Commun. 2019, 5, 2922. [Google Scholar] [CrossRef] [Green Version]
- Barnes, D.K.A.; Galgani, F.; Thompson, R.C.; Barlaz, M. Accumulation and fragmentation of plastic debris in global environments. Philos. Trans. R. Soc. B Biol. Sci. 2009, 364, 1985–1998. [Google Scholar] [CrossRef] [Green Version]
- European Commission. Guidance on Monitoring of Marine Litter in European Seas. A Guidance Document within the Common Implementation Strategy for the Marine Strategy Framework Directive; MSFD Technical Subgroup on Marine Litter; Publications Office of the EU: Luxembourg, 2013; ISBN 978-92-79-32709-4. [Google Scholar]
- Van Emmerik, T.; Kieu-Le, T.-C.; Loozen, M.; van Oeveren, K.; Strady, E.; Bui, X.-T.; Egger, M.; Gasperi, J.; Lebreton, L.; Nguyen, P.-D.; et al. A Methodology to Characterize Riverine Macroplastic Emission into the Ocean. Front. Mar. Sci. 2018, 5, 3404. [Google Scholar] [CrossRef] [Green Version]
- Hartmann, N.B.; Hüffer, T.; Thompson, R.C.; Hassellöv, M.; Verschoor, A.; Daugaard, A.E.; Rist, S.; Karlsson, T.; Brennholt, N.; Cole, M.; et al. Are We Speaking the Same Language? Recommendations for a Definition and Categorization Framework for Plastic Debris. Environ. Sci. Technol. 2019, 53, 1039–1047. [Google Scholar] [CrossRef] [Green Version]
- UBA. Kunststoffe in der Umwelt. 2019. Available online: www.umweltbundesamt.de/publikationen (accessed on 4 August 2020).
- Andrady, A.L. Microplastics in the marine environment. Mar. Pollut. Bull. 2011, 62, 1596–1605. [Google Scholar] [CrossRef]
- Chin, L.W.; Fung, T.H. Plastic in Marine Litter. In Plastics and the Environment; Hester, R.E., Harrison, R.M., Eds.; Royal Society of Chemistry: Cambridge, UK, 2019; pp. 21–59. ISBN 978-1-78801-241-6. [Google Scholar]
- Bond, T.; Ferrandiz-Mas, V.; Felipe-Sotelo, M.; van Sebille, E. The occurrence and degradation of aquatic plastic litter based on polymer physicochemical properties: A review. Crit. Rev. Environ. Sci. Technol. 2018, 48, 685–722. [Google Scholar] [CrossRef]
- Hengstmann, E.; Gräwe, D.; Tamminga, M.; Fischer, E.K. Marine litter abundance and distribution on beaches on the Isle of Rügen considering the influence of exposition, morphology and recreational activities. Mar. Pollut. Bull. 2017, 115, 297–306. [Google Scholar] [CrossRef] [PubMed]
- Barnes, D.K.A.; Morley, S.A.; Bell, J.; Brewin, P.; Brigden, K.; Collins, M.; Glass, T.; Goodall-Copestake, W.P.; Henry, L.; Laptikhovsky, V.; et al. Marine plastics threaten giant Atlantic Marine Protected Areas. Curr. Biol. 2018, 28, R1137–R1138. [Google Scholar] [CrossRef] [PubMed] [Green Version]
- Derraik, J.G.B. The pollution of the marine environment by plastic debris: A review. Mar. Pollut. Bull. 2002, 44, 842–852. [Google Scholar] [CrossRef]
- Nakashima, E.; Isobe, A.; Kako, S.; Itai, T.; Takahashi, S. Quantification of toxic metals derived from macroplastic litter on Ookushi Beach, Japan. Environ. Sci. Technol. 2012, 46, 10099–10105. [Google Scholar] [CrossRef]
- PlasticsEurope. Plastics—The Facts 2019. An Analysis of European Plastics Production, Demand and Waste Data; PlasticsEurope: Brussels, Belgium, 2019. [Google Scholar]
- Lechthaler, S. Makroplastik in der Umwelt. Betrachtung Terrestrischer und Aquatischer Bereiche; Springer Vieweg: Wiesbaden, Germany, 2020; ISBN 978-3-658-30336-5. [Google Scholar]
- Geyer, R.; Jambeck, J.R.; Law, K.L. Production, use, and fate of all plastics ever made. Sci. Adv. 2017, 3, e1700782. [Google Scholar] [CrossRef] [PubMed] [Green Version]
- Hoornweg, D.; Bhada-Tata, P. What a Waste: A Global Review of Solid Waste Management; World Bank: Washington, DC, USA, 2012. [Google Scholar]
- Jambeck, J.R.; Geyer, R.; Wilcox, C.; Siegler, T.R.; Perryman, M.; Andrady, A.; Narayan, R.; Law, K.L. Marine pollution. Plastic waste inputs from land into the ocean. Science 2015, 347, 768–771. [Google Scholar] [CrossRef] [PubMed]
- Ryberg, M.; Laurent, A.; Hauschild, M. Mapping of Global Plastic Value Chain and Plastics Losses to the Environment. With a Particular Focus on Marine Environment; UNEP: Nairobi, Kenya, 2018. [Google Scholar]
- Mehlhart, G.; Blepp, M. Study on Land-Sources Litter (LSL) in the Marine Environment. Review of Sources and Literature. In the Context of the Initiative of the Declaration of the Global Plastics Associations for Solutions of Marine Litter; Öko-Institut: Freiburg, Germany, 2012; Available online: https://www.kunststoffverpackungen.de/show.php?ID=5262&PHPSESSID=lp8dmvipkks4ajl1htvf5j5907 (accessed on 21 February 2019).
- Macfadyen, G.; Huntington, T.; Cappell, R. Abandoned, Lost or Ortherwise Discarded Fishing Gear; Food and Agriculture Organization of the United Nations: Rome, Italy, 2009; ISBN 978-92-5-106196-1. [Google Scholar]
- Carlton, J.T.; Chapman, J.W.; Geller, J.B.; Miller, J.A.; Carlton, D.A.; McCuller, M.I.; Treneman, N.C.; Steves, B.P.; Ruiz, G.M. Tsunami-driven rafting: Transoceanic species dispersal and implications for marine biogeography. Science 2017, 357, 1402–1406. [Google Scholar] [CrossRef] [Green Version]
- Lebreton, L.C.M.; van der Zwet, J.; Damsteeg, J.-W.; Slat, B.; Andrady, A.; Reisser, J.; Reisser, J. River plastic emissions to the world’s oceans. Nat. Commun. 2017, 8, 15611. [Google Scholar] [CrossRef]
- Ryberg, M.W.; Hauschild, M.Z.; Wang, F.; Averous-Monnery, S.; Laurent, A. Global environmental losses of plastics across their value chains. Resour. Conserv. Recycl. 2019, 151, 104459. [Google Scholar] [CrossRef]
- Novotny, T.E.; Slaughter, E. Tobacco Product Waste: An Environmental Approach to Reduce Tobacco Consumption. Curr. Environ. Health Rep. 2014, 1, 208–216. [Google Scholar] [CrossRef] [Green Version]
- Scarascia-Mugnozza, G.; Sica, C.; Russo, G. Plastic Materials in European Agriculture: Actual Use and Perspectives. J. Agric. Eng. 2011, 42, 15. [Google Scholar] [CrossRef]
- Bos, U.; Makishi, C.; Fischer, M. Life Cycle Assessment of common used agricultural plastic products in the EU. Acta Hortic. 2008, 341–350. [Google Scholar] [CrossRef]
- Eriksen, M.; Lebreton, L.C.M.; Carson, H.S.; Thiel, M.; Moore, C.J.; Borerro, J.C.; Galgani, F.; Ryan, P.G.; Reisser, J. Plastic Pollution in the World’s Oceans: More than 5 Trillion Plastic Pieces Weighing over 250,000 Tons Afloat at Sea. PLoS ONE 2014, 9, e111913. [Google Scholar] [CrossRef] [PubMed] [Green Version]
- Koelmans, A.A.; Kooi, M.; Law, K.L.; van Sebille, E. All is not lost: Deriving a top-down mass budget of plastic at sea. Environ. Res. Lett. 2017, 12, 114028. [Google Scholar] [CrossRef] [Green Version]
- Turrell, W.R. Estimating a regional budget of marine plastic litter in order to advise on marine management measures. Mar. Pollut. Bull. 2020, 150, 110725. [Google Scholar] [CrossRef] [PubMed]
- Nihei, Y.; Yoshida, T.; Kataoka, T.; Ogata, R. High-Resolution Mapping of Japanese Microplastic and Macroplastic Emissions from the Land into the Sea. Water 2020, 12, 951. [Google Scholar] [CrossRef] [Green Version]
- Schmidt, C.; Krauth, T.; Wagner, S. Export of Plastic Debris by Rivers into the Sea. Environ. Sci. Technol. 2017, 51. [Google Scholar] [CrossRef]
- Europäische Kommission. Vorschlag für eine Richtlinie des Europäischen Parlaments und des Rates über die Verringerung der Auswirkungen Bestimmter Kunststoffprodukte auf die Umwelt; COM(2018) 340 Final; Europäische Kommission: Brussels, Belgium, 2018. [Google Scholar]
- Bertling, J.; Hamann, L.; Bertling, R. Kunststoffe in der Umwelt; Fraunhofer UMSICHT: Oberhausen, Germany, 2018. [Google Scholar]
- Slaughter, E.; Gersberg, R.M.; Watanabe, K.; Rudolph, J.; Stransky, C.; Novotny, T.E. Toxicity of cigarette butts, and their chemical components, to marine and freshwater fish. Tob. Control. 2011, 20, i25–i29. [Google Scholar] [CrossRef]
- Patrício Silva, A.L.; Prata, J.C.; Walker, T.R.; Duarte, A.C.; Ouyang, W.; Barcelò, D.; Rocha-Santos, T. Increased plastic pollution due to Covid-19 pandemic: Challenges and recommendations. Chem. Eng. J. 2020, 405, 126683. [Google Scholar] [CrossRef]
- Canning-Clode, J.; Sepúlveda, P.; Almeida, S.; Monteiro, J. Will COVID-19 Containment and Treatment Measures Drive Shifts in Marine Litter Pollution? Front. Mar. Sci. 2020, 7, 125708. [Google Scholar] [CrossRef]
- Liu, E.K.; He, W.Q.; Yan, C.R. ‘White revolution’ to ‘white pollution’—Agricultural plastic film mulch in China. Environ. Res. Lett. 2014, 9, 91001. [Google Scholar] [CrossRef] [Green Version]
- Bläsing, M.; Amelung, W. Plastics in soil: Analytical methods and possible sources. Sci. Total Environ. 2018, 612, 422–435. [Google Scholar] [CrossRef]
- Carr, S.A.; Liu, J.; Tesoro, A.G. Transport and fate of microplastic particles in wastewater treatment plants. Water Res. 2016, 91, 174–182. [Google Scholar] [CrossRef] [PubMed]
- Talvitie, J.; Heinonen, M.; Pääkkönen, J.-P.; Vahtera, E.; Mikola, A.; Setälä, O.; Vahala, R. Do wastewater treatment plants act as a potential point source of microplastics? Preliminary study in the coastal Gulf of Finland, Baltic Sea. Water Sci. Technol. 2015, 72, 1495–1504. [Google Scholar] [CrossRef] [PubMed]
- Lechthaler, S.; Dolny, R.; Spelthahn, V.; Pinnekamp, J.; Linnemann, V. Sampling concept for microplastics in combined sewage-affected freshwater and freshwater sediments. Fundam. Appl. Limnol. 2019. [Google Scholar] [CrossRef]
- He, P.; Chen, L.; Shao, L.; Zhang, H.; Lü, F. Municipal solid waste (MSW) landfill: A source of microplastics? —Evidence of microplastics in landfill leachate. Water Res. 2019, 159, 38–45. [Google Scholar] [CrossRef]
- Kazour, M.; Terki, S.; Rabhi, K.; Jemaa, S.; Khalaf, G.; Amara, R. Sources of microplastics pollution in the marine environment: Importance of wastewater treatment plant and coastal landfill. Mar. Pollut. Bull. 2019, 146, 608–618. [Google Scholar] [CrossRef]
- Eurostat. Behandlung der Abfälle nach Abfallkategorie, Gefährlichkeit und Abfallbewirtschaftungsmaßnahmen: Deponierung Kunststoffabfälle. Available online: https://ec.europa.eu/eurostat/de/web/waste/data/database (accessed on 25 February 2020).
- Good, T.P.; June, J.A.; Etnier, M.A.; Broadhurst, G. Derelict fishing nets in Puget Sound and the Northwest Straits: Patterns and threats to marine fauna. Mar. Pollut. Bull. 2010, 60, 39–50. [Google Scholar] [CrossRef]
- Link, J.; Segal, B.; Casarini, L.M. Abandoned, lost or otherwise discarded fishing gear in Brazil: A review. Perspect. Ecol. Conserv. 2019, 17, 1–8. [Google Scholar] [CrossRef]
- 7Krüger, L.; Casado-Coy, N.; Valle, C.; Ramos, M.; Sánchez-Jerez, P.; Gago, J.; Carretero, O.; Beltran-Sanahuja, A.; Sanz-Lazaro, C. Plastic debris accumulation in the seabed derived from coastal fish farming. Environ. Pollut. 2020, 257, 113336. [Google Scholar] [CrossRef]
- Lebreton, L.; Slat, B.; Ferrari, F.; Sainte-Rose, B.; Aitken, J.; Marthouse, R.; Hajbane, S.; Cunsolo, S.; Schwarz, A.; Levivier, A.; et al. Evidence that the Great Pacific Garbage Patch is rapidly accumulating plastic. Sci. Rep. 2018, 8, 4666. [Google Scholar] [CrossRef] [PubMed] [Green Version]
- García-Rivera, S.; Lizaso, J.L.S.; Millán, J.M.B. Composition, spatial distribution and sources of macro-marine litter on the Gulf of Alicante seafloor (Spanish Mediterranean). Mar. Pollut. Bull. 2017, 121, 249–259. [Google Scholar] [CrossRef] [PubMed] [Green Version]
- Ebbesmeyer, C.C.; Ingraham, W.J. Pacific toy spill fuels ocean current pathways research. Eos Trans. AGU 1994, 75, 425. [Google Scholar] [CrossRef]
- Panama Maritime Authority; Dutch Safety Board; Bundesstelle für Seeunfalluntersuchung. Joint Investigation Report: Loss of Containers Overboard from MSC Zoe. 1–2 January 2019; PMA: Panama City, Panama; DSB: The Hague, The Netherlands; BSU: Hamburg, Germany, 2020. [Google Scholar]
- IMO. Resolution MEPC.36(28) Marine Environment Protection Committee Adoption of Amendments to the Annex of the Protocol of 1987 Relating to the International Convention for the Prevention of Pollution from Ships (Amendment to Annex V of MARPOL 73/78); IMO: London, UK, 1989. [Google Scholar]
- Monteiro, R.C.P.; do Ivar Sul, J.A.; Costa, M.F. Plastic pollution in islands of the Atlantic Ocean. Environ. Pollut. 2018, 238, 103–110. [Google Scholar] [CrossRef]
- Herz, M.; Davis, J. Cruise Control. A Report on How Cruise Ships Affect. the Marine Environment; The Ocean Conservancy: Washington, DC, USA, 2002. [Google Scholar]
- Meyer, T. Ökologie Mitteleuropäischer Flussauen; Spektrum Akademischer: Berlin/Heidelberg, Germany, 2017; ISBN 978-3-662-55454-8. [Google Scholar]
- Schwarz, A.E.; Ligthart, T.N.; Boukris, E.; van Harmelen, T. Sources, transport, and accumulation of different types of plastic litter in aquatic environments: A review study. Mar. Pollut. Bull. 2019, 143, 92–100. [Google Scholar] [CrossRef]
- Ballent, A.; Pando, S.; Purser, A.; Juliano, M.F.; Thomsen, L. Modelled transport of benthic marine microplastic pollution in the Nazaré Canyon. Biogeosciences 2013, 10, 7957–7970. [Google Scholar] [CrossRef] [Green Version]
- Van Emmerik, T.; Strady, E.; Kieu-Le, T.-C.; Nguyen, L.; Gratiot, N. Seasonality of riverine macroplastic transport. Sci Rep. 2019, 9, 13549. [Google Scholar] [CrossRef]
- Hurley, R.; Woodward, J.; Rothwell, J.J. Microplastic contamination of river beds significantly reduced by catchment-wide flooding. Nat. Geosci. 2018, 10, 124006. [Google Scholar] [CrossRef]
- Kurniawan, S.B.; Imron, M.F. Seasonal variation of plastic debris accumulation in the estuary of Wonorejo River, Surabaya, Indonesia. Environ. Technol. Innov. 2019, 16, 100490. [Google Scholar] [CrossRef]
- Castrop, E.; van Emmerik, T.; van den Berg, S.; Kosten, S.; Strady, E.; Kieu-Le, T.-C. Plants, plastic and rivers: Do water hyacinths play a role in riverine macroplastic transport? In Proceedings of the 22nd EGU General Assembly, Lund, Sweden, 4–8 May 2020. [Google Scholar]
- Driedger, A.G.J.; Dürr, H.H.; Mitchell, K.; van Cappellen, P. Plastic debris in the Laurentian Great Lakes: A review. J. Great Lakes Res. 2015, 41, 9–19. [Google Scholar] [CrossRef]
- Ghaffari, S.; Bakhtiari, A.R.; Ghasempouri, S.M.; Nasrolahi, A. The influence of human activity and morphological characteristics of beaches on plastic debris distribution along the Caspian Sea as a closed water body. Environ. Sci. Pollut. Res. Int. 2019, 26, 25712–25724. [Google Scholar] [CrossRef]
- Chen, X.; Xiong, X.; Jiang, X.; Shi, H.; Wu, C. Sinking of floating plastic debris caused by biofilm development in a freshwater lake. Chemosphere 2019, 222, 856–864. [Google Scholar] [CrossRef] [PubMed]
- Tramoy, R.; Gasperi, J.; Colasse, L.; Tassin, B. Transfer dynamic of macroplastics in estuaries—New insights from the Seine estuary: Part 1. Long term dynamic based on date-prints on stranded debris. Mar. Pollut. Bull. 2020, 152, 110894. [Google Scholar] [CrossRef] [PubMed]
- Ryan, P.G. The transport and fate of marine plastics in South Africa and adjacent oceans. S. Afr. J. Sci 2020, 116. [Google Scholar] [CrossRef]
- Van Sebille, E.; Aliani, S.; Law, K.L.; Maximenko, N.; Alsina, J.; Bagaev, A.; Bergmann, M.; Chapron, B.; Chubarenko, I.; Cózar, A.; et al. The physical oceanography of the transport of floating marine debris. Environ. Res. Lett. 2020, 15. [Google Scholar] [CrossRef] [Green Version]
- Isobe, A.; Kubo, K.; Tamura, Y.; Kako, S.; Nakashima, E.; Fujii, N. Selective transport of microplastics and mesoplastics by drifting in coastal waters. Mar. Pollut. Bull. 2014, 89, 324–330. [Google Scholar] [CrossRef] [PubMed]
- Eriksen, M.; Maximenko, N.; Thiel, M.; Cummins, A.; Lattin, G.; Wilson, S.; Hafner, J.; Zellers, A.; Rifman, S. Plastic pollution in the South Pacific subtropical gyre. Mar. Pollut. Bull. 2013, 68, 71–76. [Google Scholar] [CrossRef]
- Poulain, M.; Mercier, M.J.; Brach, L.; Martignac, M.; Routaboul, C.; Perez, E.; Desjean, M.C.; Ter Halle, A. Small Microplastics As a Main Contributor to Plastic Mass Balance in the North Atlantic Subtropical Gyre. Environ. Sci. Technol. 2019, 53, 1157–1164. [Google Scholar] [CrossRef] [Green Version]
- Van Sebille, E.; England, M.H.; Froyland, G. Origin, dynamics and evolution of ocean garbage patches from observed surface drifters. Environ. Res. Lett. 2012, 7, 44040. [Google Scholar] [CrossRef]
- Fazey, F.M.C.; Ryan, P.G. Biofouling on buoyant marine plastics: An experimental study into the effect of size on surface longevity. Environ. Pollut. 2016, 210, 354–360. [Google Scholar] [CrossRef]
- Ryan, P.G. Does size and buoyancy affect the long-distance transport of floating debris? Environ. Res. Lett. 2015, 10, 84019. [Google Scholar] [CrossRef]
- Kooi, M.; van Nes, E.H.; Scheffer, M.; Koelmans, A.A. Ups and Downs in the Ocean: Effects of Biofouling on Vertical Transport of Microplastics. Environ. Sci. Technol. 2017, 51, 7963–7971. [Google Scholar] [CrossRef] [PubMed] [Green Version]
- Ye, S.; Andrady, A.L. Fouling of floating plastic debris under Biscayne Bay exposure conditions. Mar. Pollut. Bull. 1991, 22, 608–613. [Google Scholar] [CrossRef]
- Pohl, F.; Eggenhuisen, J.T.; Kane, I.A.; Clare, M.A. Transport and Burial of Microplastics in Deep-Marine Sediments by Turbidity Currents. Environ. Sci. Technol. 2020, 54, 4180–4189. [Google Scholar] [CrossRef] [PubMed]
- Kane, I.A.; Clare, M.A.; Miramontes, E.; Wogelius, R.; Rothwell, J.J.; Garreau, P.; Pohl, F. Seafloor microplastic hotspots controlled by deep-sea circulation. Science 2020, 368. [Google Scholar] [CrossRef]
- Browne, M.A.; Crump, P.; Niven, S.J.; Teuten, E.; Tonkin, A.; Galloway, T.; Thompson, R. Accumulation of microplastic on shorelines woldwide: Sources and sinks. Environ. Sci. Technol. 2011, 45, 9175–9179. [Google Scholar] [CrossRef] [PubMed]
- Seo, S.; Park, Y.-G. Destination of floating plastic debris released from ten major rivers around the Korean Peninsula. Environ. Int. 2020, 138, 105655. [Google Scholar] [CrossRef]
- Collins, C.; Hermes, J.C. Modelling the accumulation and transport of floating marine micro-plastics around South Africa. Mar. Pollut. Bull. 2019, 139, 46–58. [Google Scholar] [CrossRef]
- Ho, N.H.E.; Not, C. Selective accumulation of plastic debris at the breaking wave area of coastal waters. Environ. Pollut. 2019, 245, 702–710. [Google Scholar] [CrossRef]
- Lee, J.; Hong, S.; Song, Y.K.; Hong, S.H.; Jang, Y.C.; Jang, M.; Heo, N.W.; Han, G.M.; Lee, M.J.; Kang, D.; et al. Relationships among the abundances of plastic debris in different size classes on beaches in South Korea. Mar. Pollut. Bull. 2013, 77, 349–354. [Google Scholar] [CrossRef]
- Kataoka, T.; Hinata, H.; Kato, S. Analysis of a beach as a time-invariant linear input/output system of marine litter. Mar. Pollut. Bull. 2013, 77, 266–273. [Google Scholar] [CrossRef] [PubMed]
- Kataoka, T.; Hinata, H.; Kato, S. Backwash process of marine macroplastics from a beach by nearshore currents around a submerged breakwater. Mar. Pollut. Bull. 2015, 101, 539–548. [Google Scholar] [CrossRef] [PubMed]
- Hinata, H.; Mori, K.; Ohno, K.; Miyao, Y.; Kataoka, T. An estimation of the average residence times and onshore-offshore diffusivities of beached microplastics based on the population decay of tagged meso- and macrolitter. Mar. Pollut. Bull. 2017, 122, 17–26. [Google Scholar] [CrossRef] [PubMed]
- Bowman, D.; Manor-Samsonov, N.; Golik, A. Dynamics of litter pollution on Israeli Mediterranean beaches: A budgetary, litter flux approach. J. Coast. Res. 1998, 14, 418–432. [Google Scholar]
- Garrity, S.D.; Levings, S.C. Marine debris along the Caribbean coast of Panama. Mar. Pollut. Bull. 1993, 26, 317–324. [Google Scholar] [CrossRef]
- Turrell, W.R. A simple model of wind-blown tidal strandlines: How marine litter is deposited on a mid-latitude, macro-tidal shelf sea beach. Mar. Pollut. Bull. 2018, 137, 315–330. [Google Scholar] [CrossRef]
- Lechner, A.; Keckeis, H.; Lumesberger-Loisl, F.; Zens, B.; Krusch, R.; Tritthart, M.; Glas, M.; Schludermann, E. The Danube so colourful: A potpourri of plastic litter outnumbers fish larvae in Europe’s second largest river. Environ. Pollut. 2014, 188, 177–181. [Google Scholar] [CrossRef] [Green Version]
- Critchell, K.; Lambrechts, J. Modelling accumulation of marine plastics in the coastal zone; what are the dominant physical processes? Estuar. Coast. Shelf Sci. 2016, 171, 111–122. [Google Scholar] [CrossRef]
- Sadri, S.S.; Thompson, R.C. On the quantity and composition of floating plastic debris entering and leaving the Tamar Estuary, Southwest England. Mar. Pollut. Bull. 2014, 81, 55–60. [Google Scholar] [CrossRef]
- Vermeiren, P.; Muñoz, C.C.; Ikejima, K. Sources and sinks of plastic debris in estuaries: A conceptual model integrating biological, physical and chemical distribution mechanisms. Mar. Pollut. Bull. 2016, 113, 7–16. [Google Scholar] [CrossRef]
- Cozzolino, L.; Nicastro, K.R.; Zardi, G.I.; Los Santos, C.B. Species-specific plastic accumulation in the sediment and canopy of coastal vegetated habitats. Sci. Total Environ. 2020, 723, 138018. [Google Scholar] [CrossRef] [PubMed]
- Allen, S.; Allen, D.; Phoenix, V.R.; Le Roux, G.; Durántez Jiménez, P.; Simonneau, A.; Binet, S.; Galop, D. Atmospheric transport and deposition of microplastics in a remote mountain catchment. Nat. Geosci. 2019, 71, 299. [Google Scholar] [CrossRef]
- Zylstra, E.R. Accumulation of wind-dispersed trash in desert environments. J. Arid Environ. 2013, 89, 13–15. [Google Scholar] [CrossRef]
- van Calcar, C.J.; van Emmerik, T.H.M. Abundance of plastic debris across European and Asian rivers. Environ. Res. Lett. 2019, 14, 124051. [Google Scholar] [CrossRef] [Green Version]
- Crosti, R.; Arcangeli, A.; Campana, I.; Paraboschi, M.; González-Fernández, D. ‘Down to the river’: Amount, composition, and economic sector of litter entering the marine compartment, through the Tiber river in the Western Mediterranean Sea. Rend. Lincei Sci. Fis. Nat. 2018, 29, 859–866. [Google Scholar] [CrossRef]
- Castro-Jiménez, J.; González-Fernández, D.; Fornier, M.; Schmidt, N.; Sempéré, R. Macro-litter in surface waters from the Rhone River: Plastic pollution and loading to the NW Mediterranean Sea. Mar. Pollut. Bull. 2019, 146, 60–66. [Google Scholar] [CrossRef]
- Gasperi, J.; Dris, R.; Bonin, T.; Rocher, V.; Tassin, B. Assessment of floating plastic debris in surface water along the Seine River. Environ. Pollut. 2014, 195, 163–166. [Google Scholar] [CrossRef] [Green Version]
- Van der Wal, M.; van der Meulen, M.; Tweehuijsen, G.; Peterlin, M.; Palatinus, A.; Kovač Viršek, M.; Coscia, L.; Kržan, A. SFRA0025: Identification and Assessment of Riverine Input of (Marine) Litter; Final Report for the European Commission DG Environment under Framework Contract No. ENV.D.2/FRA/2012/0025; Eunomia Research & Consulting: Bristol, UK, 2015. [Google Scholar]
- Schöneich-Argent, R.I.; Dau, K.; Freund, H. Wasting the North Sea—A field-based assessment of anthropogenic macrolitter loads and emission rates of three German tributaries. Environ. Pollut. 2020, 263, 114367. [Google Scholar] [CrossRef]
- Schirinzi, G.F.; Köck-Schulmeyer, M.; Cabrera, M.; González-Fernández, D.; Hanke, G.; Farré, M.; Barceló, D. Riverine anthropogenic litter load to the Mediterranean Sea near the metropolitan area of Barcelona, Spain. Sci. Total Environ. 2020, 714, 136807. [Google Scholar] [CrossRef]
- Van Emmerik, T.; Loozen, M.; van Oeveren, K.; Buschman, F.; Prinsen, G. Riverine plastic emission from Jakarta into the ocean. Environ. Res. Lett. 2019, 14, 84033. [Google Scholar] [CrossRef] [Green Version]
- Ebere, E.C.; Wirnkor, V.A.; Ngozi, V.E.; Chukwuemeka, I.S. Macrodebris and microplastics pollution in Nigeria: First report on abundance, distribution and composition. Environ. Anal. Health Toxicol. 2019, 34, e2019012. [Google Scholar] [CrossRef] [Green Version]
- Blettler, M.C.M.; Garello, N.; Ginon, L.; Abrial, E.; Espinola, L.A.; Wantzen, K.M. Massive plastic pollution in a mega-river of a developing country: Sediment deposition and ingestion by fish (Prochilodus lineatus). Environ. Pollut. 2019, 255, 113348. [Google Scholar] [CrossRef] [PubMed]
- Faure, F.; Demars, C.; Wieser, O.; Kunz, M.; Alencastro, L.F. Plastic pollution in Swiss surface waters: Nature and concentrations, interaction with pollutants. Environ. Chem. 2015, 12, 582. [Google Scholar] [CrossRef]
- Boucher, J.; Faure, F.; Pompini, O.; Plummer, Z.; Wieser, O.; Felippe de Alencastro, L. (Micro) plastic fluxes and stocks in Lake Geneva basin. TrAC Trends Anal. Chem. 2019, 112, 66–74. [Google Scholar] [CrossRef]
- Corcoran, P.L.; Norris, T.; Ceccanese, T.; Walzak, M.J.; Helm, P.A.; Marvin, C.H. Hidden plastics of Lake Ontario, Canada and their potential preservation in the sediment record. Environ. Pollut. 2015, 204, 17–25. [Google Scholar] [CrossRef]
- Egessa, R.; Nankabirwa, A.; Basooma, R.; Nabwire, R. Occurrence, distribution and size relationships of plastic debris along shores and sediment of northern Lake Victoria. Environ. Pollut. 2020, 257, 113442. [Google Scholar] [CrossRef]
- Browne, M.A.; Galloway, T.S.; Thompson, R.C. Spatial patterns of plastic debris along Estuarine shorelines. Environ. Sci. Technol. 2010, 44, 3404–3409. [Google Scholar] [CrossRef]
- Yao, W.; Di, D.; Wang, Z.; Liao, Z.; Huang, H.; Mei, K.; Dahlgren, R.A.; Zhang, M.; Shang, X. Micro- and macroplastic accumulation in a newly formed Spartina alterniflora colonized estuarine saltmarsh in southeast China. Mar. Pollut. Bull. 2019, 149, 110636. [Google Scholar] [CrossRef] [Green Version]
- Carpenter, E.J.; Smith, K.L. Plastics on the Sargasso sea surface. Science 1972, 175, 1240–1241. [Google Scholar] [CrossRef]
- Colton, J.B.; Burns, B.R.; Knapp, F.D. Plastic particles in surface waters of the northwestern atlantic. Science 1974, 185, 491–497. [Google Scholar] [CrossRef]
- Suaria, G.; Aliani, S. Floating debris in the Mediterranean Sea. Mar. Pollut. Bull. 2014, 86, 494–504. [Google Scholar] [CrossRef]
- Galgani, F.; Hanke, G.; Maes, T. Global Distribution, Composition and Abundance of Marine Litter. In Marine Anthropogenic Litter; Bergmann, M., Gutow, L., Klages, M., Eds.; Springer International Publishing: Cham, Switzerland, 2015; pp. 29–56. ISBN 978-3-319-16509-7. [Google Scholar]
- Galgani, F.; Leaute, J.P.; Moguedet, P.; Souplet, A.; Verin, Y.; Carpentier, A.; Goraguer, H.; Latrouite, D.; Andral, B.; Cadiou, Y.; et al. Litter on the Sea Floor Along European Coasts. Mar. Pollut. Bull. 2000, 40, 516–527. [Google Scholar] [CrossRef]
- Thiel, S.; Thomé-Kozmiensky, E.; Quicker, P.; Gosten, A. (Eds.) Energie aus Abfall; Thomé-Kozmiensky: Neuruppin, Germany, 2018; ISBN 978-3-944310-39-8. [Google Scholar]
- Rech, S.; Thiel, M.; Borrell Pichs, Y.J.; García-Vazquez, E. Travelling light: Fouling biota on macroplastics arriving on beaches of remote Rapa Nui (Easter Island) in the South Pacific Subtropical Gyre. Mar. Pollut. Bull. 2018, 137, 119–128. [Google Scholar] [CrossRef] [PubMed]
- Suaria, G.; Perold, V.; Lee, J.R.; Lebouard, F.; Aliani, S.; Ryan, P.G. Floating macro- and microplastics around the Southern Ocean: Results from the Antarctic Circumnavigation Expedition. Environ. Int. 2020, 136, 105494. [Google Scholar] [CrossRef]
- Gündoğdu, S.; Çevik, C. Mediterranean dirty edge: High level of meso and macroplastics pollution on the Turkish coast. Environ. Pollut. 2019, 255, 113351. [Google Scholar] [CrossRef] [PubMed]
- European Commission. The 2018 Annual Economic Report on the EU Blue Economy; Publications Office of the EU: Luxembourg, 2018; ISBN 978-92-79-81757-1. [Google Scholar]
- Gündoğdu, S.; Yeşilyurt, İ.N.; Erbaş, C. Potential interaction between plastic litter and green turtle Chelonia mydas during nesting in an extremely polluted beach. Mar. Pollut. Bull. 2019, 140, 138–145. [Google Scholar] [CrossRef]
- Portman, M.E.; Brennan, R.E. Marine litter from beach-based sources: Case study of an Eastern Mediterranean coastal town. Waste Manag. 2017, 69, 535–544. [Google Scholar] [CrossRef] [Green Version]
- Mansui, J.; Molcard, A.; Ourmières, Y. Modelling the transport and accumulation of floating marine debris in the Mediterranean basin. Mar. Pollut. Bull. 2015, 91, 249–257. [Google Scholar] [CrossRef]
- Gómez, V.; Pozo, K.; Nuñez, D.; Přibylová, P.; Audy, O.; Baini, M.; Fossi, M.C.; Klánová, J. Marine plastic debris in Central Chile: Characterization and abundance of macroplastics and burden of persistent organic pollutants (POPs). Mar. Pollut. Bull. 2020, 152, 110881. [Google Scholar] [CrossRef]
- Jeyasanta, K.I.; Sathish, N.; Patterson, J.; Edward, J.K.P. Macro-, meso- and microplastic debris in the beaches of Tuticorin district, Southeast coast of India. Mar. Pollut. Bull. 2020, 154, 111055. [Google Scholar] [CrossRef]
- Maharana, D.; Saha, M.; Dar, J.Y.; Rathore, C.; Sreepada, R.A.; Xu, X.-R.; Koongolla, J.B.; Li, H.-X. Assessment of micro and macroplastics along the west coast of India: Abundance, distribution, polymer type and toxicity. Chemosphere 2020, 246, 125708. [Google Scholar] [CrossRef] [PubMed]
- Isyrini, R.; La Nafie, Y.A.; Ukkas, M.; Rachim, R.; Cordova, M.R. Marine Macro Debris from Makassar Strait Beaches with Three Different Designations. IOP Conf. Ser. Earth Environ. Sci. 2019, 253, 12039. [Google Scholar] [CrossRef]
- Vlachogianni, T.; Fortibuoni, T.; Ronchi, F.; Zeri, C.; Mazziotti, C.; Tutman, P.; Varezić, D.B.; Palatinus, A.; Trdan, Š.; Peterlin, M.; et al. Marine litter on the beaches of the Adriatic and Ionian Seas: An assessment of their abundance, composition and sources. Mar. Pollut. Bull. 2018, 131, 745–756. [Google Scholar] [CrossRef]
- Aydin, C.; Guven, O.; Salihoglu, B.; Kideys, A.E. The Influence of Land Use on Coastal Litter: An Approach to Identify Abundance and Source in the Coastal Area of Cilician Basin, Turkey. Turk. J. Fish. Aquat. Sci. 2016, 16. [Google Scholar] [CrossRef]
- Laglbauer, B.J.L.; Franco-Santos, R.M.; Andreu-Cazenave, M.; Brunelli, L.; Papadatou, M.; Palatinus, A.; Grego, M.; Deprez, T. Macrodebris and microplastics from beaches in Slovenia. Mar. Pollut. Bull. 2014, 89, 356–366. [Google Scholar] [CrossRef] [Green Version]
- Prevenios, M.; Zeri, C.; Tsangaris, C.; Liubartseva, S.; Fakiris, E.; Papatheodorou, G. Beach litter dynamics on Mediterranean coasts: Distinguishing sources and pathways. Mar. Pollut. Bull. 2018, 129, 448–457. [Google Scholar] [CrossRef]
- Munari, C.; Corbau, C.; Simeoni, U.; Mistri, M. Marine litter on Mediterranean shores: Analysis of composition, spatial distribution and sources in north-western Adriatic beaches. Waste Manag. 2016, 49, 483–490. [Google Scholar] [CrossRef]
- Pasternak, G.; Zviely, D.; Ribic, C.A.; Ariel, A.; Spanier, E. Sources, composition and spatial distribution of marine debris along the Mediterranean coast of Israel. Mar. Pollut. Bull. 2017, 114, 1036–1045. [Google Scholar] [CrossRef]
- Andrady, A. Persistence of Plastic Litter in the Oceans. In Marine Anthropogenic Litter; Bergmann, M., Gutow, L., Klages, M., Eds.; Springer International Publishing: Cham, Switzerland, 2015; pp. 57–72. ISBN 978-3-319-16509-7. [Google Scholar]
- JAMSTEC. Japan Agency for Marine-Earth Science and Technology. Available online: http://www.godac.jamstec.go.jp/catalog/dsdebris/e/index.html (accessed on 16 January 2020).
- Galgani, F.; Souplet, A.; Cadiou, Y. Accumulation of debris on the deep sea floor off the French Mediterranean coast. Mar. Ecol. Prog. Ser. 1996, 142, 225–234. [Google Scholar] [CrossRef] [Green Version]
- Pham, C.K.; Ramirez-Llodra, E.; Alt, C.H.S.; Amaro, T.; Bergmann, M.; Canals, M.; Company, J.B.; Davies, J.; Duineveld, G.; Galgani, F.; et al. Marine litter distribution and density in European seas, from the shelves to deep basins. PLoS ONE 2014, 9, e95839. [Google Scholar] [CrossRef] [Green Version]
- Chiba, S.; Saito, H.; Fletcher, R.; Yogi, T.; Kayo, M.; Miyagi, S.; Ogido, M.; Fujikura, K. Human footprint in the abyss: 30 year records of deep-sea plastic debris. Mar. Policy 2018, 96, 204–212. [Google Scholar] [CrossRef]
- Consoli, P.; Scotti, G.; Romeo, T.; Fossi, M.C.; Esposito, V.; D’Alessandro, M.; Battaglia, P.; Galgani, F.; Figurella, F.; Pragnell-Raasch, H.; et al. Characterization of seafloor litter on Mediterranean shallow coastal waters: Evidence from Dive Against Debris®, a citizen science monitoring approach. Mar. Pollut. Bull. 2020, 150, 110763. [Google Scholar] [CrossRef]
- Barnes, D.K.A.; Walters, A.; Gonçalves, L. Macroplastics at sea around Antarctica. Mar. Environ. Res. 2010, 70, 250–252. [Google Scholar] [CrossRef]
- Huerta Lwanga, E.; Mendoza Vega, J.; Ku Quej, V.; Chi, J.d.L.A.; Sanchez Del Cid, L.; Chi, C.; Escalona Segura, G.; Gertsen, H.; Salánki, T.; van der Ploeg, M.; et al. Field evidence for transfer of plastic debris along a terrestrial food chain. Sci. Rep. 2017, 7, 14071. [Google Scholar] [CrossRef]
- Basnet, K. Solid waste pollution versus sustainable development in high mountain environment: A case study of Sagarmatha National Park of Khumbu Region, Nepal. Contrib. Nepal Stud. 1993, 20, 131–139. [Google Scholar]
- Corcoran, P.L.; Moore, C.J.; Jazvac, K. An anthropogenic marker horizon in the future rock record. GSAT 2014, 24, 4–8. [Google Scholar] [CrossRef]
- Gestoso, I.; Cacabelos, E.; Ramalhosa, P.; Canning-Clode, J. Plasticrusts: A new potential threat in the Anthropocene’s rocky shores. Sci. Total Environ. 2019, 687, 413–415. [Google Scholar] [CrossRef]
- Ehlers, S.M.; Ellrich, J.A. First record of ‘plasticrusts’ and ‘pyroplastic’ from the Mediterranean Sea. Mar. Pollut. Bull. 2020, 151, 110845. [Google Scholar] [CrossRef]
- Egger, M.; Sulu-Gambari, F.; Lebreton, L. First evidence of plastic fallout from the North Pacific Garbage Patch. Sci. Rep. 2020, 10, 7495. [Google Scholar] [CrossRef]
- Bergmann, M.; Klages, M. Increase of litter at the Arctic deep-sea observatory HAUSGARTEN. Mar. Pollut. Bull. 2012, 64, 2734–2741. [Google Scholar] [CrossRef]
- Gall, S.C.; Thompson, R.C. The impact of debris on marine life. Mar. Pollut. Bull. 2015, 92, 170–179. [Google Scholar] [CrossRef] [PubMed]
- Kenyon, K.W.; Kridler, E. Laysan Albatrosses swallow indigestible matter. Auk 1969, 86, 339–343. [Google Scholar] [CrossRef]
- Patterson Edward, J.K.; Mathews, G.; Raj, K.D.; Laju, R.L.; Bharath, M.S.; Kumar, P.D.; Arasamuthu, A.; Grimsditch, G. Marine debris—An emerging threat to the reef areas of Gulf of Mannar, India. Mar. Pollut. Bull. 2020, 151, 110793. [Google Scholar] [CrossRef]
- Kühn, S.; Bravo Rebolledo, E.L.; van Franeker, J.A. Deleterious Effects of Litter on Marine Life. In Marine Anthropogenic Litter; Bergmann, M., Gutow, L., Klages, M., Eds.; Springer International Publishing: Cham, Switzerland, 2015; pp. 75–116. ISBN 978-3-319-16509-7. [Google Scholar]
- Schuyler, Q.; Hardesty, B.D.; Wilcox, C.; Townsend, K. Global analysis of anthropogenic debris ingestion by sea turtles. Conserv. Biol. 2014, 28, 129–139. [Google Scholar] [CrossRef]
- Hyrenbach, K.D.; Hester, M.; Adams, J.; Titmus, A.; Michael, P.; Wahl, T.; Chang, C.-W.; Marie, A.; Vanderlip, C. Plastic ingestion by black-footed albatross phoebastria nigripes from kure atoll, Hawai’i: Linking chick diet remains and parental at-sea foraging distribution. Mar. Ornithol. 2017, 45, 225–236. [Google Scholar]
- Woods, J.S.; Rødder, G.; Verones, F. An effect factor approach for quantifying the entanglement impact on marine species of macroplastic debris within life cycle impact assessment. Ecol. Indic. 2019, 99, 61–66. [Google Scholar] [CrossRef]
- Naidoo, T.; Rajkaran, A. Impacts of plastic debris on biota and implications for human health: A South African perspective. S. Afr. J. Sci 2020, 116. [Google Scholar] [CrossRef]
- Rios, L.M.; Moore, C.; Jones, P.R. Persistent organic pollutants carried by synthetic polymers in the ocean environment. Mar. Pollut. Bull. 2007, 54, 1230–1237. [Google Scholar] [CrossRef]
- Rios, L.M.; Jones, P.R.; Moore, C.; Narayan, U.V. Quantitation of persistent organic pollutants adsorbed on plastic debris from the Northern Pacific Gyre’s “eastern garbage patch”. J. Environ. Monit. 2010, 12, 2226–2236. [Google Scholar] [CrossRef]
- Koelmans, A.A.; Besseling, E.; Foekema, E.M. Leaching of plastic additives to marine organisms. Environ. Pollut. 2014, 187, 49–54. [Google Scholar] [CrossRef]
- Hahladakis, J.N.; Velis, C.A.; Weber, R.; Iacovidou, E.; Purnell, P. An overview of chemical additives present in plastics: Migration, release, fate and environmental impact during their use, disposal and recycling. J. Hazard. Mater. 2018, 344, 179–199. [Google Scholar] [CrossRef]
- Steinmetz, Z.; Wollmann, C.; Schaefer, M.; Buchmann, C.; David, J.; Tröger, J.; Muñoz, K.; Frör, O.; Schaumann, G.E. Plastic mulching in agriculture. Trading short-term agronomic benefits for long-term soil degradation? Sci. Total Environ. 2016, 550, 690–705. [Google Scholar] [CrossRef] [PubMed]
- Araújo, M.C.B.; Costa, M.F. A critical review of the issue of cigarette butt pollution in coastal environments. Environ. Res. 2019, 172, 137–149. [Google Scholar] [CrossRef]
- Kurmus, H.; Mohajerani, A. The toxicity and valorization options of cigarette butts. Waste Manag. 2020, 104, 104–118. [Google Scholar] [CrossRef]
- Kalogerakis, N.; Karkanorachaki, K.; Kalogerakis, G.C.; Triantafyllidi, E.I.; Gotsis, A.D.; Partsinevelos, P.; Fava, F. Microplastics Generation: Onset of Fragmentation of Polyethylene Films in Marine Environment Mesocosms. Front. Mar. Sci. 2017, 4, 84. [Google Scholar] [CrossRef]
- Fath, A. Mikroplastik. Eine Drohende Gefahr? 1st ed.; Springer: Berlin/Heidelberg, Germany, 2019; ISBN 978-3-662-57851-3. [Google Scholar]
- Masó, M.; Garcés, E.; Pagès, F.; Camp, J. Drifting plastic debris as a potential vector for dispersing Harmful Algal Bloom (HAB) species. Sci. Mar. 2003, 67, 107–111. [Google Scholar] [CrossRef] [Green Version]
- Qi, Y.; Yang, X.; Pelaez, A.M.; Huerta Lwanga, E.; Beriot, N.; Gertsen, H.; Garbeva, P.; Geissen, V. Macro- and micro- plastics in soil-plant system: Effects of plastic mulch film residues on wheat (Triticum aestivum) growth. Sci. Total Environ. 2018, 645, 1048–1056. [Google Scholar] [CrossRef] [PubMed]
- Royer, S.-J.; Ferrón, S.; Wilson, S.T.; Karl, D.M. Production of methane and ethylene from plastic in the environment. PLoS ONE 2018, 13, e0200574. [Google Scholar] [CrossRef]
- Beaumont, N.J.; Aanesen, M.; Austen, M.C.; Börger, T.; Clark, J.R.; Cole, M.; Hooper, T.; Lindeque, P.K.; Pascoe, C.; Wyles, K.J. Global ecological, social and economic impacts of marine plastic. Mar. Pollut. Bull. 2019, 142, 189–195. [Google Scholar] [CrossRef]
- Gregory, M. Plastics and South Pacific Island shores: Environmental implications. Ocean Coast. Manag. 1999, 42, 603–615. [Google Scholar] [CrossRef]
- Hardesty, B.D.; Harari, J.; Isobe, A.; Lebreton, L.; Maximenko, N.; Potemra, J.; van Sebille, E.; Vethaak, A.D.; Wilcox, C. Using Numerical Model Simulations to Improve the Understanding of Micro-plastic Distribution and Pathways in the Marine Environment. Front. Mar. Sci. 2017, 4, 1985. [Google Scholar] [CrossRef] [Green Version]
Figure 1.
Overview of the literature collection used as a basis for this review.

Figure 2.
Life cycle of macroplastic with characteristic information on production shares, specific densities, market sectors, and waste treatment in Europe 2016/2017 (data based on [42], layout from [43]).

Figure 3.
Sources and transport paths of macroplastic with approximate accounting of mass budget if data are available, * data from 2015 (based on [16], data and calculations from [4,42,44,51,52,53,54,55,56,57]).

Figure 4.
Annual input into oceans of average riverine, floating macroplastic (MaP) differentiated according to data from modelling and sampling (data based on [5,51,118,128,129,130,131,132]).

Figure 5.
Concentrations of MaP on shorelines differentiates between the northern and southern hemisphere (data based on [115,122,144,149,151,152,153,154,155,156,157,158,159,160,161,162,163]).

Figure 6.
Entry paths, pathways (transport processes), and temporal and final sinks of macroplastic (adapted from [43] and [16]).

Figure 7.
Rough estimation of the surface of a 0.5 L plastic bottle and the resulting amount of microplastic particles.
Figure 7.
Rough estimation of the surface of a 0.5 L plastic bottle and the resulting amount of microplastic particles.

Figure 8.
Source–Pathway–Receptor Model applied on macroplastic in the environment (inspired by [16]).
Figure 8.
Source–Pathway–Receptor Model applied on macroplastic in the environment (inspired by [16]).


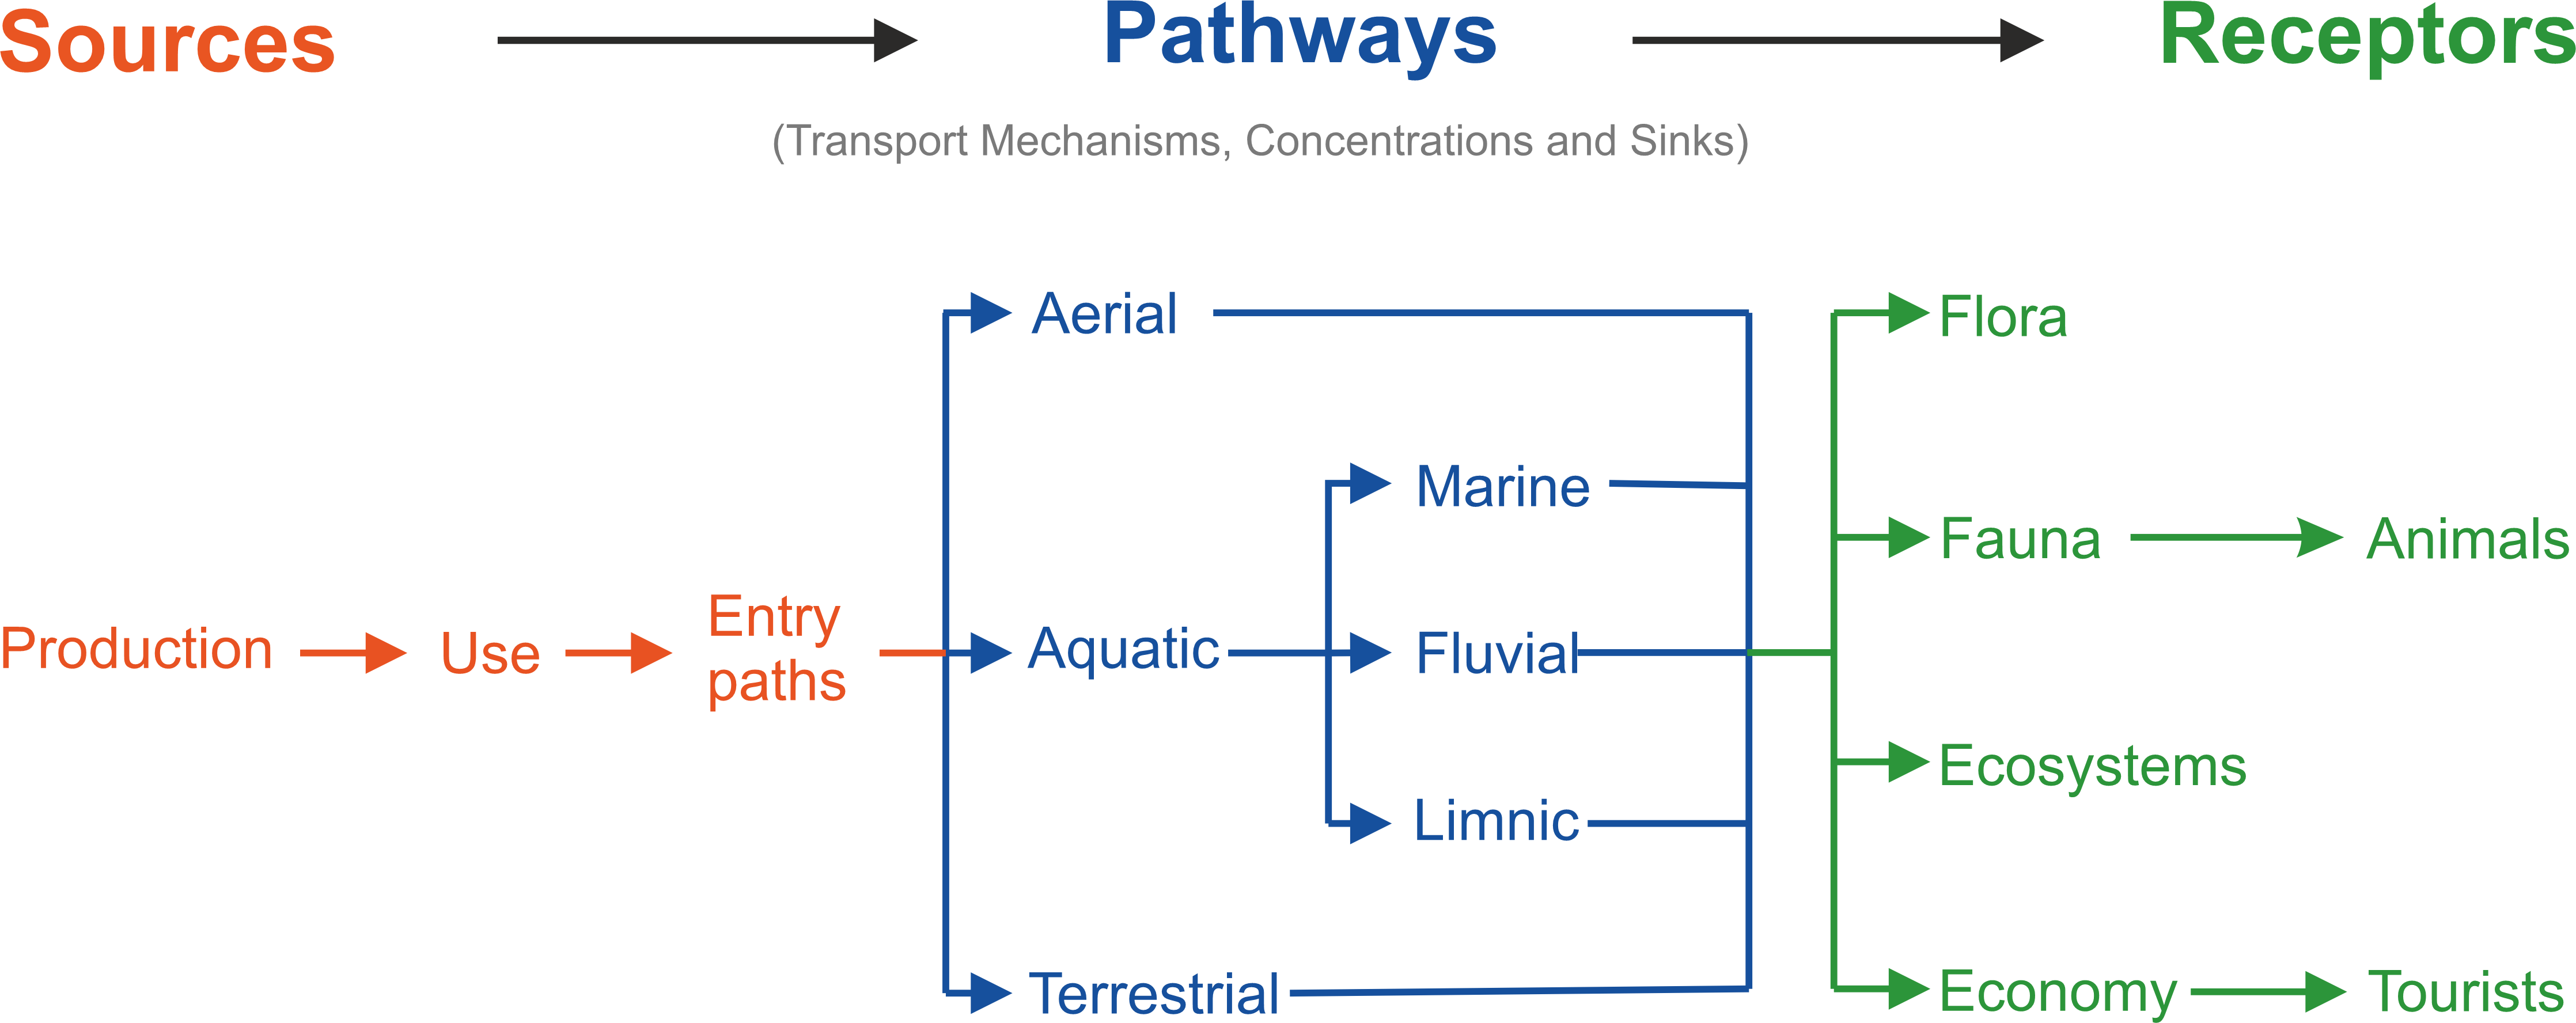
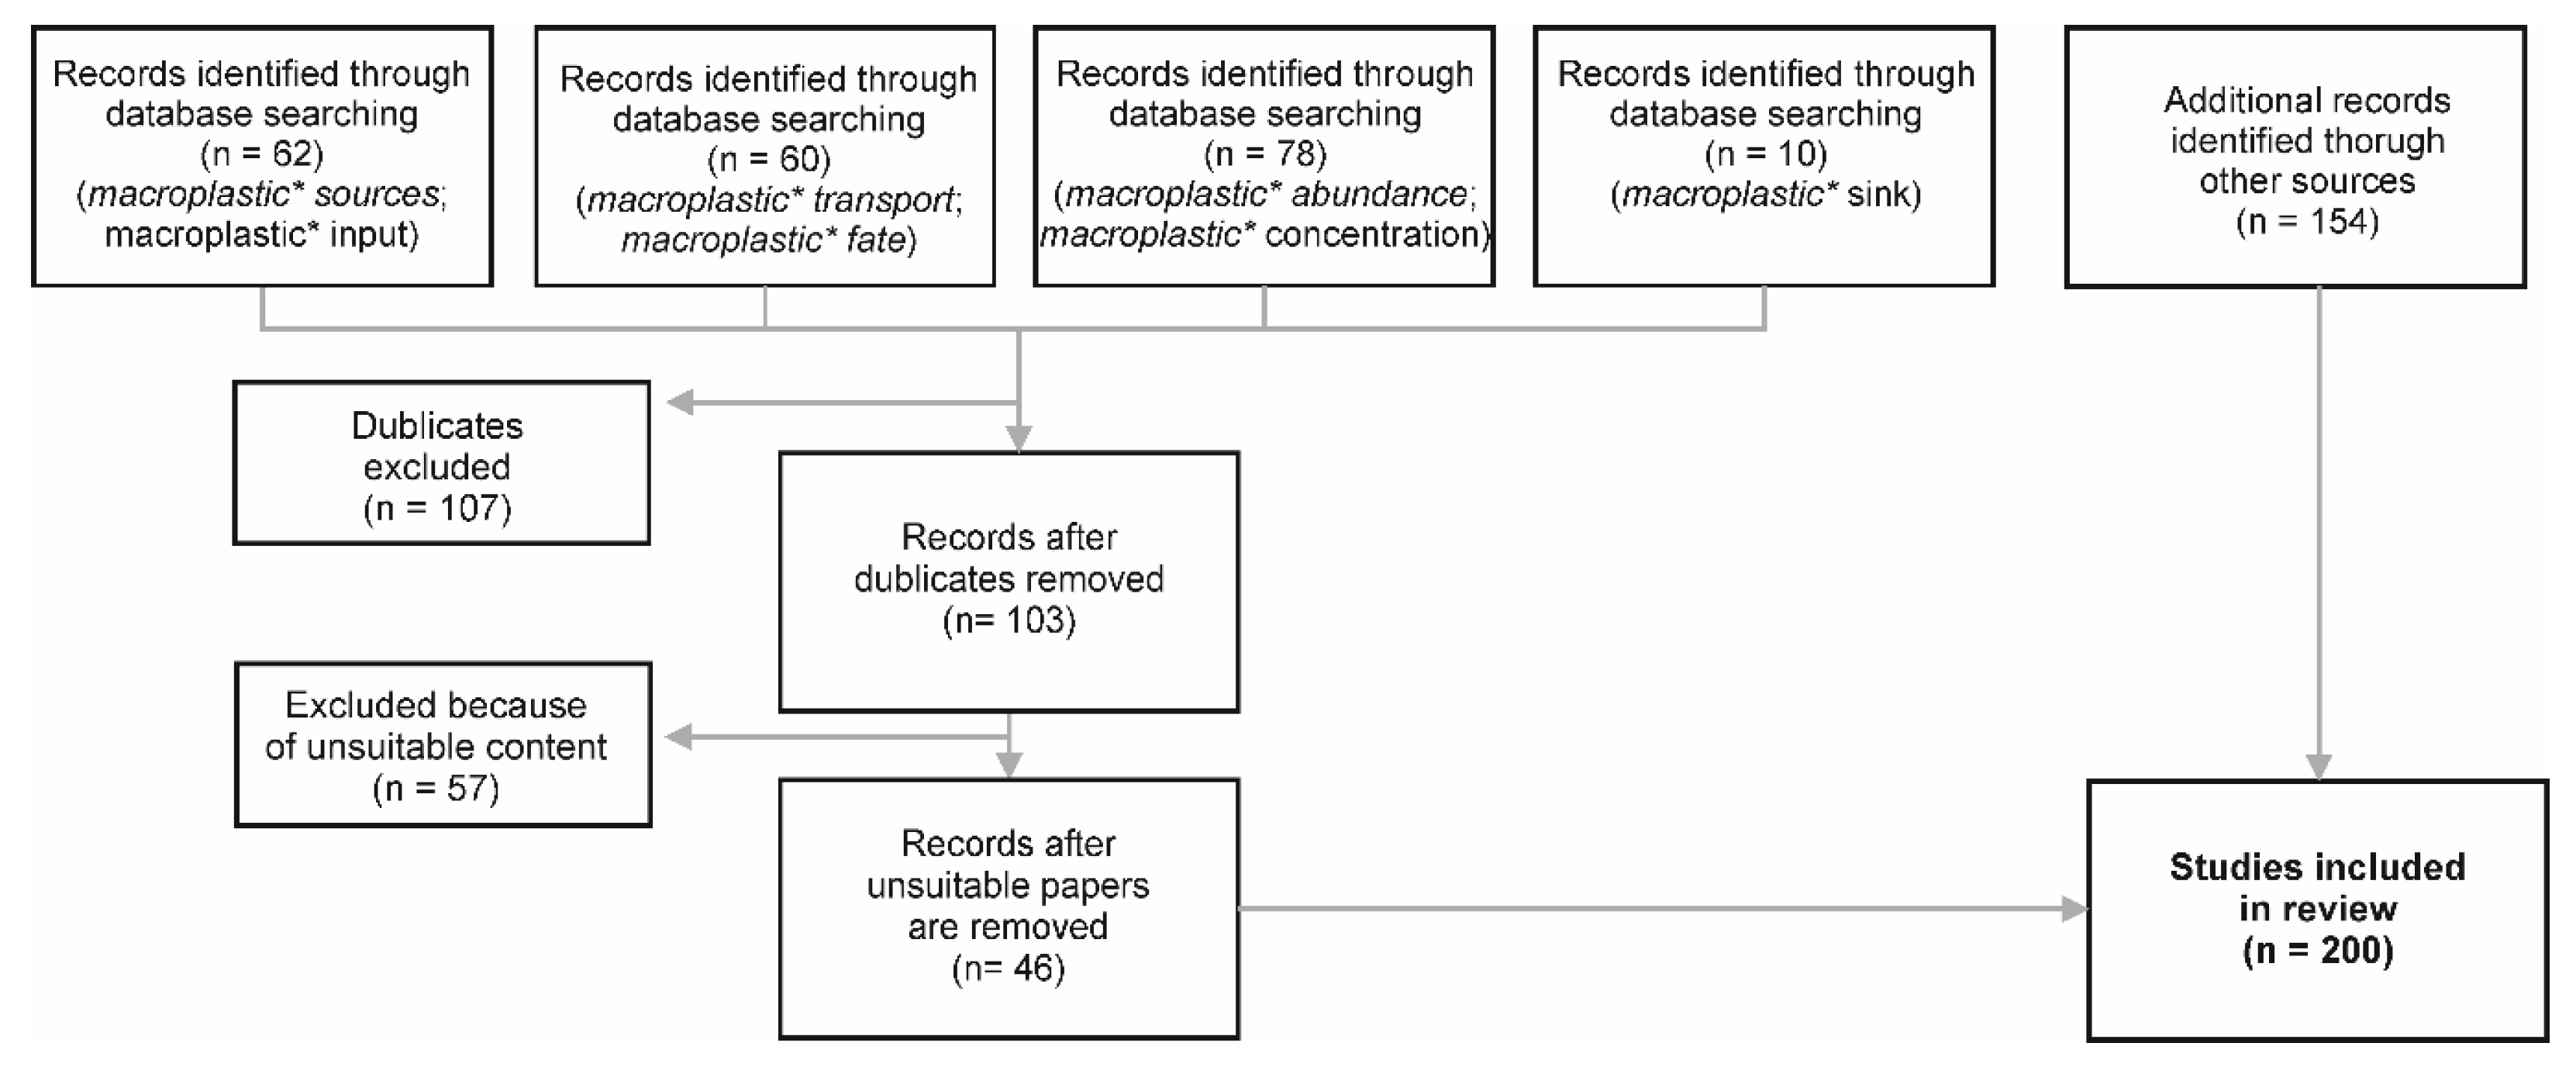
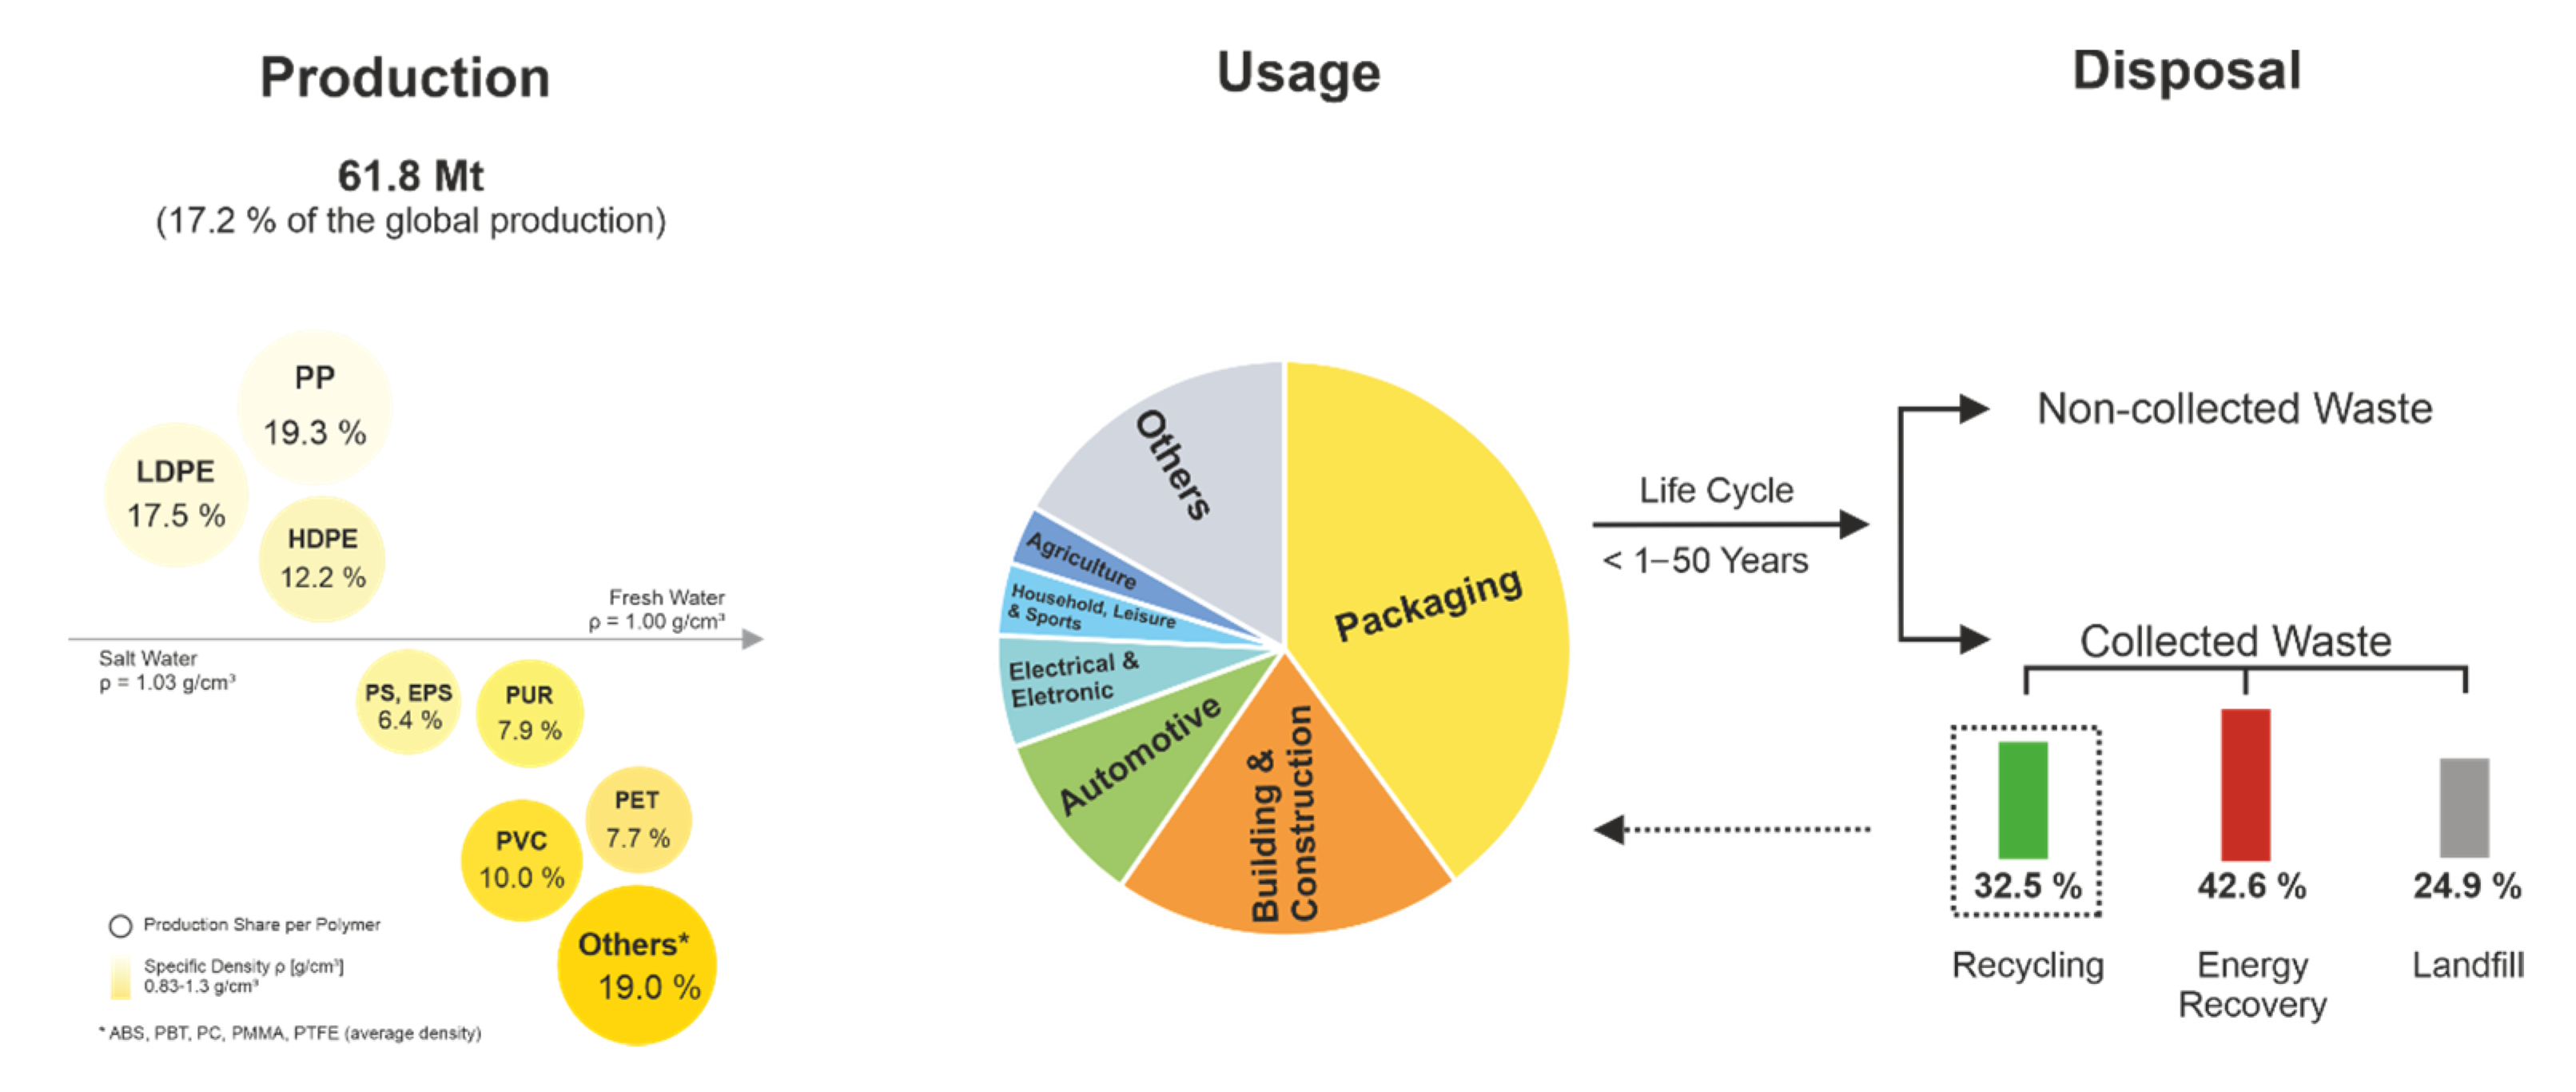
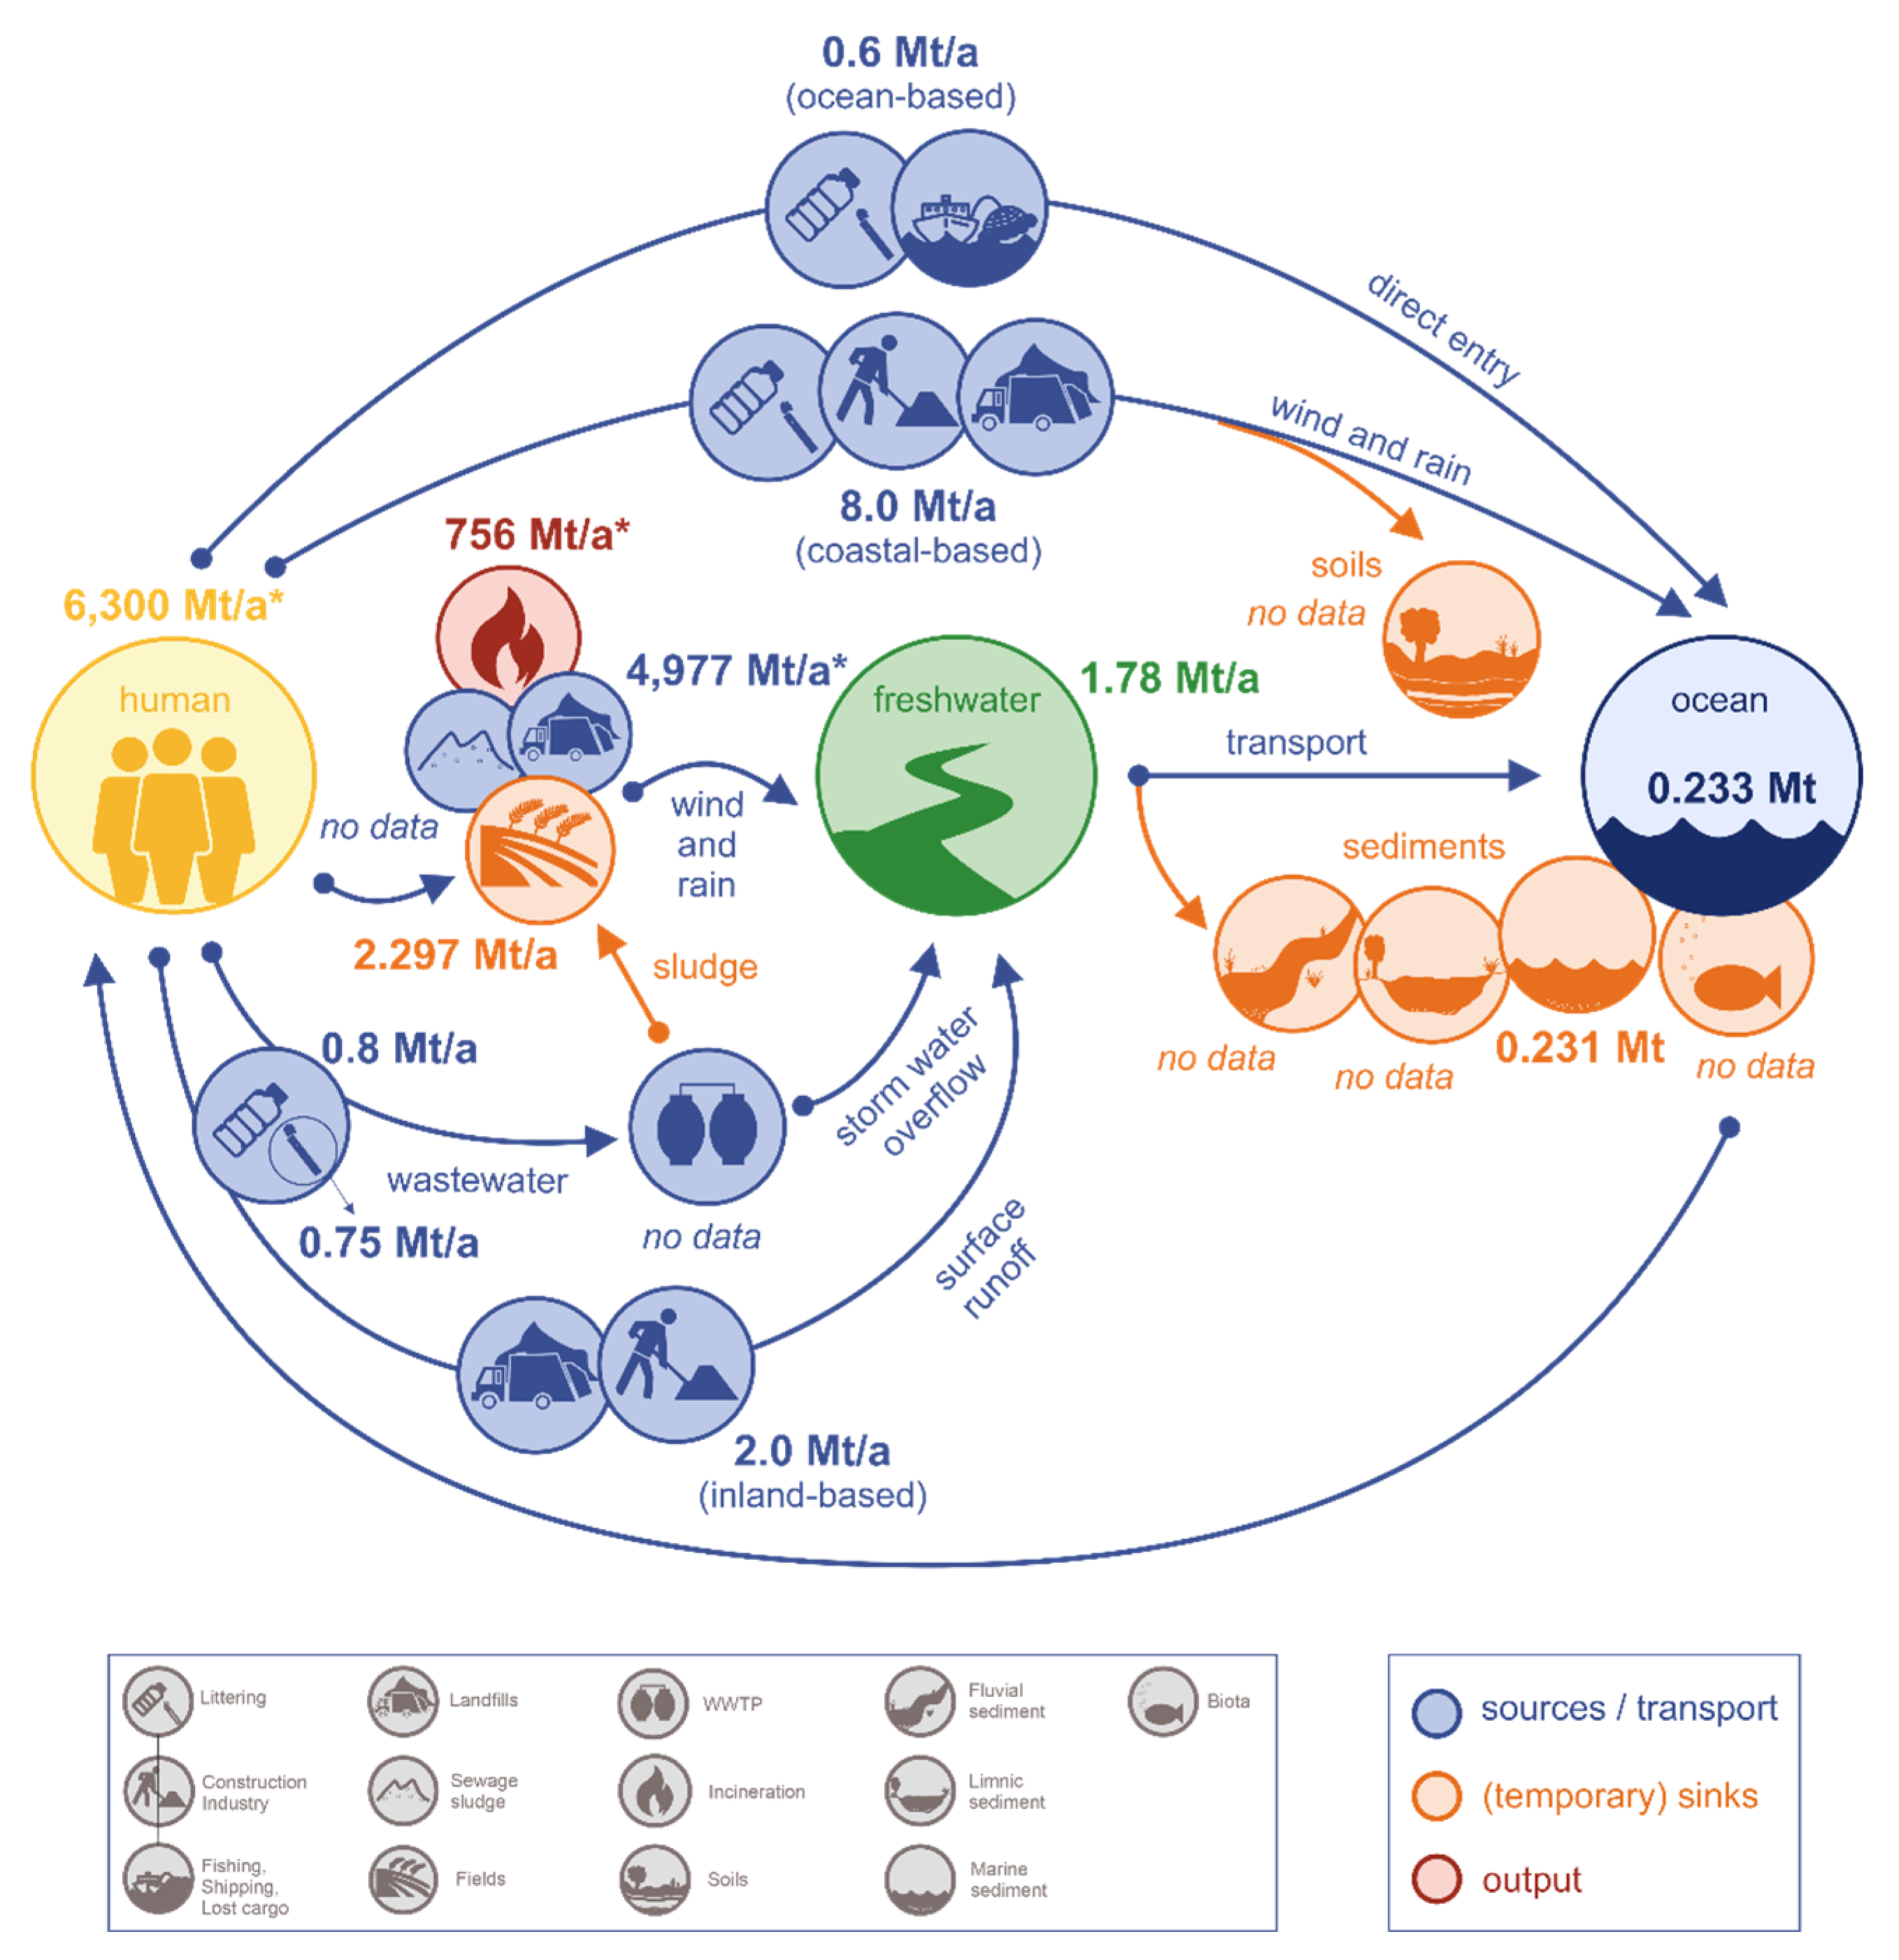
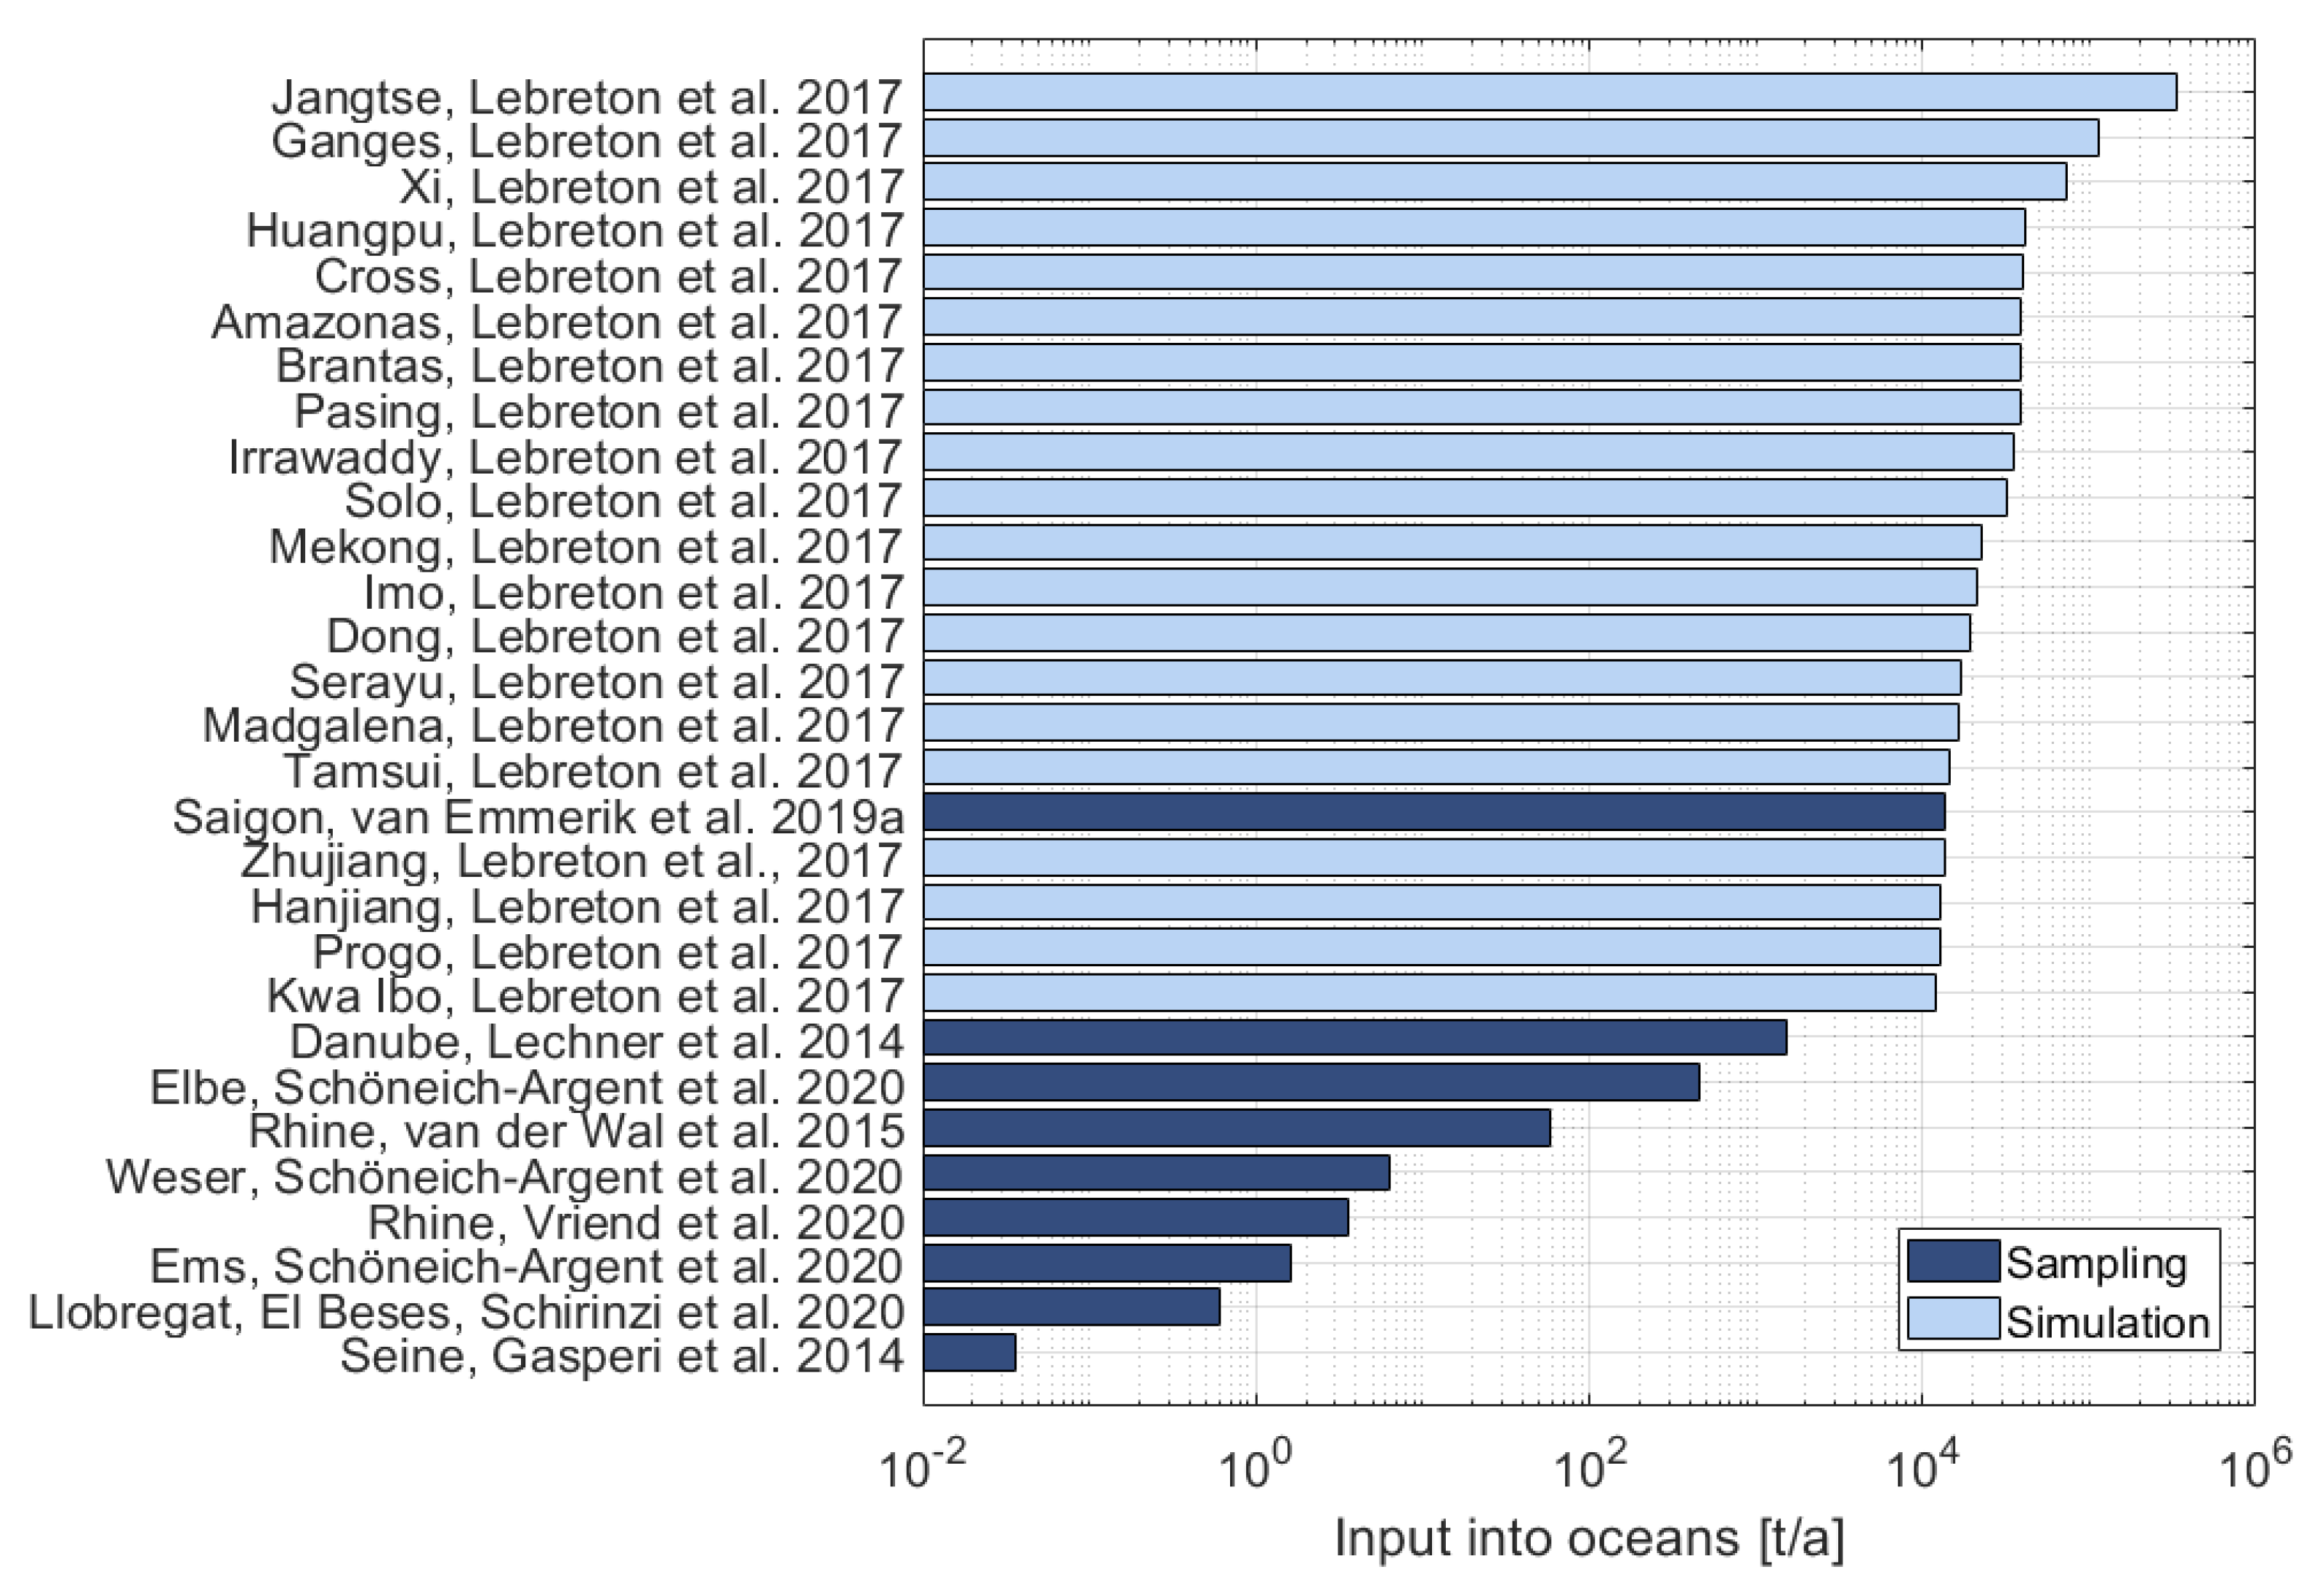
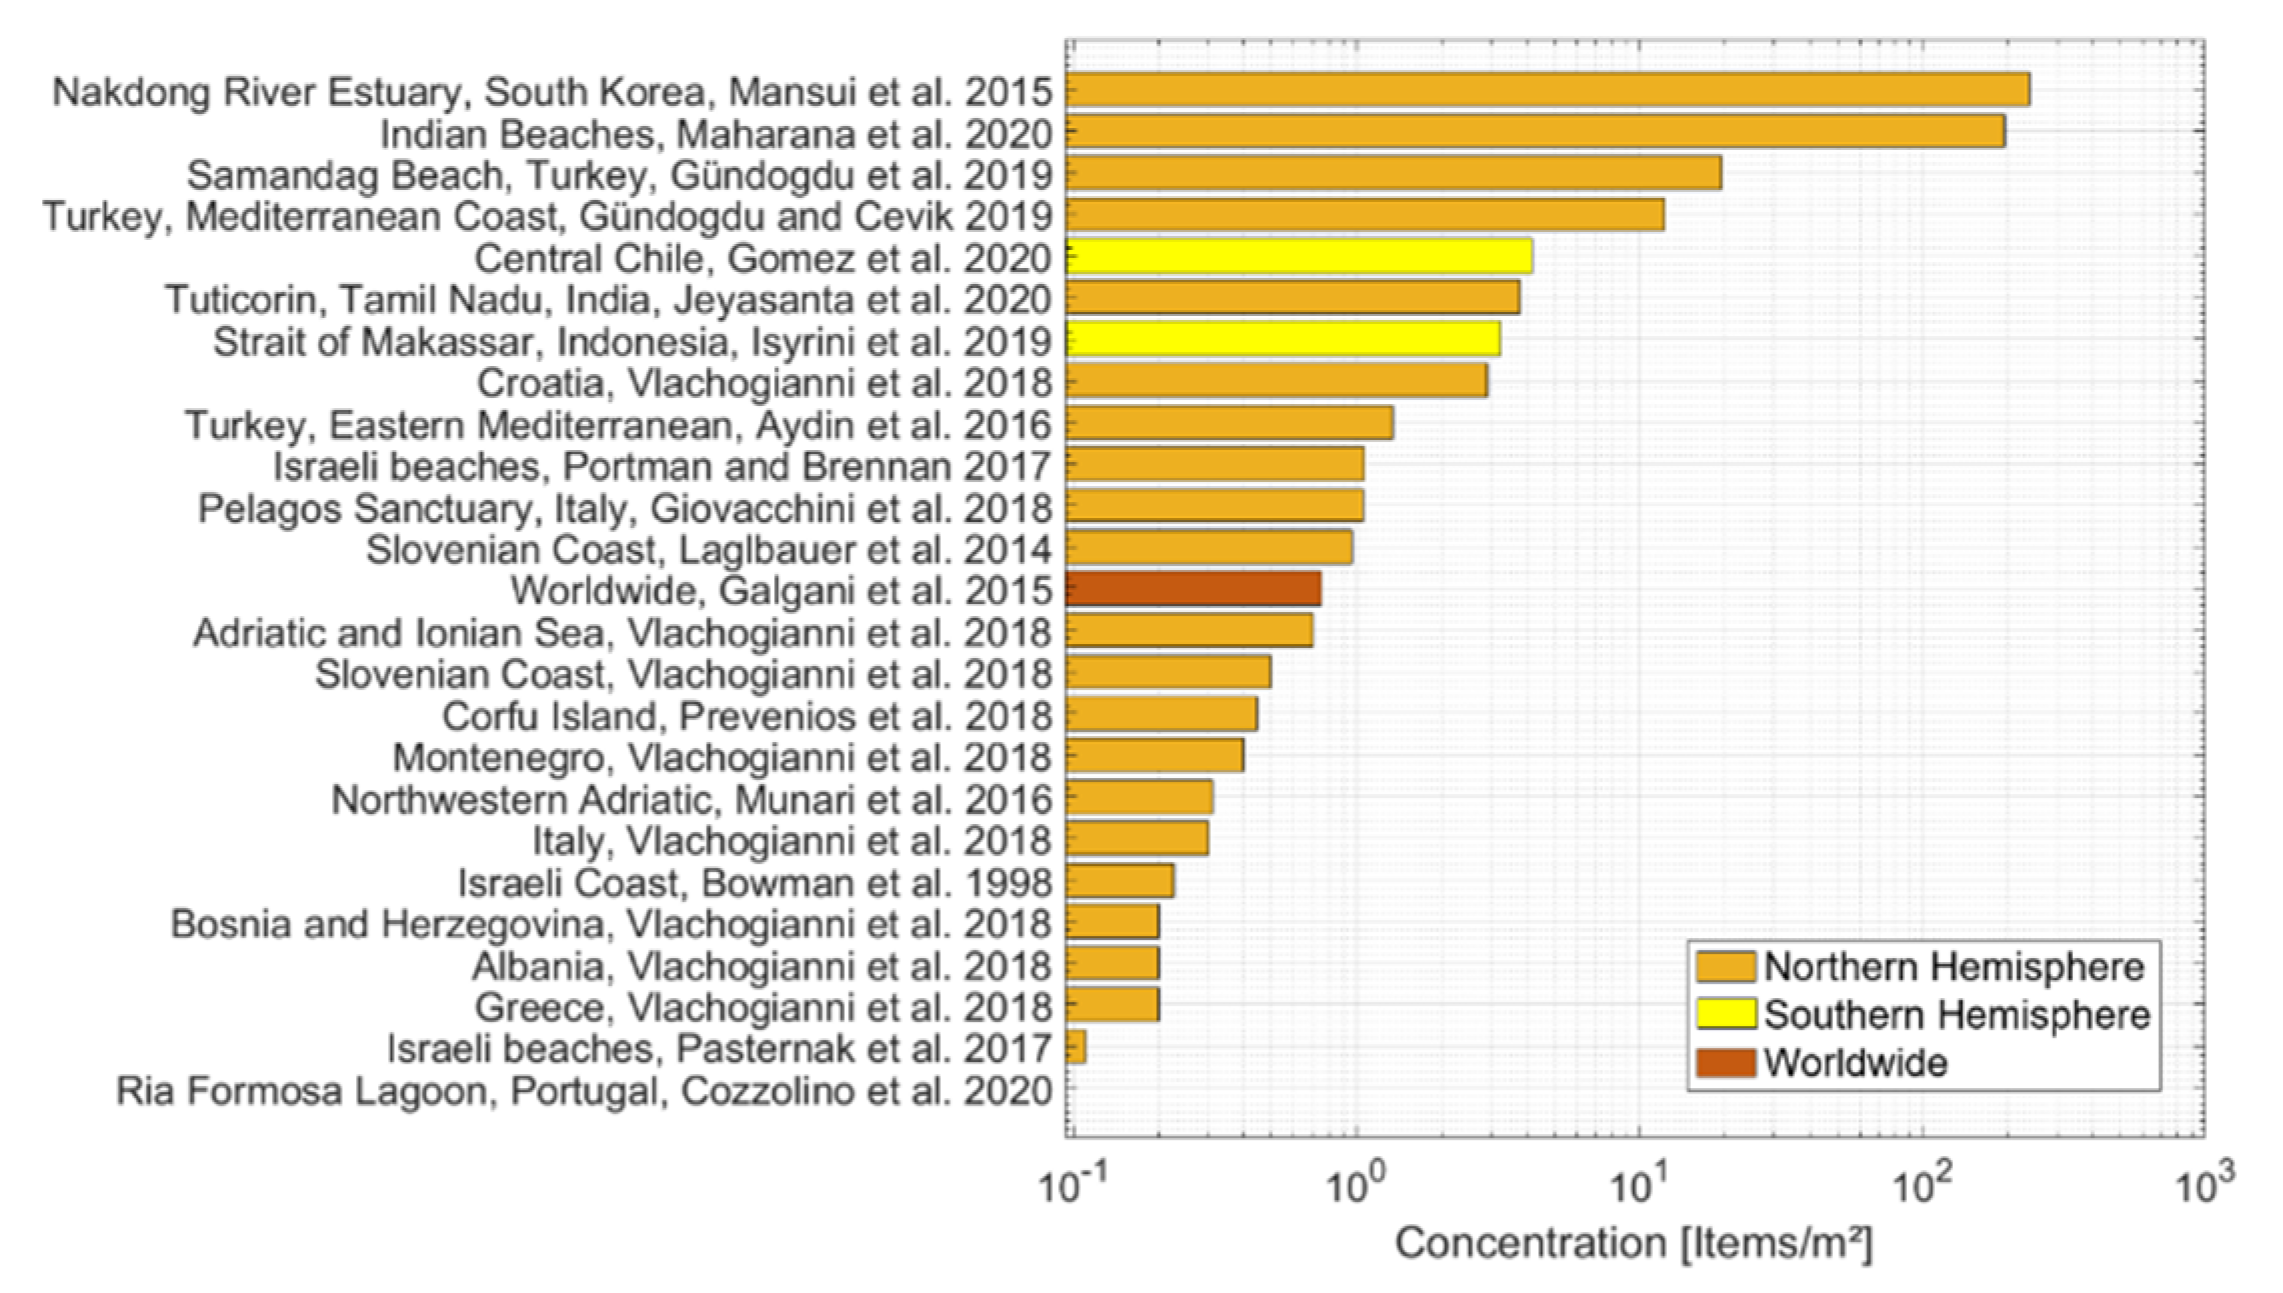
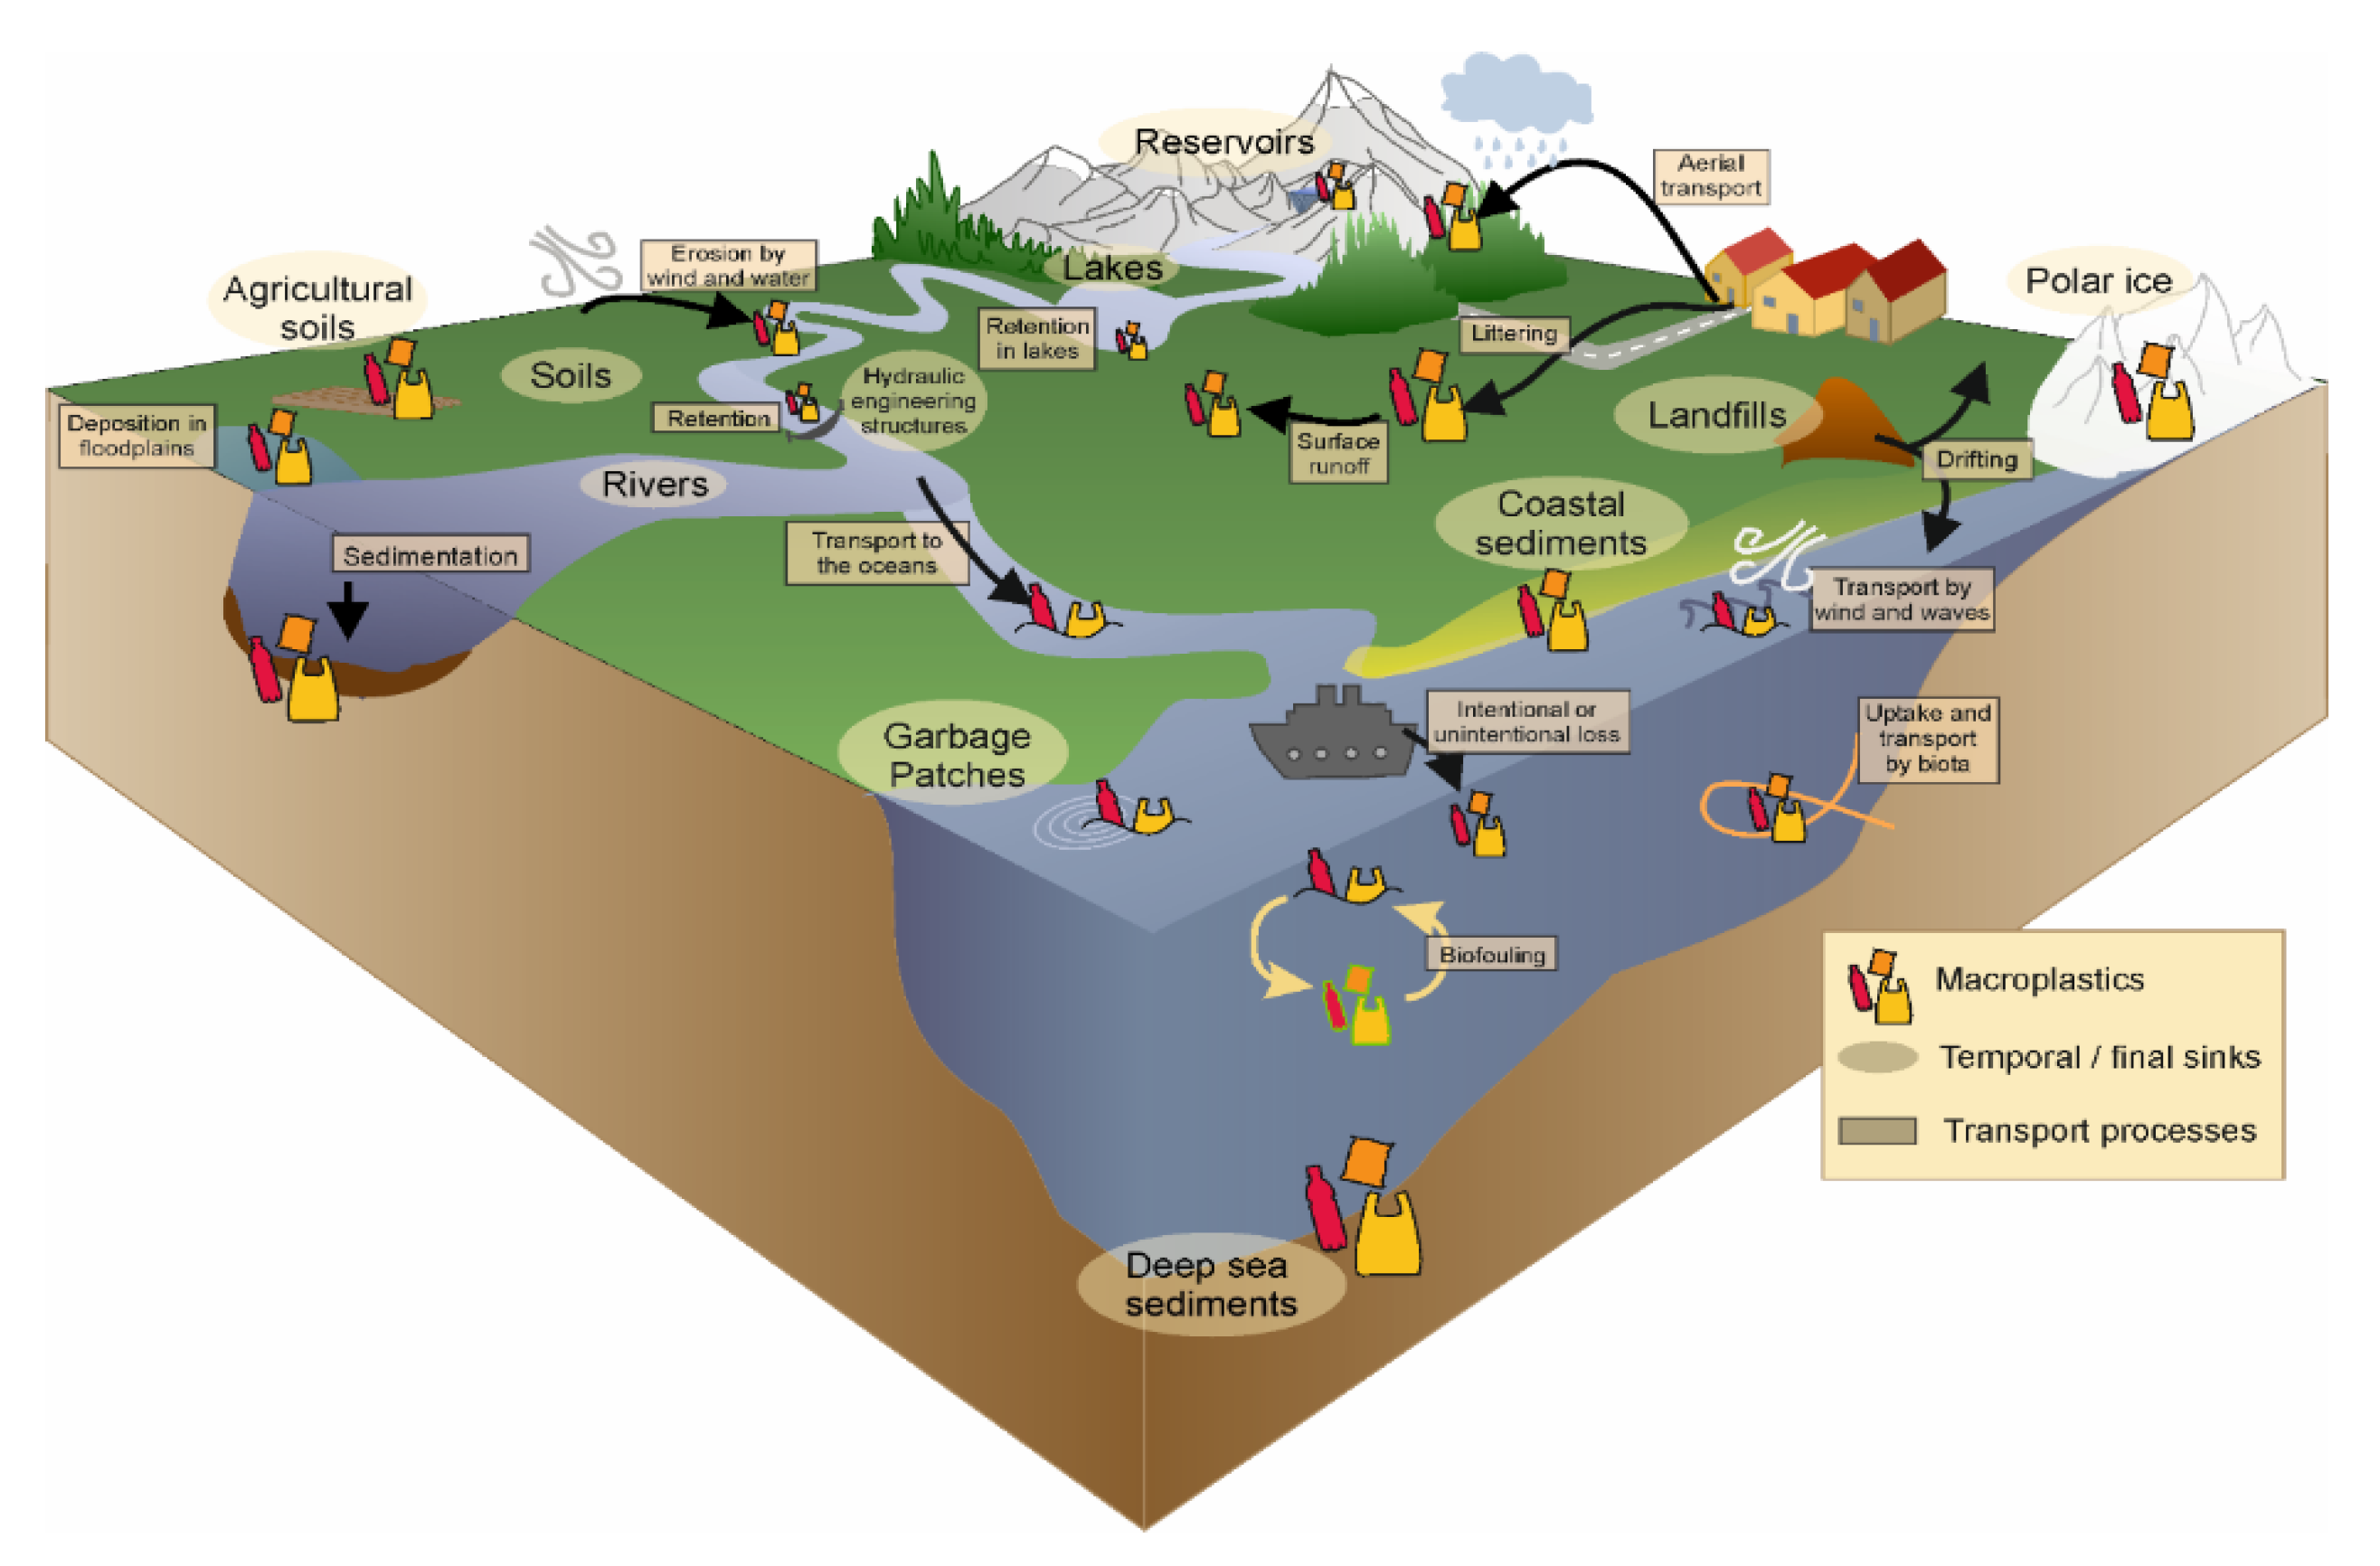
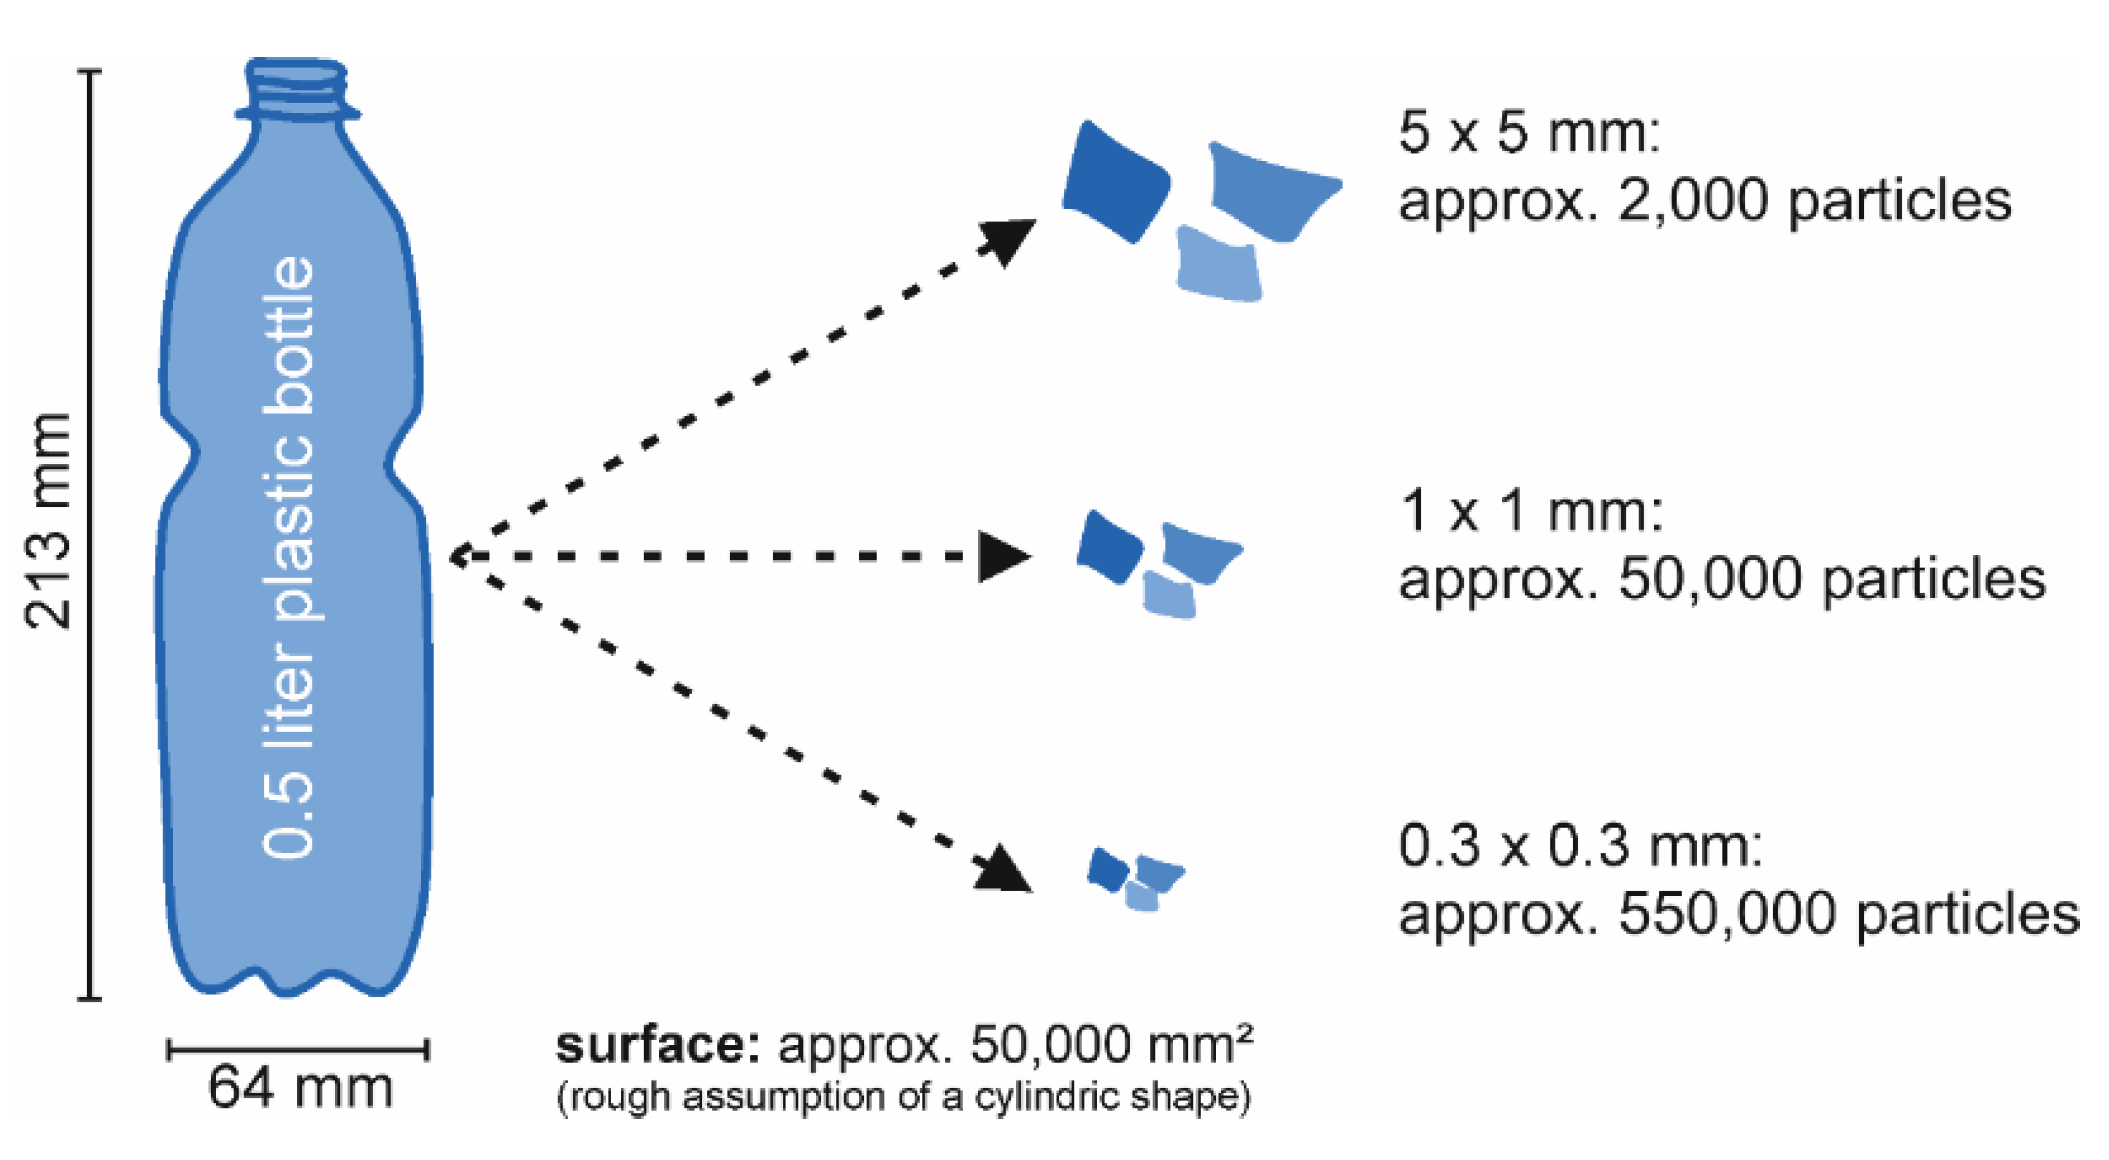
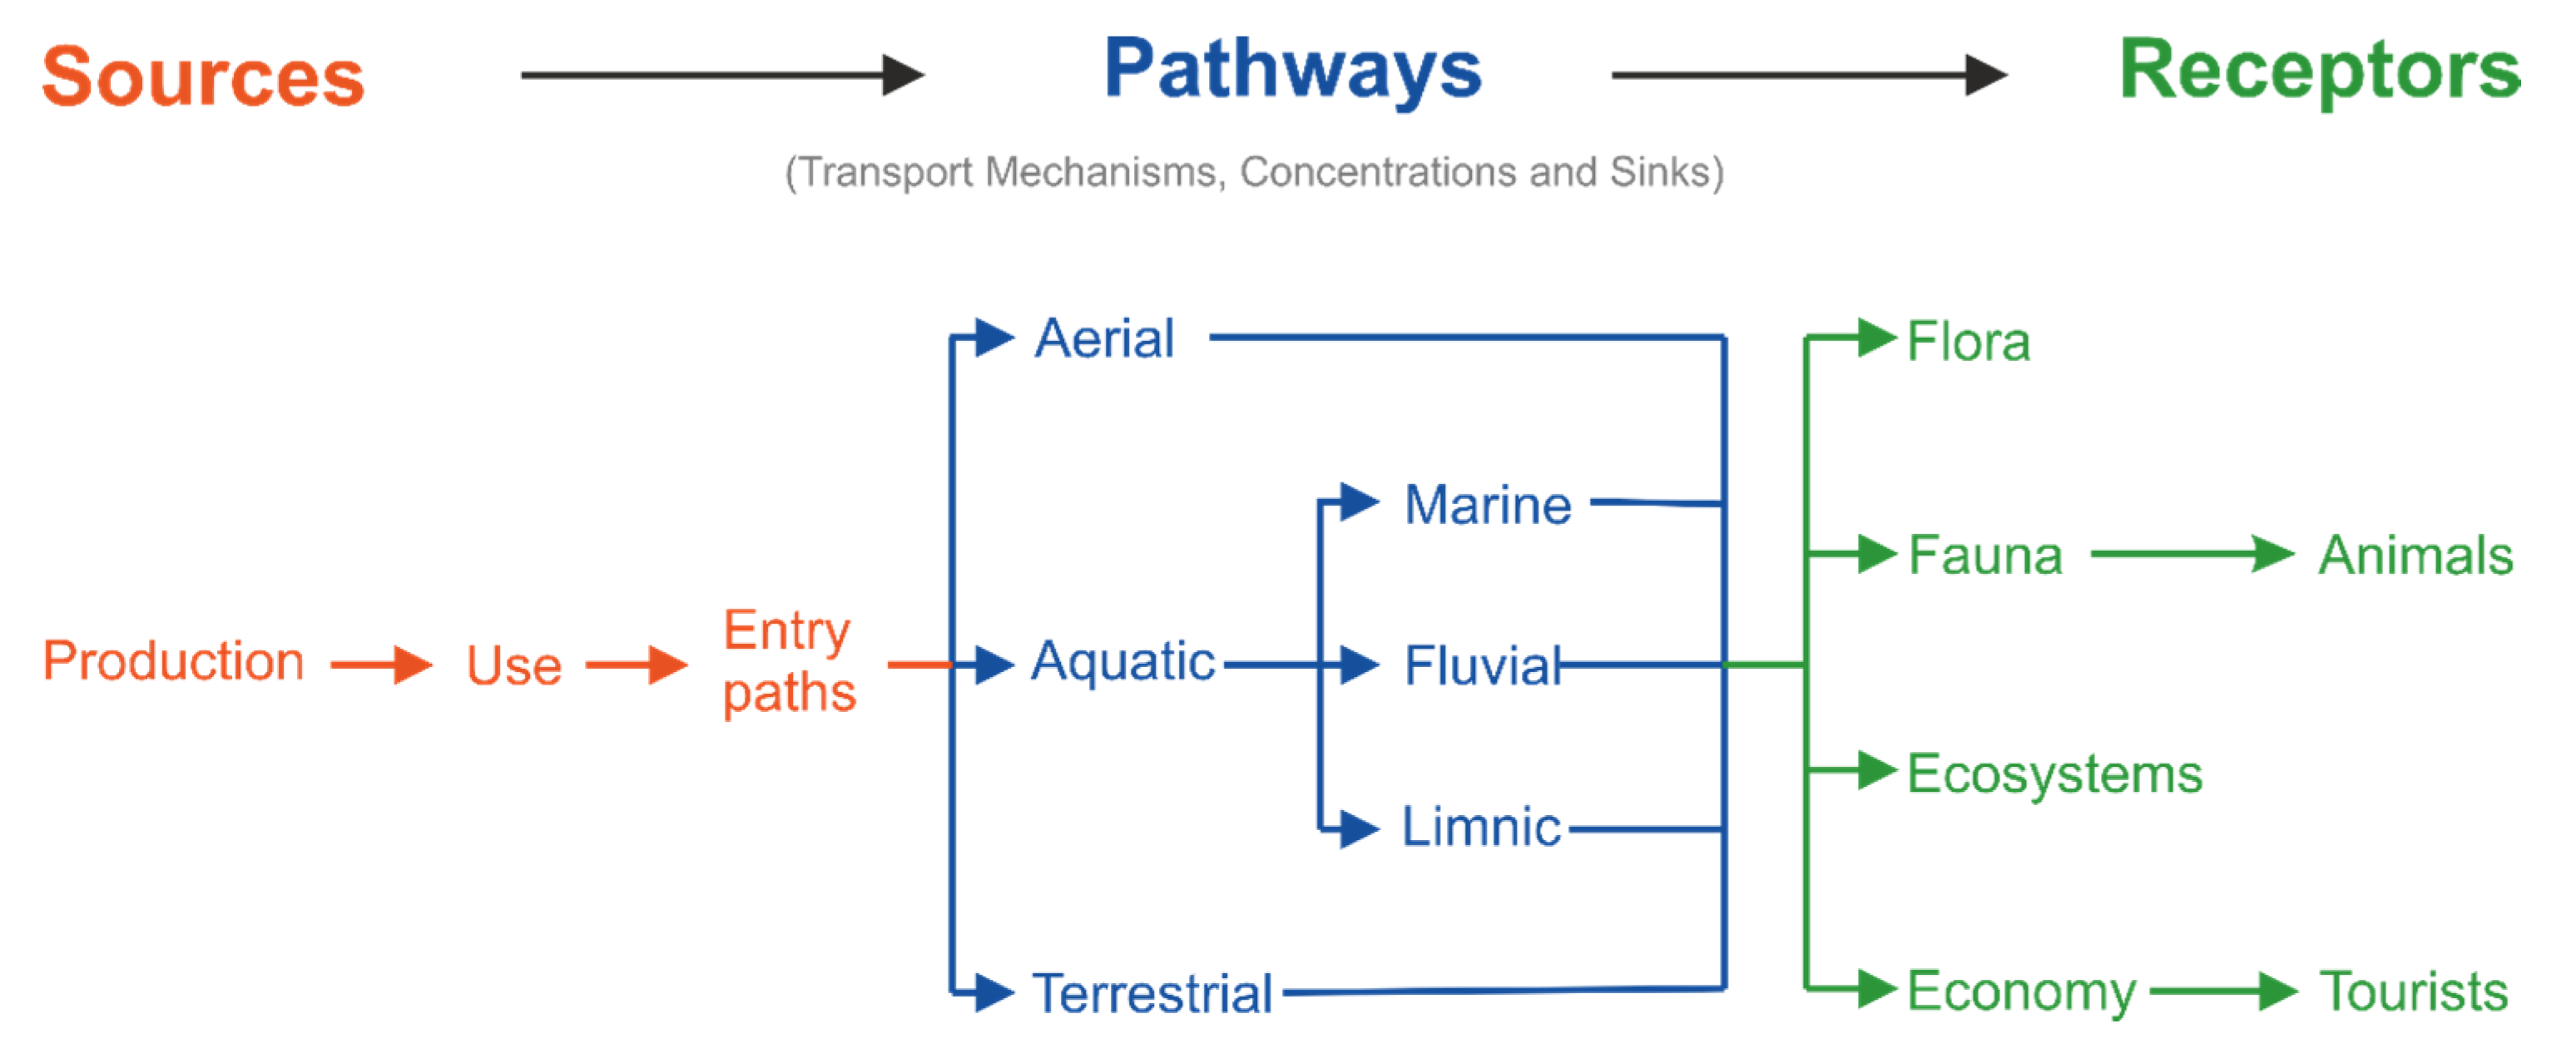
| Land-Based Entry | Ocean-Based Entry |
|---|---|
| Littering | Littering |
|
|
| Industry | Industry |
|
|
| Natural storm events | Natural storm events |
|
|
Waste management
| Waste management (ship-generated)
|
| River transport | Offshore oil and gas platforms |
© 2020 by the authors. Licensee MDPI, Basel, Switzerland. This article is an open access article distributed under the terms and conditions of the Creative Commons Attribution (CC BY) license (http://creativecommons.org/licenses/by/4.0/).
Share and Cite
MDPI and ACS Style
Lechthaler, S.; Waldschläger, K.; Stauch, G.; Schüttrumpf, H. The Way of Macroplastic through the Environment. Environments 2020, 7, 73. https://0-doi-org.brum.beds.ac.uk/10.3390/environments7100073
AMA Style
Lechthaler S, Waldschläger K, Stauch G, Schüttrumpf H. The Way of Macroplastic through the Environment. Environments. 2020; 7(10):73. https://0-doi-org.brum.beds.ac.uk/10.3390/environments7100073
Chicago/Turabian StyleLechthaler, Simone, Kryss Waldschläger, Georg Stauch, and Holger Schüttrumpf. 2020. "The Way of Macroplastic through the Environment" Environments 7, no. 10: 73. https://0-doi-org.brum.beds.ac.uk/10.3390/environments7100073
Note that from the first issue of 2016, this journal uses article numbers instead of page numbers. See further details here.