Road Verge Vegetation and the Capture of Particulate Matter Air Pollution


1
School of the Environment, Geography and Geosciences, University of Portsmouth, Portsmouth PO1 3QL, UK
2
School of Biological Sciences, University of Portsmouth, Portsmouth PO1 2DY, UK
*
Author to whom correspondence should be addressed.
Environments 2020, 7(10), 93; https://0-doi-org.brum.beds.ac.uk/10.3390/environments7100093
Submission received: 1 July 2020
/
Revised: 7 October 2020
/
Accepted: 8 October 2020
/
Published: 20 October 2020
(This article belongs to the Special Issue Understanding and Optimising the Use of Urban Plants in Managing Urban Air Pollution)
Abstract
:Urban air quality is considered a major issue in cities worldwide, with particulate matter (PM) recognised as one of the most harmful pollutants regarding human health. The use of plants to act as air filters and immobilise PM has been identified as a potential method to improve the air quality in these areas. The majority of the work has focused on trees, with the application of shrub and herbaceous species largely overlooked. Two contrasting leaf morphologies from a shrub and herbaceous plant species were sampled at four locations across Southampton (UK), from varying traffic conditions. Samples were analysed for the mass of PM captured, particle size, and elemental composition. These analyses were used to characterise the different sites and the plants’ effectiveness at immobilisation of PM. Captured PM mass was shown to be directly related to traffic density, with greater traffic density leading to higher levels of captured PM. PM origins were attributed to emissions from vehicles and the resuspension of particles by vehicle movement. The bulk of the PM mass was shown to originate from natural, crustal sources including large proportions of Al, Si, and/or Ca. Increases in elements from anthropogenic enhancement (such as Fe and Zn) were related to high traffic density. Particle size analysis identified that, despite the use of standard leaf-washing protocols with a final 2.5 µm filter, PM was dominated by fine particles (<2.5 µm physical diameter), with particles >10 µm rare. Bramble leaves were calculated to have a species-specific deposition velocity 0.51 cm s−1 greater than ivy, with deposition velocities calculated at 1.8 and 1.3 cm s−1 for ivy and 2.3 and 1.8 cm s−1 for bramble at Redbridge Road and Brinton’s Road, respectively. These values can allow for the more accurate modelling and estimation of the PM removal abilities of these plants.
1. Introduction
Urban air pollution poses a serious threat to human health in major cities across the world. Recent estimates suggest that 80% of people in urban areas are living in places where the World Health Organization (WHO) air quality guidelines are not met and that 7 million deaths occur globally from ambient outdoor air pollution every year [1]. Particulate matter (PM) is defined as solid or aqueous compounds in the air, consisting of a multitude of shapes, and is classified by means of aerodynamic diameter. Road traffic emissions (primarily fuel combustion, road abrasion, and brake and tyre wear) are one of the key sources of urban PM pollution [2,3,4]. PM from these sources can contain metals, polyaromatic hydrocarbons (PAHs), and sulphides that are toxic and/or carcinogenic [5,6]. Such pollution is of highest concentration close to the road network source [7]. Urban PM can also be formed through the condensation, coagulation, or nucleation of nitrogen oxides (NOx), sulphur dioxide (SO2), ammonia (NH3), and volatile organic compounds (VOCs); known as secondary particulates [8]. Such pollution has been linked to various chronic diseases of the cardiovascular, respiratory and cardiopulmonary systems, childhood asthma, dementia, and some cancers [1,9,10,11].
Road traffic has been identified as a key driver of urban air quality, particularly in relation to PM [4,12,13,14]. Greater traffic density is directly correlated to increases in PM emissions even with the increase in more efficient petrol and diesel engines [15]. Traffic-related air pollution is one of the most toxic sources in urban environments and has been attributed to nearly half of all mortalities related to air pollution in Europe [16] and is therefore a focus in urban air quality assessments. It is therefore vital to explore methods to reduce PM concentrations in urban environments. Strategic planting of vegetation (notably trees) has been identified as an effective, low-cost method of reducing urban air pollution [8,17,18,19]. Recently urban vegetation has also been identified as a highly spatially resolved low cost sampler to monitor PM pollution [20]. Vegetation is more effective at the capturing of gases, aerosols, and particles than other land surfaces; with plants providing large surface areas and creating turbulent air movements, reducing windspeed, and enhancing PM deposition through sedimentation under gravity, diffusion, impaction, or interception to the vegetation surface [4,6,21]. These intercepted particles are transferred from the local road-side atmosphere and retained on the leaf surface, to be resuspended, washed off by rain, or dropped to the ground with leaf fall [8,18,22]. There are numerous vegetation groups that have the potential to be used in urban areas as a green-infrastructure (GI) for PM interception. GI is primarily grouped as green roofs, green walls, hedges, and trees. The planting and pollution removal potential of a GI category over the other will depend on location, planting and growth potential, and local urban infrastructures. The effectiveness of one group of GI over the other is yet to be fully quantified and understood [23]. Irrespective of GI type recent studies have identified small leaves with complex shapes and surfaces with hair/trichomes, epicuticular wax, and surface-ridges to be associated with enhanced PM deposition and immobilisation [24].
Plants that have been adopted for green roofs include grasses and herbaceous species. These capture less PM than roadside vegetation but provide a practical mitigation strategy [6]. Practicality of planting in urban environments may be as important as their relative PM immobilisation abilities. For example, ivy has the ability to grow along the ground and up structures; often cultivated in urban areas along sound barriers [8,25]. The benefits of climbing plant species and those providing wider positive attributes, such as those that enhance biodiversity through, e.g., nesting and food provision aesthetics and fragrances, should be further investigated.
Furthermore, plants are known to filter other air pollutants including CO2, NOx, and SO2 [6,17,25] with the use of multiple species providing additional ecosystem services such as biodiversity, improved aesthetics, and urban heat island mitigation [4,23,25].
Green infrastructure designed for PM capture in urban environments should be as near as possible to the source of PM pollution, since the amount of dust deposited declines exponentially with increasing distance from the emission source [4]. Herbaceous vegetation at the road side is an under researched component of GI that deserves further consideration as a method of reducing air pollution. For example, low-level barrier hedges have been shown to improve air quality for primary receptors such as street users or those the hedge is protecting (i.e., school playgrounds) [23].
For effective, strategic use of plants as air quality filters, it is understood that a number of factors should be considered to inform its suitable and useful application. Exhaust emissions, a key driver of urban air pollution, have been shown to have adverse effects on plants. They are linked to causing changes in growth, phenology, and leaf characteristics [26]. The extent of these impacts is dependent on the chemical nature of the particles and the plants’ tolerance to these particles [27]. The species chosen for this study have been shown to survive the levels of pollution to which they are currently exposed, all visually healthy and thriving in these areas. Other issues surround a plants’ practicality in strategic planting. The street canyon effect, with high planting density of trees decreasing air quality, is becoming an area of concern [23,28,29].
Regarding the use of vegetation for pollution mitigation during urban planning, there has been an emphasis on empirical and modelling estimates of PM deposition to trees and woody species with little work on herbaceous roadside vegetation [4]. There are two key models that have been developed to estimate pollution and PM removal by tree species from urban environments. These include the urban forest effects model (UFORE) [30] and fine resolution atmospheric multi-pollutant exchange (FRAMES) [31]. The models are used to calculate the PM10 flux (F; in g m−2 s−1) onto the urban canopy. The flux is calculated as the product of deposition velocity (Vd: in m s−1) and the atmospheric pollutant concentration (C; in g m−3) where deposition velocity is often calculated as the inverse sum of the aerodynamic (Ra), quasi-laminar boundary layer (Rb), and canopy (Rc) resistances [32]. Models such as UFORE (now i-Tree) historically used such generic deposition values due to a lack of empirical data for different tree species [2,9]. However, different tree species and wind velocities can account for large variation in deposition velocity [15,33]. Consequently, generic deposition values previously used may produce poor estimates of PM10 flux, especially when a variety of different species is present [9]. Therefore, the lack of empirical data regarding PM deposition to roadside shrub and herbaceous species will need to be overcome to develop an understanding of the effectiveness of such plants and their use in strategic planting to improve urban air quality.
The aims of this work were to analyse the effectiveness of a shrub and an herbaceous plant species in removal of roadside PM and to further understand PM composition and signatures related to location. This was completed through (1) calculation of PM concentration and particle sizes on leaf surfaces at different roadside locations, (2) analysis of particle size captured by the vegetation, (3) analysis of the composition of the captured PM and identification of the elemental signatures based on their locations. Additionally, the species-specific deposition velocity as outlined in Freer-Smith et al. [15] was estimated for each of the study species; Hedera helix (ivy) and Rubus fruticosu (bramble). Deposition velocity is a parameter in models such as i-Tree [34] used to predict pollution removal by urban plants. The deposition velocities estimated here may allow for future modelling the PM pollution removal potential of these plants.
2. Materials and Methods
2.1. Species and Sample Sites
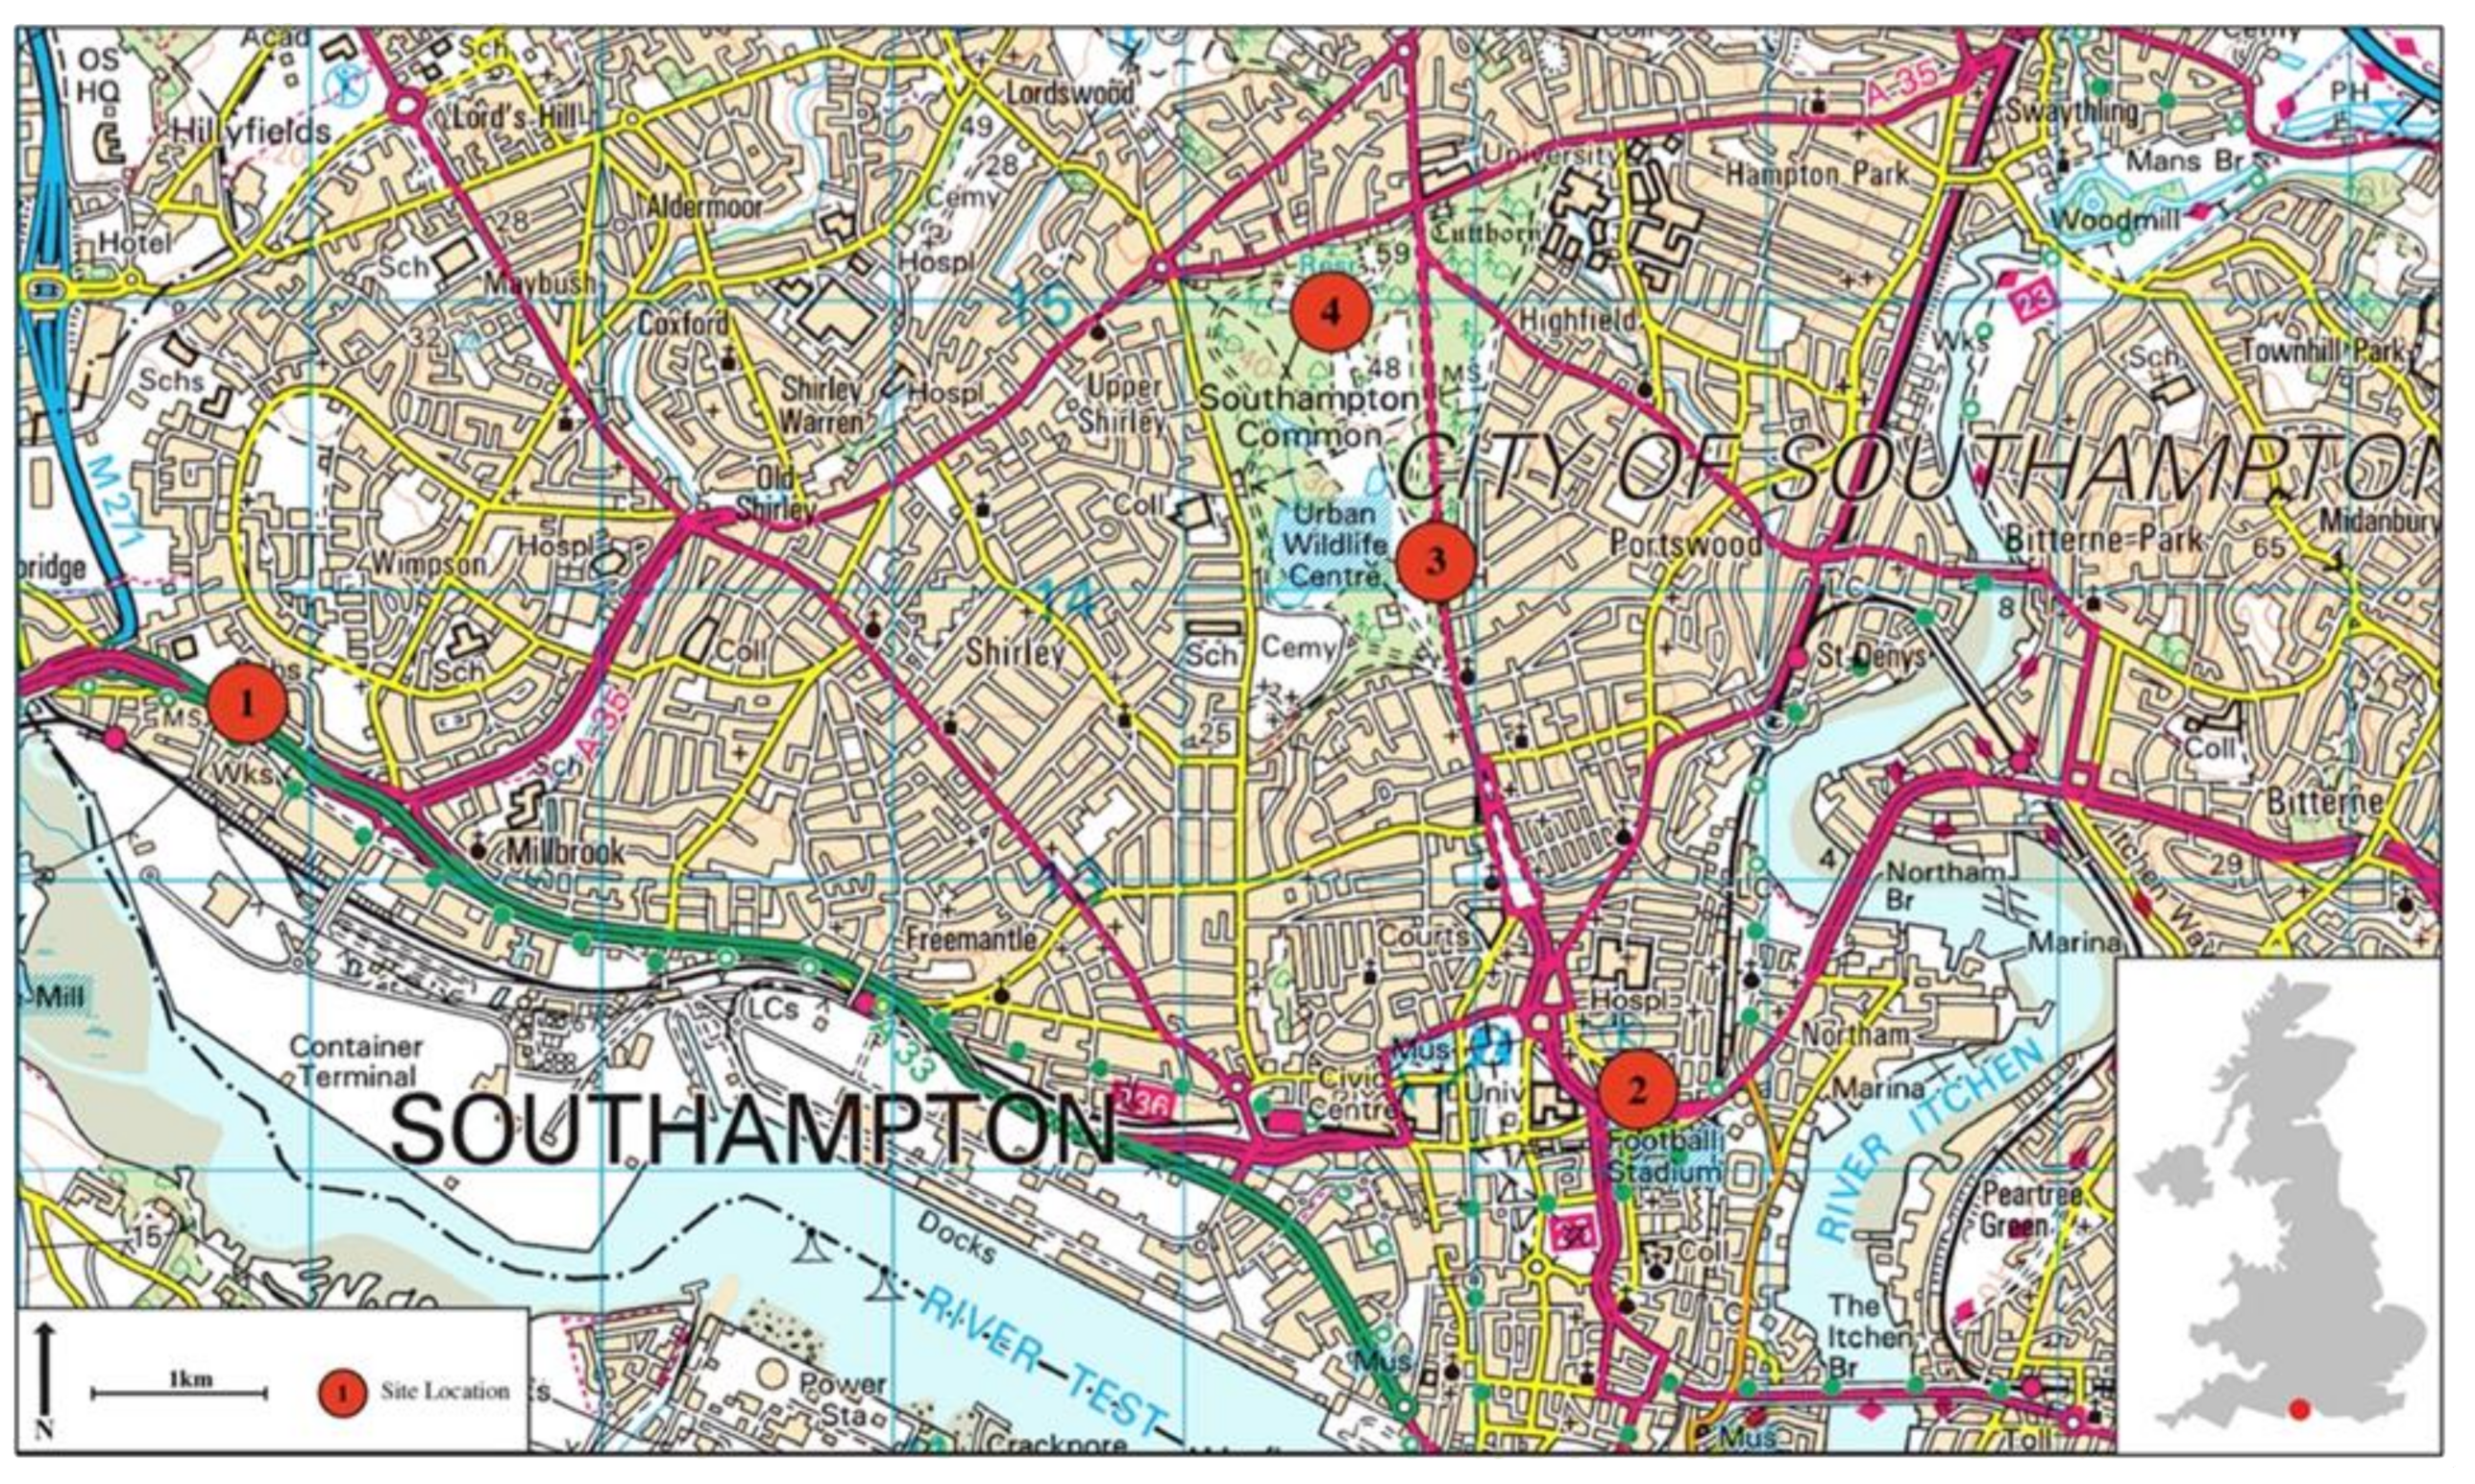
Two different but common species with contrasting leaf morphologies were chosen: Hedera helix (ivy) and Rubus fruticosu (bramble). These two species are ubiquitous throughout the UK, which may allow for repeatability testing and comparison between other potential sites. Additionally, neither is protected or endangered in the UK and both have been shown to have a reasonable tolerance to traffic related pollution. Samples were taken from four locations across Southampton, UK (Figure 1).
Southampton contains two PM air quality monitoring stations. A roadside monitor is located on the A33 Redbridge Road (Latitude: 43°77′98″, Longitude: 11°35′94″), UK-AIR ID: UKA00613 and an urban background monitor is located on Brinton’s Road/Northam Road (Latitude: 44°25′65″, Longitude: 11°22′55″), UK-AIR ID: UKA00235. PM10 is monitored by AURN (automatic urban and rural network) monitoring stations with an automatic, filter dynamics measurement system (FDMS) 8500. AURN is the UK’s largest automatic monitoring network and is the main network used for compliance reporting against the ambient air quality directives [35]. Therefore, the sampling Sites 1 and 2, were selected for the calculation of deposition velocities onto leaf surfaces and the ambient (PM10) recorded as these sites was also used for this purpose.
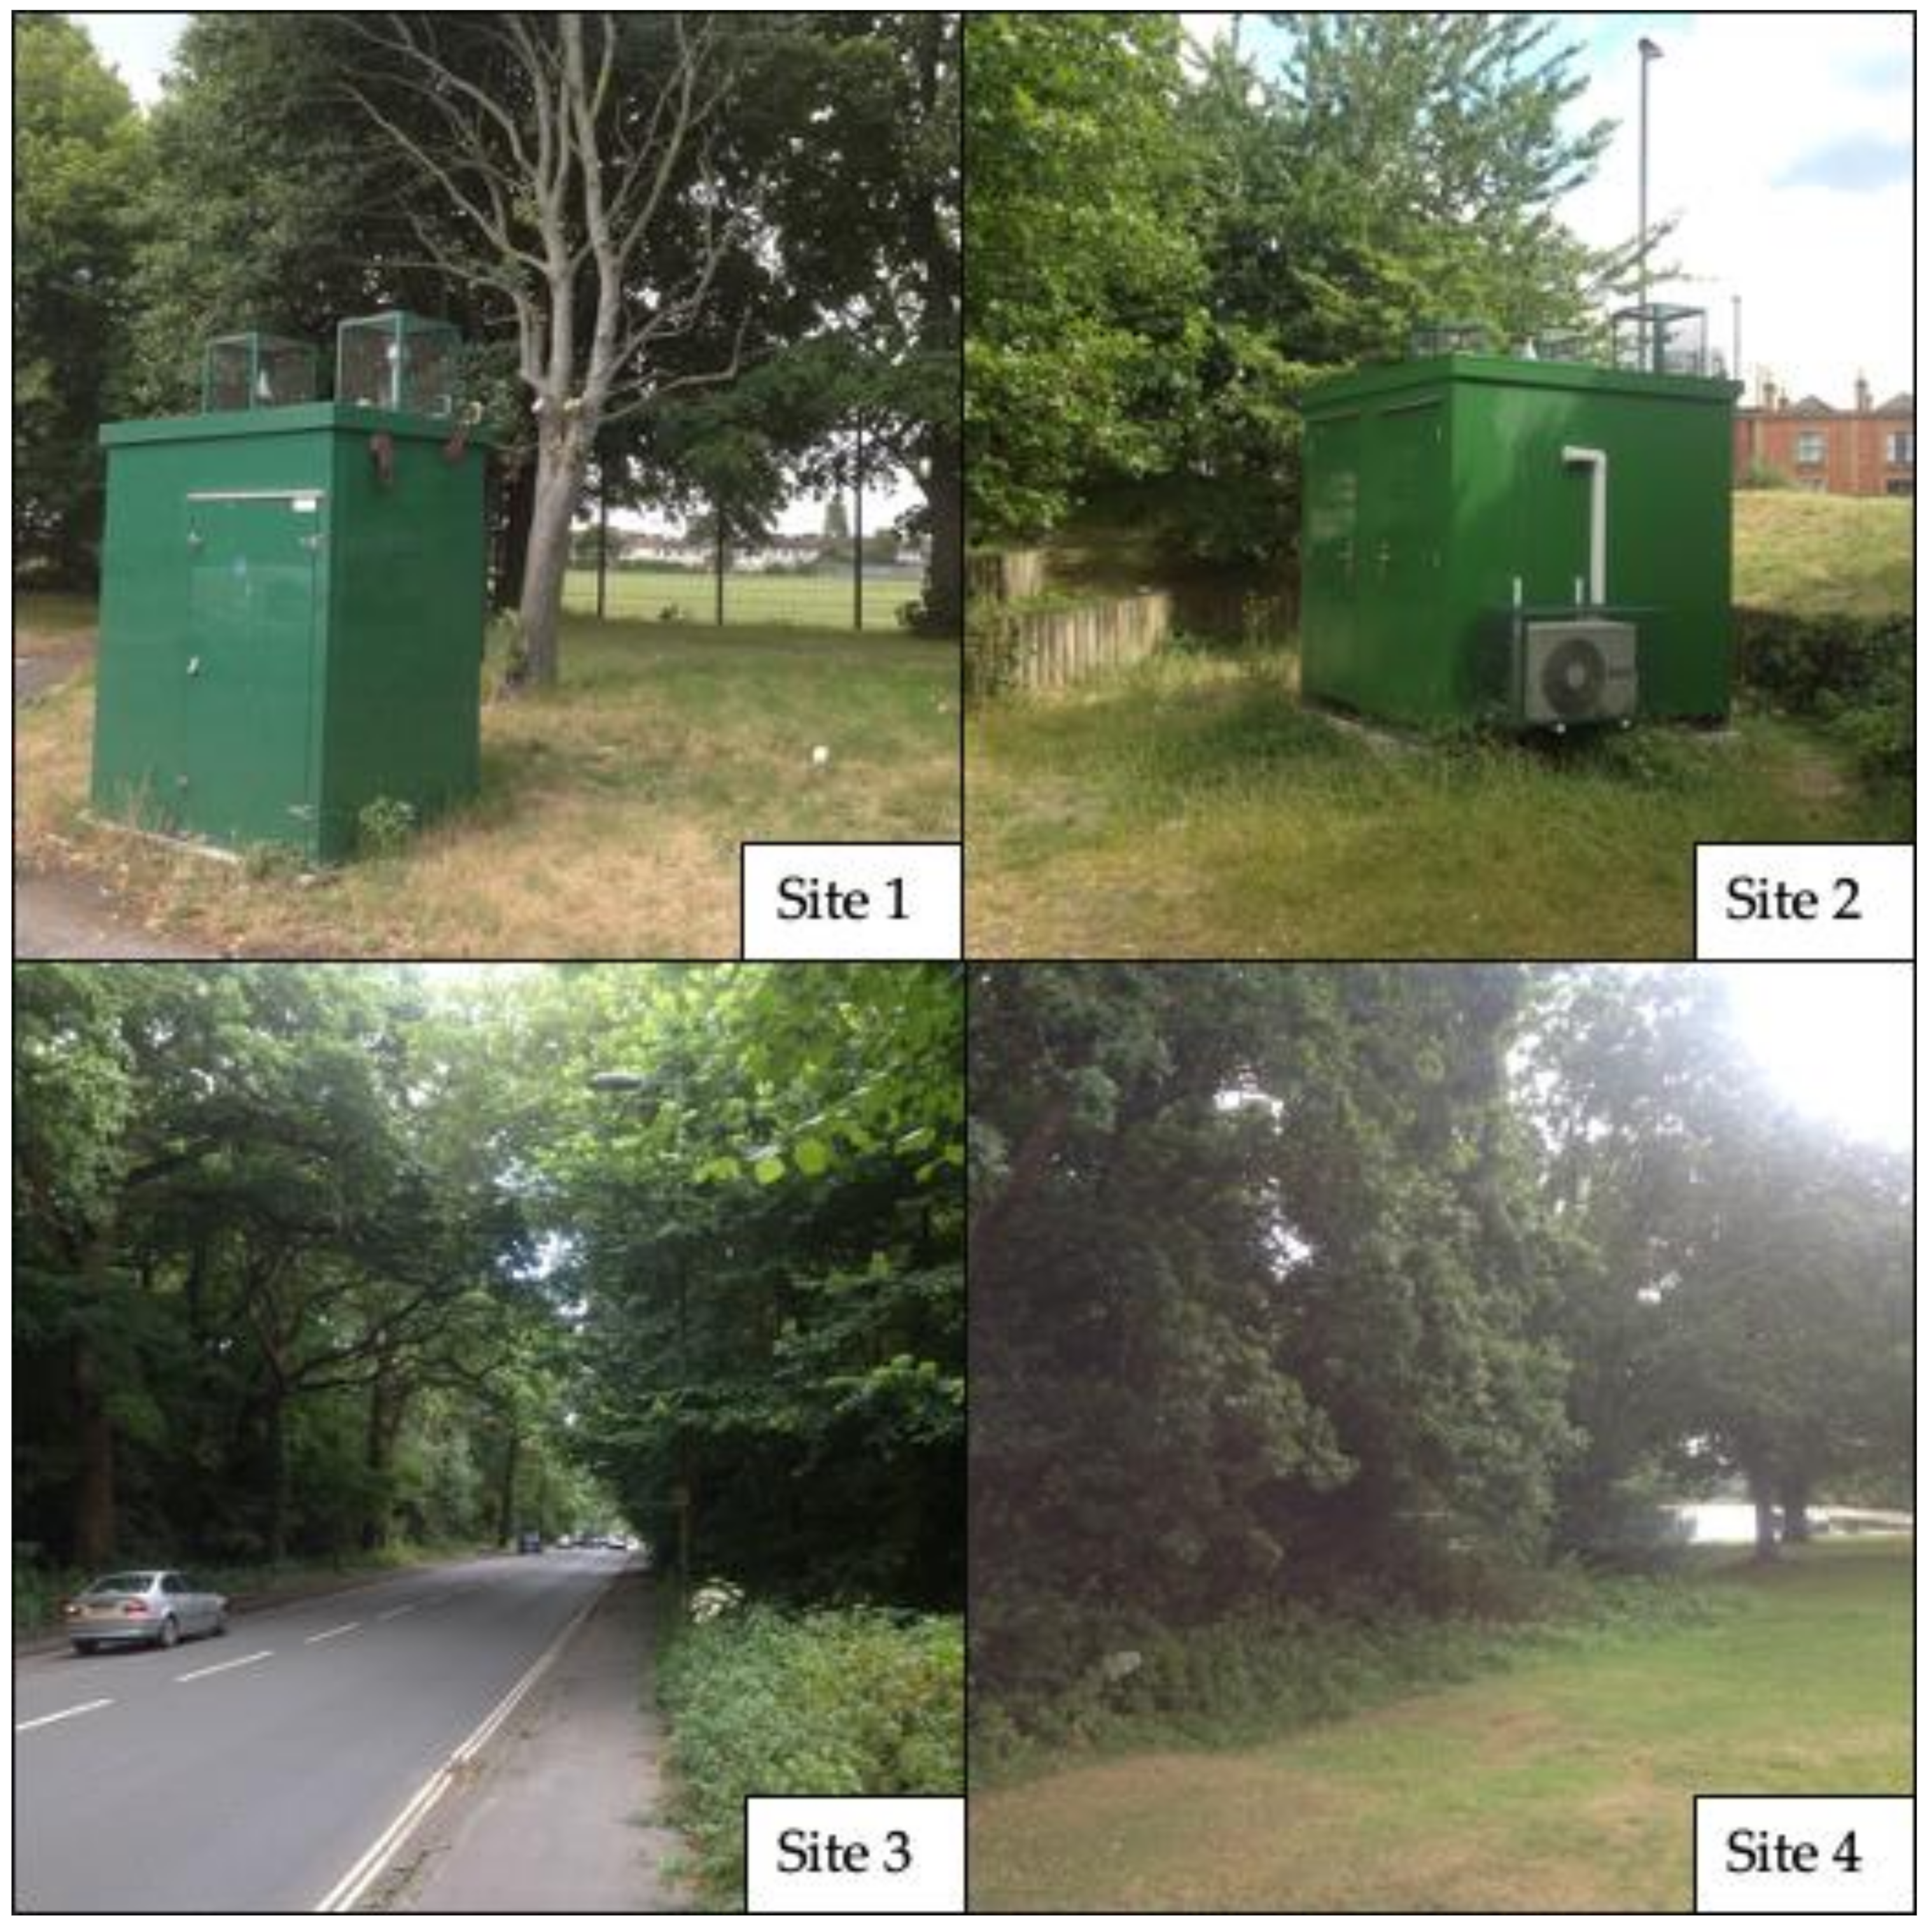
Site 1 is a grassed area with some mixed deciduous trees creating a high porosity canopy. A large 3 m high fence that has some vegetation growing across it holds the northern boundary. Ivy is found growing up the tree trunks and across the fence, whilst bramble is found growing at the base of the fence. The air quality monitoring station in Site 1 is positioned 3 m from the roadside with an inlet height of 3.5 m from the ground [36]. Sampled vegetation was located approximately 18 m from the road edge. The road has a high traffic density with an average motor vehicle count of 73,450 p/a [37].
Site 2 consists a mixture of concrete, gravel, and grassed areas with mixed deciduous trees and herbaceous plants. Ivy and bramble grow along a low wall around the site as well as under trees and shrubs, primarily facing Brinton’s Road. Northam Road has a moderate traffic density with an average motor vehicle count of 23,631 p/a [37]. The air quality monitoring station in Site 2 is positioned 22 m from Northam Road and 12 m from Brinton’s Road with a sampling height of 3 m.
Site 3, located on The Avenue (Figure 1) was identified as an area with a considerable traffic count and dense vegetation with characteristics likely to provide a classic street canyon effect, potentially enhancing pollution levels. Additionally, The Avenue’s annual traffic counts are similar to those recorded at Site 2; Brinton’s Road, allowing for comparison of PM deposition and traffic counts. Vegetation consists of mixed deciduous and shrub species with heights > 4 m along both eastern and western boundaries and is approximately 2 m from the kerb edge. Ivy is located growing across the ground and up tree trunks with bramble found growing at the base of trees and in open ground. The road has a moderate traffic density with an average motor vehicle count of 24,130 p/a [37].
Site 4 located in the centre of Southampton Common (Figure 1) was identified as a central, no-traffic area that would provide the background PM concentrations for the city. It has no access or through roads for public vehicles. The common consists of open, grassed areas, and mixed deciduous trees with a dense canopy and thick shrubs (Figure 2). Ivy grows across the ground and up tree trunks with bramble found growing at the base of trees and in open ground.
2.2. Sampling Procedures
Leaf samples were taken from each of the four sites on the 25 June 2017 after a period of 15 days no significant rainfall, at <3 mm/day [39], or high winds at <38 km/h since the 9 June 2017 [40,41]. June was considered an appropriate month to collect leaf samples with plants reaching a suitable level of growth. Fifteen ivy and fifteen bramble leaves were collected from each site, placed in polythene bags for transportation and cold stored at 5 °C to prevent leaf degradation. A range of leaf sizes was collected at each site with sampling focusing on leaves with no obvious pest or disease damage and those facing the road. Leaves were sampled from a range of heights above ground level to allow for assessment of the species as a whole. Three were taken from high positions (>1 m), six from medium positions (0.5–1 m), and six from low positions (<0.5 m) at each site.
2.3. Leaf Washing and PM Mass
Leaf washing to remove PM from leaf surface was carried out following current standard protocols [8,12,42]. Each leaf sample was placed in a small container with 150 mL of distilled water (Milli-QTM) and hand shaken for one minute to simulate the effect of PM removal through rainfall. Additionally, a no-hair-loss brush was used to further aid total removal of PM on the leaf surface. A further 50 mL of distilled water was used to remove any PM from the sample bag and other residual PM wash from equipment. The distilled water containing the PM wash was placed through a 100 μm sieve to remove larger particles. PM wash was filtered through either Whatman type 42, 47 mm diameter, quantitative cotton filters (2.5 μm pores) or Whatman cyclopore track etched membrane 47 mm diameter 2.5 μm filters. A finer filter for particles < 2.5 μm was not used for the remaining wash as this study focussed on the coarse fraction. Filtration was carried out using a glass filtering system (Millipore and Aldrich) connected to a high vacuum, Fisher Scientific pump. Filters were dried at 40 °C for 40 min and pre-weighed (W1, g) before filtration. Filters were re-dried at 40 °C for 60 min post filtering. Filters were then reweighed (W2, g) to allow for calculation of sample PM mass. Sample weights were measured in triplicate. Water-soluble PM were not considered, and the waste PM wash was discarded.
To allow for comparison between sites and species PM loads were calculated with respect to leaf area. The surface area of each sampled leaf was measured through the application of ImageJ open source software [43]. Leaf samples were recorded digitally as JPEG’s alongside a cm reference scale. Measurement units within ImageJ were set against the reference scale, the images converted to 8-bit, binary image (black and white) and the area of each individual leaf surface calculated in cm2. The total leaf area (A) was estimated through multiplying the value by two (accounting for adaxial and abaxial surfaces). To calculate the PM mass retained on leaves per unit area was calculated as: g cm−2 = (W2 – W1)/A.
2.4. SEM-EDX Analysis
Particle size estimation and elemental analysis of insoluble PM were achieved through scanning electron microscopy (SEM) with energy-dispersive X-ray spectroscopy (EDX) analysis of filtered samples at the University of Portsmouth. The method allows for analysis of the most persistent particles—those that have the potential to accumulate on surfaces and human epithelial tissues [44]. Other studies have applied SEM-EDX methods to analyse PM directly on the leaf surface [12,20,25,45,46]. This has the beneficial ability to compare the PM concentrations on the adaxial and abaxial surfaces, as well as analyse the soluble PM fraction. However, issues with analysing particulates directly on the leaf surface primarily occur during EDX analysis of elemental composition, with difficulties of subtracting the composition of the leaf from PM [47]. For example, a direct EDX analysis of a leaf surface will record high concentrations of carbon due to composition of organic matter [25].
Three filters, containing particles with a physical diameter of 2.5–100 μm washed from each plant species and each sample site, were selected. A 25 mm diameter circular sub-sample was excised with a circular press. Samples were placed on aluminium sample stubs with carbon adhesive pads, before carbon coating. Copper tape was also used to connect the surface of the sample to the aluminium stub to further reduce the likelihood of samples charging. SEM backscatter electron and EDX mapping were used to analyse the largest reasonable area of each sample. The mapping route was set using Aztec 3.3 SP1 analytical software (copyright 2010–2016, Oxford Instruments Nanotechnology Tools Limited) with the area selected with the polygon function, this allows dismissal of charging or likely charging areas such as the filter edge and to mitigate the effects of a non-flat filter sample. Mapping took place at 150× magnification with an accelerating voltage of 10–15 kV and 350–500 pA on an Oxford Instruments ZEISS EVO MA10 with a Lanthanum Hexaboride (LaB6) electron source and x-max 80 mm STV energy dispersive electron detector. A semi-quantitative estimation of elemental information was displayed in weight percentage (wt%, oxygen by stoichiometry). Elements for analysis included Fe, Zn Al, Si, Ti, Sb, Cr, Mo, V, Ni, Bi, W, P, Pb, Co, Tl, K, P S, Se, Mn, Cl, Ar, Br, Mg, and Ca as elements identified for urban particulates in the literature [20,48,49,50,51].
The initial resolution of the SEM-EDX images was too low for meaningful particle size analysis (PSA), consequently a 1 cm2 subset was rescanned under higher resolution, (0.7652 pixels µm−1), adequate for the PSA procedure, described below.
2.5. Particle Size Analysis
The SEM micrograph images allowed for automatic particle number and area counting with open source Image J software [43]. To analyse the particles the programme required the image to be in an 8-bit, binary format (black and white, Figure 3a). To aid particle identification the image contrast was increased (Figure 3b). The threshold was set manually to separate the particles from the background. This was accomplished through selecting an identifiable area on the image (i.e., a corner) on both the binary image and original image. This allows for identification of individual particles within the image, confirming separation of the background and particles (Figure 3c). Issues were identified with contrast differences across a particle due to the topography of the particle and with lighter elements producing a weaker signal. Software settings included the creation of outlines to allow for inspection of particles analysed (Figure 3d), exclusion of particle analysis on edges and inclusions of holes to mitigate the effects of varying contrast that impacted on the creation of the binary images. A known scale was set and the "analyse particles" function was used to obtain information regarding number of particles and particle sizes (area in µm2). Visual inspection of the image suggested that particle shapes would vary and that is was unlikely that they would be uniformly circular; therefore the circularity index (value of 1 indicates a perfect circle) was set to zero and counted the variety of particle shapes from the image.
Particle diameters were estimated from the physical area of the measured particle. This method excludes effects of roughness and mass of particles to allow for bulk analysis of particle size distribution. Ottelé et al. [25] used a similar method to the one outlined in this study. Other published methods include the separation of fractions through the measurement of physical diameters, either through the bulk method of filtration [5,8] or through individual particle measurement of the two main Feret diameters [4,42]. However, Conner et al. [52] uses measurements of physical diameter to calculate aerodynamic diameter combined with generic particle values. A shape factor was determined according to particle orientation and particle density from analysing the composition of a particle and assigning a calculated density of the elements in its oxide form from published literature. This is thought the most accurate method to calculate values of aerodynamic diameters for particles using SEM-EDX analysis but lacks the ability of bulk PSA. Due to the variation in methods used to measure particle diameters, comparisons of studies require considerable caution.
The method used provides a basic estimation of the physical diameter and was deemed appropriate for this study due to a lack of individual particle mass and shape data available for each particle. Only particles with a physical diameter <100 µm were counted as any particles >100 µm were removed during sample preparation. Particles greater than this would likely be agglomerates or pieces of sampling equipment and therefore not representative of the sample. The proportion of counted particles with a physical diameter of 2.5–10 µm were calculated from each sample as this is the fraction that is most likely to cause adverse health effects. Although particles with a physical diameter <2.5 µm were also removed during sampling, PSA identified a high proportion of particles with a physical diameter below this value. The fraction of particles measured with a physical diameter <2.5 µm are likely due to the coarse measurement technique involved with this PSA method. However, these particles still represent a considerable proportion of the particle count and so have been reported as a separate fraction.
2.6. Calculation of Deposition Velocities
The average species-specific, dry deposition velocity (Vgi; in m s−1) where PM is deposited on a leaf surface with a specific particle size of i (PM10), was calculated from the flux (F; in g m−2 s−1) and the atmospheric concentration (C; in g m−3) as outlined in Freer-Smith et al. [15].
Vgi = F/C
Here the flux of PM is calculated from the mean concentration of PM <100 µm, washed from leaf surfaces for each species and site after a known period of no significant rainfall. PSA identified that these PM samples are comprised >90% of particles < 10 µm physical diameter and so have been used a proxy for PM10 loads. The concentration of particles (g m−2) was divided by the period of time (seconds). Mean PM10 concentrations (reference equivalent), recorded as hourly means, and were downloaded from the FDMS air quality monitoring stations located at Redbridge Road and at Brinton’s Road covering the 15 days sampling period Calculated values are displayed with wind speed data as greater wind speeds have been shown to increase deposition velocity values [15]. Wind speed data was acquired from Weather Underground (2017).
2.7. Principal Component Analysis
The elemental composition of the PM obtained for each site and plant species from EDX analysis was analysed through principal component analysis (PCA), using Minitab® Statistical Software 17.3.1, State College, Pennsylvania USA: Minitab Inc. (www.minitab.com). This allowed for interpretation and identification of site differences (as wt%) and relationships between elements at different site locations. The EDX elemental dataset variables considered were those with a wt% > 0.1, including Mg, Al, Si, P, S, Cl, K, Ca, Ti V, Mn, Fe, and Zn.
3. Results
3.1. Particle Size Analysis
Particles were counted and their physical diameters measured. Despite the wash and filter methodology, many particles less than 2.5 µm were observed. The minimum particle sizes identified were calculated to have a physical diameter of 1.63 µm. However, the method of particle size analysis was constrained by the image resolution, with this value representing one pixel within the micrograph. Measured particles >100 µm were considered irrelevant to this study and any identified with the particle size analysis would be agglomerates due to the sample preparation method. Particle sizes were separated into two categories, particles with a physical diameter between 2.5 and 10 µm (coarse fraction) and those with a physical diameter < 2.5 µm (fine fraction). Importantly, the finer fraction was shown to be dominant particle size, representing 53.9–72.9% of particles across all sites and species (Table 1), suggesting that standard washing procedures, such as those used in this study, do not necessarily exclude the finer fractions completely. However, the majority of particle sizes did fall below 10 µm in physical diameter, representing approximately 90% of each sample and are used as a proxy for PM10 for further assessment within this study.
3.2. PM Mass
Site and Specie Impact on PM Mass
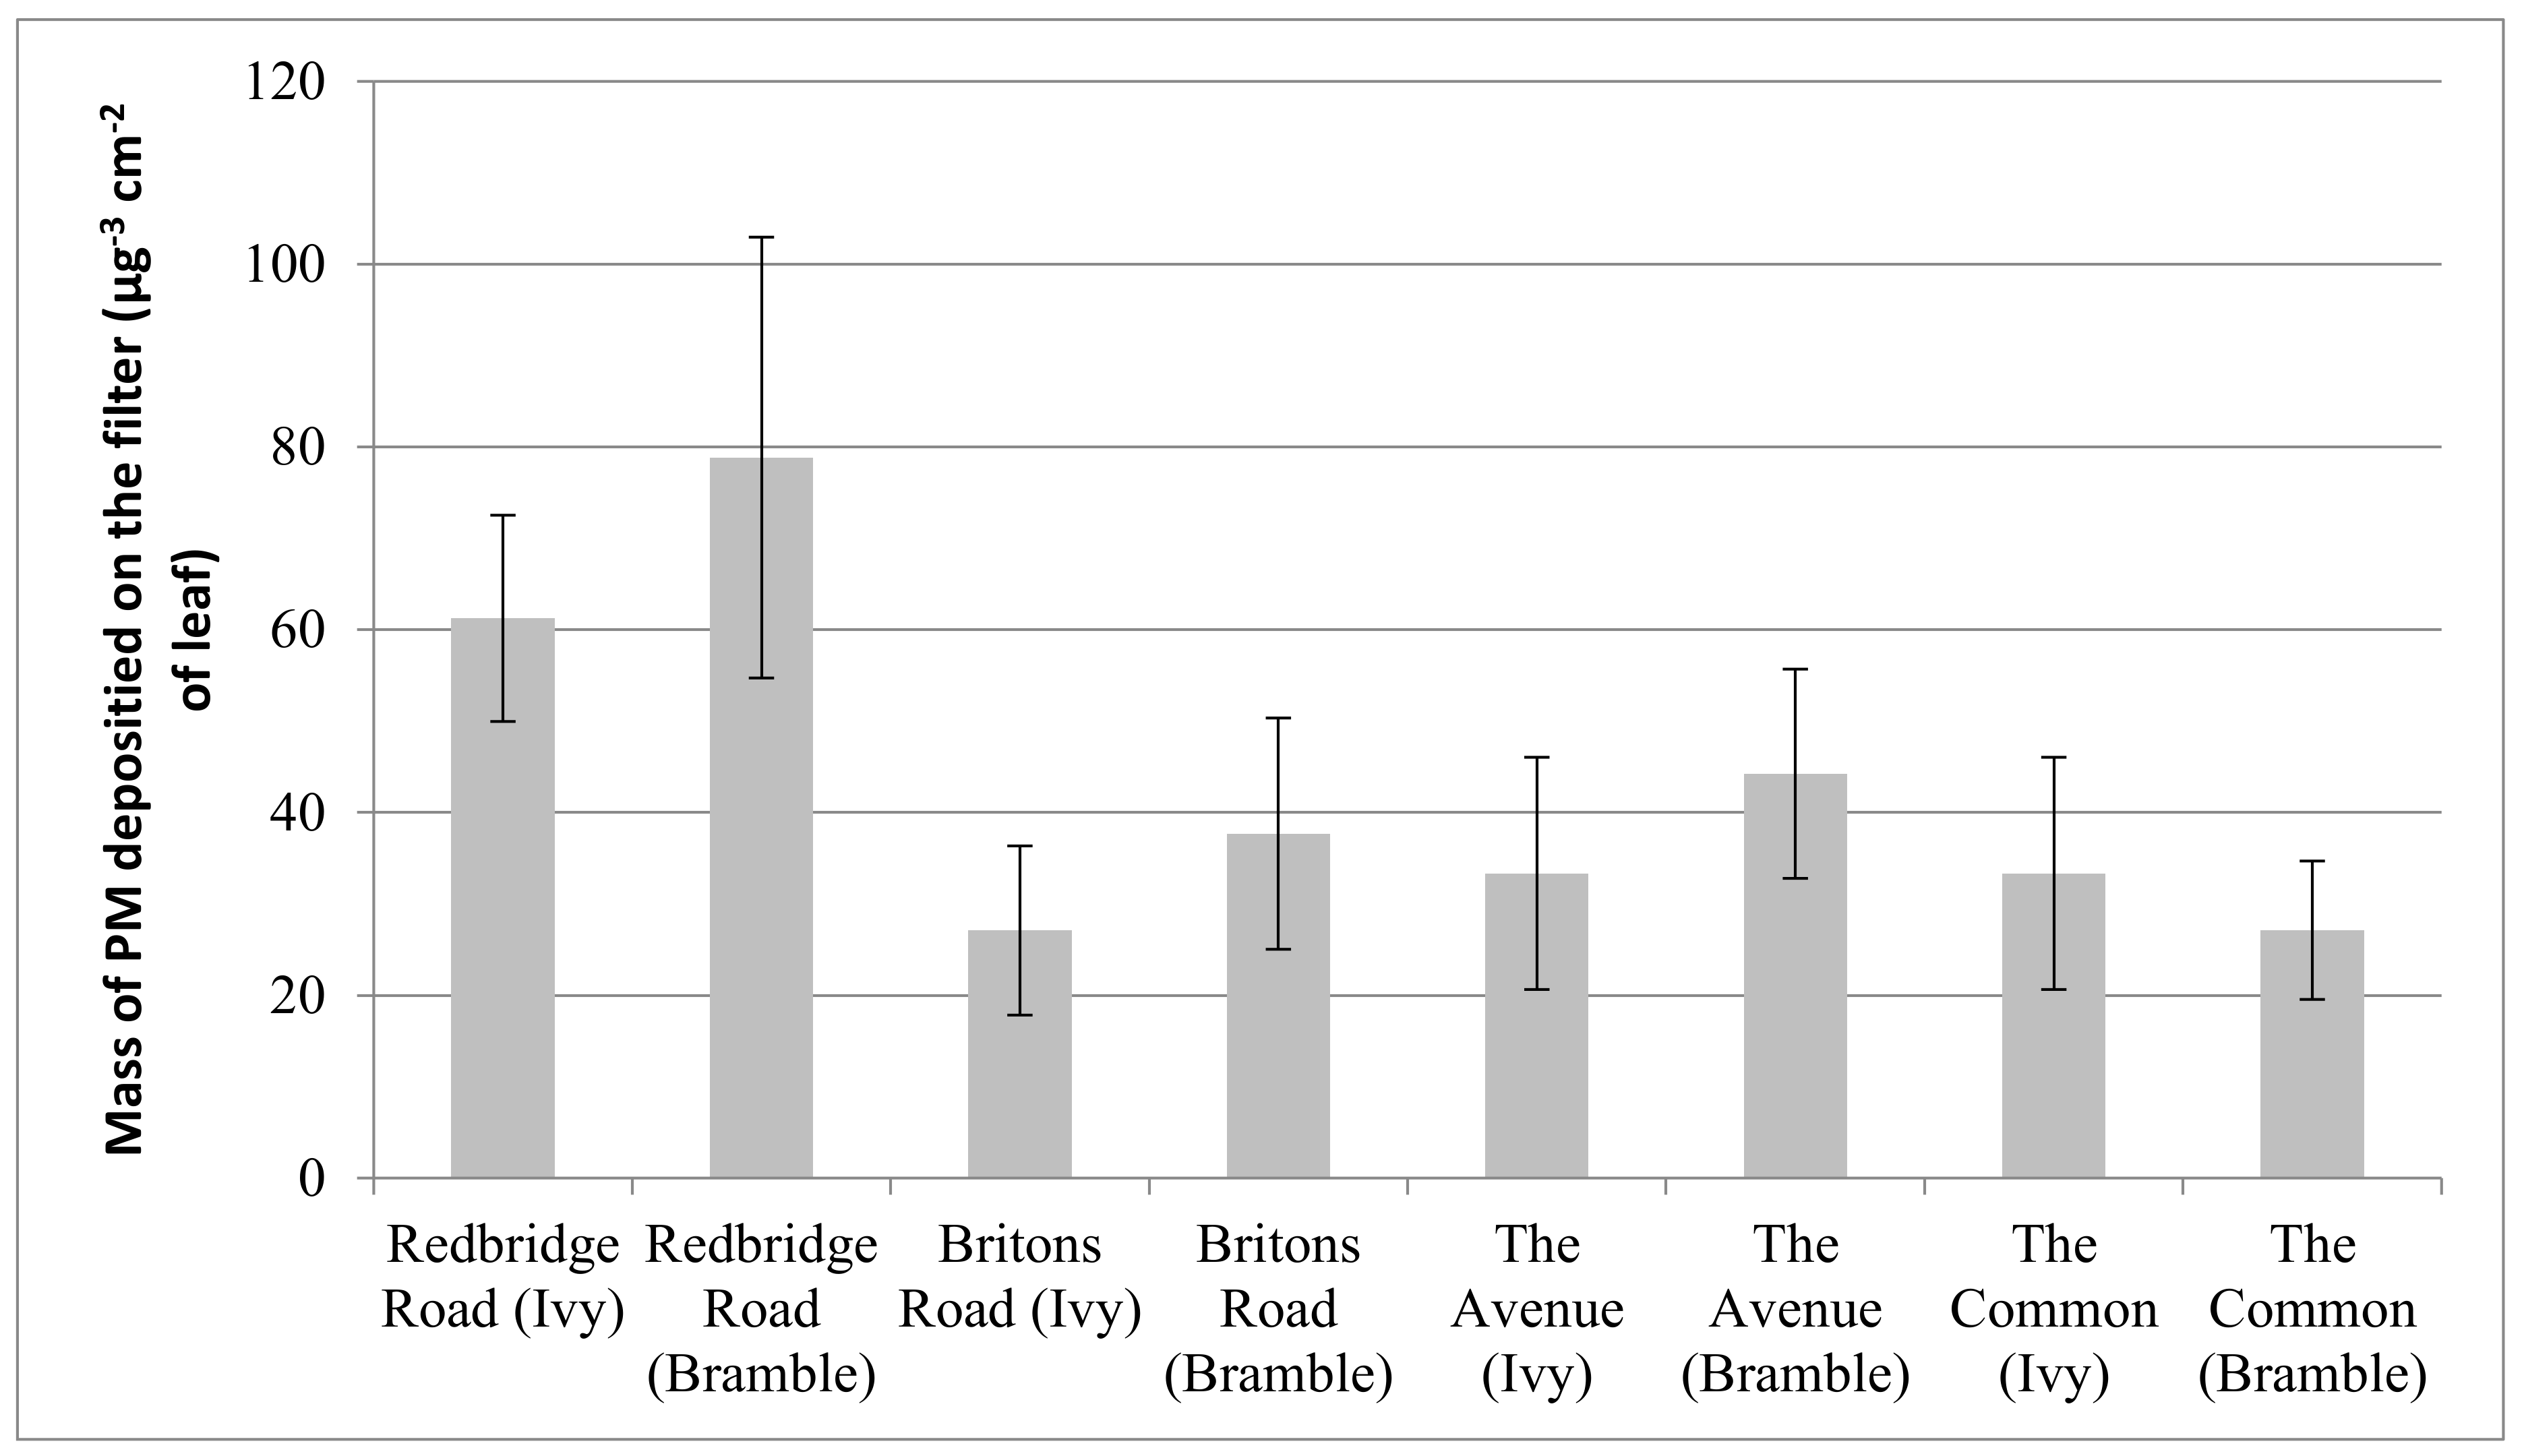
The greatest PM mass loads on leaf surfaces were recorded at Redbridge Road with mean values of 61.3 ± 22.6 µg cm2 and 78.8 ± 48.2 µg cm2 for ivy and bramble respectively. This site is identified as the location with the highest mean traffic counts of 73,450 p/a [37] and the PM mass deposited to leaves here is approximately double that of the other roadside sites (Figure 4). PM loads recorded at Brinton’s Road and The Avenue show relatively similar mean PM loads of 27.1 ± 18.5 µg cm2 (Ivy), 37.7 ± 25.4 µg cm2 (Bramble), and 33.3 ± 25.4 µg cm2 (Ivy), 44.2 ± 22.9 µg cm2 (Bramble), respectively. These sites have been identified as having relatively similar mean traffic counts of 23,631 p/a and 24,130 p/a [37], respectively. The Common was used as an ambient background site with no traffic. However, this site recorded similar mean PM loads to those of Brinton’s Road and The Avenue with values of 33.3 ± 25.4 µg cm2 (Ivy) and 27.0 ± 15.1 µg cm2 (Bramble).
Bramble leaves gained greater mean PM loads than Ivy from roadside locations. Redbridge Road records a difference of 17.6 µg/cm2 with Brinton’s Road and The Avenue recording differences of 10.6 µg/cm2 and 10.9 µg/cm2, respectively. However, The Common shows greater mean PM loads on Ivy leaves but also records the smallest difference between species at 6.2 µg/cm2. Standard error is particularly high; however, range of standard error remains relatively similar across all sample sites and species.
3.3. EDX Analysis
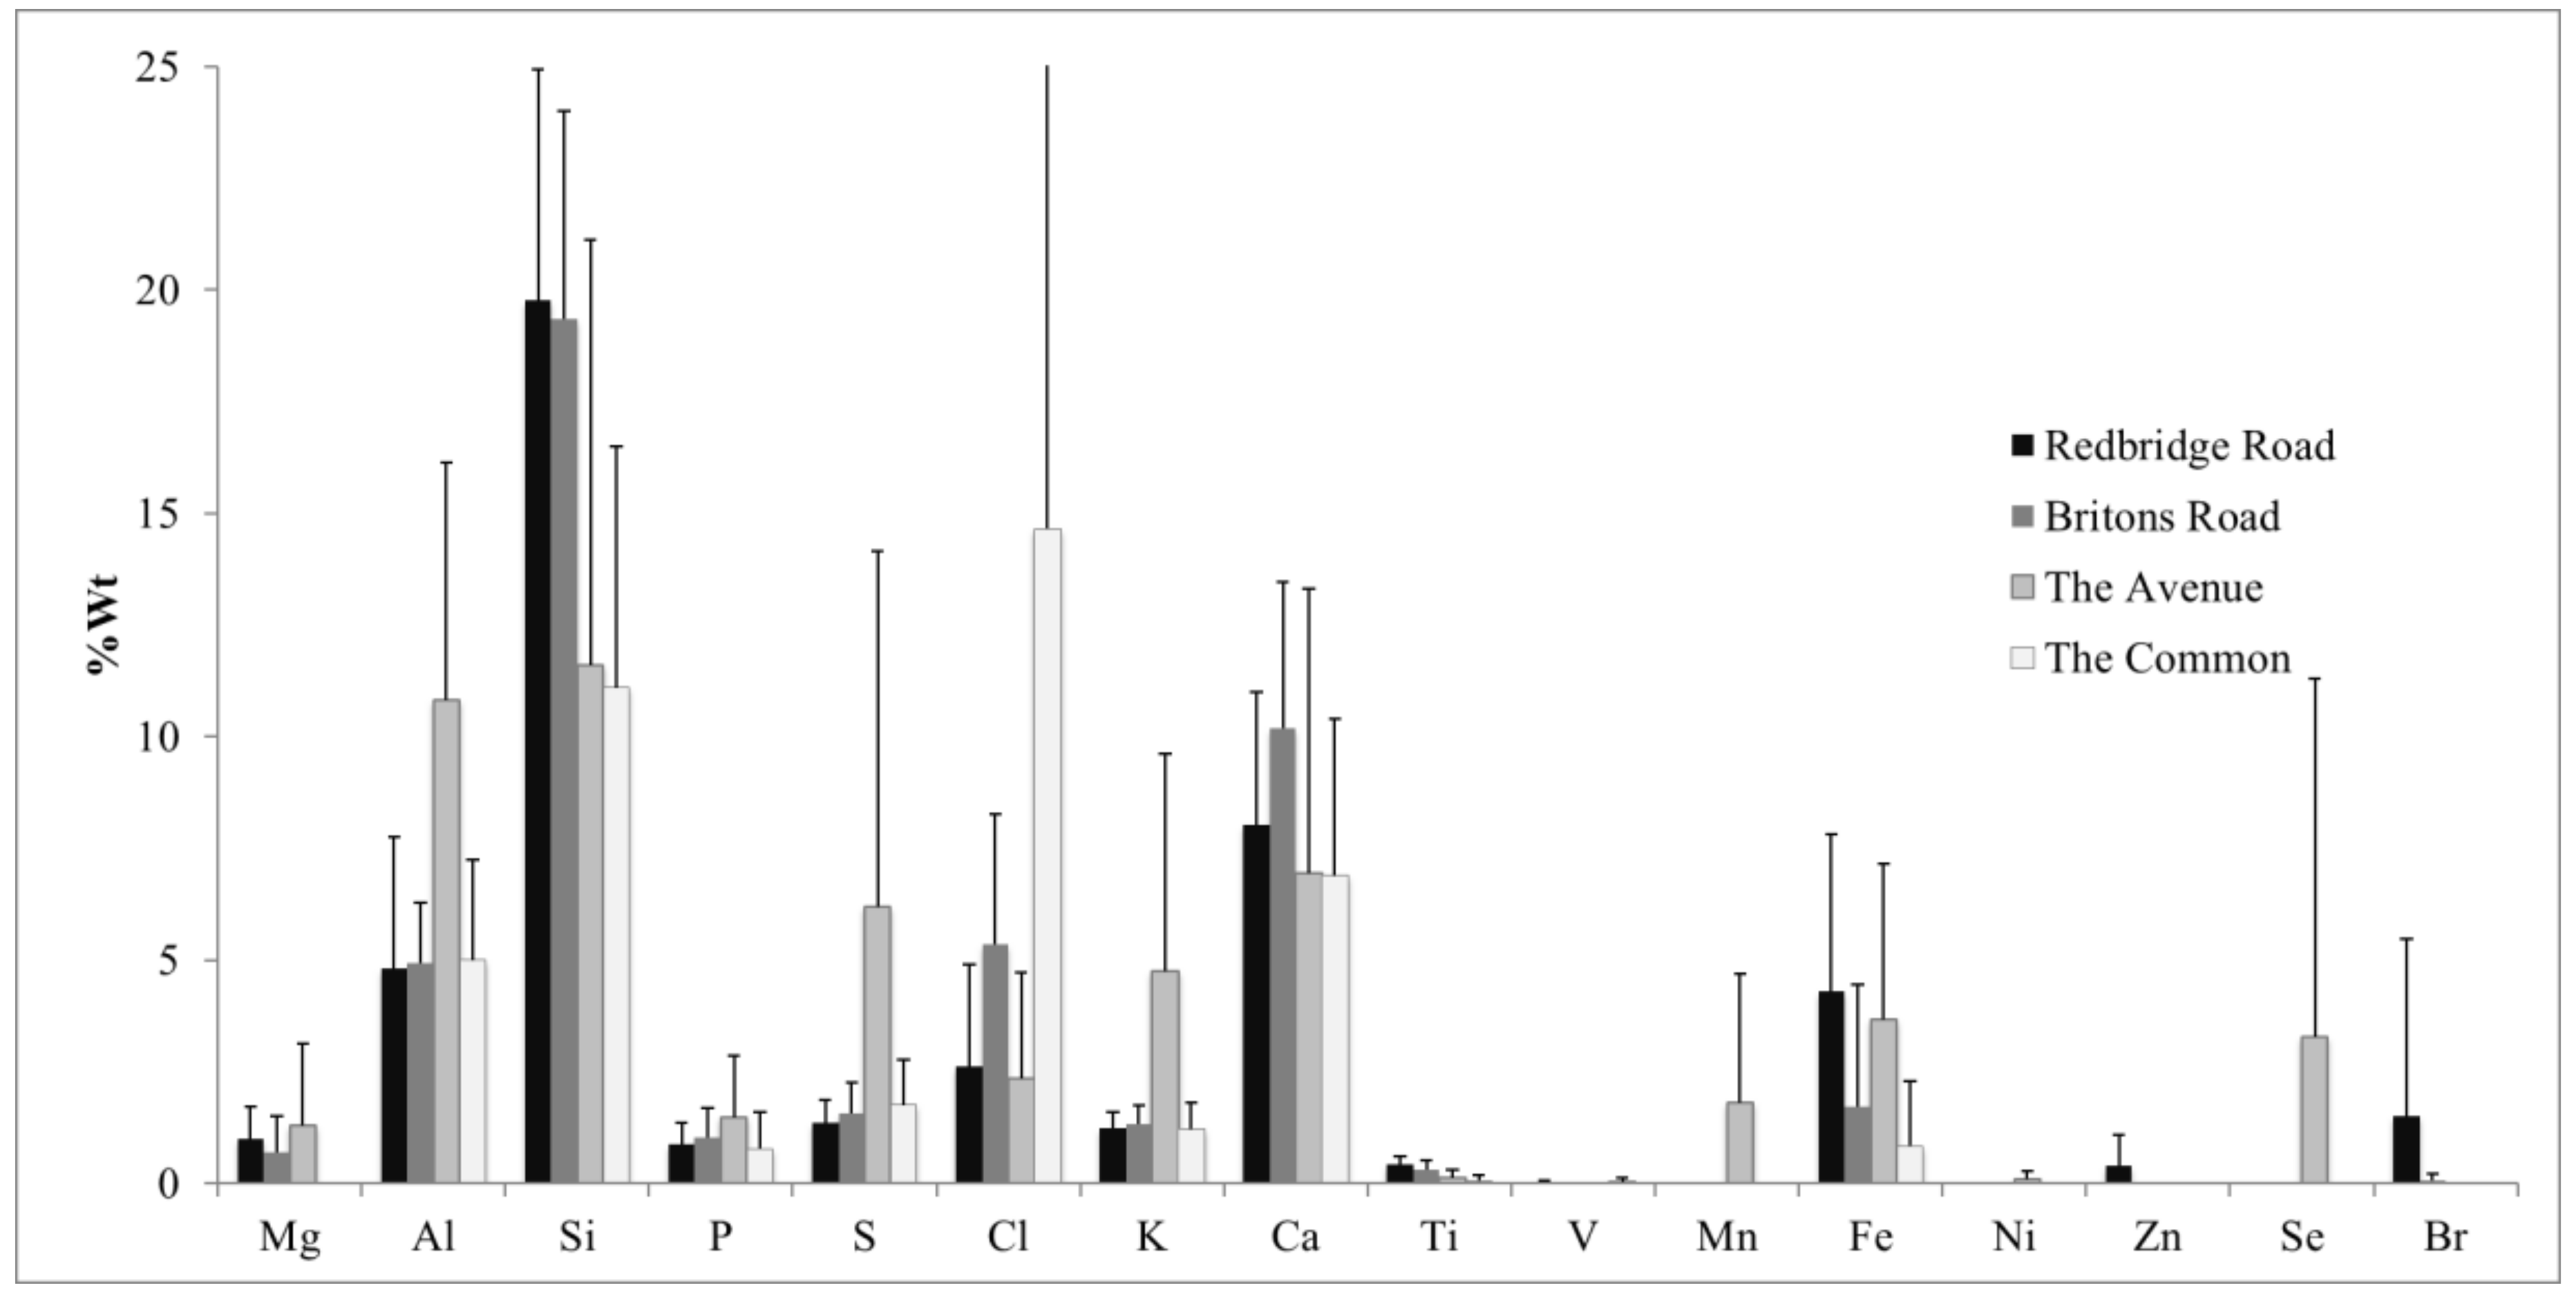
EDX analysis was used to calculate semi-quantitative elemental compositions of the PM captured on the field of view. Many elements analysed (see above) were not sufficiently abundant to contribute meaningfully to the aggregated total. Therefore, selected most abundant elements were calculated in wt% and represent 48.3% ± 6% of the total measured (Site 1 at 46.3%, Site 2 at 46.5%, Site 3 at 54.2%, and Site 4 at 42.3%). Mean elemental concentrations were calculated for each site (Figure 5). Elements recorded with the highest concentrations include Al, Si, Cl, Ca, and Fe. Redbridge Road and The Avenue have highest concentrations of Fe, in contrast with considerably lower concentrations identified from The Common. However, concentrations of Cl are dramatically higher from The Common than all other sites.
Other elements identified across all sites include P, S, and K with the highest concentrations of these found at The Avenue. Mg was recorded at all sites except The Common and therefore is only present at the roadside locations.
3.4. Principal Component Analysis
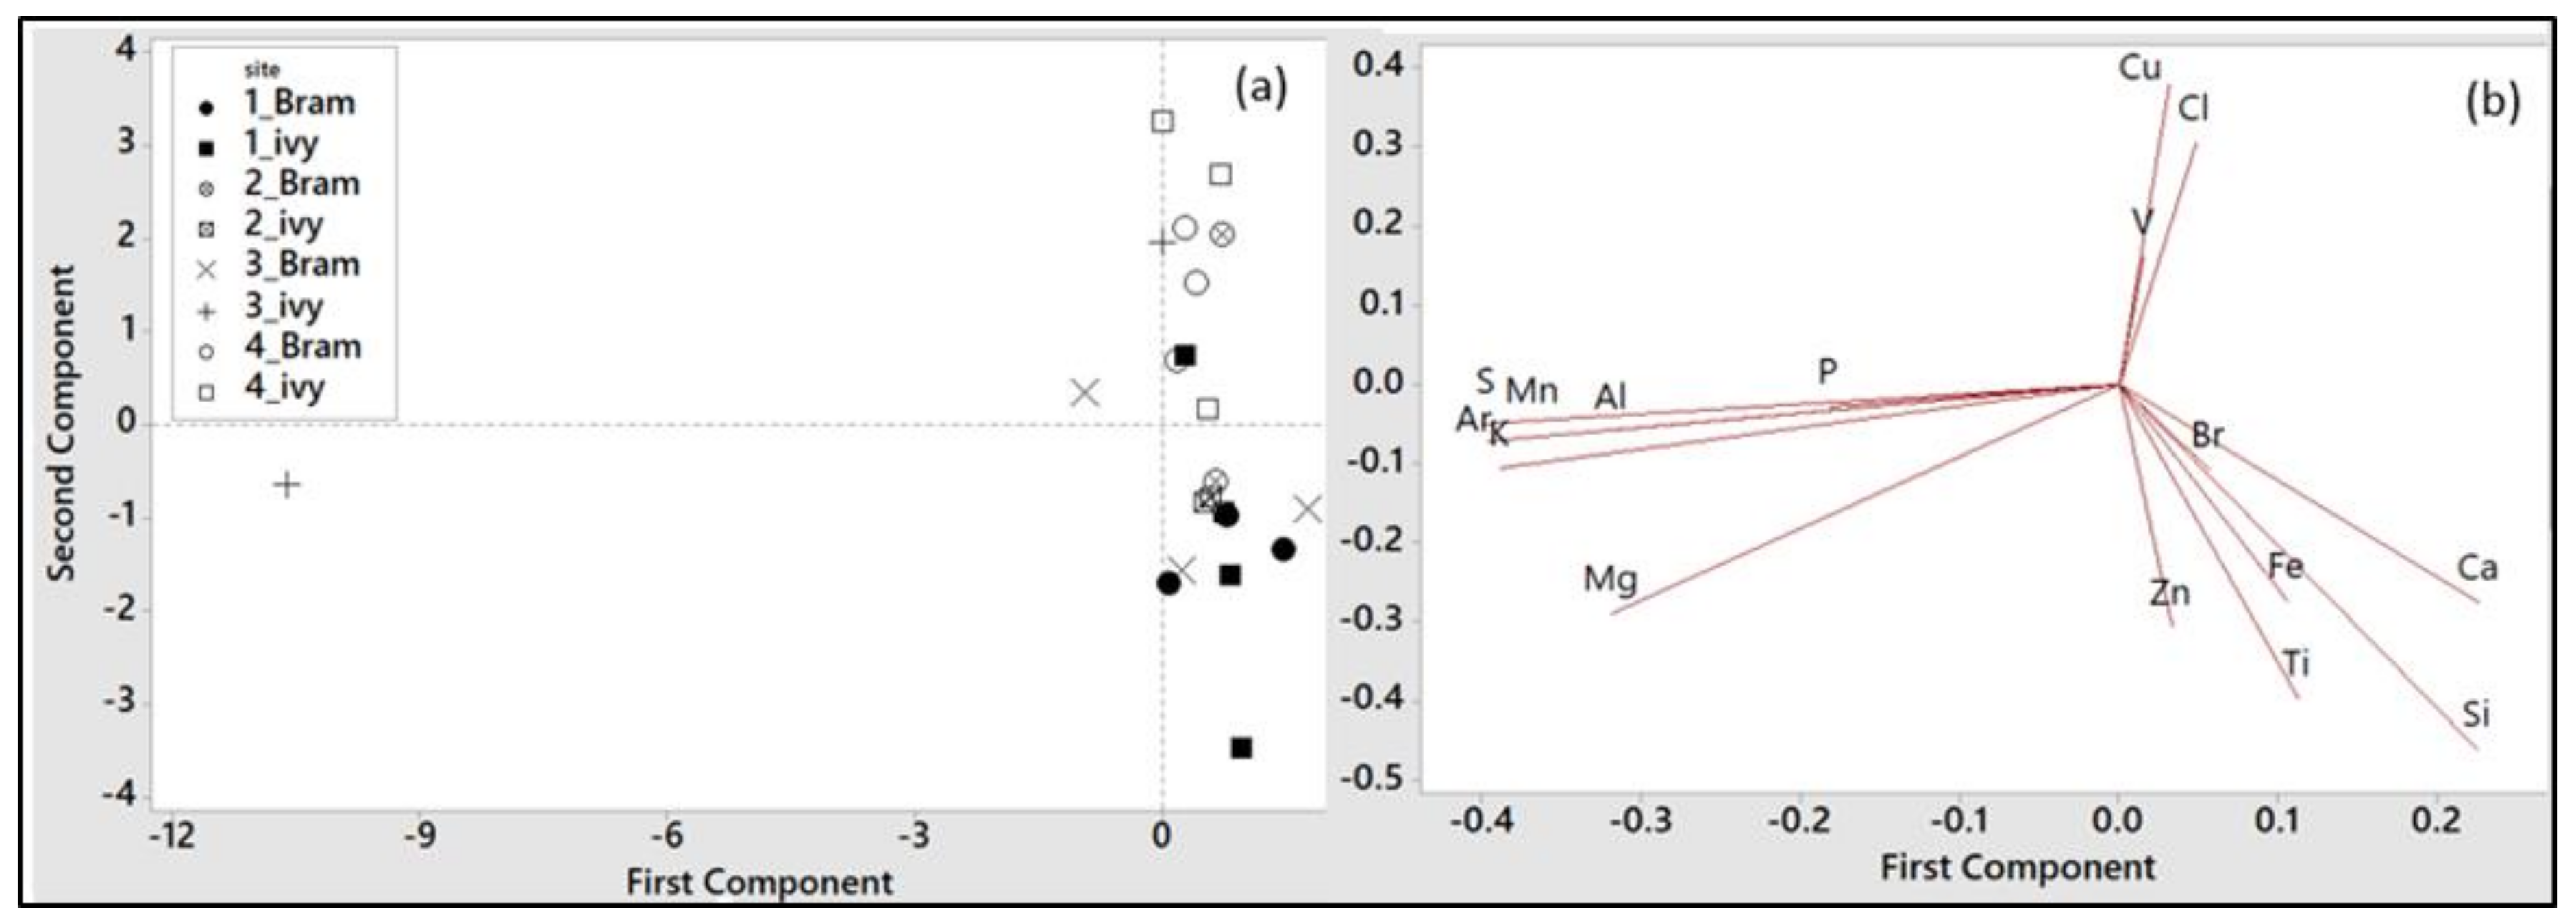
Principal component analysis (PCA) was used to identify any clusters associated with elemental concentrations measured on three replicates between individual leaf samples identified by species and the four sites across Southampton. Variables were analysed under a correlation PCA with separation of the sites identified through plotting factors on a bi-dimensional plane defined by principal component 1 (PC1) and principal component 2 (PC2).
The horizontal axis explains the strongest component (PC1) explaining 37% of the variance. This is driven by one sample, an ivy leaf from Site 3 (The Avenue). The other samples from Site 3 The Avenue (a medium traffic site surrounded by overhanging trees forming a street canyon) showed no distinct pattern. For the remaining sites individual plants did tend to cluster associated with site, and these clusters tended to separate around PC2 (explaining 18% of the variance). (Figure 6a). The vertical axis (PC2) tends to separate the high traffic roadside locations of Redbridge Road (Site 1, closed symbols) from the background, low traffic site, The Common (Site 4, open symbols). Interestingly the medium traffic roadside sites of Brinton’s Road and The Avenue show less clustering, suggesting more variability in the elements deposited on leaves at these sites. The spread and distribution of sites across the scores plot was interpreted through the PC loadings, this shows the driver elements of the sites and their relative weightings (Figure 6b). PC2 loadings display drivers of Fe, Zn, Ti, Br, Si, and Ca for the high traffic location of Redbridge Road and the background location of The Common driven by Cl, Cu, and V. The medium traffic sites of Brinton’s Road and The Avenue lay directly in between these two with one ivy sample on the avenue being characterised by Mg, P, Al, K, Mn, and S.
3.5. Calculation of Deposition Velocities
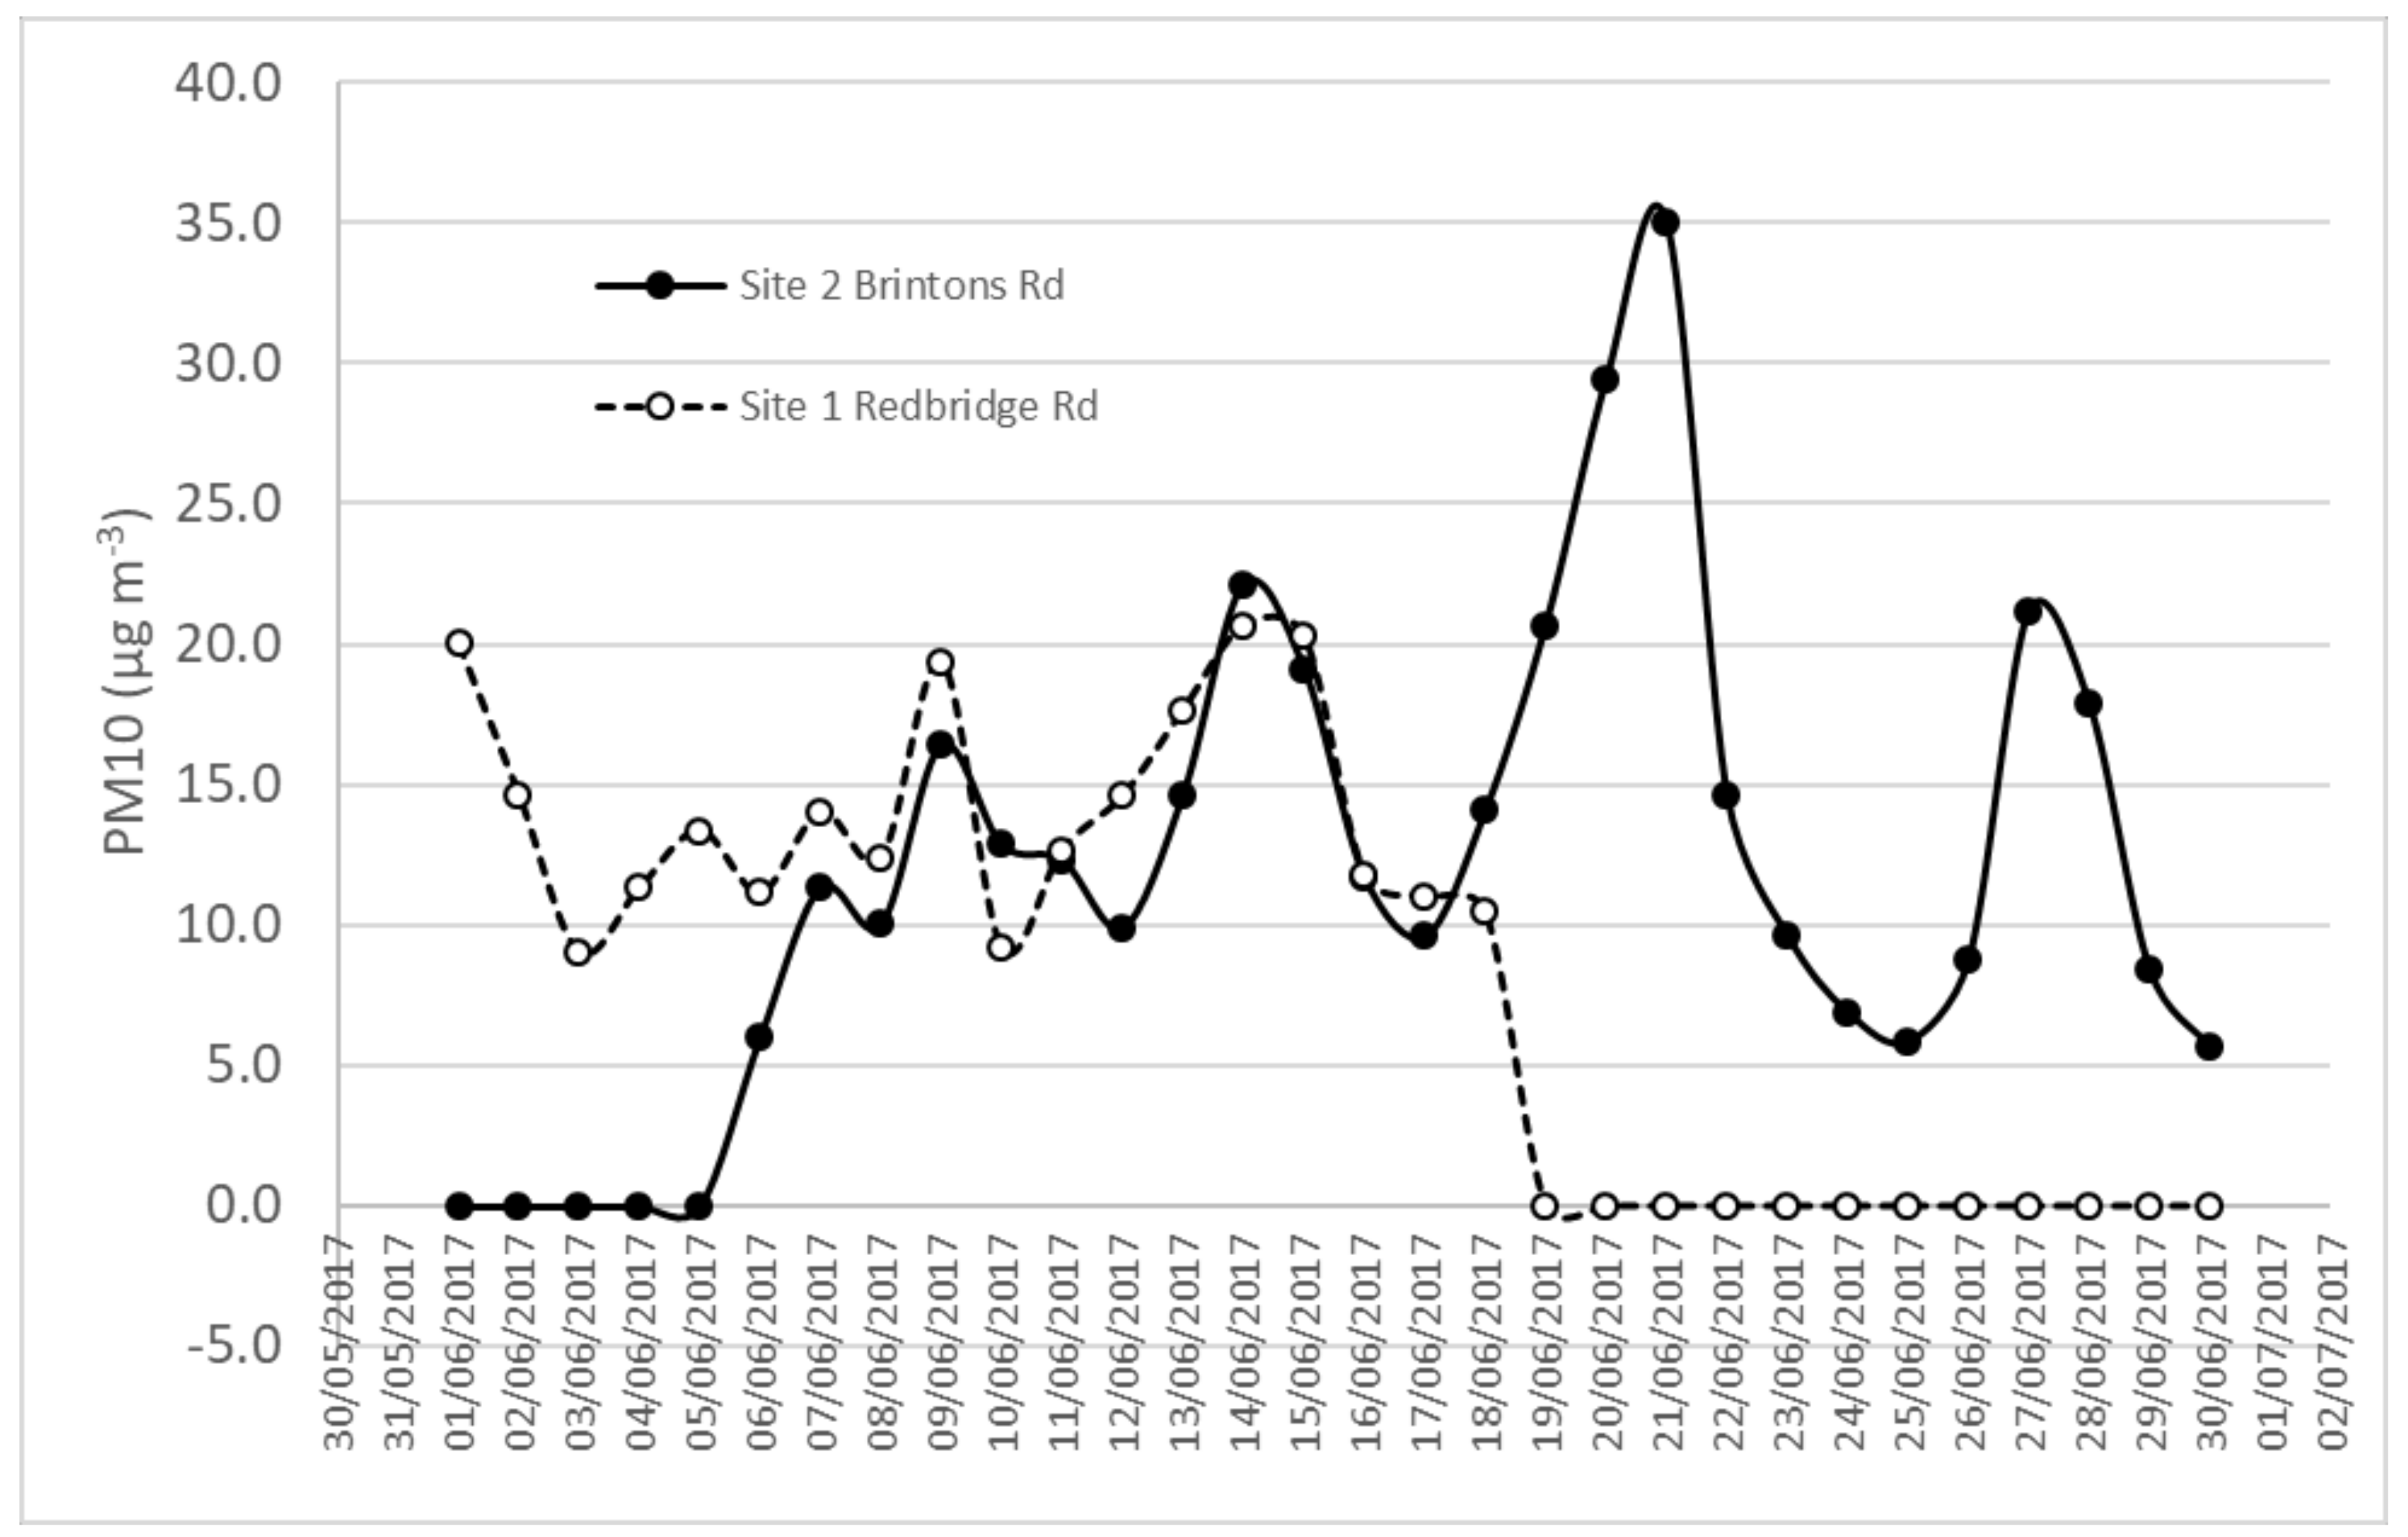
Brinton’s Road (Site 2) PM10 concentrations fluctuate throughout the time period but no pattern reflecting daily traffic patterns was recognised. All hourly concentrations were below the UK standard 24-h mean value of 50 µg m−3 with a maximum daily mean of 35 µg m−3. Redbridge Road (Site 1) concentrations are occasionally higher but often following the same fluctuations as for Brinton’s Road. A few notable spikes are identified within the dataset with the maximum concentration reaching 265 µg m−3. The time period for these high concentrations ran overnight from 17:00 to 08:00. However, the maximum mean daily concentration was calculated at 46 µg m−3, below the UK standard 24-h value [53]. Wind speed data for the period had a range of 0.8–4.4 m s−1 with an average of 2.8 m s−1 (Weather Underground, 2017).
PM10 measurements at the Redbridge road (UK-AIR ID: UKA00613) and Brinton’s Road (UK-AIR ID: UKA00235) AURN monitors were averaged between 10–18 June and 10–25 June, respectively (Figure 7) to cover the period of no rainfall before sampling (note: no PM10 data was available for the 18–25 period at Redbridge road). Average PM10 concentration were calculated at 26.7 µg m−3 at Redbridge Road and 16.2 µg m−3 at Brinton’s Road. Average PM concentration for the two sites and flux values for ivy and bramble at each site were used to calculate deposition velocities (Vgi) for these species (Table 2).
Redbridge Road, a high traffic location, produced greater deposition velocities than the lower traffic, urban background site of Brinton’s Road. Bramble leaves also allowed for greater deposition rates than that of ivy leaves. Notably the difference in deposition velocity between the two species remained consistent between each site with bramble allowing for a rate 0.51 cm s−1 greater than ivy.
4. Discussion
4.1. Particle Size Analysis
Particle size distribution results showed a dominance of particles in the fine fraction (physical diameter < 2.5 µm). These results complement those produced by Ottelé et al. [25], with particles sizes dominant at the lower end of the course fraction (physical diameter < 10 µm). Distribution peaks were identified <4 µm aerodynamic diameter and particles >10 µm particularly rare. Similar results were also observed by Sgrigna et al. [44] with the majority of particles sizes measured between 0.1 and 5 µm in physical diameter. Other studies found that particle distributions peaked between 3 and 9 µm in physical diameter [4], whilst Dzierżanowski et al. [8] found that the greatest number of particles ranged within 10–100 µm in physical diameter. Interestingly both Ottelé et al. [25] and Dzierżanowski et al. [8] analysed ivy and provided contradictory results. It is considered that the differences in recorded particle size distribution are due to different sampling, measuring, and analytical methods as well as different environmental impacts of site, climate, and emission sources. It is therefore difficult to compare and quantify the effectiveness of green infrastructure in capturing different particle size fractions.
4.2. Shrub and Herbaceous Plants as Air Quality Filters
The high traffic density site of Redbridge Road recorded the greatest concentrations of PM on leaf surfaces; double that of the lower traffic sites. Redbridge Road has ca. 50,000 more motor vehicles p/a than the other roadside locations. The lower traffic locations, with similar annual motor vehicle counts recorded relatively similar concentrations of PM. However, the Avenue PM levels are slightly greater. This has been attributed to distances from the road with samples from The Avenue considerably closer (ca. 2 m) than those of Brinton’s/Northam Road (ca. 12 m/22 m). The dense canopy covering The Avenue may also be attributing to increased PM levels through reduction of airflow. These results indicate that the immobilisation of particles occurs close to the emission source, therefore providing the greatest impact on air quality along busy roads. This follows findings throughout the literature that PM mass captured on vegetation is related to atmospheric concentration [4,15,33]. Natural variation has been attributed to high standard errors recorded with similar levels identified in Dzierżanowski et al. [8] with a similar sampling method used. These results indicate that vegetation reflects the PM conditions that they are exposed to and provides support to the use of leaves as in situ samplers of urban PM [20]. To understand the effectiveness of plants as air quality filters requires the identification that they are actively removing particles as has been shown under controlled conditions.
Analysis of PM concentrations on leaf surfaces has identified that all leaves in this urban area have acted as air quality filters, immobilising, and therefore removing PM from the air. The removal of PM is thought to be providing a beneficial service to inhabitants and users of these urban areas [4] particularly due to "strategic" planting at some of these sites. For example, the plants sampled from the Redbridge site are acting as barrier to the adjacent playing fields through growth up and along the fence. Additionally, plants sampled from The Avenue are acting as a barrier to The Common. These plants are working as part of a combined filtering effect along with other shrubs, trees, and herbaceous plants. The effectiveness of trees in the immobilization of PM has been well documented [8,17,18,42] and there is a growing body of work surrounding shrubs and herbaceous plants [4,8,25]. It is therefore concluded that with greater understanding of their varying effectiveness and abilities a multitude of plants will be used in the application of green infrastructure.
4.3. Differences in PM Immobilisation Abilities
This study focused on two contrasting species: bramble with rough, hairy leaves and ivy with smooth, waxy leaves. Bramble leaves captured greater PM masses across all sampling sites. This indicates that plants are not just passively reflecting the PM in the air, but that their certain leaf traits allow for greater levels of active PM capture. The greater the number of leaf hairs, the higher the boundary resistance and with hairs increasing the efficiency of particle interception [54]. However, this continued investigation of the distribution of particle sizes and elements across a leaf morphology would further aid the understanding of particle capture by different species.
Higher deposition velocities were calculated for bramble plants, at 0.51 cm s−1, greater than ivy plants from both sites. Deposition velocities were higher at the Redbridge Road site due to higher concentrations of PM, however the consistent difference in deposition velocities between the two plants identifies the relative effects of leaf morphology on PM immobilisation. Comparison of these deposition velocities and those published [15] is extremely difficult due to differences in PM fraction sampled (µm), inclusion of wind speeds and sampling method (laboratory or field data) where the distance from the PM sources are varied. This has led to a large variation in rates between measured plant species. However, the results recorded here fit within the ranges for field measurements analysing a PM range 0.1–20 µm published in Freer-Smith et al. [15] with lower wind speeds (2 m s−1) than those recorded in this study. Recorded deposition velocities for ivy and bramble (1.29–2.279 cm s−1) are below that of tree species such as Querus petraea and Corylus avellana (3.2–20 cm s−1) but within the range of grassland species (0.1–10 cm s−1). It is clear that there is a large variation in a species ability to capture PM, but other external environmental influences cannot be underestimated. Continued measurements will allow for the exclusion or mitigation of these environmental variations and allow for greater accuracy in modelling.
4.4. Elemental Analysis
Elemental analysis identified that Al, Si, and Ca are most abundant across all sites. These are recognised as some of the most common natural, geogenic elements attributed to the crustal input of the aerosol group [44,47,55]. They are considered the main constituents of resuspended road dust and surface soil material [56]. Sources of this material include crustal material, city dust, and road [48] with the potential for areas in Europe to receive African dust contributions [57]. Resuspension of these elements is caused through wind action but can by enhanced by the passage of vehicles [57,58]. Resuspension is further increased with greater vehicle speed through the creation of more turbulence [58]. This action further explains the greater PM mass recorded at the high traffic density site of Redbridge Road. Higher vehicle speeds and increased vehicle numbers leading to greater turbulence and more resuspension of particles. Mineral dust has been identified as a primary component in roadside PM due this significant resuspension [59].
The abundance of Cl is enigmatic and might usually be attributed to a sea salt source [12,57] due to the proximity to the Solent strait. However, the washing procedure used would have very effectively flushed sea salt from the samples. Given that the greatest abundance of Cl identified in the non-roadside location of The Common, it is possible that this represents the abundance of microplastics (e.g., polyvinylchloride, PVC).
Fe is also associated with crustal sources of resuspended dust with Al, Si, and Ca [60] but is also highlighted as having origins from traffic sources, and therefore an indicator of traffic related PM [48,49,50,60,61]. Fe is known to occur as an impurity in vehicle fuels. During combustion Fe forms a non-volatile residue that is released into the atmosphere as glassy spherules [62]. Fe related particles are also known to originate from non-exhaust emissions of brake, tyre, vehicle, and road wear [49,50,61]. Measurements have shown that the average brake pad contains up to 20% Fe additionally most brake discs are nearly all entirely made from Fe (>95%) [50]. Due to originating from both anthropogenic and geogenic sources the use of Fe as traffic related tracer element is difficult. However, it can be used as a comparative tracer through its relative abundance. Measurements by Baldacchini et al. [60] identified that Fe concentrations were more than double from street sampling sites, than those recorded at the park. Similar results were recorded by Sgrigna et al. [44] with street sites recording greater Fe levels than park sites. These results are in accordance to those observed in this study with the highest concentrations recorded at the high traffic site of Redbridge Road and the lowest identified at The Common. The higher concentrations recorded at The Avenue compared to the similar traffic level of Brinton’s Road is attributed to the sampling distance to the road, with sampling from The Avenue very close to the road (ca. 2 m). The highest concentrations of heavy metals are nearly always near the emission source, directly next to the road [49,63], particularly found in typical street canyons [63]. Measurements of Fe can be combined with other traffic related tracer elements such as Zn [58] and Cu [44] to provide further evidence of PM origins.
Miguel et al. [48] identified Zn, Mg, and Ti as urban elements and originating from traffic, construction, and degradation of building material. Zn is linked to tyre wear [64] with ZnO used as a vulcanizing agent and representing up to 1.2% weighted average for car tyres [65]. Tyre wear is considered a significant source of Zn into the environment [59,66]. It is also identified as originating, although from a lesser extent, engine exhausts and brake pads [59]. This element was only identified at the high traffic location of Redbridge Road, but in fairly low concentrations. It is difficult to constrain the source of Zn, as it is present from both natural and anthropogenic origins [64]. Mg and Ti are used as additives in diesels, lubricating oils, and metallic materials (alloys) with their use or corrosion leading to their environmental release [48]. Mg was identified at all roadside location in similar concentrations, potentially linking the element to vehicular activity rather than a sea-salt source. However, these elements were all recorded in relatively low concentration, again making it difficult to constrain their origin.
S is identified across all sites with the significantly higher concentrations measured from The Avenue site. It is associated with brake pad wear making up the composition of some break pad types [59,67]. This is linked with other elements including P and Cu that also make up the composition of some brake pads [67]. P is also identified across all sites with the greatest concentrations recorded at The Avenue and the lowest at The Common. Other vehicle links to S include its addition to lubricants [59]. Additionally, S can be associated with fuel combustion and secondary aerosols associated with the fuel combustion. The fuel combustion signature that is often related includes the presence of V and Ni [57]. Although S is present at all sample sites it is considerably higher from The Avenue, where, although in low concentrations the signature elements of V and Ni are present. It is thought the poor airflow in The Avenue due to the dense vegetation may be contributing to the concentrating of emissions in this area.
Site separation analyses through PCA and elemental loading indicated a number of signature elements of traffic related PM. For example, the highest traffic site of Redbridge Road is confirmed with strong traffic related indicators of Fe and Zn [48,49,50,61,64]. However, these markers do not identify the sites of Brinton’s Road and The Avenue. The Common site, as expected, is indicated to some extent by these elements with a strong driver of another natural indicator, Cl. The identification of a particle’s source is particularly difficult due interactions between sources and the lack of suitable tracer elements [64].
It has been shown that the methods applied here provide a useful tool in relatively simple, multi-analysis measurements of the capabilities of all urban plants. Continued sampling across several cities would contribute to a growing data set that can help inform the strategic planting and use of green infrastructure as a method to improving local air quality in urban areas. The ability to gather information on PM mass, particle size, elemental composition and calculate deposition velocities is key in characterising the abilities of different plant species and their effectiveness in urban areas. These analyses can and should be carried out in a number of urban areas to allow for the generation of global database in the effectiveness of different species. This will allow for more accurate modelling capabilities and help inform the strategic uses of green infrastructure through quantification of its effectiveness and identification of a suitable planting design in urban areas.
Author Contributions
Conceptualization, L.S.-P., M.J.T. and M.F.; methodology, L.S.-P., M.J.T. and M.F.; formal analysis, L.S.-P.; investigation, L.S.-P.; data curation, L.S.-P.; writing—original draft preparation, L.S.-P.; writing—review and editing, M.J.T. and M.F.; supervision, M.F.; project administration, M.J.T.; no funding acquisition. All authors have read and agreed to the published version of the manuscript.
Funding
This research received no external funding and was conducted as part of an MSc Environmental Geology and Contamination.
Acknowledgments
The authors would like to thank the technical staff at the University of Portsmouth, especially Joseph Dunlop, who provided skilled support in the laboratory. We are grateful to two anonymous reviewers for detailed and perceptive comments that helped significantly to improve the manuscript. Finally, L.S.-P. would also like to thank Sasha Catchpole for her continued support throughout this time.
Conflicts of Interest
The authors declare no conflict of interest.
References
- World Health Organization. Global Urban Ambient Air Pollution. 2018. Available online: https://www.who.int/health-topics/air-pollution#tab=tab_1 (accessed on 17 June 2020).
- Tallis, M.; Taylor, G.; Sinnett, D.; Freer-Smith, P. Estimating the removal of atmospheric particulate pollution by the urban tree canopy of London, under current and future environments. Landsc. Urban Plan. 2011, 103, 129–138. [Google Scholar] [CrossRef]
- Pugh, T.A.; MacKenzie, A.R.; Whyatt, J.D.; Hewitt, C.N. Effectiveness of green infrastructure for improvement of air quality in urban street canyons. Environ. Sci. Technol. 2012, 46, 7692–7699. [Google Scholar] [CrossRef] [PubMed] [Green Version]
- Weber, F.; Kowarik, I.; Säumel, I. Herbaceous plants as filters: Immobilization of particulates along urban street corridors. Environ. Pollut. 2014, 186, 234–240. [Google Scholar] [CrossRef] [PubMed]
- Sæbø, A.; Popek, R.; Nawrot, B.; Hanslin, H.M.; Gawronska, H.; Gawronski, S.W. Plant species differences in particulate matter accumulation on leaf surfaces. Sci. Total Environ. 2012, 427, 347–354. [Google Scholar] [CrossRef]
- Speak, A.F.; Rothwell, J.J.; Lindley, S.J.; Smith, C.L. Urban particulate pollution reduction by four species of green roof vegetation in a UK city. Atmos. Environ. 2012, 61, 283–293. [Google Scholar] [CrossRef]
- Beevers, S.D.; Kitwiroon, N.; Williams, M.L.; Kelly, F.J.; Anderson, H.R.; Carslaw, D.C. Air pollution dispersion models for human exposure predictions in London. J. Expo. Sci. Environ. Epidemiol. 2013, 23, 647–653. [Google Scholar] [CrossRef] [Green Version]
- Dzierżanowski, K.; Popek, R.; Gawrońska, H.; Sæbø, A.; Gawroński, S.W. Deposition of particulate matter of different size fractions on leaf surfaces and in waxes of urban forest species. Int. J. Phytoremediation 2011, 13, 1037–1046. [Google Scholar] [CrossRef]
- Tiwary, A.; Sinnett, D.; Peachey, C.; Chalabi, Z.; Vardoulakis, S.; Fletcher, T.; Leonardi, G.; Grundy, C.; Azapagic, A.; Hutchings, T.R. An integrated tool to assess the role of new planting in PM 10 capture and the human health benefits: A case study in London. Environ. Pollut. 2009, 157, 2645–2653. [Google Scholar] [CrossRef] [Green Version]
- Yin, S.; Shen, Z.; Zhou, P.; Zou, X.; Che, S.; Wang, W. Quantifying air pollution attenuation within urban parks: An experimental approach in Shanghai, China. Environ. Pollut. 2011, 159, 2155–2163. [Google Scholar] [CrossRef]
- Ault, A.P.; Peters, T.M.; Sawvel, E.J.; Casuccio, G.S.; Willis, R.D.; Norris, G.A.; Grassian, V.H. Single-particle SEM-EDX analysis of iron-containing coarse particulate matter in an urban environment: Sources and distribution of iron within Cleveland, Ohio. Environ. Sci. Technol. 2012, 46, 4331–4339. [Google Scholar] [CrossRef]
- Wang, L.; Liu, L.-U.; Gao, S.-Y.; Hasi, E.; Wang, Z. Physiochemical characteristics of ambient particles settling upon leaf surfaces of urban plants in Beijing. J. Environ. Sci. 2006, 18, 921–926. [Google Scholar] [CrossRef]
- Janssen, N.A.; Van Mansom, D.F.; Van Der Jagt, K.; Harssema, H.; Hoek, G. Mass concentration and elemental composition of airborne particulate matter at street and background locations. Atmos. Environ. 1997, 31, 1185–1193. [Google Scholar] [CrossRef]
- Prusty BA, K.; Mishra, P.C.; Azeez, P.A. Dust accumulation and leaf pigment content in vegetation near the national highway at Sambalpur, Orissa, India. Ecotoxicol. Environ. Saf. 2005, 60, 228–235. [Google Scholar] [CrossRef] [PubMed]
- Freer-Smith, P.H.; Beckett, K.P.; Taylor, G. Deposition velocities to Sorbus aria, Acer campestre, Populus deltoides× trichocarpa ‘Beaupré’, Pinus nigra and× Cupressocyparis leylandii for coarse, fine and ultra-fine particles in the urban environment. Environ. Pollut. 2005, 133, 157–167. [Google Scholar] [CrossRef]
- Künzli, N.; Kaiser, R.; Medina, S.; Studnicka, M.; Chanel, O.; Filliger, P.; Herry, M.; Horak, F.; Puybonnieux-Texier, V.; Quénel, P.; et al. Public-health impact of outdoor and traffic-related air pollution: A European assessment. Lancet 2000, 356, 795–801. [Google Scholar] [CrossRef]
- Yang, J.; McBride, J.; Zhou, J.; Sun, Z. The urban forest in Beijing and its role in air pollution reduction. Urban For. Urban Green. 2005, 3, 65–78. [Google Scholar] [CrossRef]
- Nowak, D.J.; Crane, D.E.; Stevens, J.C. Air pollution removal by urban trees and shrubs in the United States. Urban For. Urban Green. 2006, 4, 115–123. [Google Scholar] [CrossRef]
- Cai, M.; Xin, Z.; Yu, X. Spatio-temporal variations in PM leaf deposition: A meta-analysis. Environ. Pollut. 2017, 231, 207–218. [Google Scholar] [CrossRef]
- Baldacchini, C.; Sgrigna, G.; Clarke, W.; Tallis, M.J.; Calfapietra, C. An ultra-spatially resolved method to quali-quantitative monitor particulate matter in urban environment. Environ. Sci. Pollut. Res. 2019, 26, 18719–18729. [Google Scholar] [CrossRef]
- McDonald, A.; Bealey, W.; Fowler, D.; Dragosits, U.; Skiba, U.; Smith, R.; Donovan, R.; Brett, H.; Hewitt, C.N.; Nemitz, E. Quantifying the effect of urban tree planting on concentrations and depositions of PM 10 in two UK conurbations. Atmos. Environ. 2007, 41, 8455–8467. [Google Scholar] [CrossRef]
- Currie, B.A.; Bass, B. Estimates of air pollution mitigation with green plants and green roofs using the UFORE model. Urban Ecosyst. 2008, 11, 409–422. [Google Scholar] [CrossRef]
- Abhijith, K.; Kumar, P.; Gallagher, J.; McNabola, A.; Baldauf, R.; Pilla, F.; Broderick, B.; Di Sabatino, S.; Pulvirenti, B. Air pollution abatement performances of green infrastructure in open road and built-up street canyon environments—A review. Atmos. Environ. 2017, 162, 71–86. [Google Scholar] [CrossRef]
- Weerakkody, U.; Dover, J.W.; Mitchell, P.; Reiling, K. Evaluating the impact of individual leaf traits on atmospheric particulate matter accumulation using natural and synthetic leaves. Urban For. Urban Green. 2018, 30, 98–107. [Google Scholar] [CrossRef]
- Ottelé, M.; van Bohemen, H.D.; Fraaij, A.L. Quantifying the deposition of particulate matter on climber vegetation on living walls. Ecol. Eng. 2010, 36, 154–162. [Google Scholar] [CrossRef]
- Honour, S.L.; Bell JN, B.; Ashenden, T.W.; Cape, J.N.; Power, S.A. Responses of herbaceous plants to urban air pollution: Effects on growth, phenology and leaf surface characteristics. Environ. Pollut. 2009, 157, 1279–1286. [Google Scholar] [CrossRef] [Green Version]
- Prajapati, S.K.; Tripathi, B.D. Seasonal variation of leaf dust accumulation and pigment content in plant species exposed to urban particulates pollution. J. Environ. Qual. 2008, 37, 865–870. [Google Scholar] [CrossRef]
- Vos, P.E.; Maiheu, B.; Vankerkom, J.; Janssen, S. Improving local air quality in cities: To tree or not to tree? Environ. Pollut. 2013, 183, 113–122. [Google Scholar] [CrossRef]
- Tallis, M.; Amorim, J.H.; Calfapietra, C.; Freer-Smith, P.; Grimmond, S.; Kotthaus, S.; Sinnett, D.; Smith, N.; Burgess, S. The impacts of green infrastructure on air quality and temperature. In Handbook on Green Infrastructure: Planning, Design and Implementation; Edward Elgar Publishing: Cheltenham, UK, 2015; pp. 30–49. [Google Scholar]
- Nowak, D.J. Air pollution removal by Chicago’s urban forest. In Chicago’s Urban Forest Ecosystem: Results of the Chicago Urban Forest Climate Project; McPher-Son, E.G., Nowak, D.J., Rowntree, R.A., Eds.; US Department of Agriculture, Forest Service, Northeastern Forest Experiment Station: Radnor, PA, USA, 1994; pp. 63–82. [Google Scholar]
- Bealey, W.; McDonald, A.; Nemitz, E.; Donovan, R.; Dragosits, U.; Duffy, T.; Fowler, D. Estimating the reduction of urban PM10 concentrations by trees within an environmental information system for planners. J. Environ. Manag. 2007, 85, 44–58. [Google Scholar] [CrossRef]
- Baldocchi, D.D.; Hicks, B.B.; Camara, P. A canopy stomatal-resistance model for gaseous deposition to vegetated surfaces. Atmos. Environ. 1987, 21, 91–101. [Google Scholar] [CrossRef]
- Beckett, K.P.; Freer-Smith, P.H.; Taylor, G. Particulate pollution capture by urban trees: Effect of species and windspeed. Glob. Chang. Biol. 2000, 6, 995–1003. [Google Scholar] [CrossRef]
- Hirabayashi, S.; Kroll, C.N.; Nowak, D.J. i-Tree Eco Dry Deposition Model Descriptions. Citeseer. 2012. Available online: https://www.itreetools.org/documents/60/iTree_Eco_Dry_Deposition_Model_Descriptions.pdf (accessed on 25 June 2020).
- Department for Environment Food & Rural Affairs, UK Air Information Resource (UK AIR), Automatic Urban and Rural Network (AURN). Available online: https://uk-air.defra.gov.uk/networks/network-info?view=aurn (accessed on 25 June 2020).
- Hantsair (Southampton City Council). Air Quality Monitoring in Southampton. 2017. Available online: http://www.hantsair.org.uk/hampshire/asp/Bulletin.asp?la=Southampton&bulletin=daily&site=SH1&bulletindate=29/06/2017 (accessed on 30 June 2017).
- Department for Transport (DFT). Traffic Counts—Southampton. 2016. Available online: https://www.dft.gov.uk/traffic-counts/cp.php?la=Southampton (accessed on 30 June 2017).
- Edina Digimap. Colour Raster: Southampton 1:50,000 [PDF] OS Roam Series. 2017. Available online: http://0-digimap-edina-ac-uk.brum.beds.ac.uk/roam/os (accessed on 22 April 2017).
- Mitchell, R.; Maher, B.A.; Kinnersley, R. Rates of particulate pollution deposition onto leaf surfaces: Temporal and inter-species magnetic analyses. Environ. Pollut. 2010, 158, 1472–1478. [Google Scholar] [CrossRef] [PubMed]
- Weather Underground. Weather History for Southampton—June 2017. Available online: https://www.wunderground.com/history/airport/EGHI/2017/6/9/MonthlyHistory.html?req_city=Wootton%20Bridge&req_statename=United%20Kingdom&reqdb.zip=00000&reqdb.magic=1&reqdb.wmo=03874 (accessed on 25 June 2017).
- Mitchell, R.; Maher, B.A. Evaluation and application of biomagnetic monitoring of traffic-derived particulate pollution. Atmos. Environ. 2009, 43, 2095–2103. [Google Scholar] [CrossRef]
- Sgrigna, G.; Sæbø, A.; Gawronski, S.; Popek, R.; Calfapietra, C. Particulate Matter deposition on Quercus ilex leaves in an industrial city of central Italy. Environ. Pollut. 2015, 197, 187–194. [Google Scholar] [CrossRef] [PubMed]
- Schneider, C.A.; Rasband, W.S.; Eliceiri, K.W. NIH Image to ImageJ: 25 years of image analysis. Nature Methods 2012, 9, 671–675. [Google Scholar] [CrossRef] [PubMed]
- Sgrigna, G.; Baldacchini, C.; Esposito, R.; Calandrelli, R.; Tiwary, A.; Calfapietra, C. Characterization of leaf-level particulate matter for an industrial city using electron microscopy and X-ray microanalysis. Sci. Total Environ. 2016, 548, 91–99. [Google Scholar] [CrossRef]
- Tomašević, M.; Vukmirović, Z.; Rajšić, S.; Tasić, M.; Stevanović, B. Characterization of trace metal particles deposited on some deciduous tree leaves in an urban area. Chemosphere 2005, 61, 753–760. [Google Scholar] [CrossRef]
- Sawidis, T.; Breuste, J.; Mitrovic, M.; Pavlovic, P.; Tsigaridas, K. Trees as bioindicator of heavy metal pollution in three European cities. Environ. Pollut. 2011, 159, 3560–3570. [Google Scholar] [CrossRef]
- Lorenzini, G.; Grassi, C.; Nali, C.; Petiti, A.; Loppi, S.; Tognotti, L. Leaves of Pittosporum tobira as indicators of airborne trace element and PM 10 distribution in central Italy. Atmos. Environ. 2006, 40, 4025–4036. [Google Scholar] [CrossRef]
- De Miguel, E.; Llamas, J.F.; Chacón, E.; Berg, T.; Larssen, S.; Røyset, O.; Vadset, M. Origin and patterns of distribution of trace elements in street dust: Unleaded petrol and urban lead. Atmos. Environ. 1997, 31, 2733–2740. [Google Scholar] [CrossRef]
- Peachey, C.J.; Sinnett, D.; Wilkinson, M.; Morgan, G.W.; Freer-Smith, P.H.; Hutchings, T.R. Deposition and solubility of airborne metals to four plant species grown at varying distances from two heavily trafficked roads in London. Environ. Pollut. 2009, 157, 2291–2299. [Google Scholar] [CrossRef] [Green Version]
- Hulskotte JH, J.; Roskam, G.D.; Van Der Gon, H.D. Elemental composition of current automotive braking materials and derived air emission factors. Atmos. Environ. 2014, 99, 436–445. [Google Scholar] [CrossRef]
- Mori, J.; Sæbø, A.; Hanslin, H.M.; Teani, A.; Ferrini, F.; Fini, A.; Burchi, G. Deposition of traffic-related air pollutants on leaves of six evergreen shrub species during a Mediterranean summer season. Urban For. Urban Green. 2015, 14, 264–273. [Google Scholar] [CrossRef]
- Conner, T.L.; Norris, G.A.; Landis, M.S.; Williams, R.W. Individual particle analysis of indoor, outdoor, and community samples from the 1998 Baltimore particulate matter study. Atmos. Environ. 2001, 35, 3935–3946. [Google Scholar] [CrossRef]
- Department for Environment, Food and Rural Affairs. The Air Quality Strategy (AQS) for England, Scotland, Wales and Northern Ireland; The Licensing Division, HMSO: Norwich, UK, 2007; Volume 1, p. 56. [Google Scholar]
- Bakker, M.I.; Vorenhout, M.; Sijm, D.T.; Kollöffel, C. Dry deposition of atmospheric polycyclic aromatic hydrocarbons in three Plantago species. Environ. Toxicol. Chem. 1999, 18, 2289–2294. [Google Scholar]
- Suzuki, K. Characterisation of airborne particulates and associated trace metals deposited on tree bark by ICP-OES, ICP-MS, SEM-EDX and laser ablation ICP-MS. Atmos. Environ. 2006, 40, 2626–2634. [Google Scholar] [CrossRef]
- Jancsek-Turóczi, B.; Hoffer, A.; Nyírő-Kósa, I.; Gelencsér, A. Sampling and characterization of resuspended and respirable road dust. J. Aerosol Sci. 2013, 65, 69–76. [Google Scholar] [CrossRef] [Green Version]
- Viana, M.; Kuhlbusch, T.A.J.; Querol, X.; Alastuey, A.; Harrison, R.M.; Hopke, P.K.; Winiwarter, W.; Vallius, M.; Szidat, S.; Prévôt, A.; et al. Source apportionment of particulate matter in Europe: A review of methods and results. J. Aerosol Sci. 2008, 39, 827–849. [Google Scholar] [CrossRef]
- Nicholson, K.W.; Branson, J.R.; Giess, P.; Cannell, R.J. The effects of vehicle activity on particle resuspension. J. Aerosol Sci. 1989, 20, 1425–1428. [Google Scholar] [CrossRef]
- Amato, F.; Pandolfi, M.; Viana, M.; Querol, X.; Alastuey, A.; Moreno, T. Spatial and chemical patterns of PM 10 in road dust deposited in urban environment. Atmos. Environ. 2009, 43, 1650–1659. [Google Scholar] [CrossRef]
- Baldacchini, C.; Castanheiro, A.; Maghakyan, N.; Sgrigna, G.; Verhelst, J.; Alonso, R.; Amorim, J.H.; Bellan, P.; Bojović, D.Đ.; Breuste, J.; et al. How does the amount and composition of PM deposited on Platanus acerifolia leaves change across different cities in Europe? Environ. Sci. Technol. 2017, 51, 1147–1156. [Google Scholar] [CrossRef]
- Adamo, P.; Giordano, S.; Naimo, D.; Bargagli, R. Geochemical properties of airborne particulate matter (PM 10) collected by automatic device and biomonitors in a Mediterranean urban environment. Atmos. Environ. 2008, 42, 346–357. [Google Scholar] [CrossRef]
- Matzka, J.; Maher, B.A. Magnetic biomonitoring of roadside tree leaves: Identification of spatial and temporal variations in vehicle-derived particulates. Atmos. Environ. 1999, 33, 4565–4569. [Google Scholar] [CrossRef]
- Thoennessen, M.; Werner, W. Die fassadenbegrünende Dreispitzige Jungfernrebe als Akkumulationsindikator: Verteilung von Schwermetallen in Stadtstrassen unterschiedlicher Bebauungsstruktur. Gefahrstoffe Reinhaltung Der Luft 1996, 56, 351–357. [Google Scholar]
- Thorpe, A.; Harrison, R.M. Sources and properties of non-exhaust particulate matter from road traffic: A review. Sci. Total Environ. 2008, 400, 270–282. [Google Scholar] [CrossRef]
- Smolders, E.; Degryse, F. Fate and effect of zinc from tire debris in soil. Environ. Sci. Techn. 2002, 36, 3706–3710. [Google Scholar]
- Blok, J. Environmental exposure of road borders to zinc. Sci. Total Environ. 2005, 348, 173–190. [Google Scholar] [CrossRef]
- Garg, B.D.; Cadle, S.H.; Mulawa, P.A.; Groblicki, P.J.; Laroo, C.; Parr, G.A. Brake wear particulate matter emissions. Environ. Sci. Technol. 2000, 34, 4463–4469. [Google Scholar] [CrossRef]
Figure 1.
Sample site location map of Southampton. Site 1: Redbridge road; Site 2: Brinton’s Road; Site 3: The Avenue; Site 4: Southampton Common. (Red lines are major (A) roads) Adopted from Edina Digimap [38].
Figure 1.
Sample site location map of Southampton. Site 1: Redbridge road; Site 2: Brinton’s Road; Site 3: The Avenue; Site 4: Southampton Common. (Red lines are major (A) roads) Adopted from Edina Digimap [38].

Figure 2.
Images of sampling locations with Sites 1 and 2 including the automatic urban and rural network (AURN) air quality monitoring stations, Site 3 shows the high density of the vegetation surrounding the road and site as a non-roadside area.
Figure 2.
Images of sampling locations with Sites 1 and 2 including the automatic urban and rural network (AURN) air quality monitoring stations, Site 3 shows the high density of the vegetation surrounding the road and site as a non-roadside area.

Figure 3.
Images displaying steps taken in particle size analysis from the original image (a) to an increased contrast for clearly identifying particles (b), creation of a binary image with separation of particles from the background (c), and an image of the counted particle outlines (d).
Figure 3.
Images displaying steps taken in particle size analysis from the original image (a) to an increased contrast for clearly identifying particles (b), creation of a binary image with separation of particles from the background (c), and an image of the counted particle outlines (d).

Figure 4.
Average PM mass (<100 μm) washed from leaf surfaces, per unit area for each site. Standard error displays large variation in PM mass at each site. Site 1: Redbridge road; Site 2: Brinton’s Road, Site 3: The Avenue; Site 4: Southampton Common.
Figure 4.
Average PM mass (<100 μm) washed from leaf surfaces, per unit area for each site. Standard error displays large variation in PM mass at each site. Site 1: Redbridge road; Site 2: Brinton’s Road, Site 3: The Avenue; Site 4: Southampton Common.

Figure 5.
Mean elemental concentrations (%Wt + 1 standard deviation from the mean, n = 3) from each site, composite analysis of field of view. Site 1: Redbridge road; Site 2: Brinton’s Road; Site 3: The Avenue; Site 4: Southampton Common.
Figure 5.
Mean elemental concentrations (%Wt + 1 standard deviation from the mean, n = 3) from each site, composite analysis of field of view. Site 1: Redbridge road; Site 2: Brinton’s Road; Site 3: The Avenue; Site 4: Southampton Common.

Figure 6.
Principal component analysis; (a) scores plot with points representing sites and displaying site separation and (b) loading plot displaying relative loadings of variables. Site 1: Redbridge road; Site 2: Brinton’s Road; Site 3: The Avenue; Site 4: Southampton Common.
Figure 6.
Principal component analysis; (a) scores plot with points representing sites and displaying site separation and (b) loading plot displaying relative loadings of variables. Site 1: Redbridge road; Site 2: Brinton’s Road; Site 3: The Avenue; Site 4: Southampton Common.

Figure 7.
Time series of daily average PM10 concentrations at the AURN sites for Site 1 Redbridge Road and Site 2 Brinton’s Road and Redbridge Road, June 2017. (For this time-period, no data were available after 19 June for Site 1 and before 5 June for Site 2.).
Figure 7.
Time series of daily average PM10 concentrations at the AURN sites for Site 1 Redbridge Road and Site 2 Brinton’s Road and Redbridge Road, June 2017. (For this time-period, no data were available after 19 June for Site 1 and before 5 June for Site 2.).


Table 1.
Particle size analysis and distribution of fine (<2.5 µm) and coarse (2.5–10 µm) particles measured by physical diameter.
Table 1.
Particle size analysis and distribution of fine (<2.5 µm) and coarse (2.5–10 µm) particles measured by physical diameter.
| Sample | Particle Count | Particles < 2.5 µm (%) | Particles 2.5–10 µm (%) |
|---|---|---|---|
| Redbridge Road (Ivy) | 244,410 | 57.51 | 33.45 |
| Redbridge Road (Bramble) | 179,862 | 63.05 | 33.17 |
| Brinton’s Road (Ivy) | 121,712 | 53.94 | 38.56 |
| Brinton’s Road (Bramble) | 88,473 | 72.94 | 24.74 |
| The Avenue (Ivy) | 37,360 | 68.72 | 28.35 |
| The Avenue (Bramble) | 125,876 | 70.92 | 26.95 |
| The Common (Ivy) | 37,297 | 69.86 | 26.78 |
| The Common (Bramble) | 77,388 | 68.83 | 28.64 |
Table 2.
Values of flux, PM10 air concentrations and deposition velocities for Redbridge and Brinton’s Road sites.
Table 2.
Values of flux, PM10 air concentrations and deposition velocities for Redbridge and Brinton’s Road sites.
| Site | Specie | Flux (g cm2 s−1) | Air PM Conc. (g m3) | Vgi (cm s−1) |
|---|---|---|---|---|
| Redbridge Road | Ivy | 0.0000473 | 0.0000267 | 1.77 |
| Bramble | 0.0000608 | 0.0000267 | 2.28 | |
| Brinton’s Road | Ivy | 0.0000209 | 0.0000162 | 1.29 |
| Bramble | 0.0000291 | 0.0000162 | 1.80 |
Publisher’s Note: MDPI stays neutral with regard to jurisdictional claims in published maps and institutional affiliations. |
© 2020 by the authors. Licensee MDPI, Basel, Switzerland. This article is an open access article distributed under the terms and conditions of the Creative Commons Attribution (CC BY) license (http://creativecommons.org/licenses/by/4.0/).
Share and Cite
MDPI and ACS Style
Sillars-Powell, L.; Tallis, M.J.; Fowler, M. Road Verge Vegetation and the Capture of Particulate Matter Air Pollution. Environments 2020, 7, 93. https://0-doi-org.brum.beds.ac.uk/10.3390/environments7100093
AMA Style
Sillars-Powell L, Tallis MJ, Fowler M. Road Verge Vegetation and the Capture of Particulate Matter Air Pollution. Environments. 2020; 7(10):93. https://0-doi-org.brum.beds.ac.uk/10.3390/environments7100093
Chicago/Turabian StyleSillars-Powell, Lory, Matthew J. Tallis, and Mike Fowler. 2020. "Road Verge Vegetation and the Capture of Particulate Matter Air Pollution" Environments 7, no. 10: 93. https://0-doi-org.brum.beds.ac.uk/10.3390/environments7100093
Note that from the first issue of 2016, this journal uses article numbers instead of page numbers. See further details here.