Lead Complexation by Humic Acids and Their Analogs: A Voltammetric Study


Department of Chemistry, University of Nevada, Las Vegas, NV 89154, USA
*
Author to whom correspondence should be addressed.
Environments 2020, 7(11), 94; https://0-doi-org.brum.beds.ac.uk/10.3390/environments7110094
Submission received: 28 September 2020
/
Revised: 15 October 2020
/
Accepted: 23 October 2020
/
Published: 26 October 2020
(This article belongs to the Special Issue Feature Papers in Environments in 2020)
Abstract
:Differential pulse polarography (DPP) was used to assess the interaction of Pb2+ with various humic acid analogs and several humic acids. DPP analysis demonstrated that the reduction peak maximum (Ep) for Pb2+ shifted to more negative values in the presence of humic acids and humic acid analogs. The observed Ep for Pb2+ in the presence of humic acids and humic acid analogs is influenced by ligand concentration, solution pH and Pb2+ concentration. Shifts in the Ep for Pb2+ are related to the reduction potential and can be rationalized using the Lingane equation.
1. Introduction
When metal cations interact with natural organic matter, metal ligand complexes of various strengths can form. Natural organic matter in soil and water can therefore have a significant influence on chemical speciation of various metals in the environment. For example, Grosell et al. [1] demonstrated that humic acid can reduce the toxicity of lead for fathead minnows during laboratory tank exposure. García-Mina et al. [2] reviewed the role that metal-humic complexes can play in plant micronutrient uptake. Senesi and Loffredo [3] reviewed the role of humic substances on the speciation of metals in soils. Senesi and Lofferedo [4] reviewed the various spectroscopic methods utilized for studying the influence of humic acid metal complexes on metal speciation in soil.
Some metal humate complexes have been demonstrated to be electrochemically inert [5,6,7], while other metals that form complexes are still available for electrochemical reduction [8]. These latter complexes may, for example, be reduced to their zero-valance forms by a cathodic scan on a mercury electrode. This reduction reaction, of the complexed metal, occurs at a more negative potential than for the simple metal ion. The shift in reduction potential is a function of the metal ligand stability constant and the ligand concentration in solution, and this shift can be rationalized by reference to the Lingane equation [9].
When the ligand concentration is sufficiently higher than the metal concentration, and the metal ion equilibration with the ligand is sufficiently rapid, the shift in reduction potential is a linear function of the log of the ligand concentration, as predicted by the Lingane [9] equation. The shift in the reduction potential will also be a function of the pH of the solution if the speciation of the ligand and its affinity for the metal is influenced by pH. This phenomenon was also observed by Greter et al. [10]. These investigators noted the shift in apparent reduction potential in the presence of humic material and provided compelling evidence for the adsorption of the Pb2+ humate complex onto the mercury electrode. Similar observations were made by Turner et al. (1987), where the differential pulse polarography (DPP) measurement in the presence of fulvic acids yielded peak maxima at a significantly more negative value than fulvic acid-free solutions [11]. Wallman et al. [12] also observed that Pb2+ fulvic acid complexes adsorbed onto a static mercury electrode and were detectable by cyclic voltammetry (CV). The adsorbed Pb2+ was reduced during the cathodic scan, and the peak current progressively shifted to more negative peak voltages with increased adsorption time. These authors noted that the Pb2+ fulvic acid complexes were labile on the time scale of CV.
In a previous publication, using anodic stripping voltammetry (ASV), we demonstrated that copper is strongly bound by water-extractable soil organic matter and by humic acids [13]. A significant fraction of the bound copper was electrochemically inert, and the formation of this inert fraction was time-dependent. The presence of this electrochemically inert fraction is manifested by a nonlinear Copper ASV response when organic matter is titrated with Cu2+. Similar observations have been made by other investigators. Our investigations with with Pb2+ using ASV indicate that the concentration of the inert Pb2+ complexes is at least an order of magnitude lower than for Cu2+ (results not shown). Thus, ASV results for Pb2+ do not show the pronounced nonlinearity of response vs. concentration that was observed for Cu2+. However, during our investigations, we noticed that there was a notable shift in the DPP peak maximum (Ep) potential for Pb2+ in the presence of humic acids when compared to the Ep of Pb2+ in humic-free buffer solutions. In the current investigation, we sought to further elucidate the interaction of Pb2+ with various humic acids by examining the shift in the reduction potential of Pb2+ in the presence of humic acids. Our results demonstrated that Pb2+ interacts with humic material primarily by the formation of an electrochemically active (reducible) complex. This Pb2+ humate complex, although in rapid equilibrium with the solution species, is reduced at a more negative reduction potential (100 to 200 mV) than uncomplexed Pb2+.
2. Materials and Methods
2.1. Chemicals and Soil Samples
Deionized water was redistilled in an all-glass still before use. All reagents used were of ACS grade or better and employed without further purification. Humic acid samples were purchased from the International Humic Substances Society (IHSS) (leonardite humic acid standard, Pahokee peat humic acid standard, Suwannee River Natural Organic Matter (NOM) and Elliot soil humic acid standard V). In addition, a commercial leonardite humic acid was obtained from TeraVita (Lancaster, PA, USA). This commercially available humic material is extracted from leonardite coal and is marketed as a soil amendment (TeraVita product information). Dimethyldichlorosilane was obtained from Alpha Aesar (Haverhill, MA, USA).
Buffers, HEPES (4-(2-hydroxyethyl)-1-piperazineethanesulfonic acid), MOPS (3-(N-morpholino) propanesulfonic acid), MES (2-(N-morpholino) ethanesulfonic acid) and PIPES (piperazine-N,N′-bis (2-ethanesulfonic acid)) were purchased from Sigma Aldrich (Saint Louis, MO, USA). Acetic acid and hydrochloric acid were obtained from Baker (Phillipsburg, NJ, USA). Buffer concentrations were 0.1 M, with 1-M NaNO3 added as a background electrolyte. For example, the HEPES pH 8 buffer was prepared by weighing out HEPES sodium salt to make a 0.100-M solution upon dilution. Similarly, enough, NaNO3 was weighed out so that the final solution was 1.00 M in NaNO3. The buffer salt was titrated to pH 8 with 6-M HCl and then diluted to volume. MOPs pH 7, MES pH 6.15 and acetate (sodium acetate) were prepared the same way. The pH of the solution was verified be within 0.02 pH units of the buffer, with a pH meter calibrated with National Institute of Standards and Technology (NIST) traceable standard buffers.
Pb2+ standards were prepared by dilution of a commercial lead atomic adsorption standard purchased from VWR (Visalia, CA, USA). Thus, Pb2+ was added from an acidic standard solution, and we were concerned that the addition of these acidic aliquots would result in a significant change in pH. The potential for pH change was most significant for samples containing 15 mL of humic solution and only 1.0 mL of the 0.1-M buffer. Therefore, for some experiments, the humic acid was dissolved in 0.1-M pH 8 HEPES buffer solution or in 0.1-M HEPES buffer with 1.0-M NaNO3 added to increase the ionic strength of the solution. The increased concentration of the buffer increased the buffer capacity of the test solution and prevented any significant excursions in pH.
2.2. Instrumentation
A CHI (Austin, TX, USA) model 660 A potentiostat was used in conjunction with a BASi MF-9058 controlled growth mercury electrode cell stand with magnetic stirrer. The electrochemical cell was purged with nitrogen before all measurements, and the cell head space was blanketed with nitrogen during all measurements. The controlled growth mercury electrode was equipped with a 150-µm glass capillary and was used in the static mercury electrode mode. A platinum wire served as the auxiliary electrode, and an Ag/AgCl reference electrode was employed for all measurements. The test solutions were stirred using a Teflon™-coated stir bar. All measurements were carried out in an MF-1084 glass cell manufactured by BASi. In order to minimize the adsorption of Pb2+ to the cell walls, the following cleaning and deactivating procedure was developed. The glass cell was washed first with Alkonox™ and then exhaustively rinsed with distilled water. The vessels were then soaked in concentrated nitric acid and again rinsed with distilled water and oven-dried at 110 °C. In order to minimize the adsorption of metals, the vessel was salinized by immersion in 5% dichlorodimethylsilane in toluene for approximately one hour. The vessel was then rinsed with methanol and dried at 40 °C. The cleaning and deactivation of the glass cell was repeated before each titration.
2.3. Voltammetry
A 15.0-mL aliquot of sample was placed into the cleaned and salinized glass titration vessel. A 1.0-mL aliquot of 0.1-M buffer was added, and the sample was placed on the “cell stand” and purged for 15 min before starting the titration experiment. Pb2+ stock solutions used for titrations were in the concentration range of 10 ppm to 1000 ppm. Alternatively, humic acid solutions were prepared in 100-mM buffer solutions. A 15-mL aliquot of this solution was placed in the cell and purged with nitrogen before measurements were initiated.
Most of the measurements for this study were performed using DPP. With the DPP, fixed voltage pulses were superimposed on a linear potential ramp [14]. The resulting current at the mercury drop electrode was sampled before the pulse and after the pulse. The difference in these two currents was plotted against the applied potential, resulting in an experimental voltammogram. The voltammogram consists of a current peak that is proportional to the concentration of the metal cation or the metal complex being reduced. The DPP peak position (Ep) is related to the reduction potential of the metal cation or metal complex. Due to various experimental conditions, and possibly kinetic contributions, Ep will only present an estimate of the thermodynamic reduction potential. In these DPP experiments, the initial voltage was set to −200 mV and the final voltage to −800 mV. The BASi instrument was set to the static dropping mode. A signal from the CHI potentiostat was used to initiate and control the mercury drop formation. The mercury electrode voltage was decreased by 5 mV with each mercury drop. For most measurements, the differential pulse amplitude was set to −50 mV, and the pulse width was 50 ms, while the sampling time was 10 ms and the pulse period was set to 1 s. The mercury drop size was set to 14 on the BASi console.
2.4. Size Exclusion Chromatography
Size exclusion chromatography (SEC) was performed on an SRI Model 210D HPLC equipped with a Waters Model 401 UV/VIS detector. Separations were performed using a 7.5 mm × 30 cm TSK G2000SW column. The column was protected using a 7.5 mm × 7.5 cm TSK G2000SW guard column. The column eluent was 0.05-M pH 7 phosphate buffer containing 20% methanol. The column flow rate was maintained at 0.500 mL/min. The column was calibrated using polystyrene sulfonate standards (1.2 K, 4.4 K, 14.3 K and 35 K) purchased from American Polymer Standard (Mentor, OH, USA), and 4-hydroxybenzoic acid was used as a low molecular weight marker standard. Chromatograms were recorded at 250 nm and 280 nm. Little difference in the apparent elution times for the humic materials was observed at these two different wavelengths.
3. Results and Discussion
Differential pulse polarography provides estimates of the reduction potentials for metals cations such as Pb2+, Cd2+, Zn2+ and Cu2+ [15]. Our observations indicated that the presence of various ligating small molecules (3,4-dihyroxybenzoic acid and salicylic acid) and humic acids results in a shift in the Ep for Pb2+ to a more negative voltage. The magnitude of these potential shifts increases with increasing concentrations of complex forming ligands.
The shift in the voltammogram peak maximum (Ep) can be understood utilizing an equation originally presented by Lingane [9]. The principle assumption is that the metal cation (M) is complexed by a ligand (L) with the formation of MLp and that this reaction is in rapid equilibrium with a stability constant KL. The equilibrium expression (Equation (1)) is given by:
In Equation (1), fc, fm and fL represent activity coefficients for the complex, the metal ion and the ligand, respectively, and p is the stoichiometric coefficient for the complex. The Lingane equation for apparent reduction potential of the metal complex is given by Equation (2).
The kc and the ka terms are kinetic terms related to the diffusion of the complex in solution and the diffusion of the metal in the mercury electrode, respectively. The term fa represents the activity coefficient of the metal on the mercury electrode. Expanding the Log term (Equation (3)):
For a simple metal ion, the equation reduces to the following (Equation (4)):
The km term is a kinetic term related to the diffusion of the uncomplexed metal in solution. The shift in the peak maximum is the difference in E0′ between the complex metal ion and the simple metal ion in the buffer solution and is given by f, Equation (5).
For low molecular weight complexing agents, the ratio kc/km is likely to be close to one, and the contribution of the activity coefficients to ΔE is also small or, at least, constant. Therefore, the shift in the reduction potential measured by the differential pulse is primarily a function of the stability constant and the ligand concentration (Equation (6)).
The kc/km term may be important for humic substances, as diffusion rates for humic-bound Pb2+ is likely to be slower than for lower molecular weight Pb2+ species [15].
The measurements of Ep made during this investigation can be used to estimate a value for ΔE. If the concentration of the ligand (L) and p are available, it is then possible to estimate the value of KL. If the natural abundance and stoichiometry of the complexing groups on the humic material were well-characterized, it would be possible to estimate the magnitude of the stability constant for a complex formation for Pb2+ with the humic material. It is tempting to use the dissociable proton content of humic materials as an estimate of the abundance of complexing groups; however, past research has indicated that not all of these groups are available to complex metals [3,16,17]. Furthermore, many of the humic substance-binding sites are likely to be multidentate, and some binding may involve the nonspecific accumulation of counter ions in the vicinity of the negatively charged humic substance [3,18,19,20].
Using the stability constants imbedded in Visual Minteq [21] and the conditions of these experiments, we calculated the speciation of Pb2+. At pH 8, and in the absence of humic matter, Pb2+ would exist primarily as Pb2+, PbOH+ and Pb(OH)2 (44.7%, 53.9% and 1.31%), respectively. The HEPES, MOPS and PIPES buffering agents utilized were selected because of their minimal interactions with metal species and should not impact this distribution [22]. The shift in Ep that we measured represents a change in Pb2+ speciation, where there is some hydrolysis to a ligated form of Pb2+. The ligated species may be mono- or multidentate and could involve mixed ligand complexes as well.
The differential DPP method was tested with two low molecular weight humic acid analogs (3,4-dihydroxybenzoic acid and salicylic acid) and a polyacrylic acid sample of 5100 g/mol. The carboxylic acid and phenol functionalities on these compounds are similar to the ligating functionalities on humic materials [23,24,25].
3,4-dihydroxybenzoic acid was utilized in this study as a proxy for humic materials. The effect of this organic acid on the reduction of Pb2+ (2–10 uM) was examined at three different pH values, and the results are presented in Figure 1. The concentration of 3,4-dihydroxybenzoic acid was 1.25 mM for all of these measurements. This ligand has been reported to react with various metals through the ring hydroxyl groups [26]. The pH of the solution was maintained with 1 mL of buffer in 15 mL of sample. The impact of this ligand and pH on the reduction of Pb2+ is clear. The pH 5 sample showed minimal shift from the reduction potential of uncomplexed Pb2+, and the observed Ep was very close to a ligand-free buffer solution. Measurements at pH 6.15 and 7.84 showed a shift toward a more negative voltage. The greater shift for the pH 7.84 measurements was consistent with the increased ionization of the ring hydroxyl groups, making a complex formation more favorable. On the other hand, Khayat et al. [27] examined the interaction of 3,4-dihydroxybenzoic acid and Pb2+ using a potentiometric approach at much higher Pb2+ and ligand concentrations. In their study, a precipitate was formed at pH 3 to 4.5 that appeared to be consistent with the formation of a complex through the ionized carboxylic acid group. Khayat et al. [27] did note that the precipitate appeared to dissolve at a higher pH, with the possible formation of a strong complexation through the phenolic groups.
Salicylic acid has been used by other investigators as a low molecular weight humic acid analog [23,24,25]. The effect of salicylic acid on the reduction of lead was, therefore, investigated. Since the sodium salicylate is fairly soluble, it was possible to vary the concentration over a fairly large concentration range and, therefore, test the prediction of the Lingane equation.
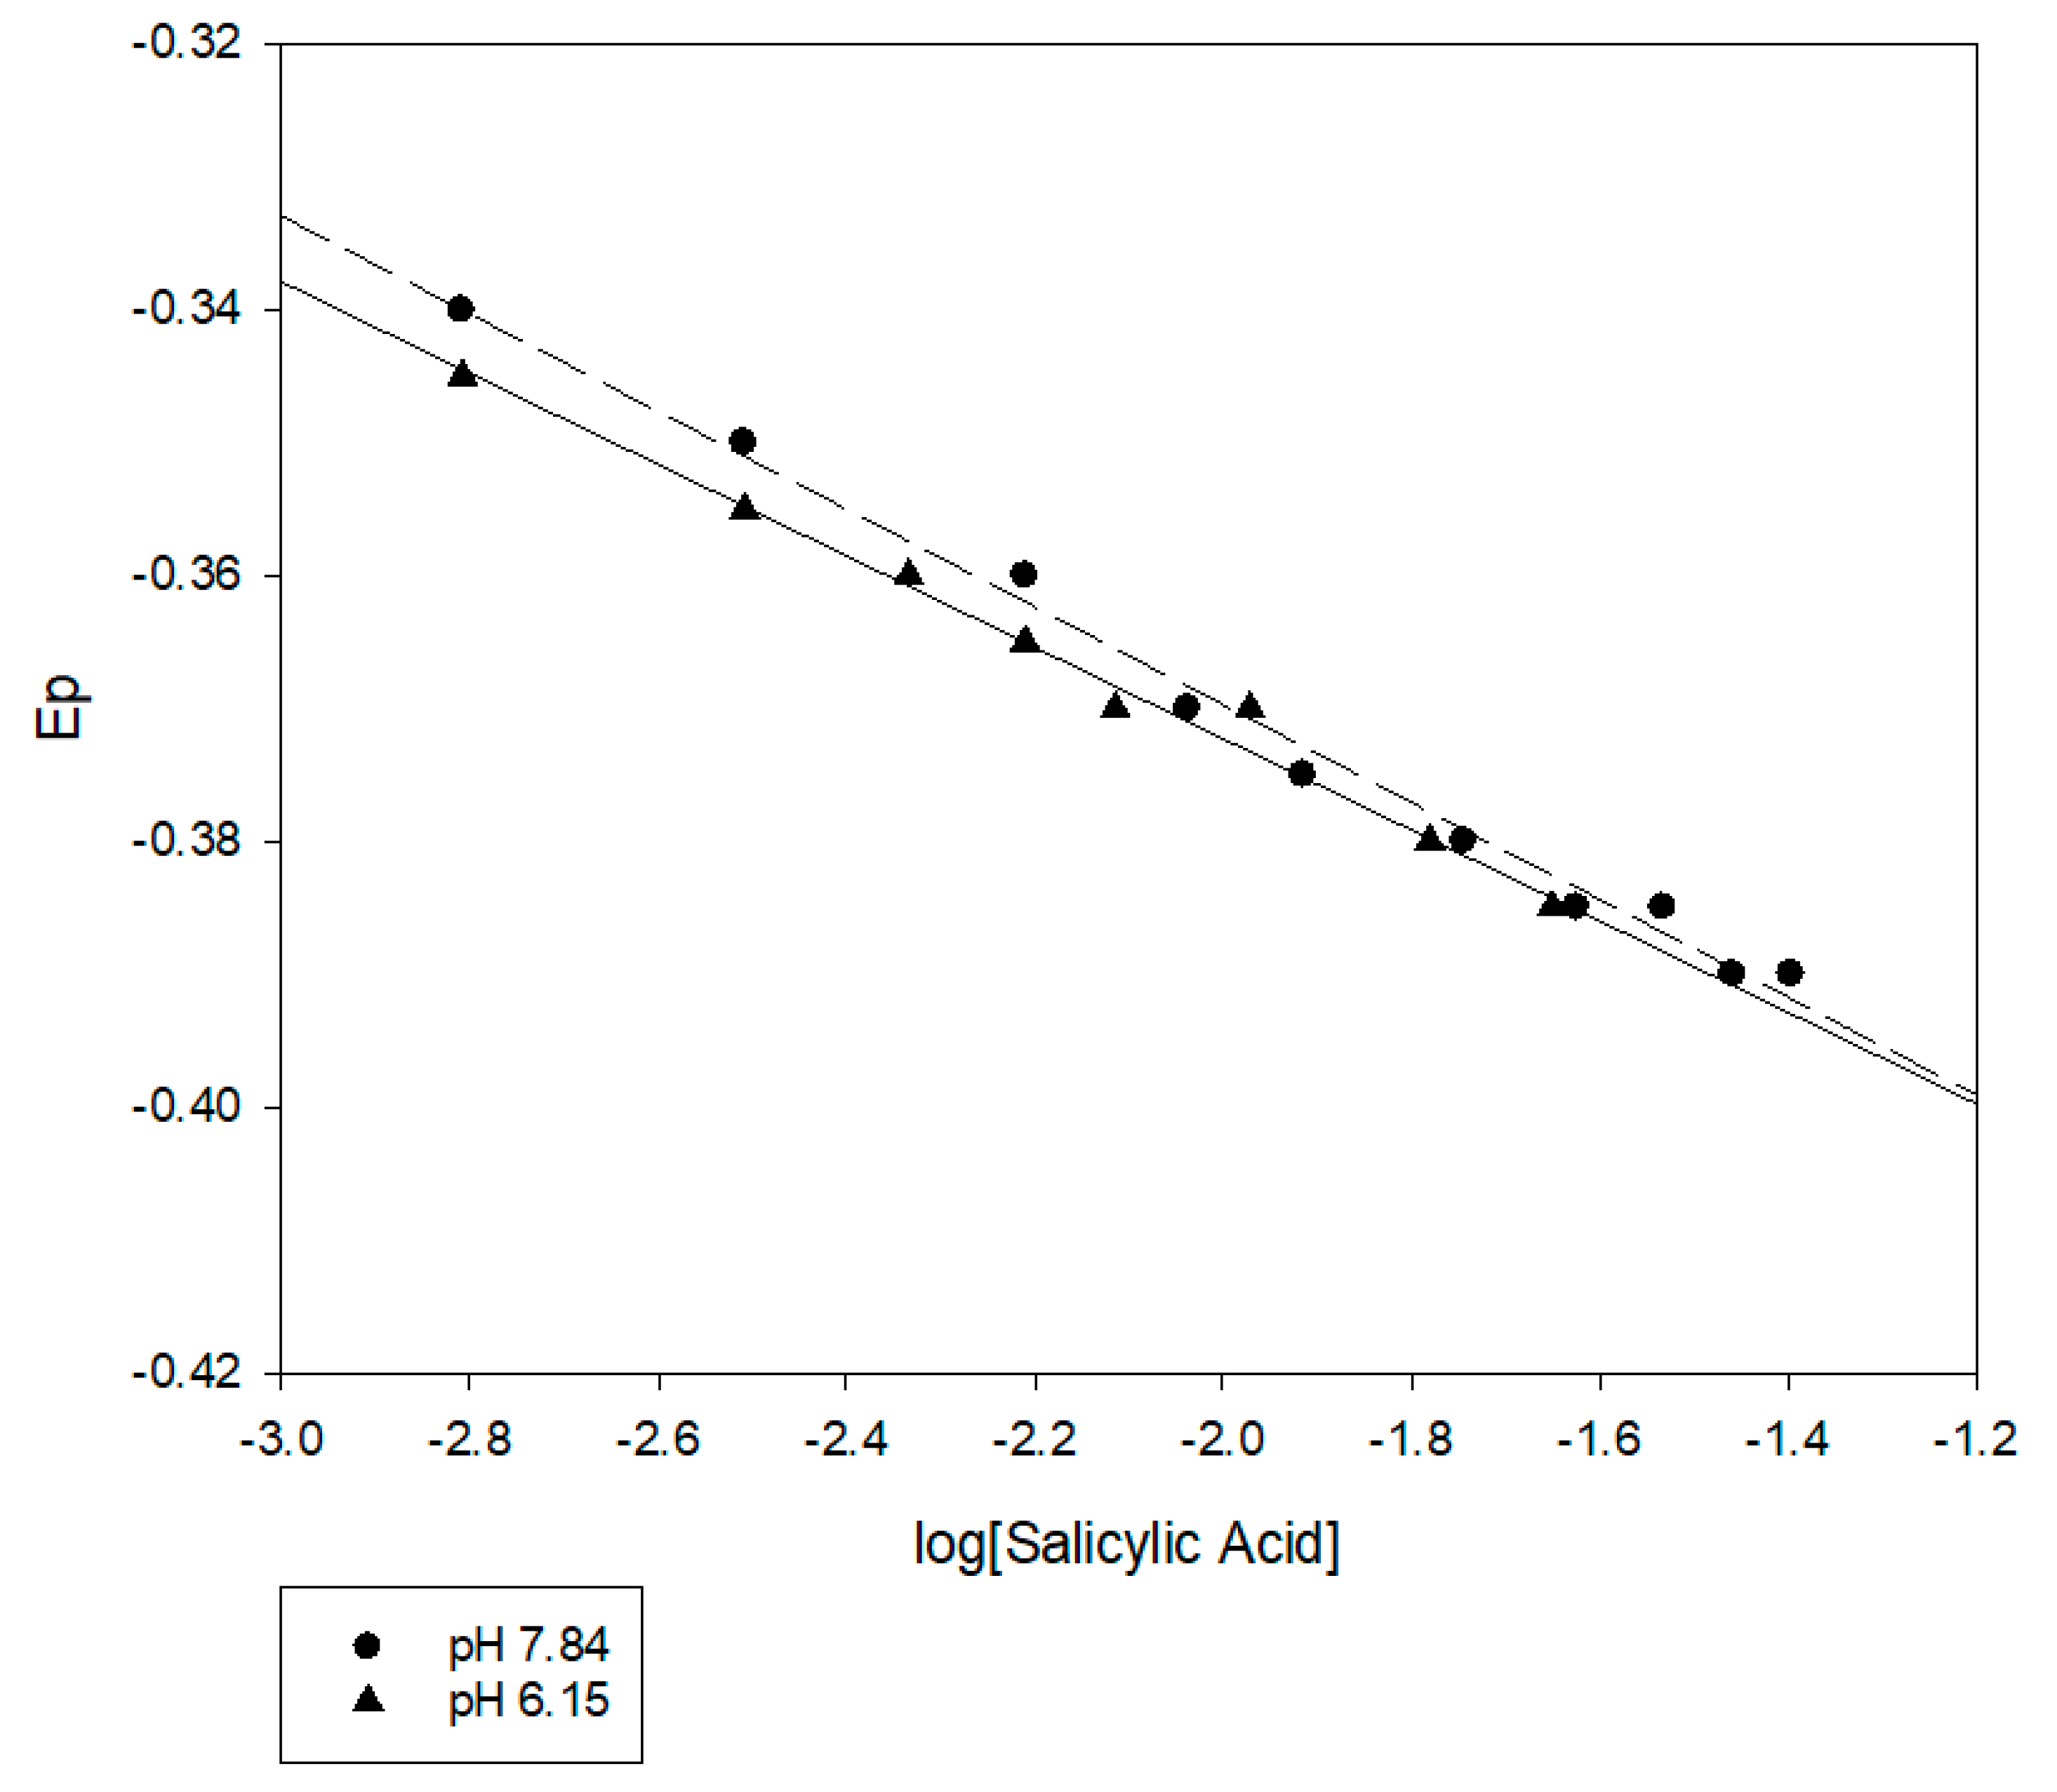
Measurements at two different pH values are summarized in Figure 2 and illustrate that the salicylate complexation can shift the reduction potential for Pb2+ to more negative values. It is interesting that the Ep at pH 6.15 and 7.84 are very close. This observation possibly indicates that the phenolic hydroxyl group of salicylic acid does not ionize when the Pb2+ salicylate (Sal) complex forms. The shift in the Ep increased with the logarithmic concentration of salicylic acid in the solution, as predicted by the Lingane equation. The slopes of the two lines are 34.4 and 36.8 mV/log (Sal), respectively. This differs from the slope predicted by the Nernst equation (29.6 at 25 °C) but is still reasonably close. There are very few measurements of the stability constants between salicylate and Pb2+ in the literature. Furia and Porto [28] investigated the interaction of Pb2+ with hydrogen salicylate using potentiometric titration. These investigators measured the stability constants at a rather high ionic strength (3-M KClO4) and extrapolated the constant to 0 ionic strength. Their results indicated that, at pH 7.84, PbSal and Pb(Sal)22− should be the dominant species. Using the Furia and Porto [28] stability constants and a variant of the DeFord Hume equation [29,30,31], which is similar to the Lingane equation, we calculated that the shift in reduction potential should be closer to a factor of two times greater at pH 7.84 than what we observed. Furthermore, there should be a significant difference between pH 6.15 and pH 7.84. The calculation indicated that the shift for pH 7.84 should be about four times greater than for pH 6.15. Clearly, the salicylate ligation of Pb2+ requires additional investigation.
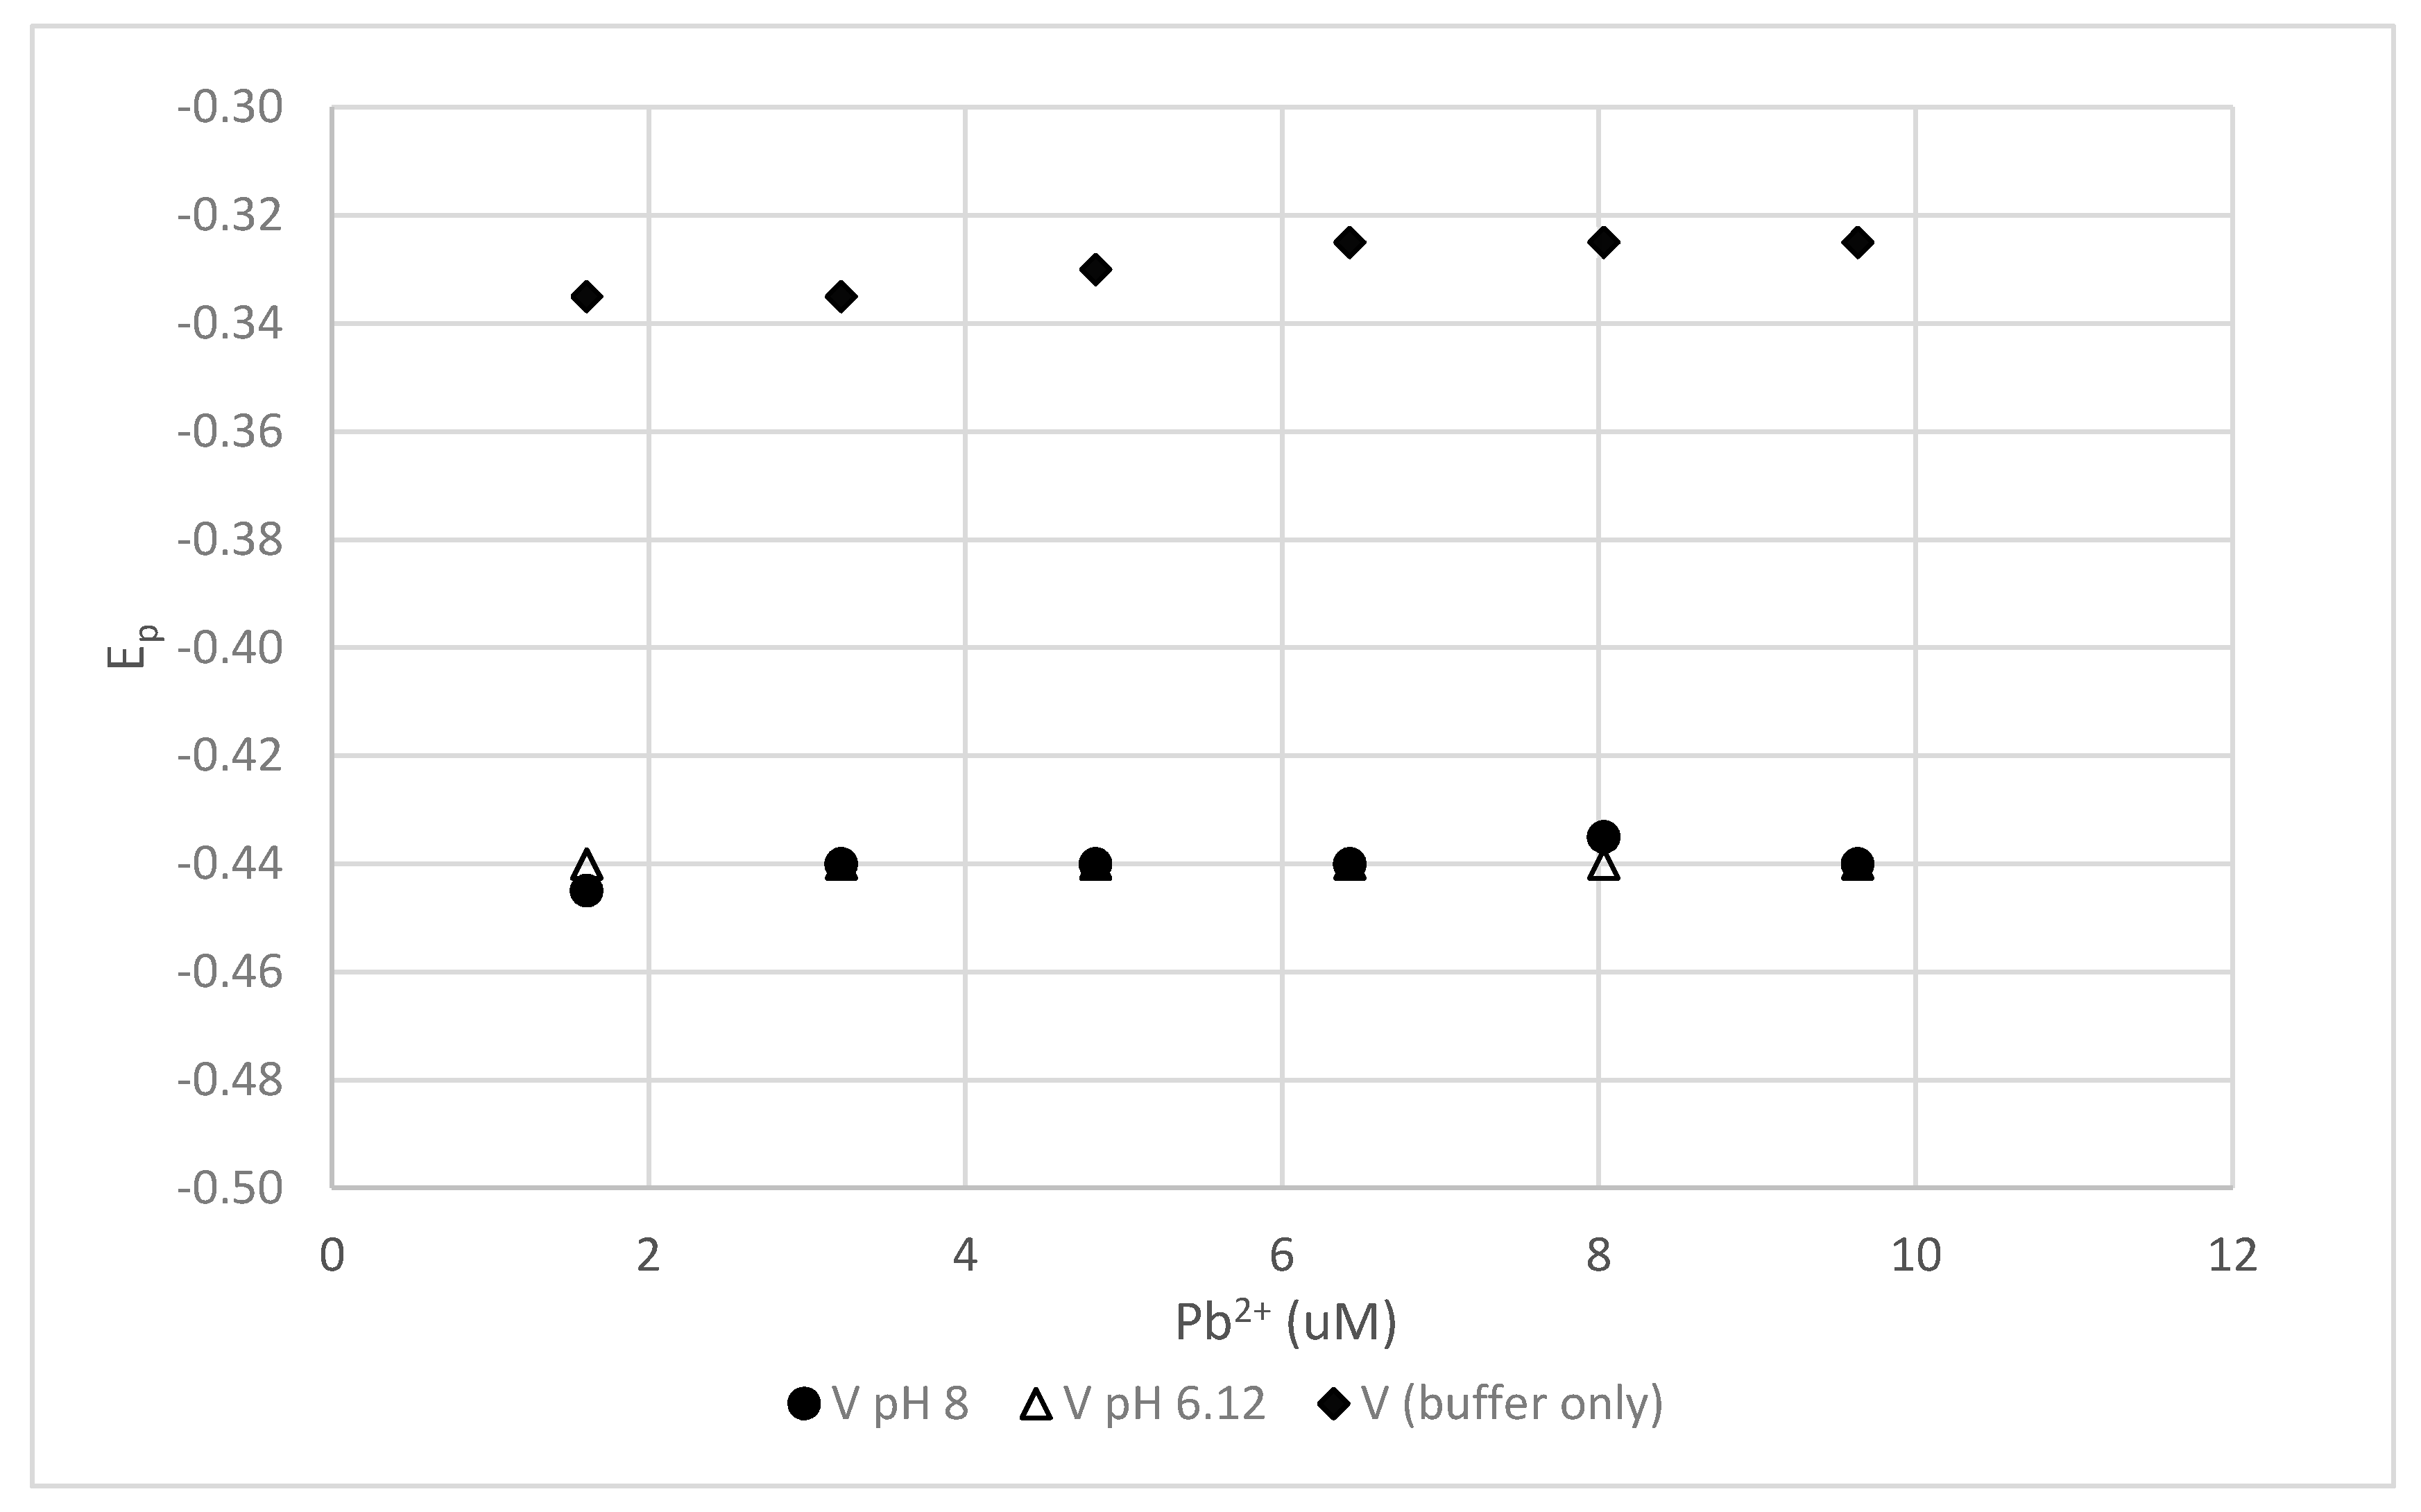
Previous workers have considered polycarboxylic acids to be viable models for humic substances and have examined the interaction of metal cations with polycarboxylic acids of various molecular weights [32]. In recent years, this polymer view of humic substances has been challenged by several groups [33,34]. Nevertheless, we examined the interaction of Pb2+ with 100-mg/L sodium polyacrylate of 5100 g/mol at both pH 6.12 and pH 8. The results presented in Figure 3 show little difference between the two pH values. In addition, the presence of the 1-M NaNO3 background electrolyte made little difference in the negative shift of the Pb2+ reduction peak (results are not shown).
The small difference in results for the two pH values may indicate that there is little change in the ionization of the carboxylate groups between pH 6 and 8. The carboxylate concentration of the polyacrylate should be about 10.6 mM/g. This is somewhat larger than the carboxylate concentrations of the humic acids examined in this study but not largely so. The lack of pH dependence probably results from the absence of phenolic groups in polyacrylate.
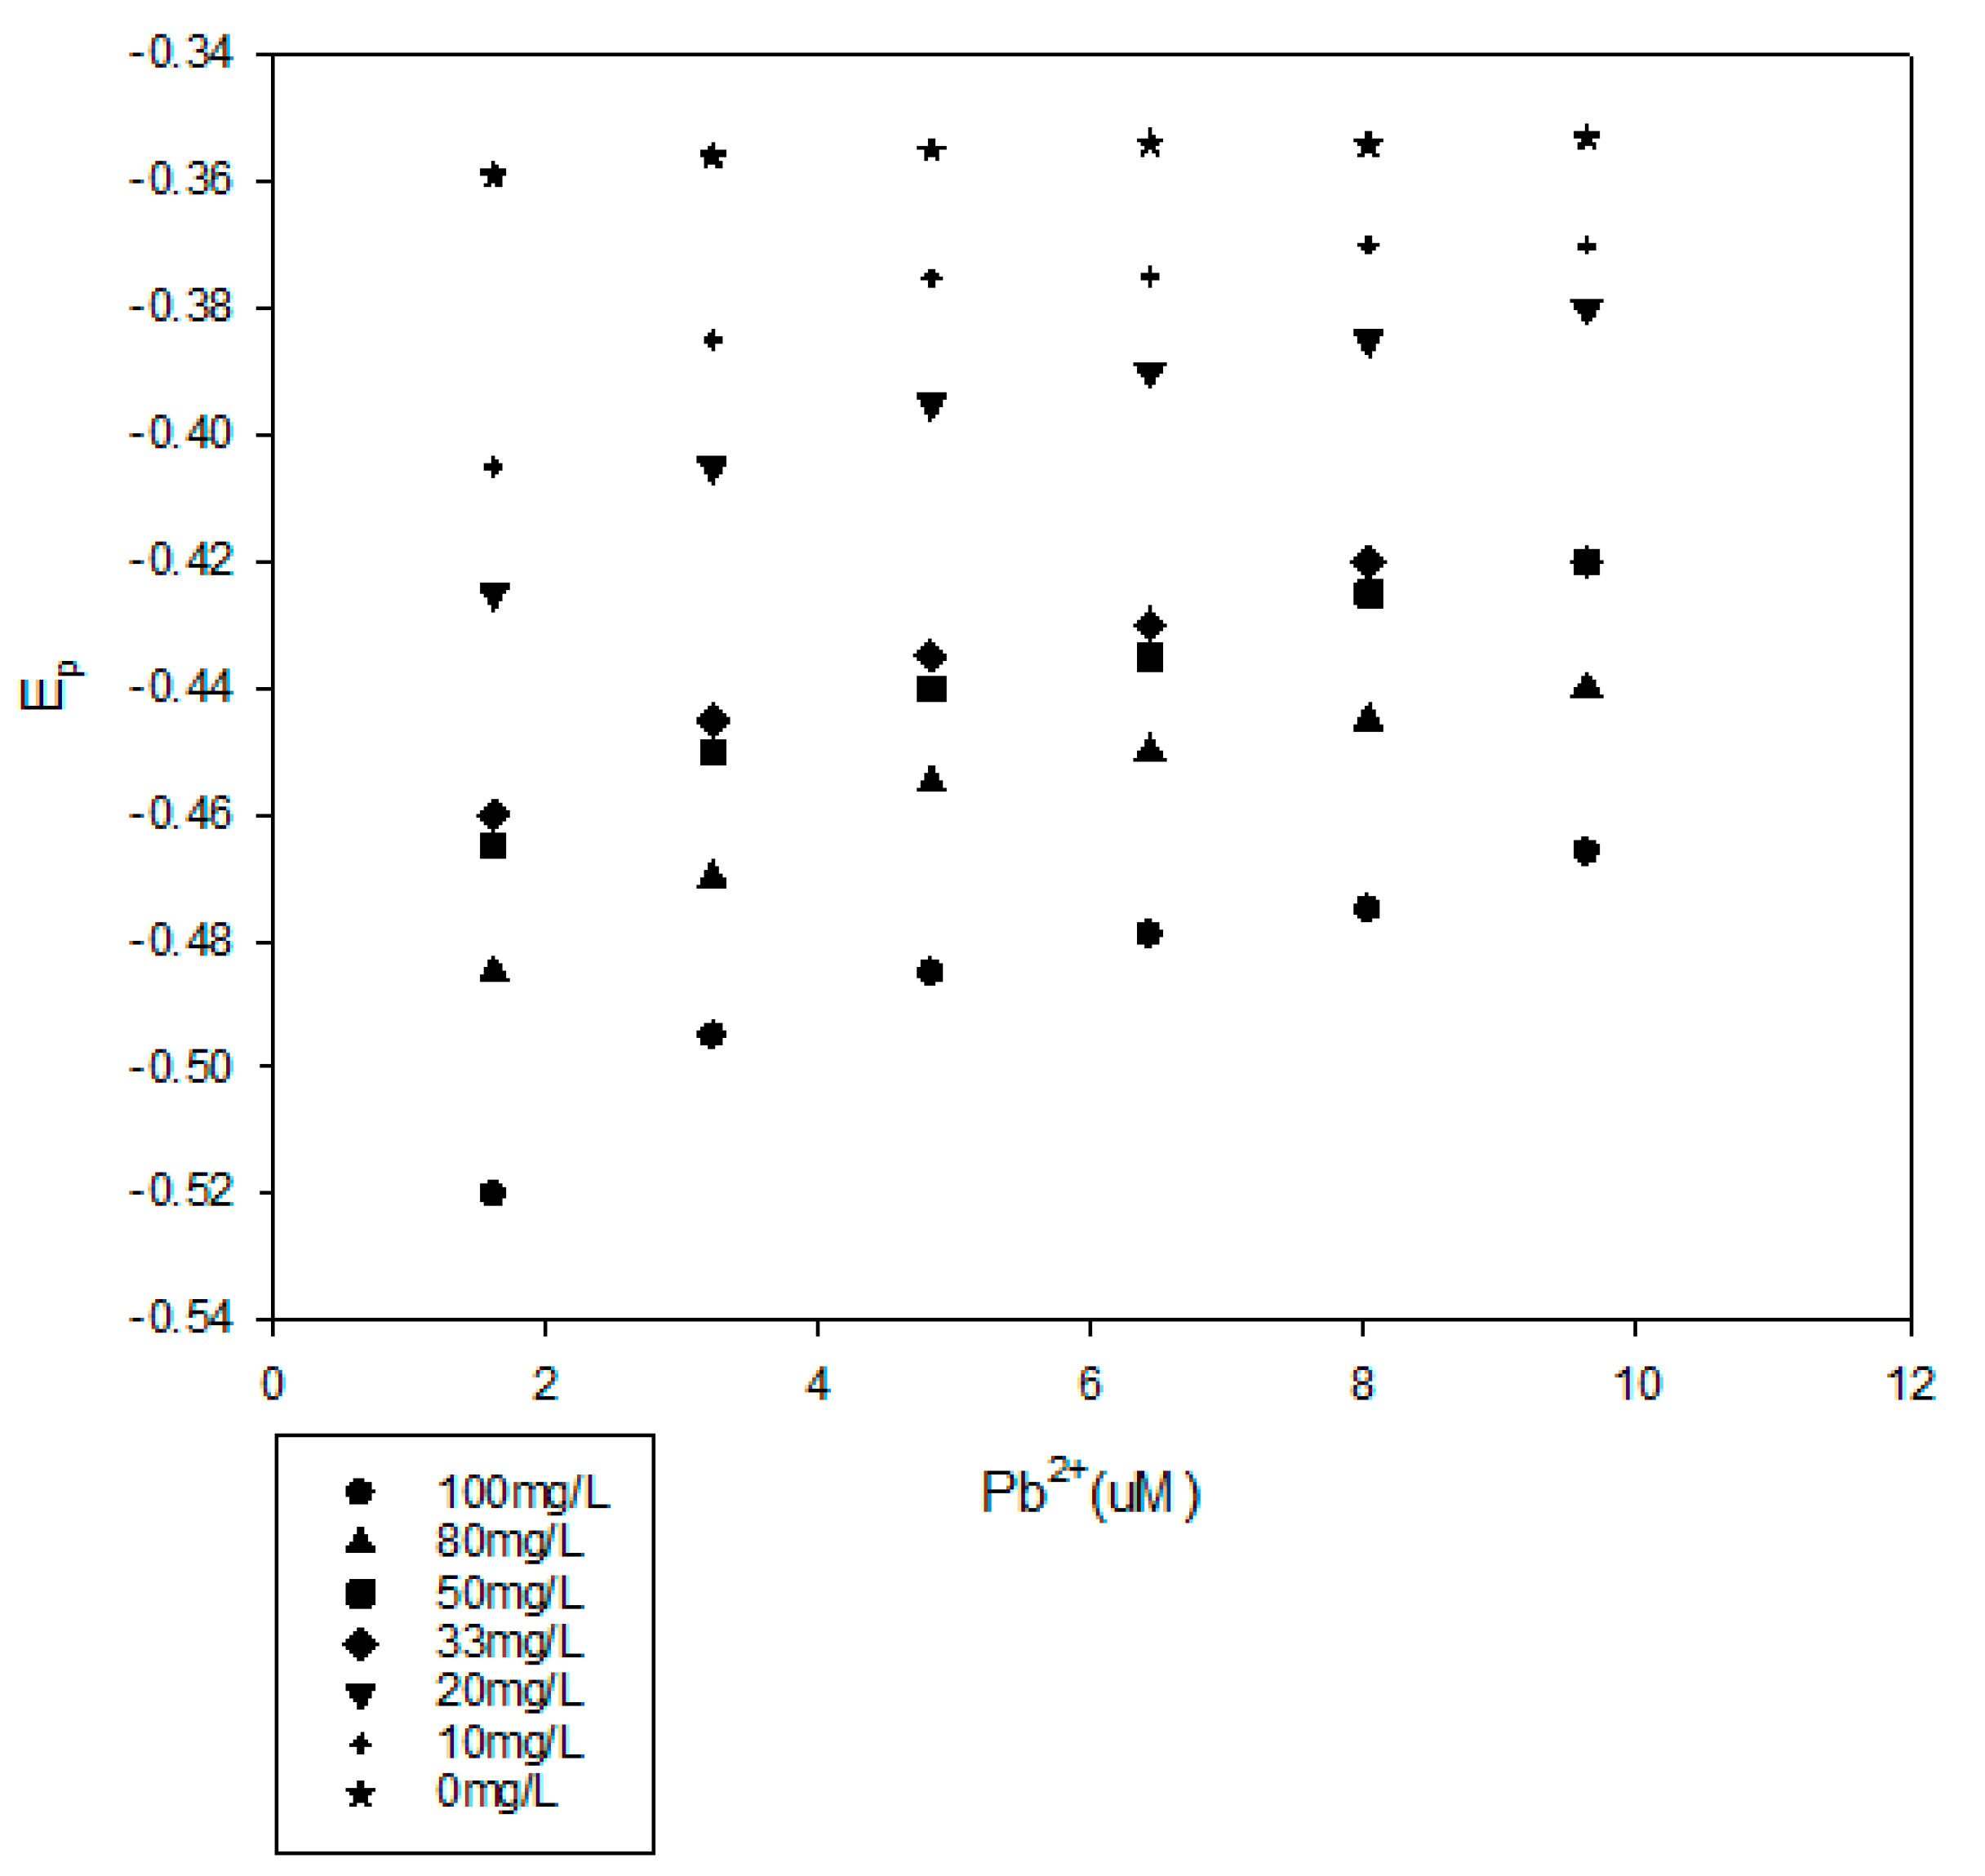
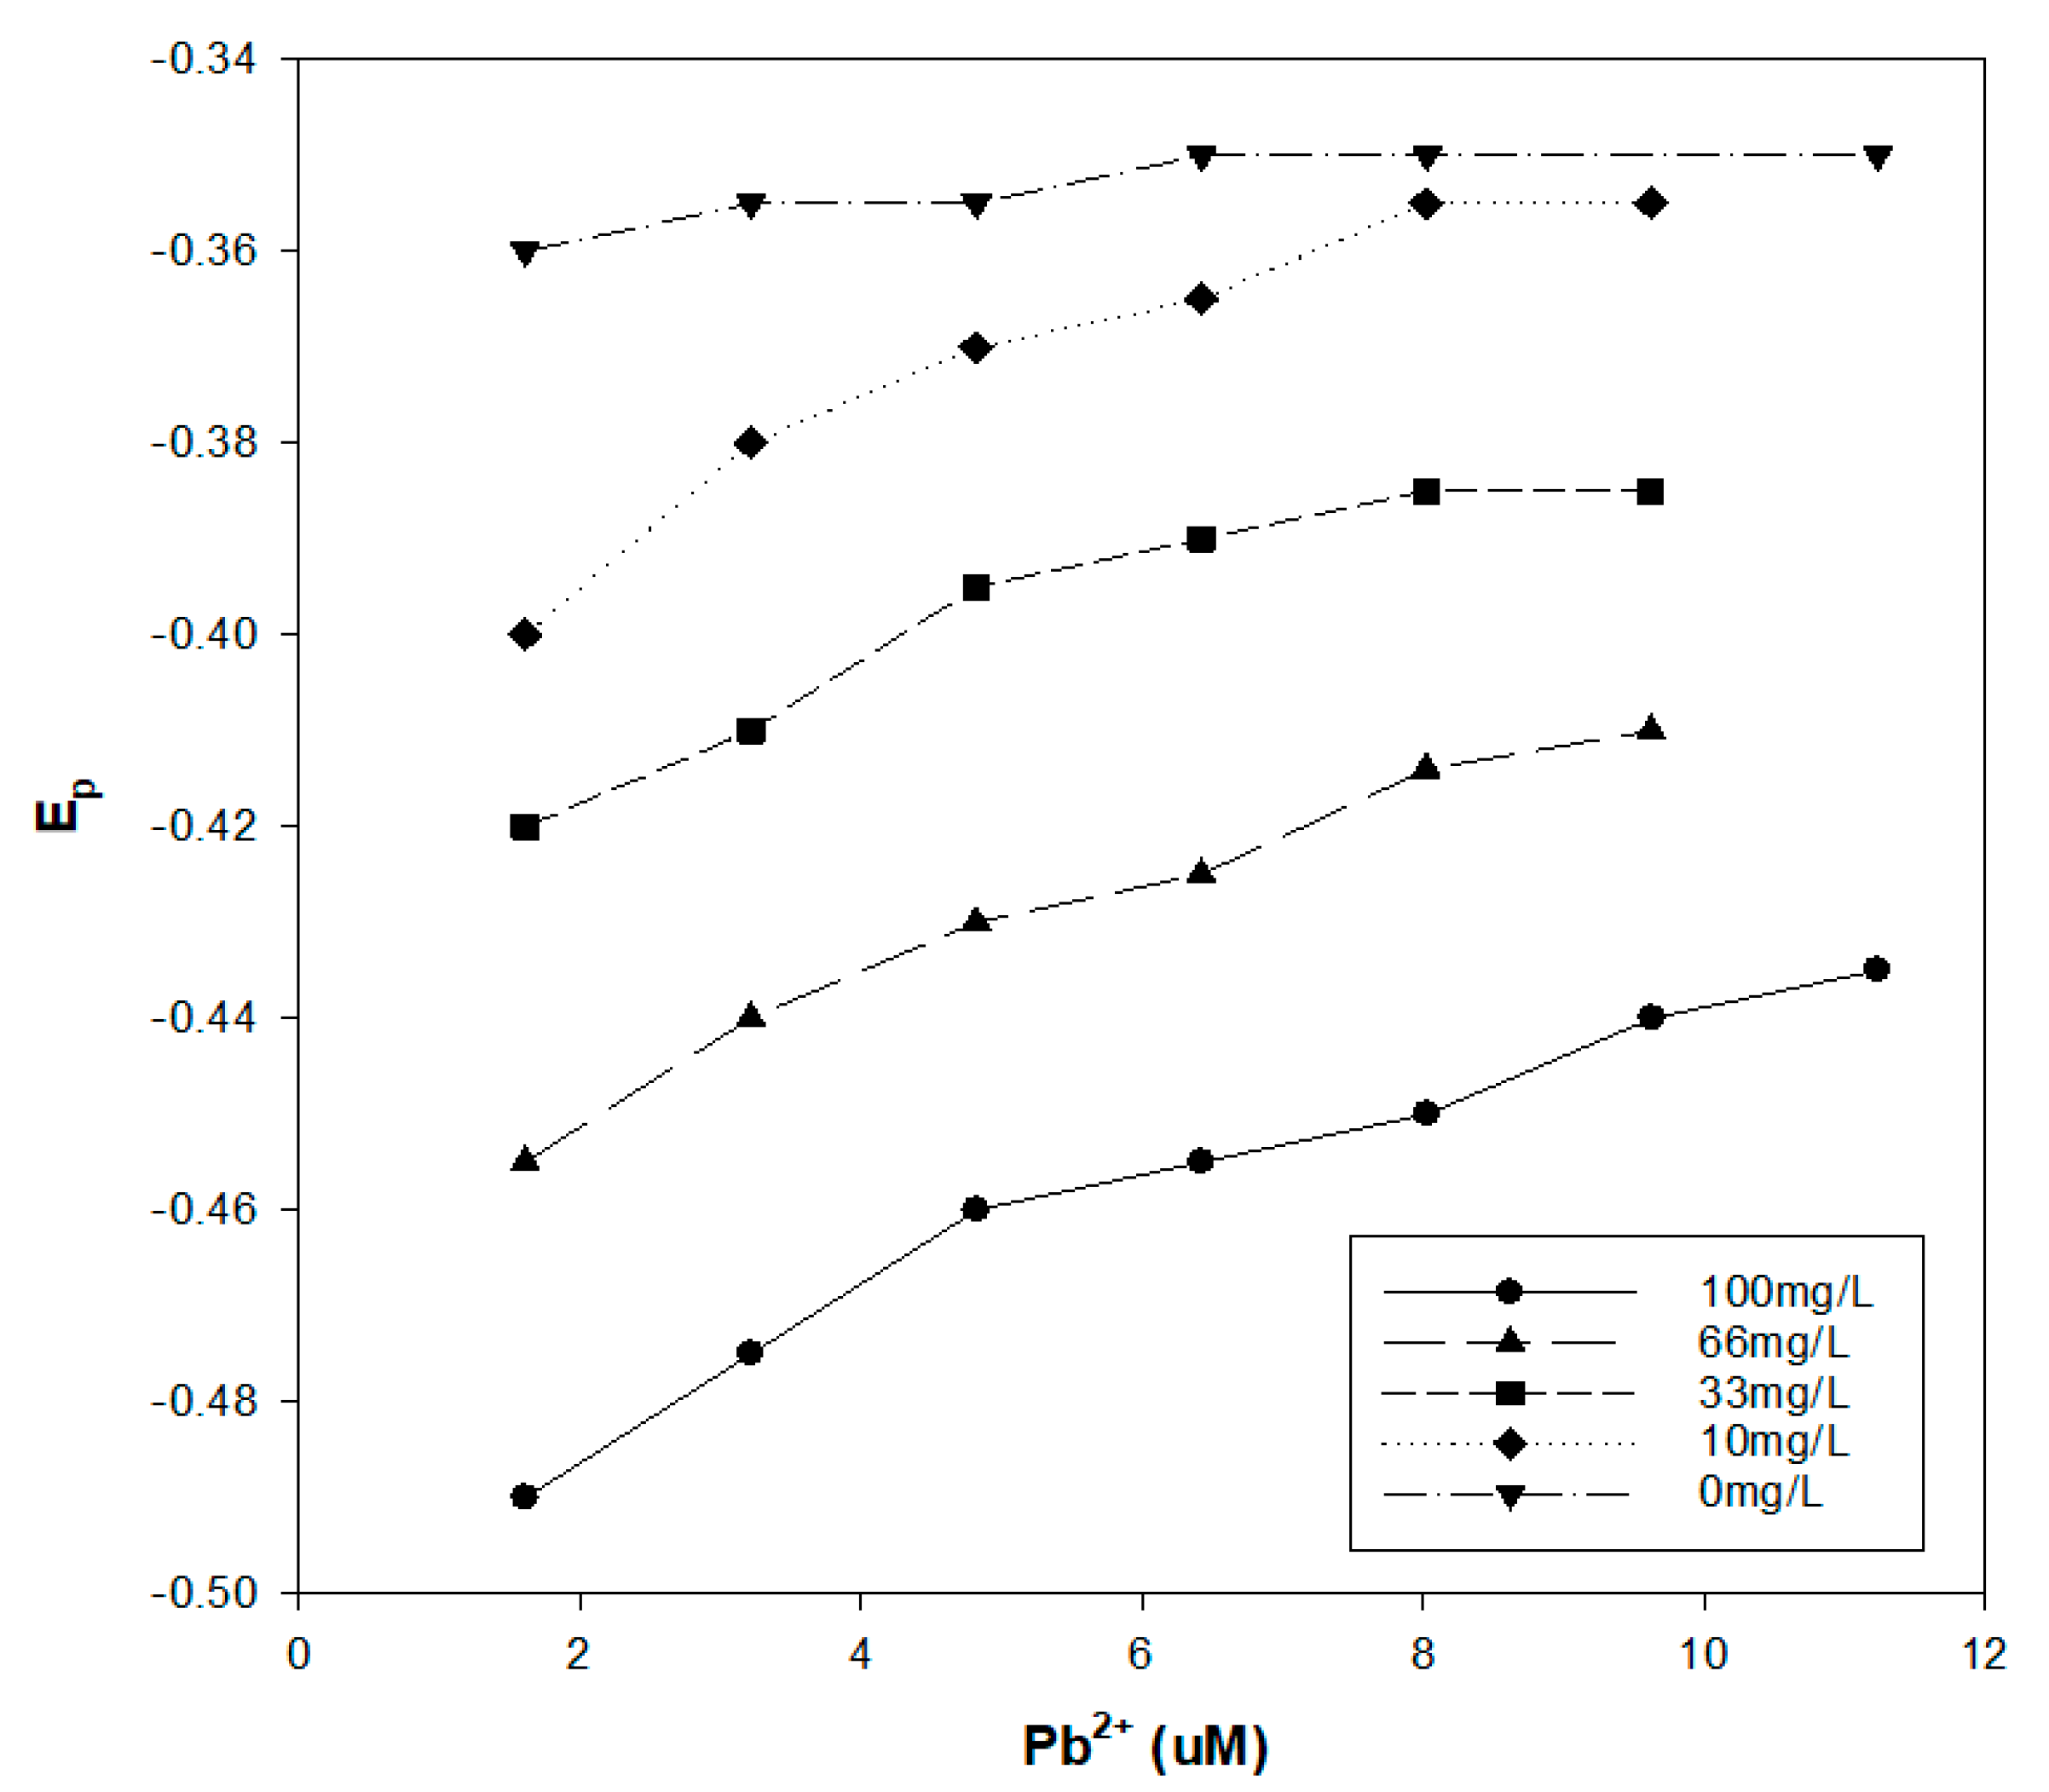
The Pahokee peat humic acid and Pb2+ interaction was examined at four different pH values and at different Pb2+ concentrations. The Pahokee peat humic acid concentration was 100 mg/L, and the results are presented in Figure 4. As expected, the impact of humic acid on the Ep for Pb2+ increased with the pH, which increased the ionization of the humic acid and the availability of metal complexing ligands. It was also noted that the shift in Ep decreased as the Pb2+ concentration in the solution was increased. This concentration dependence for Ep indicates that there is a spectrum of binding interactions of Pb2+ with the humic material, with the more stable complexes formed at low Pb2+ concentrations. We also observed that the shift in the Ep was a function of the concentration of humic acid (Figure 5).
These experiments with the Pahokee peat humic acid were conducted at pH 8 in a 0.100-M HEPES buffer with 1.0-M NaNO3 as a background electrolyte. These results illustrate that the shift in reduction potential for the Pb2+ humic acid complex is a function of the humic acid concentration. These results are plotted in Figure 6 as a function of the Log of the humic acid concentration in mg/L for three different Pb2+ concentrations. The linearity of these plots conforms to the general form of the Lingane equation.
A similar observation is illustrated in Figure 7 for Pb2+ in the presence of a commercially available TeraVita leonardite humic acid. These experiments were conducted at pH 8 in 0.100-M HEPES buffer with 1.0-M NaNO3 as a background electrolyte. It is clear that the shift of the reduction potential for Pb2+ is a function of the humic acid concentration.
In Figure 8, the Ep values for Pb2+ in the presence of various humic acids, at a concentration of 100 mg/L, at pH 8 are compared. The HEPES buffer was 0.100 M, and the NaNO3 was 1.00 M. The results indicate the greatest shift in the Pb2+ reduction potential was observed for the Elliot soil humic acid samples, and the lowest shift was observed for the Suwannee River natural organic matter. The two leonardite samples displayed roughly the same behavior. For all of the humic acids, the Ep shifts a more negative voltages at lower Pb2+ concentrations. The Ep for the various humic acids did not correlate with the average molecular weight or IHSS carboxylic acid and phenolic hydroxyl contents. For example, according to results published by the IHSS, the Suwanee River NOM had the highest phenolic content yet exhibited the least negative Pb2+ reduction potentials [35].
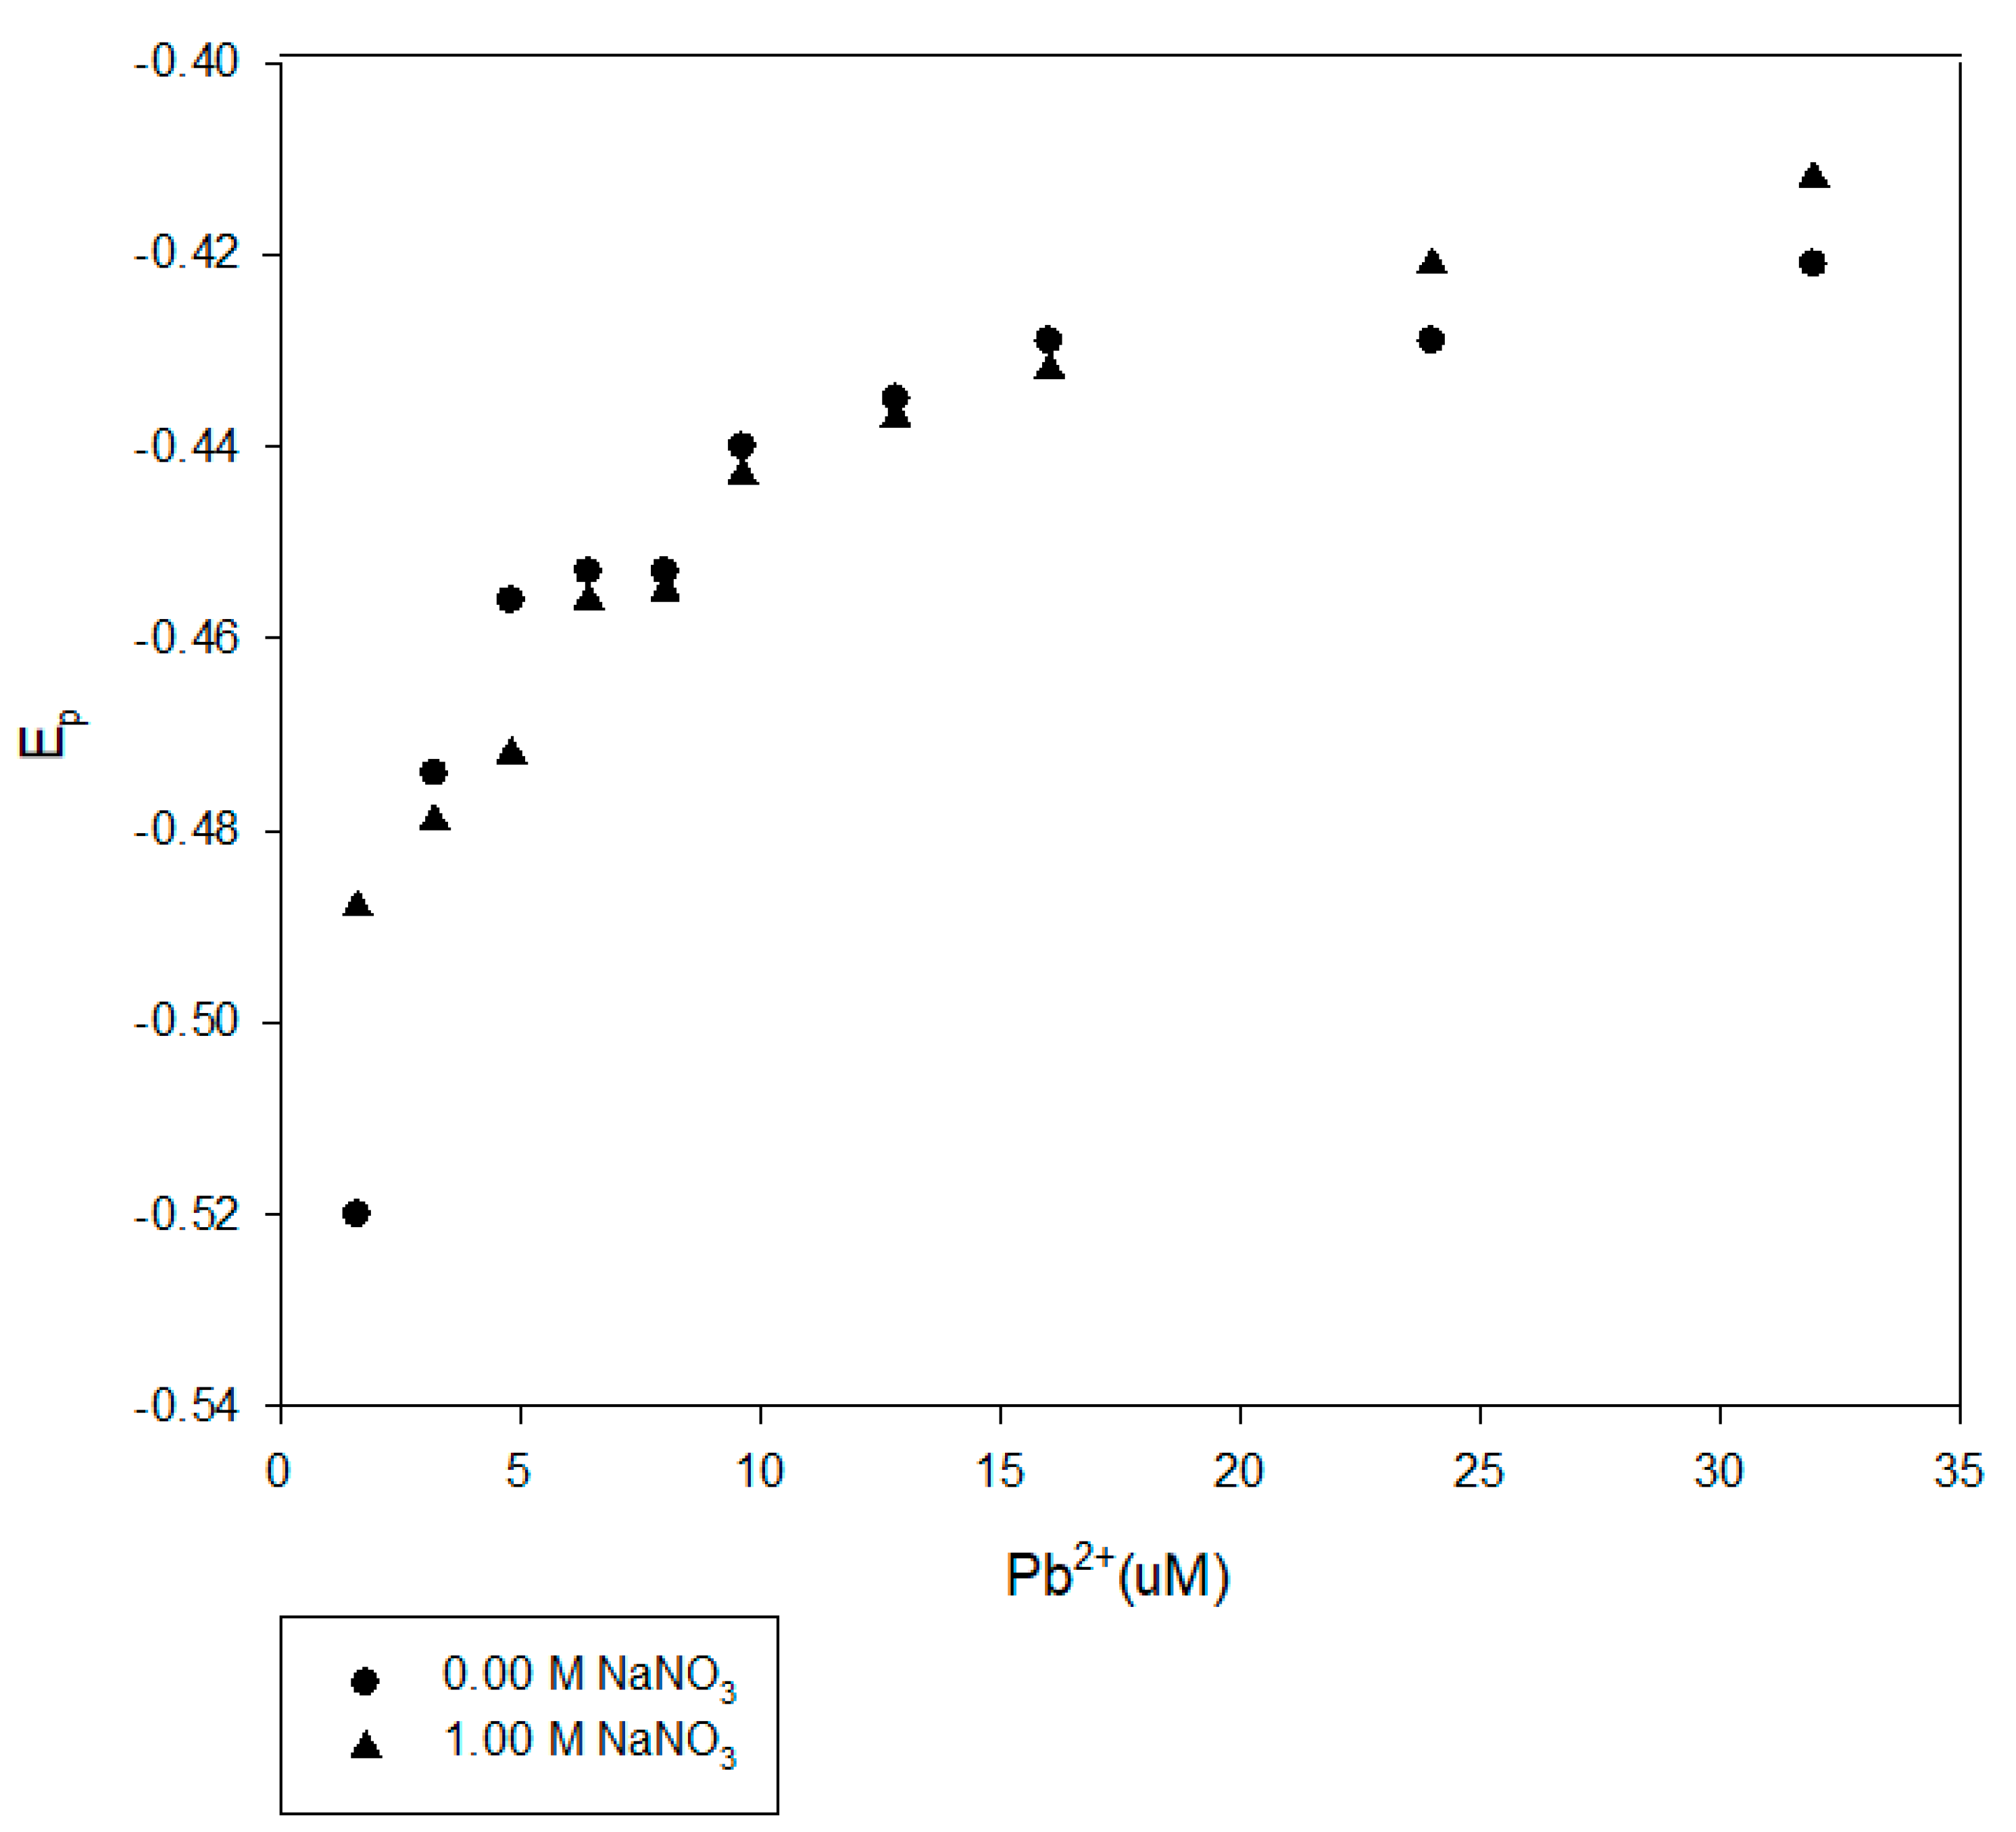
We further examined the impact of the 1.0-M NaNO3 background electrolyte on the DPP reduction potentials. We compared the results for the Elliot soil humic acid, the Suwannee River NOM and the IHSS leonardite with and without 1.0-M NaNO3 in Figure 9, Figure 10 and Figure 11. The presence of the background electrolyte did not induce a major difference or consistent impact on the reduction potentials.
Our previous work investigated the impact of soluble organic matter in arid soil extracts on copper speciation [13]. DPP results for Pb2+ in a water extract from a soil sampled from the root zone of a creosote bush is shown in Figure 12. The location of this soil was from a roadside site located in Halloran Springs, California, USA. This soil was discussed in Steinberg and Hodge [13]. The total organic carbon content of this soil sample water extract was measured at 35 mg/L. Assuming that humic material is approximately 50% carbon indicates that this extract would have approximately 70-mg/L humic material. This creosote soil extract was examined using the DPP method. The results are similar to the humic materials examined in this study. The reduction potential of Pb2+ in these soil extracts shows similar pH dependence to that observed in the humic acid solution. In addition, the Ep shift was dependent on the Pb2+ concentration, indicating a heterogeneous distribution of lead binding groups in the extract.
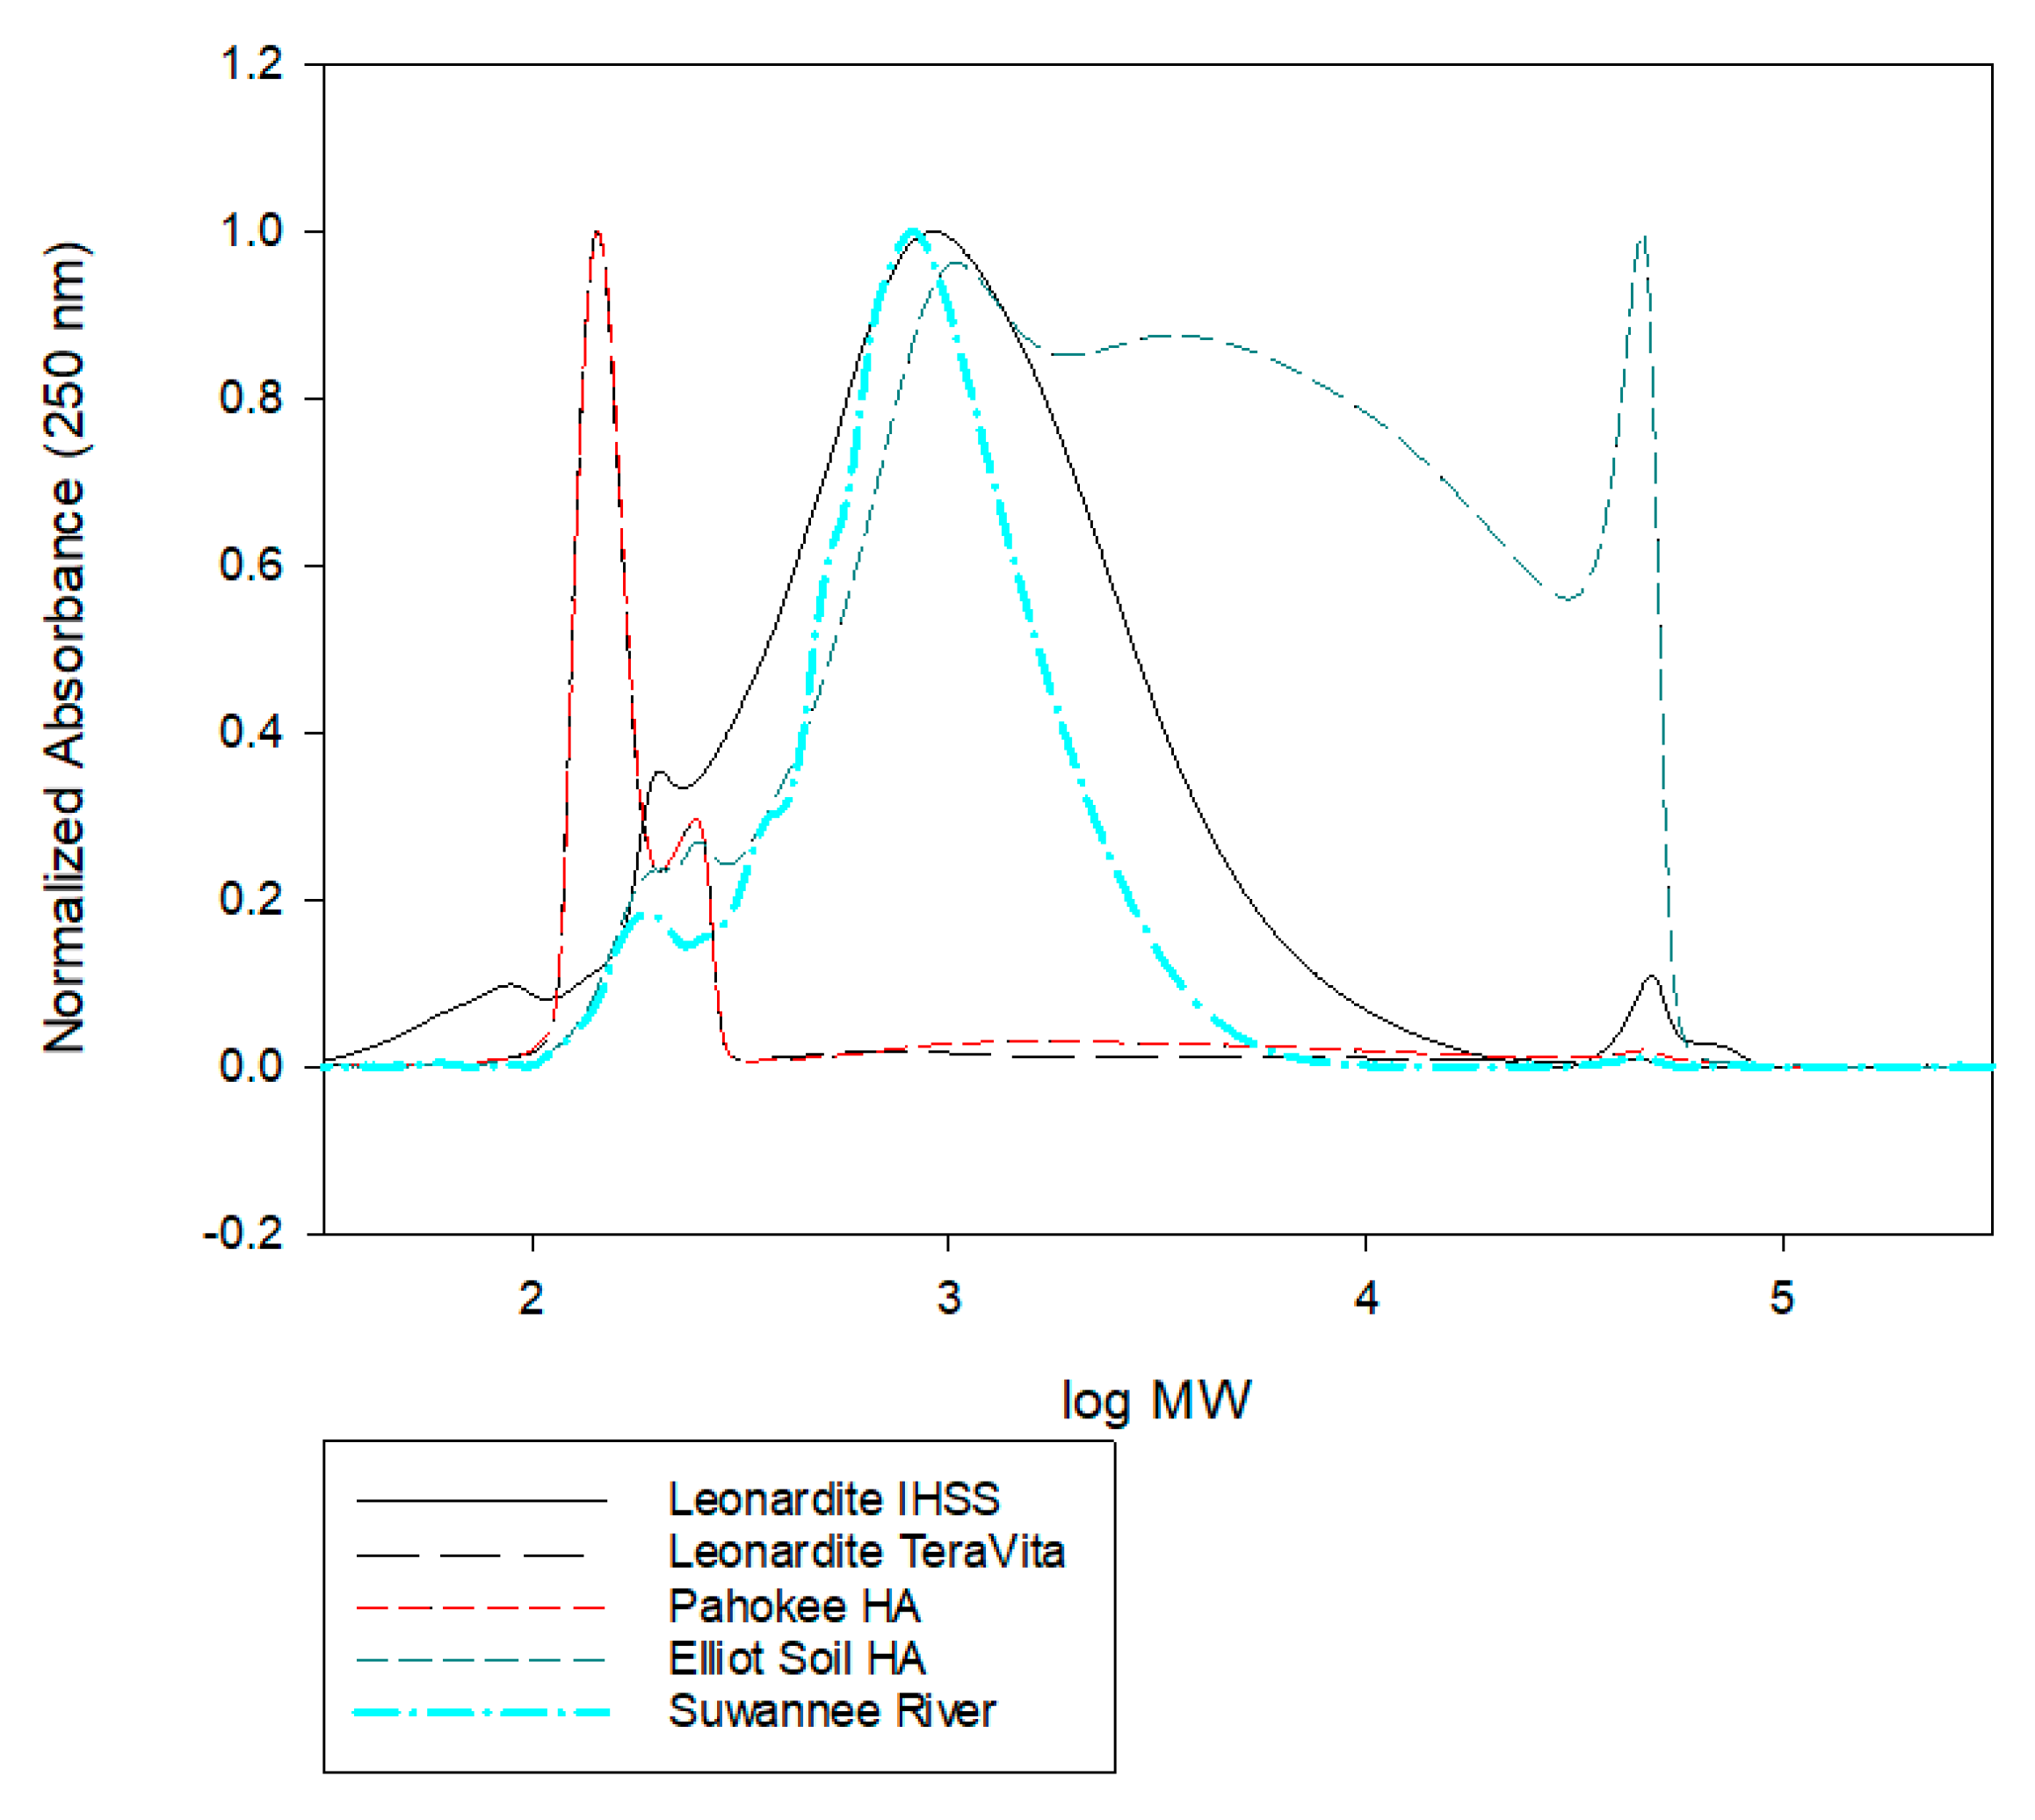
The results from size exclusion chromatography of the various humic materials are shown in Figure 13. The number-averaged (Mn) and weight-averaged (Mw) molecular weights derived from the SEC are tabulated in Table 1. The most striking results are the large differences in number-averaged vs. weight-averaged molecular weights and that all of the samples had rather low average molecular weights and an overall very broad molecular weight distribution. Furthermore, all of the humic materials examined contained a large contribution from low molecular weight components. These observations are consistent with the results of other studies [36,37,38]. The Ep results did not show any apparent correlation with Mn or Mw of the humic substance.
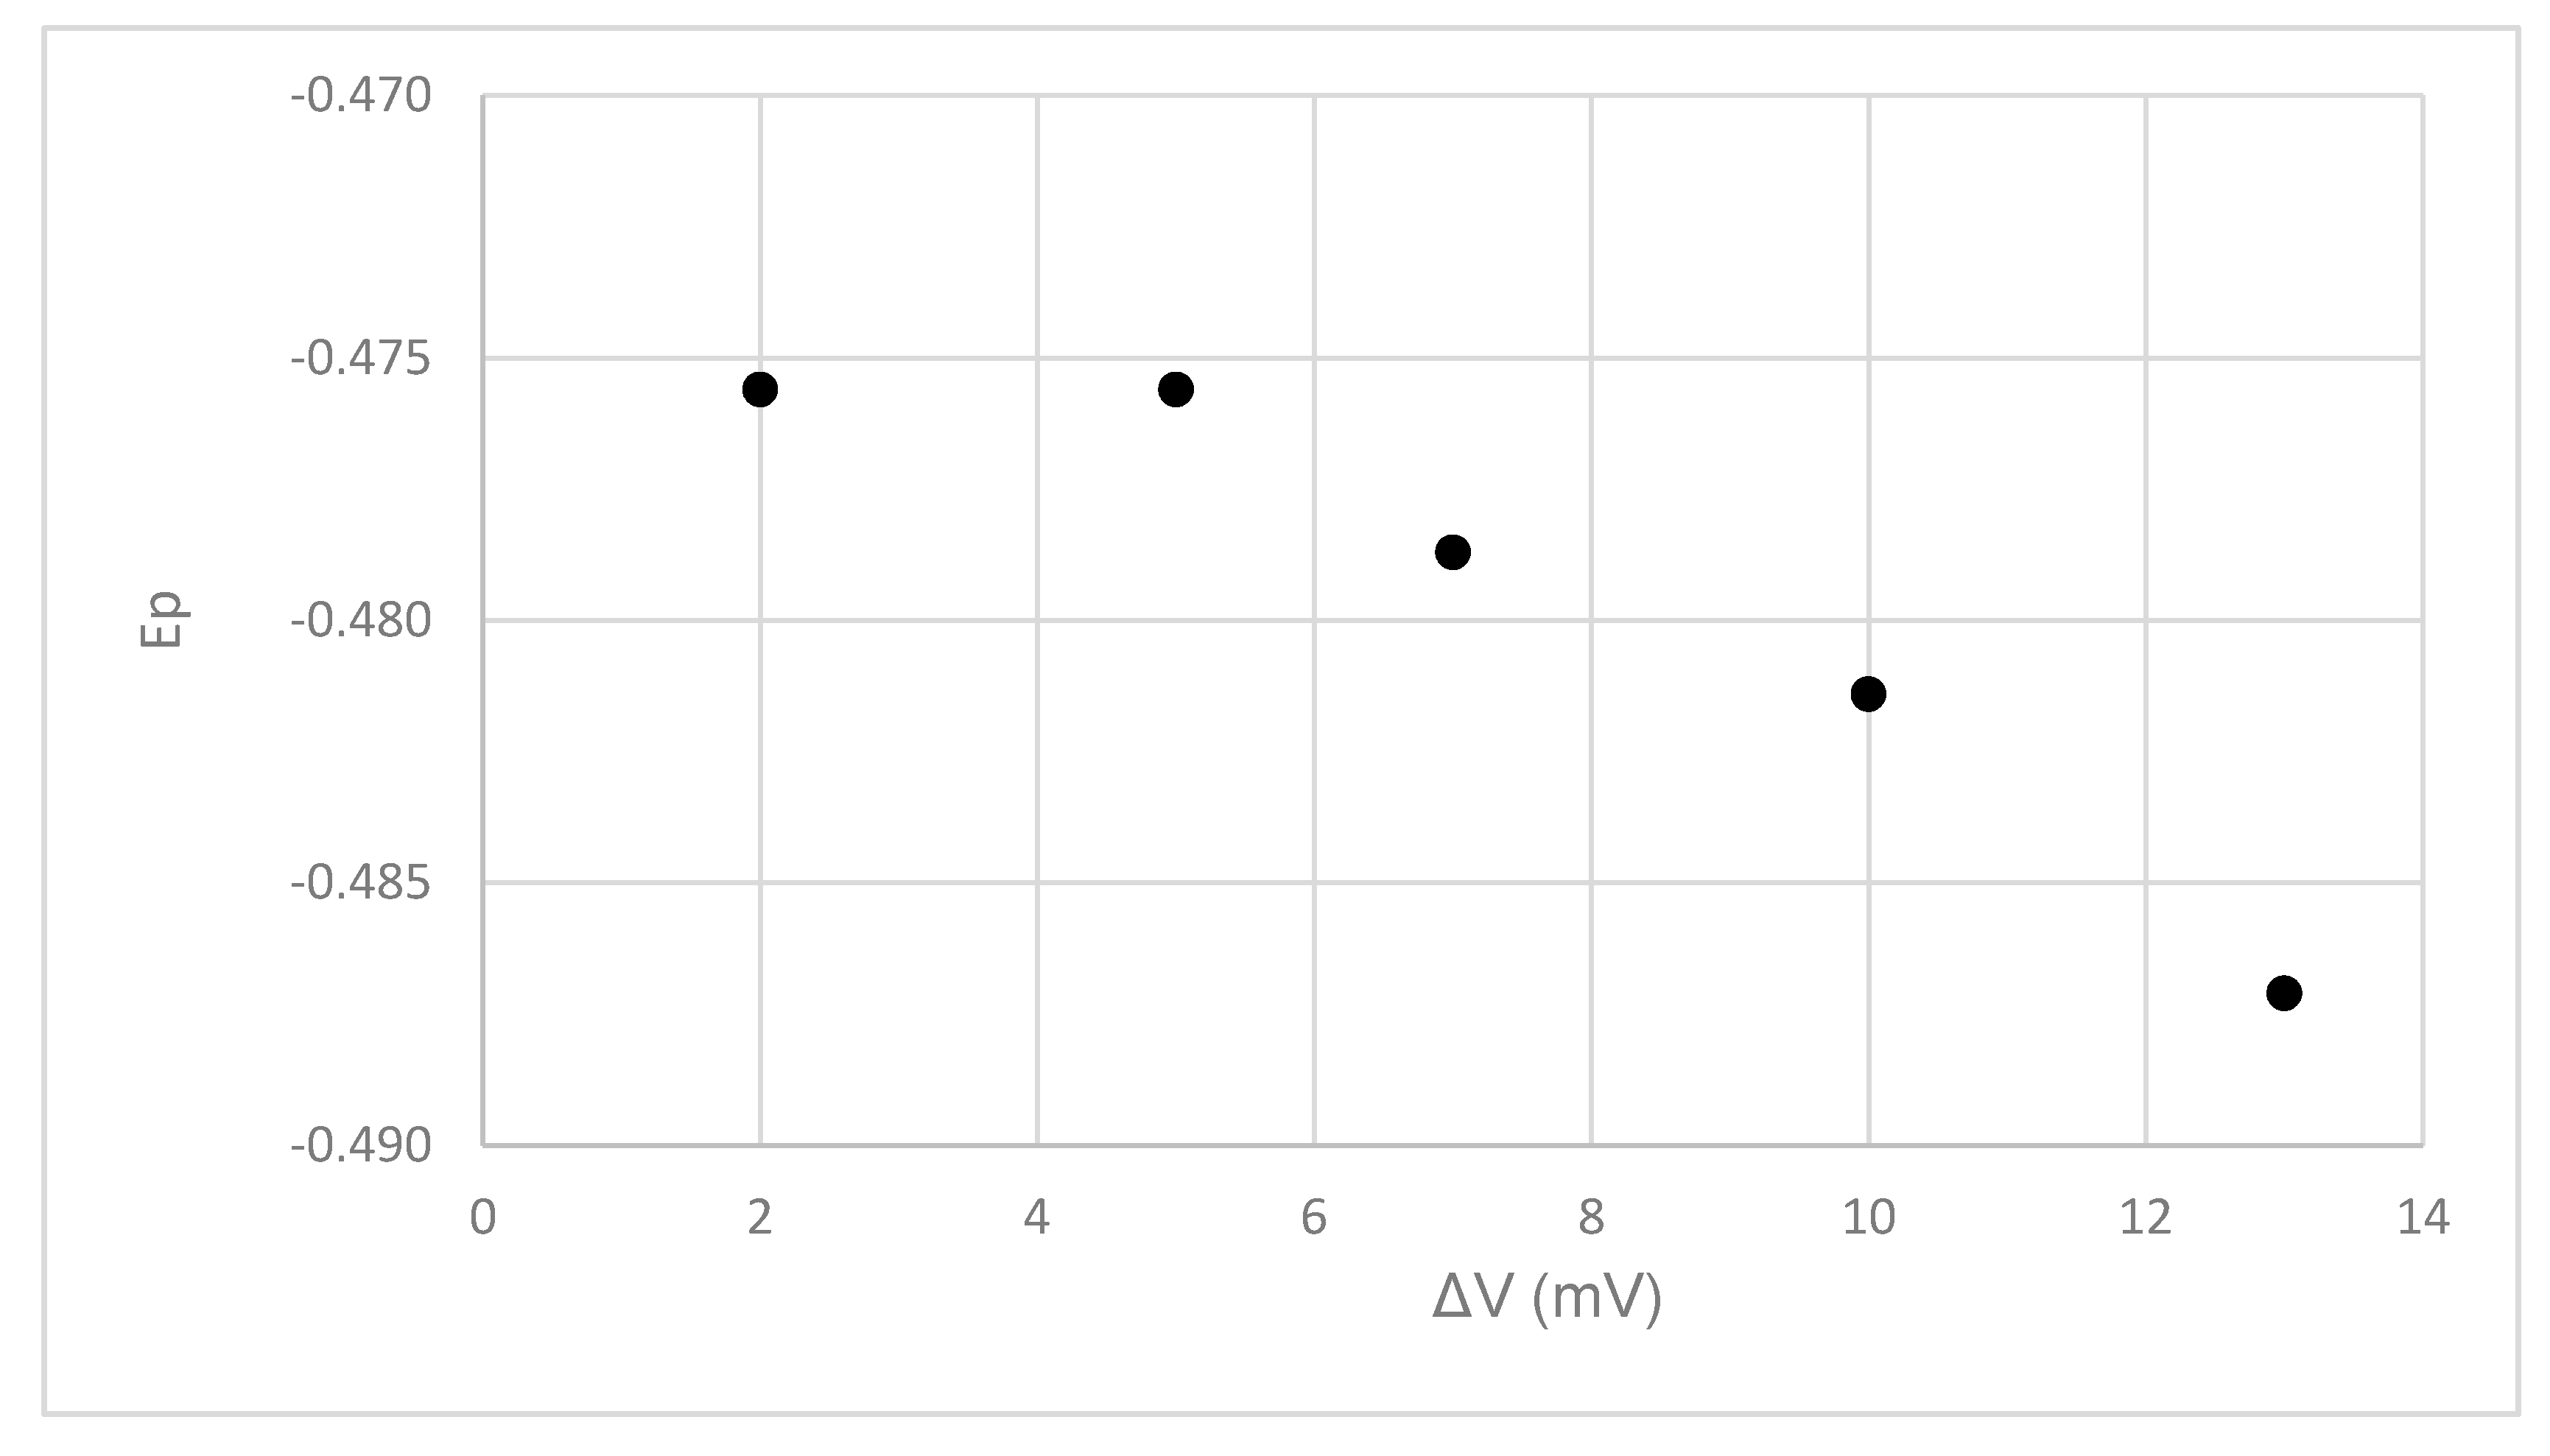
The observed Ep may be partially a function of unknown electrode kinetic factors and instrumental settings, as well as the reduction potential of the complexed species. Therefore, we examined the influence of the various DPP parameters on the position of the observed reduction peak for Pahokee peat humic acid in order to gauge the magnitude of the influence of various instrumental parameters on the observations. All of these experiments were done with 15 mL of the Pahokee peat HA 100 mg/L in 100-mM HEPES pH 8 and 1.00-M NaNO3 and with 4.8-uM Pb2+. Figure 14 indicates that increasing the voltage increment (ΔV) between mercury drops tends to yield a more negative Ep, although there was little change in the peak position between the 2- and 4-mV increments.
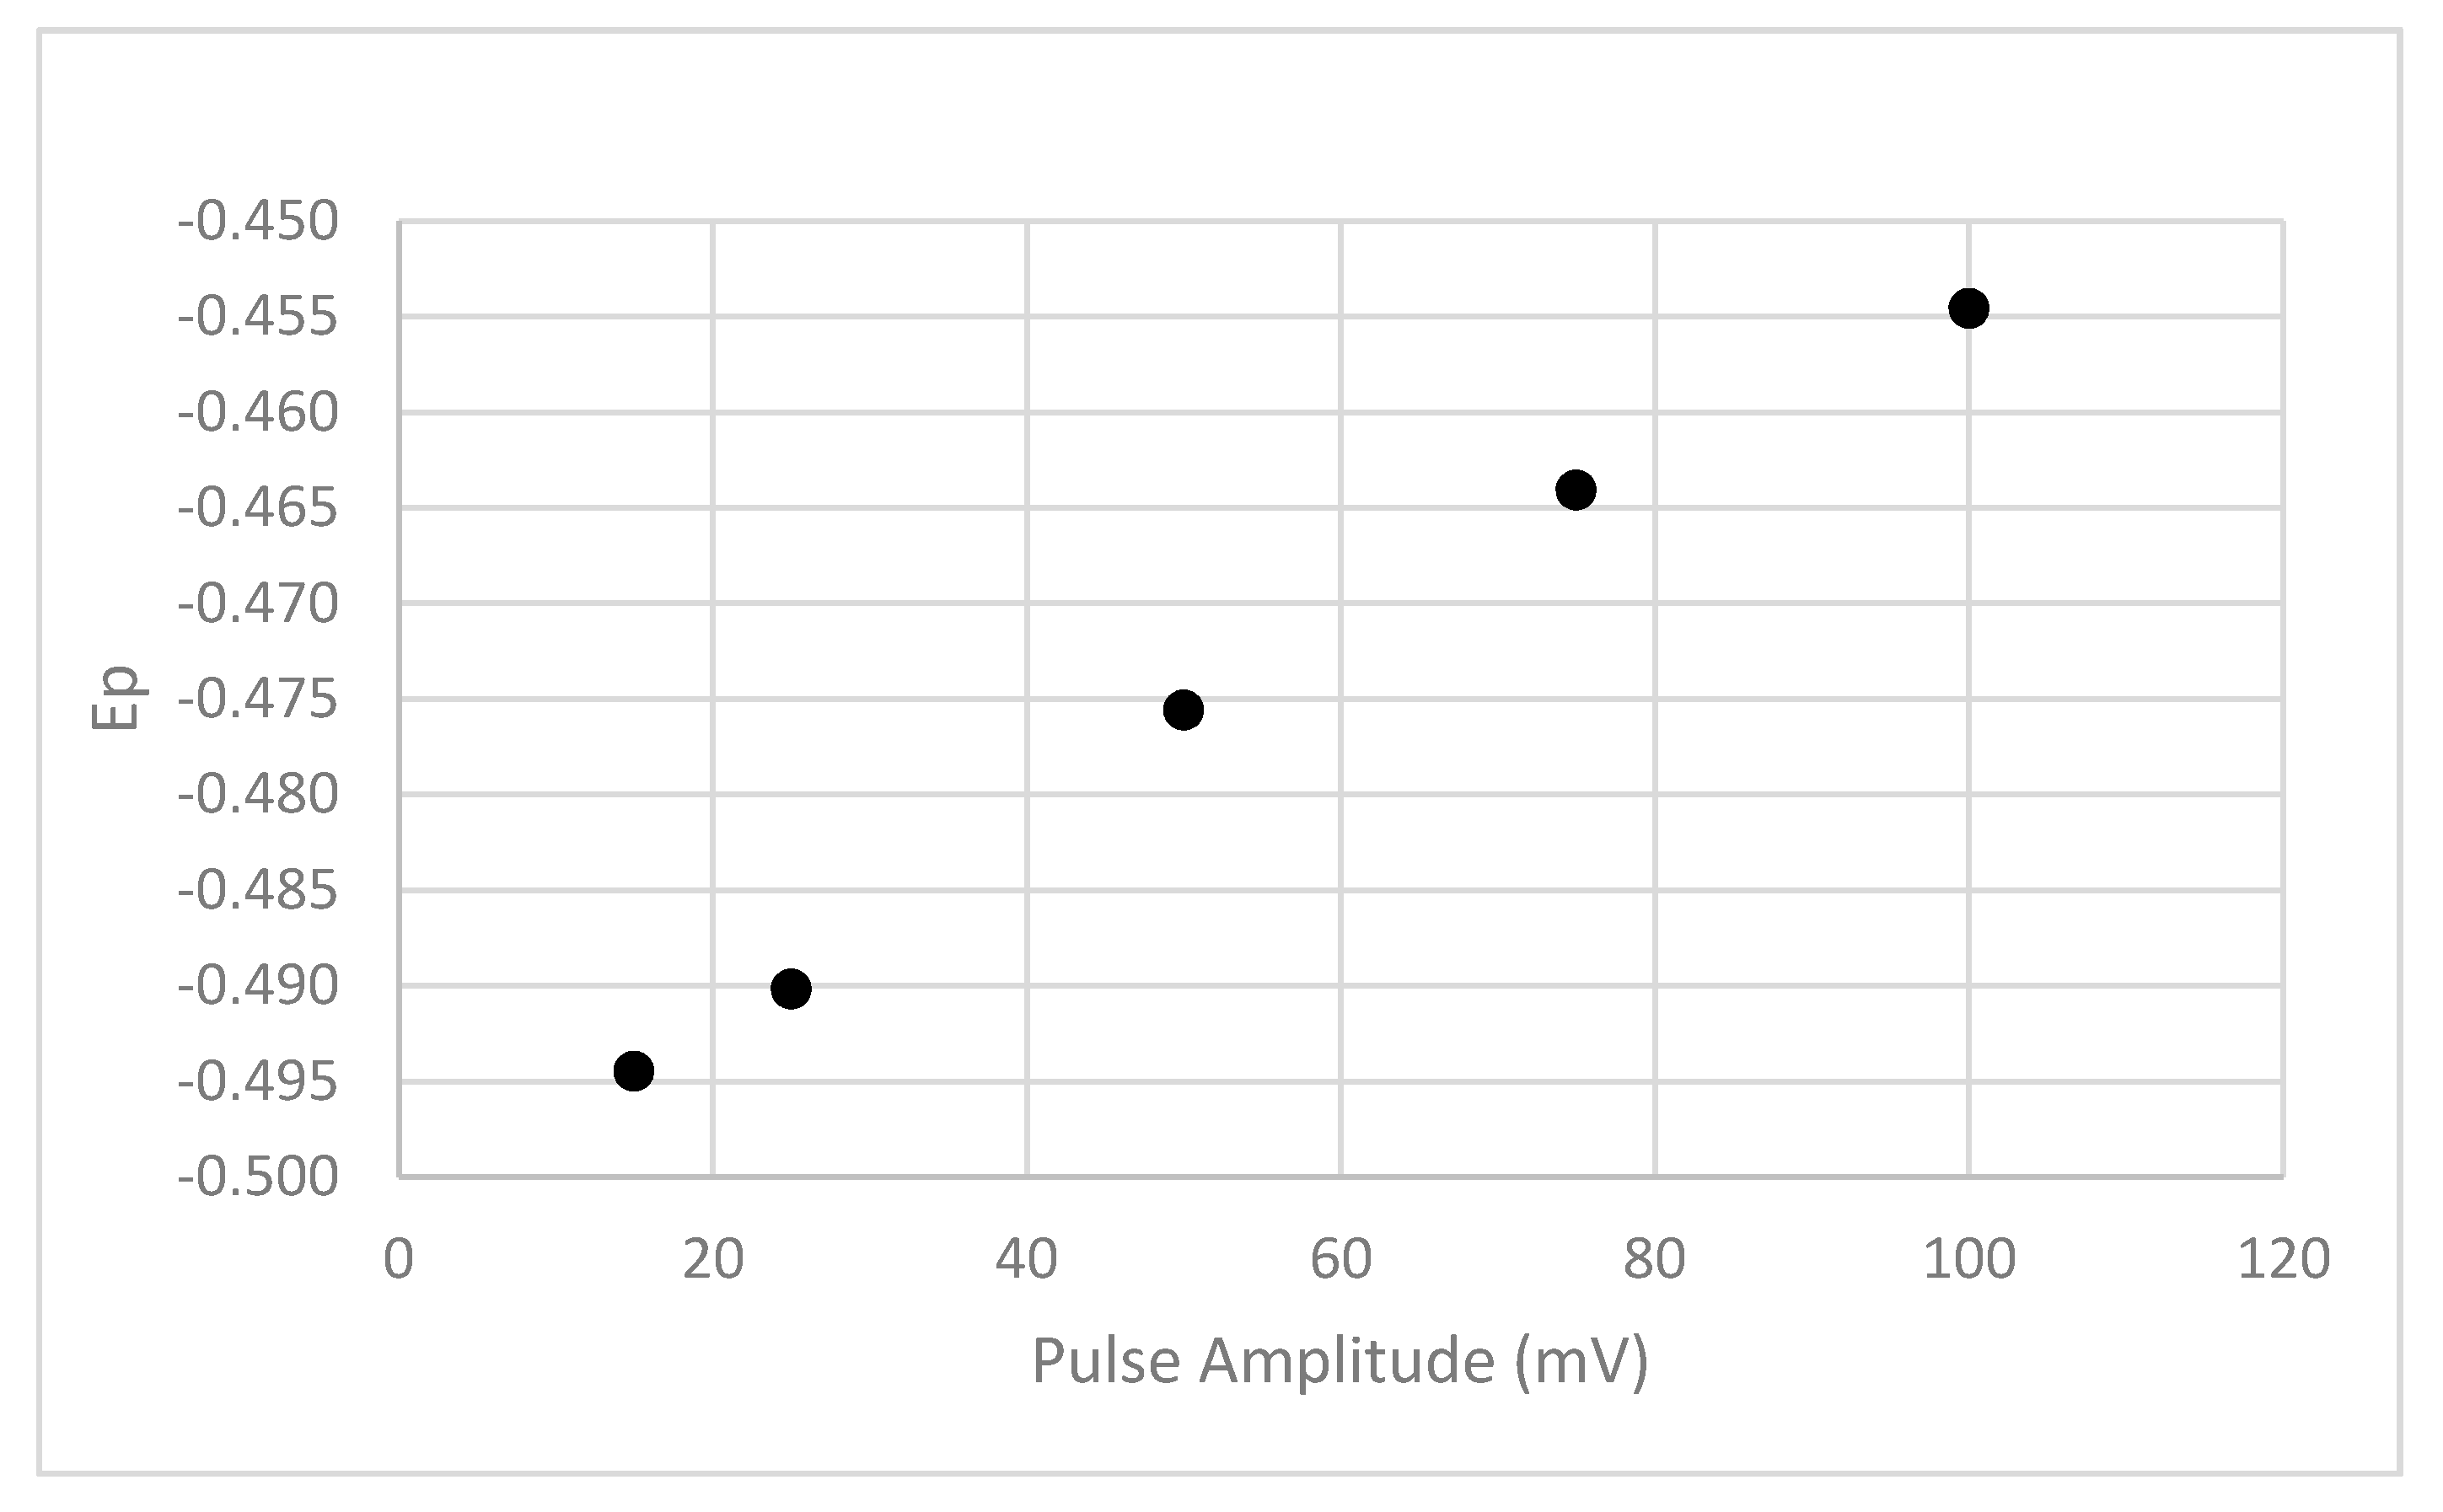
The results presented in Figure 15 indicate that increasing the pulse amplitude leads to a less negative Ep value.
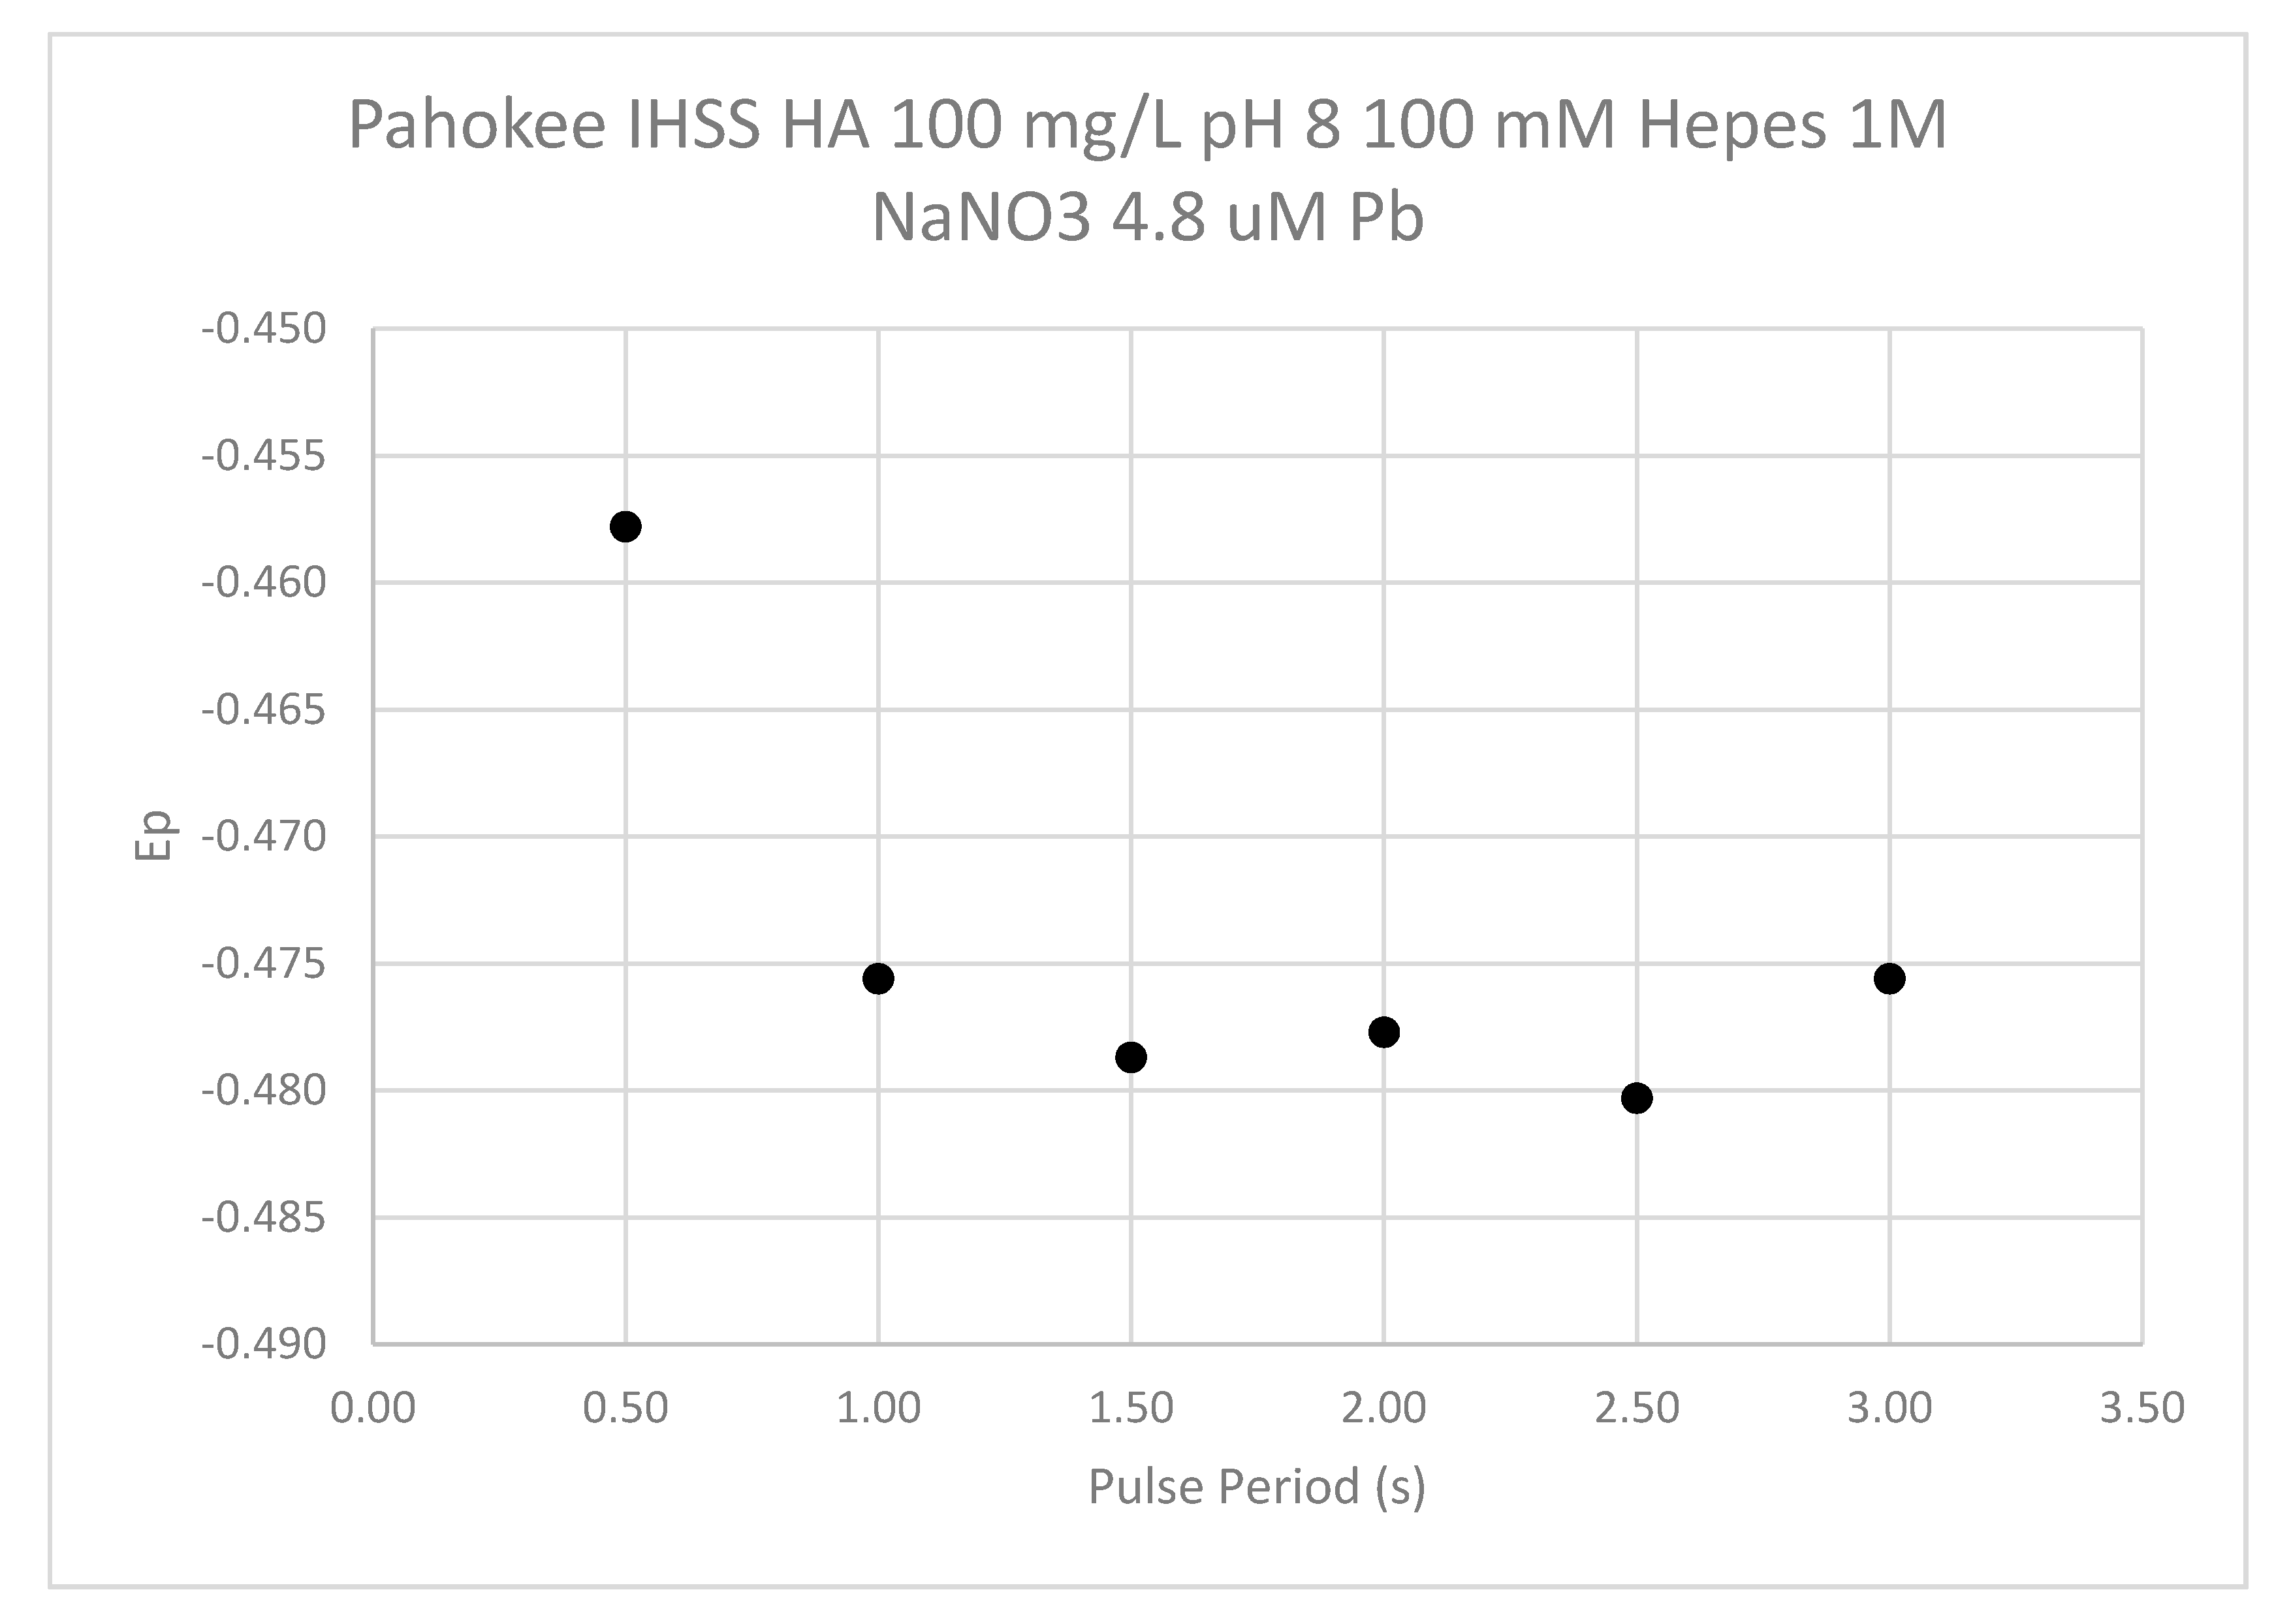
The influence of the pulse period (drop time) is shown in Figure 16. The shortest pulse period examined had a less negative Ep value than the procedure used for sample analysis. Pulse periods from 1 to 3 s showed little change in the Ep.
It is clear that the observed Ep values are a function of the DPP conditions selected. Thus, caution in using a strictly thermodynamic interpretation of DPP observations is in order. Nevertheless, we used these results to estimate the magnitude of the Pb2+ humic acid stability constants. To form this estimate, we utilized Equation (6), along with the observed Ep from humic-free solutions, to estimate the value for a conditional logKL for the Pb2+ binding by the various humic substances examined in this study. For the purposes of this calculation, we assumed that the shift in Ep from a humic-free to a humic-containing solution was equivalent to ΔE in Equation (6). We also assumed that p in Equation (6) was equal to 1. We estimated the molar concentration of the humic substance (L) by dividing the mass concentration by either Mn or Mw. Using these highly simplified assumptions, we rearranged Equation (6) into Equation (7) to produce an estimate for log KL. These estimates were performed with the results from lowest concentration of Pb2+ used in the study (1.6 uM).
The results of this very preliminary calculation of conditional stability constants are reported in Table 2. These calculations assumed a 1:1 stoichiometry for the Pb2+ humic acid complex. The calculation ignores the heterogeneity of humic acids and the potential contribution of electrostatic effects to metal binding. It is quite possible that the binding capacity of these humic acids is much higher than this calculated molarity. If so, the estimated log KL value could be considerably reduced. The metal-binding capacity for humic substances has not been well-established. For example, Logan et al. [39] and Sahu and Banjeree [40] utilized ion-selective electrodes with a graphical analysis to estimate both the metal-binding capacities and metal humic stability constants. Both parameters were found to be pH-dependent.
Schnitzer and Skinner [41] and Schnitzer and Hansen [42] examined metal binding by a soil fulvic acid at low pH (5 and lower) using Schubert’s ion exchange method. The molecular weight (Mn) of the fulvic acid was estimated using vapor pressure osmometry. Using the estimated molecular weight and the method of continuous variation, Schnitzer and Hansen [42] determined that the complex involved a metal-to-fulvic acid ratio of 1:1 for Pb2+ and other divalent metals at an ionic strength of 0.1, although, at lower ionic strength, this ratio decreased. These authors indicated that, at a lower ionic strength, mixed or polynuclear complexes were likely forming. The Log KL (~6) values for Pb2+ estimated in these studies was much lower than those reported here; however, the pH of these measurements was considerably lower as well. The assumptions used for our estimates of the Log KL are consistent with Schnitzer and Hansen’s observation of 1:1 stoichiometry.
4. Conclusions
Differential pulse polarography (DPP) measurements demonstrate a shift in Ep for Pb2+ as a function of the organic matter content and pH. This shift, which is also a function of the Pb2+ concentration, is consistent with the formation of humate complexes that are reduced at a more negative potential than the free metal ion. The correlation of the shift with the concentration of humic acid also conforms to the predictions of the Lingane equation and likely indicates a rapid equilibrium between complexed and uncomplexed Pb2+ species. The observed increased complexation with an increase in pH is consistent with the observation of other investigators. As noted, the shift in the Ep is dependent on the concentration of humic acid and decreases as the concentration of Pb2+ increases. This observation is consistent with the existence of a heterogeneous distribution of binding sites for Pb2+.
It is clear from these results that the interpretation of DPP reduction potential shifts is complicated by the absorption of the Pb2+-humate complex on the electrode. This Pb2+–humate adsorption probably explains the negative shift of the Ep with the increase in pulse period (drop lifetime). In addition, we observed that the reduction current also increased with the pulse period (results not shown). We did some cyclic voltammetry (CV) studies (not shown) that showed that the signal increased with the deposition time, or the time elapsed between the mercury drop formation and the initiation of the CV scan. It is clear that the adsorption of the complex to the drop is a complication in the interpretation of the data.
The humic acids selected for these experiments (with the exception of the TeraVita product) were obtained from the IHSS. The Ep observed for the various samples did not show any correlation with the reported carboxylic acid or phenolic acid contents of the samples. The molecular weights of these humic substances were examined using SEC with a method that was calibrated using polystyrene sulfonate samples. The observed number-averaged molecular weights (Mn) of the humic samples were all below 1000, with the exception of the Elliot soil. The Ep measurements did not show any clear relationship to the molecular weight. Furthermore, all of these substances showed a very broad distribution of molecular, with a large contribution from low molecular weight components. Our goal is to utilize the results from this analytical method, along with other measurements of complexation, to calibrate and possibly refine a humic acid model so that improved predictions for the fate and transport of Pb2+ in aquatic and soil environments will be possible.
Author Contributions
S.S. conceptualization, methodology, experimental measurements and writing—original draft preparation. V.H. writing—review and editing. All authors have read and agreed to the published version of the manuscript.
Funding
This research received no external funding.
Conflicts of Interest
The authors declare no conflict of interest.
References
- Grosell, M.; Gerdes, R.; Brix, K.V. Influence of Ca, humic acid and pH on lead accumulation and toxicity in the fathead minnow during prolonged water-borne lead exposure. Comp. Biochem. Phys. 2006, 143 Pt C, 473–483. [Google Scholar] [CrossRef]
- García-Mina, J.M.; Antolín, M.C.; Sanchez-Diaz, M. Metal-Humate complexes and plant micronutrient uptake: A study base on different plant species cultivated in diverse soil types. Plant Soil 2004, 258, 57–68. [Google Scholar] [CrossRef]
- Senesi, N.; Loffredo, E. Metal Ion Complexation by Soil Humic Substances. In Chemical Processes in Soil; Sparks, D.L., Tabatabai, M.A., Eds.; Soil Science Society of America Inc.: Madison, WI, USA, 2005; Chapter 12; pp. 561–618. [Google Scholar]
- Senesi, N.; Loffredo, E. Spectroscopic Techniques for Studying Metal-Humic Complexes in Soil. In Wiley-IUPAC Series on Biophysico-Chemical Processes in Environmental Systems; Wiley-Interscience: Hoboken, NJ, USA, 2008; Chapter 4; pp. 125–168. [Google Scholar]
- Van Den Berg, C.M.G. Determination of the complexing capacity and conditional stability constants of complexes of copper (II) with natural organic ligands in seawater by cathodic stripping voltammetry of copper-catechol complex ions. Mar. Chem. 1984, 15, 1–18. [Google Scholar] [CrossRef]
- Xue, H.; Kistler, K.; Sigg, L. Competition of copper and zinc for strong ligands in a eutrophic lake. Liminol. Oceanogr. 1995, 40, 1142–1152. [Google Scholar] [CrossRef] [Green Version]
- Hurst, M.P.; Bruland, K.W. The use of nafion-coated thin mercury film electrodes for the determination of the dissolved copper speciation in estuarine water. Anal. Chem. Acta 2005, 546, 68–78. [Google Scholar] [CrossRef] [PubMed]
- Fukushima, M.; Taga, M. Comparison of the lability of copper (II) species in the presence of humic acid by anodic stripping voltammetry and cation-exchange methods. Anal. Sci. 1993, 9, 533–535. [Google Scholar] [CrossRef] [Green Version]
- Lingane, J.J. Interpretation of the polarographic waves of complex metal ions. Chem. Rev. 1941, 29, 1–35. [Google Scholar] [CrossRef]
- Greter, F.-L.; Buffle, J.; Haerdi, W. Voltammetric study of humic and fulvic substances. Part I. Study of the Factors influencing the Measurement of their Complexing Properties with Lead. J. Electroanal. Chem. 1979, 101, 211–229. [Google Scholar] [CrossRef]
- Turner, D.R.; Varney, M.S.; Whitfield, M.; Mantoura, R.F.C.; Riley, J.P. Electrochemical Studies on Copper and Lead Complexation by Fulvic Acid II. A Critical Comparison of Potentiometric and Polarographic Measurements. Sci. Total Environ. 1987, 60, 17–34. [Google Scholar] [CrossRef]
- Wallman, K.; Petersen, W.; Li, P. Study of Lead Fulvic Acid Interactions by Voltammetric Methods. In NATO ASI Series, Metal Speciation in the Environment; Broekaert, J.A.C., Gücer, S., Adams, F., Eds.; Springer: Berlin/Heidelberg, Germany, 1990; Volume G23, pp. 71–77. ISBN 978-3-642-74208-8. [Google Scholar]
- Steinberg, S.; Hodge, V. Copper Complexation by Dissolved Organic Matter in arid Soils: A Voltametric Study. Environments 2018, 5, 125. [Google Scholar] [CrossRef] [Green Version]
- Wang, J. Analytical Electrochemistry, 3rd ed.; Wiley-VCH: Hoboken, NJ, USA, 2006; pp. 77–80. [Google Scholar]
- Buffle, J.; Greter, F.-L. Voltammetric study of humic and fulvic substances. Part II. Mechanisms of Reaction of the Pb-Fulvic Complexes on the Mercury Electrode. J. Electroanal. Chem. 1979, 101, 231–251. [Google Scholar] [CrossRef]
- Perdue, E.M. Effects of Humic substances on metal speciation. In Aquatic Humic Substances Influence on Fate and Treatement of Pollutants, Advances in Chemistry Series; Suffet, I.H., Macarthy, P., Eds.; American Chemical Society: Washington, DC, USA, 1989; Volume 219, pp. 282–295. [Google Scholar]
- MacCarthy, P.; Perdue, E.M. Complexation of Metal ions by humic substances; fundamental considerations. In Interactions at the Soil Colloid-Soil Solution Interface, NATA ASI Series; Bolt, G.H., De Boodt, M.F., Hayes, M.H.B., McBride, M.B., Eds.; Kluwer: Dordrect, The Netherlands, 1991; Volume 190, pp. 469–492. [Google Scholar]
- Tipping, E. Cation Binding by Humic Substances Cambridge Environmental Chemistry Series 12; Cambridge University Press: Cambridge, UK, 2002; pp. 253–260. [Google Scholar]
- Liu, A.; Gonzales, R.D. Modeling Adsorption of Copper(II), Cadmium (II) and Lead (II) on Purified Humic Acid. Langmuir 2000, 26, 3092–3909. [Google Scholar] [CrossRef]
- Kinniburgh, D.G.; Milne, C.J.; Benediett, M.F.; Pinheiro, J.P.; Filius, J.; Koopal, L.K.; Van Riemskjk, W.H. Metal Ion Binding by Humic Acid: Application of the NICA-Donnan Model. Environ. Sci. Technol. 1996, 30, 1687–1698. [Google Scholar] [CrossRef]
- Gustafsson, J.P. Visual MINTEQ. Available online: https://vminteq.lwr.kth.se (accessed on 1 April 2019).
- Ferreira, C.M.H.; Pinto, I.S.S.; Soares, E.V.; Soares, H.M.V.M. (Un)suitability of the use of pH buffers in biological, biochemical and environmental studies and their interaction with metal ions—A review. RSC Adv. 2015, 5, 30989–31003. [Google Scholar] [CrossRef] [Green Version]
- Mattigod, S.V.; Sposito, G. Chemical modelling of trace metal equilibria in contaminated soil solutions using the computer program GEOCHEM. In Chemical Modelling in Aqueous Systems; ACS Symposium Series: No. 93; Jennee, A., Ed.; American Chemical Society: Washington, DC, USA, 1979; pp. 837–855. [Google Scholar]
- Yost, E.C.; Tejedor-Tejedor, M.I.; Anderson, M.A. In Situ CIR-FTIR Characterization of Salicylate Complexes at the Goethite/Aqueous Solution Interface. Environ. Sci. Technol. 1990, 24, 822–828. [Google Scholar] [CrossRef]
- Warwick, P.; Hall, T.; Read, D. A Comparative Evaluation of Metal Humic and Fulvic Acid Predictive Models. Radiochim. Acta 1996, 73, 11–19. [Google Scholar] [CrossRef]
- Chandra, I.K.; Angkawijaya, A.E.; Santoso, S.P.; Ismadji, S.; Soetaredjo, F.E.; Ju, Y.-H. Solution equilibria studies of complexes of divalent metal ions with 2-aminophenol and 3.4-dihydroxybenzoic acid. Polyhedron 2015, 88, 29–39. [Google Scholar] [CrossRef] [Green Version]
- Khayat, Y.; Cromer-Morin, M.; Scharff, J.-P. Interactions of Pb(II) ions with 3,5-pyrocatecholdisulfonic and 3,4-dihydroxybenzoic acid. J. Inorg. Nucl. Chem. 1980, 43, 627–629. [Google Scholar] [CrossRef]
- Furia, E.; Porto, R. The Hydrogen Salicylate Ion as a Ligand. Complex Formation Equilibria with Dioxouranium (VI), Neodymium (III) and Lead(II). Ann. Chem. 2004, 94, 1–10. [Google Scholar] [CrossRef]
- DeFord, D.; Hume, D. The Determination of Consecutive Formation Constants of Complex Ions from Polarographic Data. J. Am. Chem. Soc. 1951, 73, 5321–5322. [Google Scholar] [CrossRef]
- Ringbon, A.; Eriksson, L. The Evaluation of Complexity Constants from Polarographic Data. Acta Chem. Scand. 1953, 7, 1105–1111. [Google Scholar] [CrossRef]
- Barrio Diez-Caballero, R.; Arranz Valentin, J.F.; Arranz Garci, A.; Pardo Almudi, R.; Sanchez Batanero, P. Polarographic Determination of the Stability Constants of Binary and Ternary Lead(II) Complexes and Different Organic Ligands. J. Electroanal. Chem. 1985, 196, 43–51. [Google Scholar] [CrossRef]
- Marinsky, J.A.; Reddy, M.M. Proton and metal binding to natural organic polyelectrolytes-I. Studies with synthetic model compounds. Org. Geochem. 1984, 7, 209–214. [Google Scholar] [CrossRef]
- Sutton, R.; Sposito, G. Molecular Structure in Soil Humic Substances: The New View. Environ. Sci. Technol. 2005, 39, 9009–9015. [Google Scholar] [CrossRef]
- Klučáková, M. Size and Charge Evaluation of Standard Humic and Fulvic Acids as Crucial Factors to Determine Their Environmental Behavior and Impact. Front. Chem. 2018, 6, 235. [Google Scholar] [CrossRef]
- International Humic Substance Society. Available online: http://humic-substances.org (accessed on 9 September 2020).
- Everett, C.R.; Chin, Y.-P.; Aiken, G.R. High-pressure size exclusion chromatography analysis of dissolved organic matter isolated by tangential-flow ultrafiltration. Limnol. Oceanogr. 1999, 44, 1316–1322. [Google Scholar] [CrossRef]
- Peuravuori, J.; Pihlaja, K. Molecular size distribution and spectroscopic properties of aquatic humic substances. Anal. Chim. Acta 1997, 337, 133–149. [Google Scholar] [CrossRef]
- Piccolo, A. The Supramolecular Structure of Humic Substances. Soil Sci. 2001, 166, 810–832. [Google Scholar] [CrossRef] [Green Version]
- Logan, E.M.; Pulford, I.D.; Cook, G.T.; Mackenzie, A.B. Complexation of Cu2+ and Pb2+ by peat and humic acid. Eur. J. Soil Sci. 1997, 48, 685–696. [Google Scholar] [CrossRef]
- Sahu, S.; Banerjee, D.K. Complexation of Copper (II), Cadmum (II) and Lead (II) with Humic and Fulvic Acids of Yamuna River Sediments. In Chemistry for the Protection of the Environment 2; Pawłowski, L., Lacy, W.J., Uchrin, C.G., Dudzińska, M.R., Eds.; Plenum Press: New York, NY, USA, 1996; pp. 375–388. [Google Scholar]
- Schnitzer, M.; Skinner, S.I.M. Organo-Metallic Interactions in Soils: 7. Stability Constants of Pb2+, Ni2+, Mn2+, Co2+, Ca2+, and Mg2+-Fulvic Acid Complexes. Soil Sci. 1967, 103, 247–252. [Google Scholar] [CrossRef]
- Schnitzer, M.; Hansen, E.H. Organo-Metalllic Interactions in Soils: 8: An Evaluation of Methods for the Determination of Stability Constants of Metal-Fulvic Acid Complexes. Soil Sci. 1970, 109, 333–340. [Google Scholar] [CrossRef]
Figure 1.
Differential pulse polarography (DPP) results for the reduction of Pb2+ in the presence of 1.25 mM 3,4-dihydroxybenzoic acid at three different pH values. The peak maximum (Ep) becomes increasingly negative as the pH increases.
Figure 1.
Differential pulse polarography (DPP) results for the reduction of Pb2+ in the presence of 1.25 mM 3,4-dihydroxybenzoic acid at three different pH values. The peak maximum (Ep) becomes increasingly negative as the pH increases.
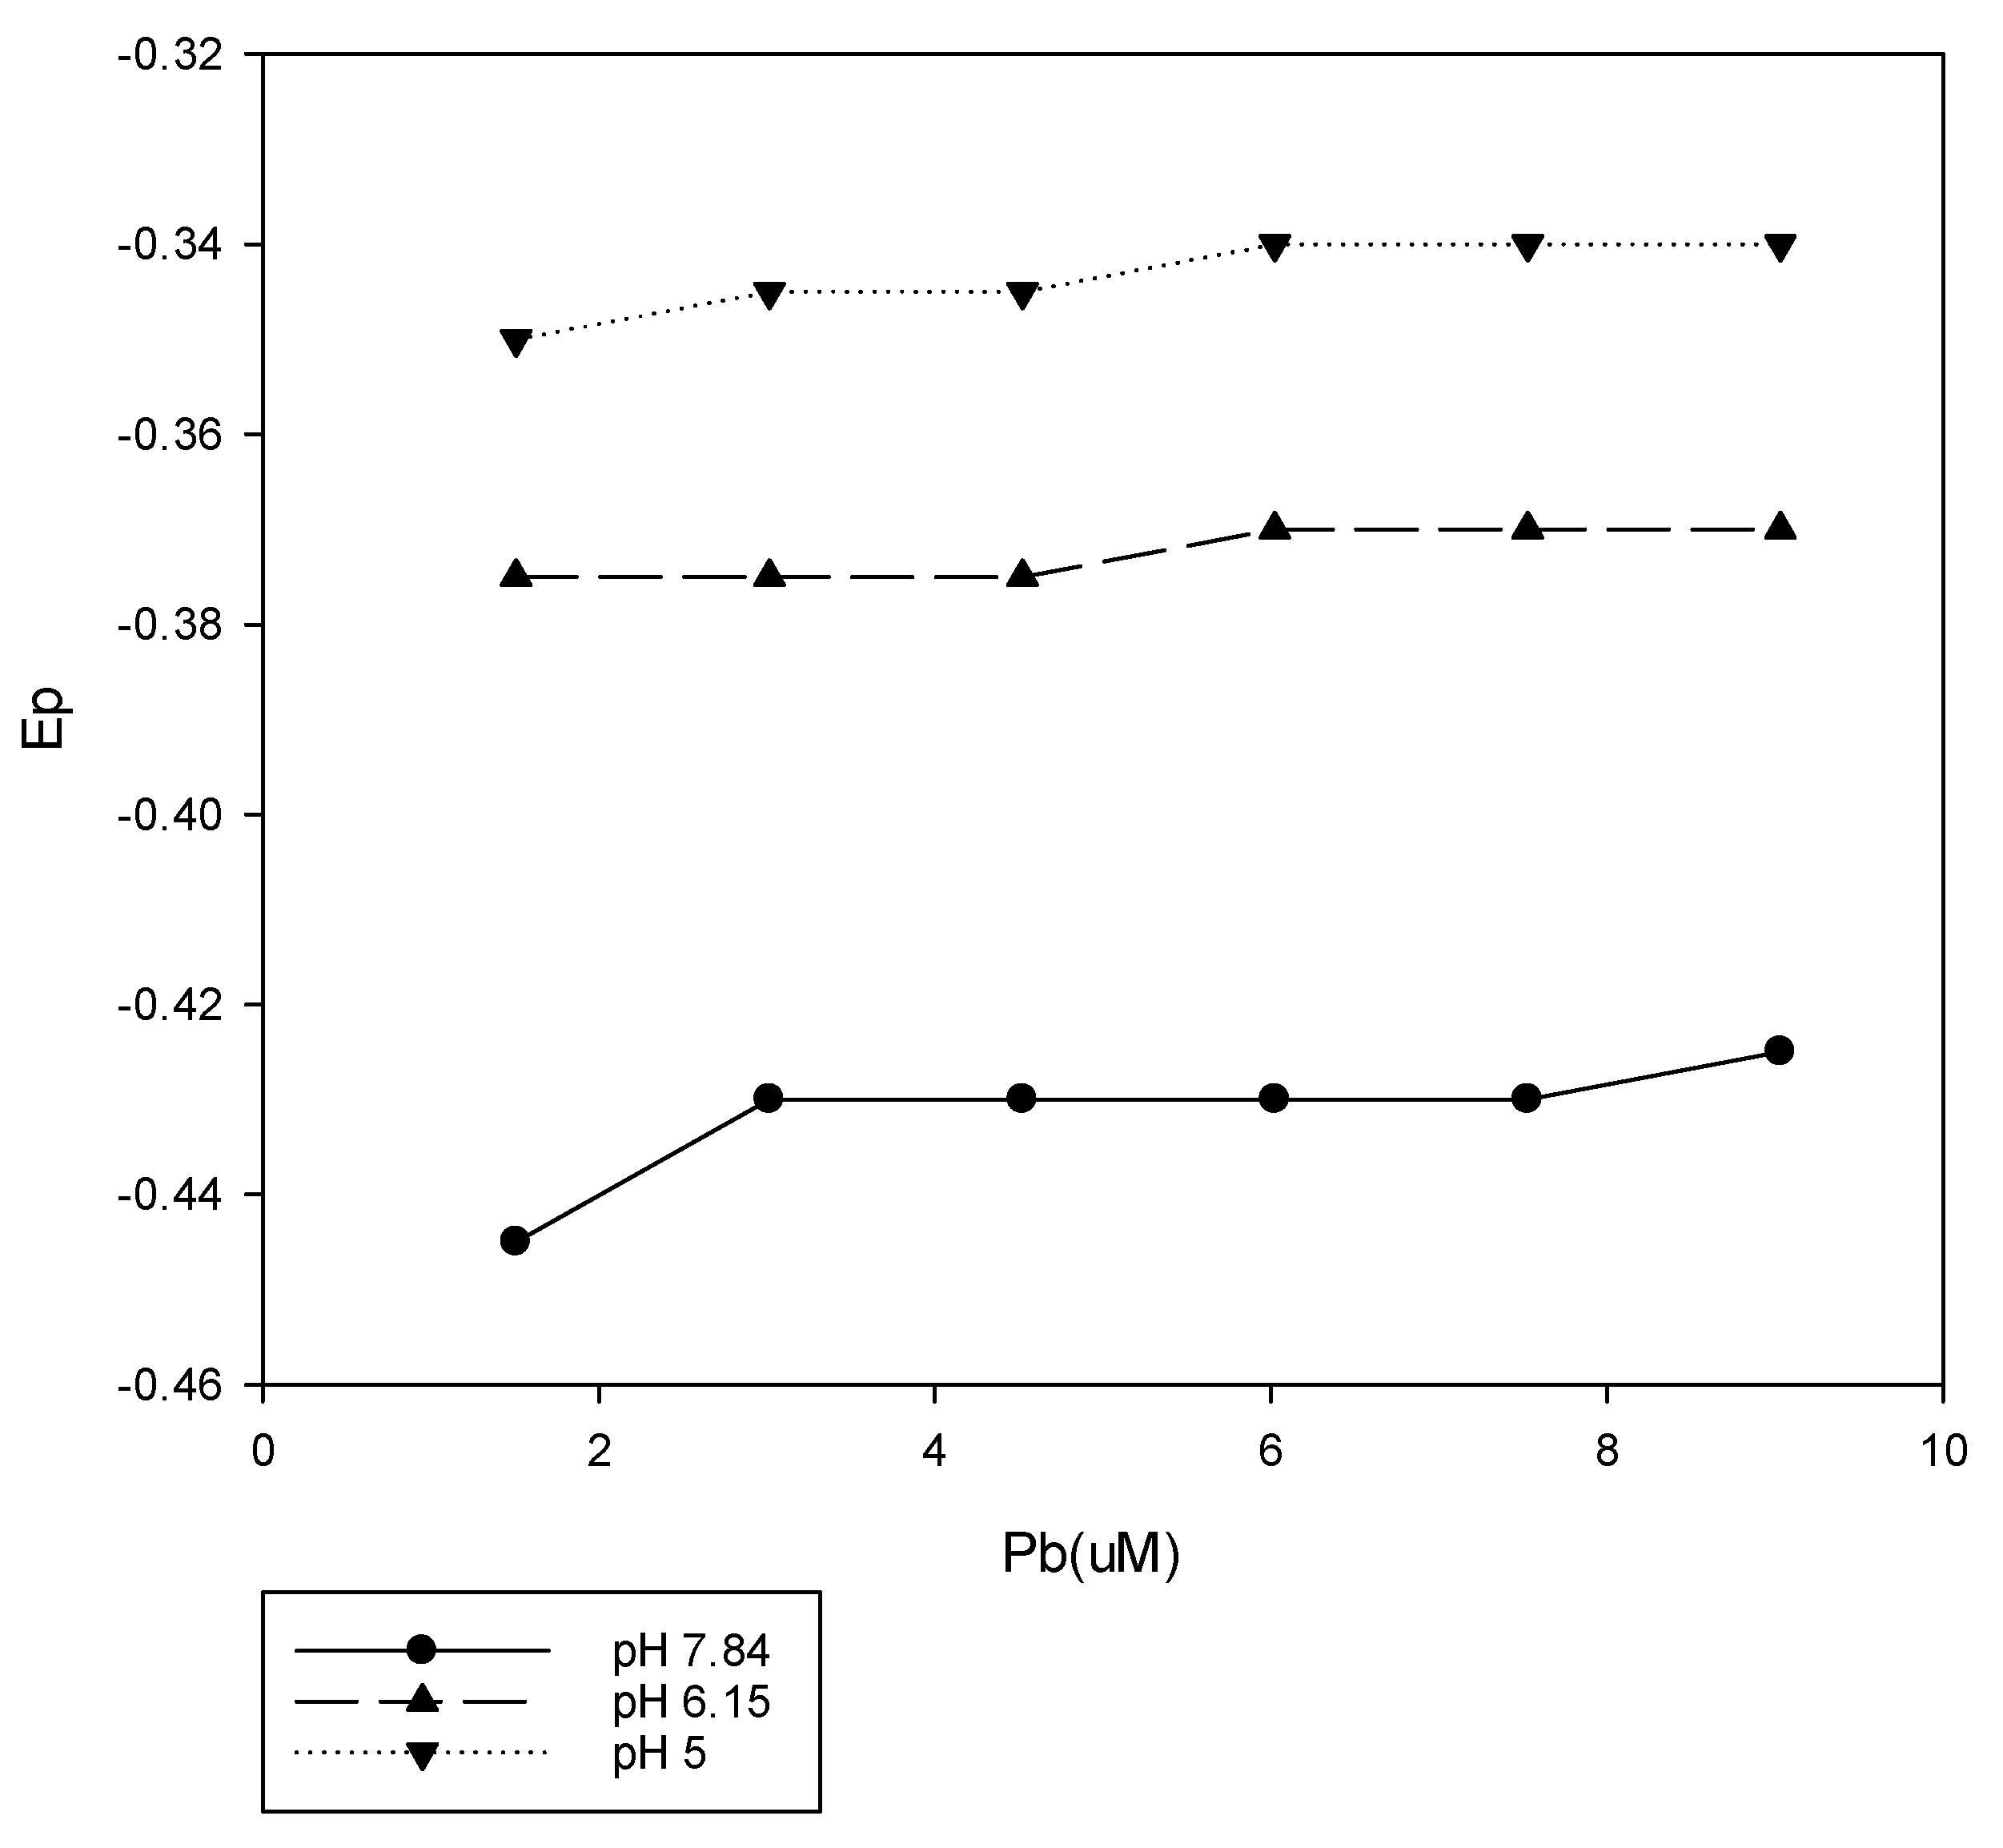
Figure 2.
DPP results for Pb2+ in the presence of a range of salicylic acid concentrations. There was little difference in the results for pH 6.15 and pH 7.85. The linear relationship between Ep and log (salicylic acid) is consistent with the Lingane equation.
Figure 2.
DPP results for Pb2+ in the presence of a range of salicylic acid concentrations. There was little difference in the results for pH 6.15 and pH 7.85. The linear relationship between Ep and log (salicylic acid) is consistent with the Lingane equation.

Figure 3.
DPP results for Pb2+ in the presence of 100-mg/L polyacrylate. There is little difference in the results for pH 6.12 and pH 8.
Figure 3.
DPP results for Pb2+ in the presence of 100-mg/L polyacrylate. There is little difference in the results for pH 6.12 and pH 8.

Figure 4.
DPP results for Pb2+ in the presence of 100-mg/L Pahokee peat humic acid at pH 5, 6.15, 6.76 and 7.84.
Figure 4.
DPP results for Pb2+ in the presence of 100-mg/L Pahokee peat humic acid at pH 5, 6.15, 6.76 and 7.84.

Figure 5.
DPP results for Pb2+ at pH 8 in the presence of varying concentrations of the Pahokee peat humic acid.
Figure 5.
DPP results for Pb2+ at pH 8 in the presence of varying concentrations of the Pahokee peat humic acid.

Figure 6.
DPP results for Pb2+ at pH 8 plotted as a function of the log of the Pahokee peat humic acid concentration (mg/L) at three different concentrations of Pb2+(● 1.61 uM, ▲ 4.82 uM and ▼ 9.63 uM).
Figure 6.
DPP results for Pb2+ at pH 8 plotted as a function of the log of the Pahokee peat humic acid concentration (mg/L) at three different concentrations of Pb2+(● 1.61 uM, ▲ 4.82 uM and ▼ 9.63 uM).
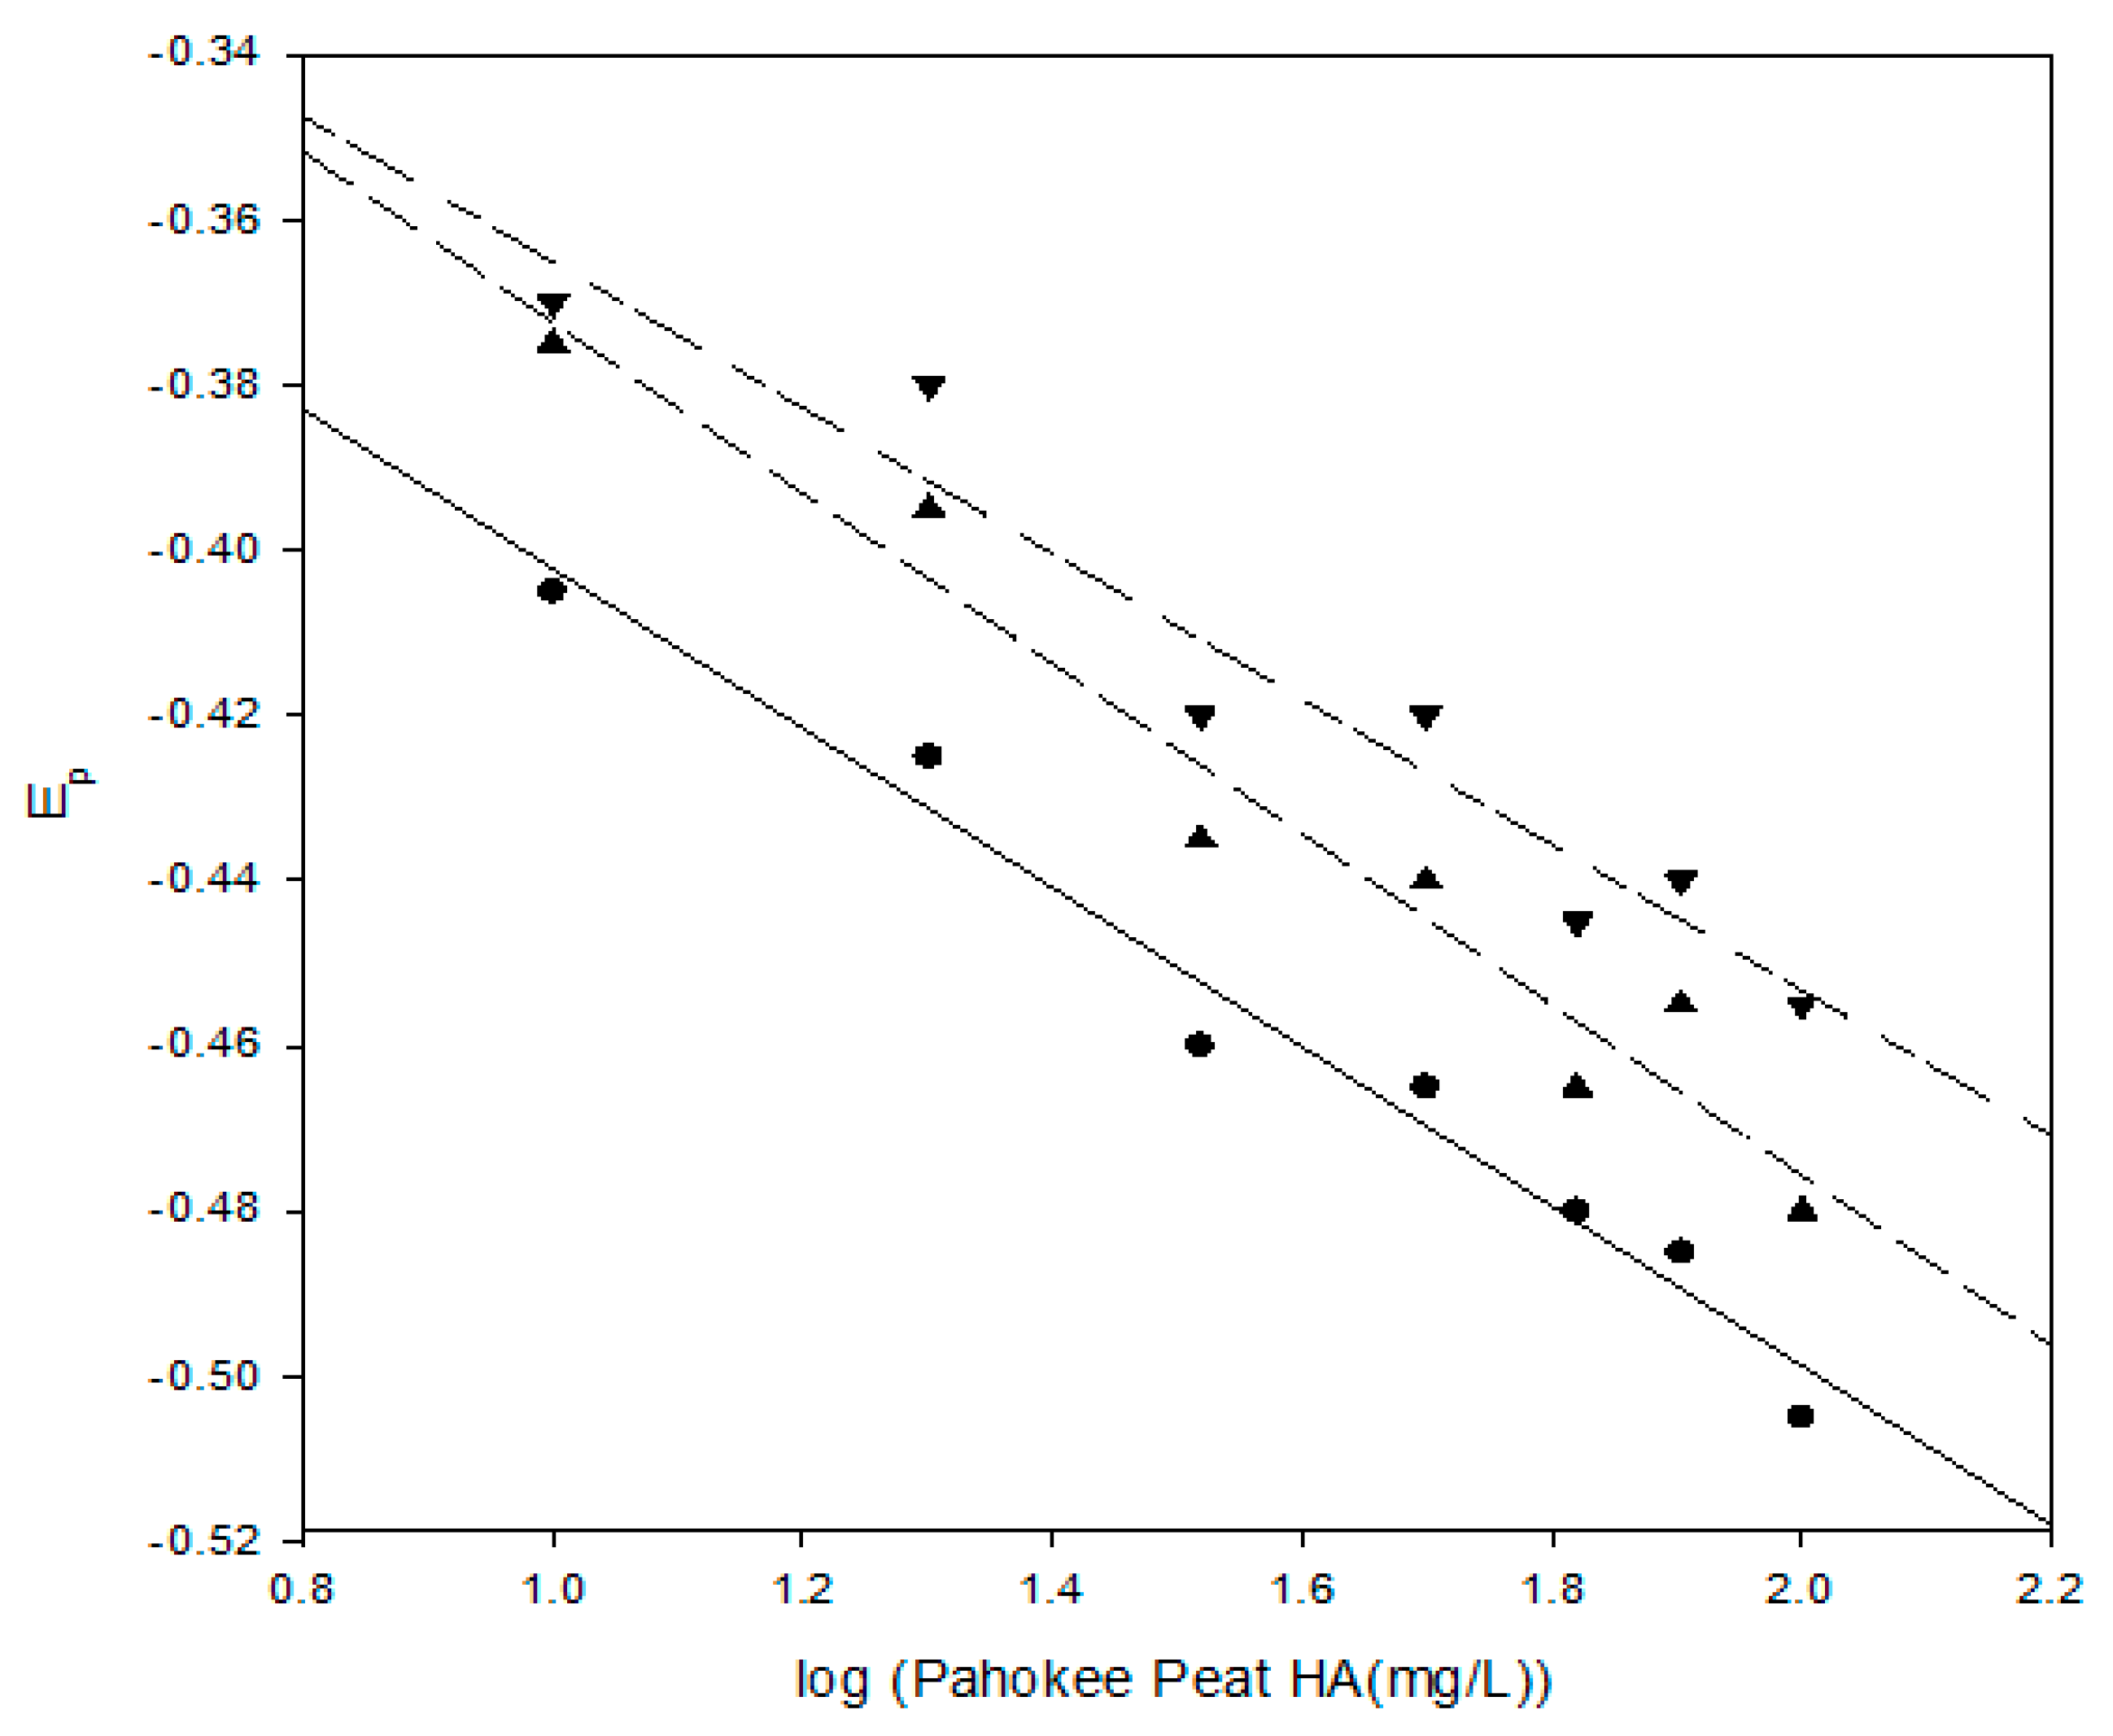
Figure 7.
DPP results for Pb2+ at pH 8 in the presence of TeraVita leonardite humic acid. The Ep value shifts toward a more negative voltage with an increase in the humic acid concentration.
Figure 7.
DPP results for Pb2+ at pH 8 in the presence of TeraVita leonardite humic acid. The Ep value shifts toward a more negative voltage with an increase in the humic acid concentration.

Figure 8.
Comparison of DPP results for Pb2+ at pH 8 in the presense of 100 mg/L of the various humic acids.
Figure 8.
Comparison of DPP results for Pb2+ at pH 8 in the presense of 100 mg/L of the various humic acids.
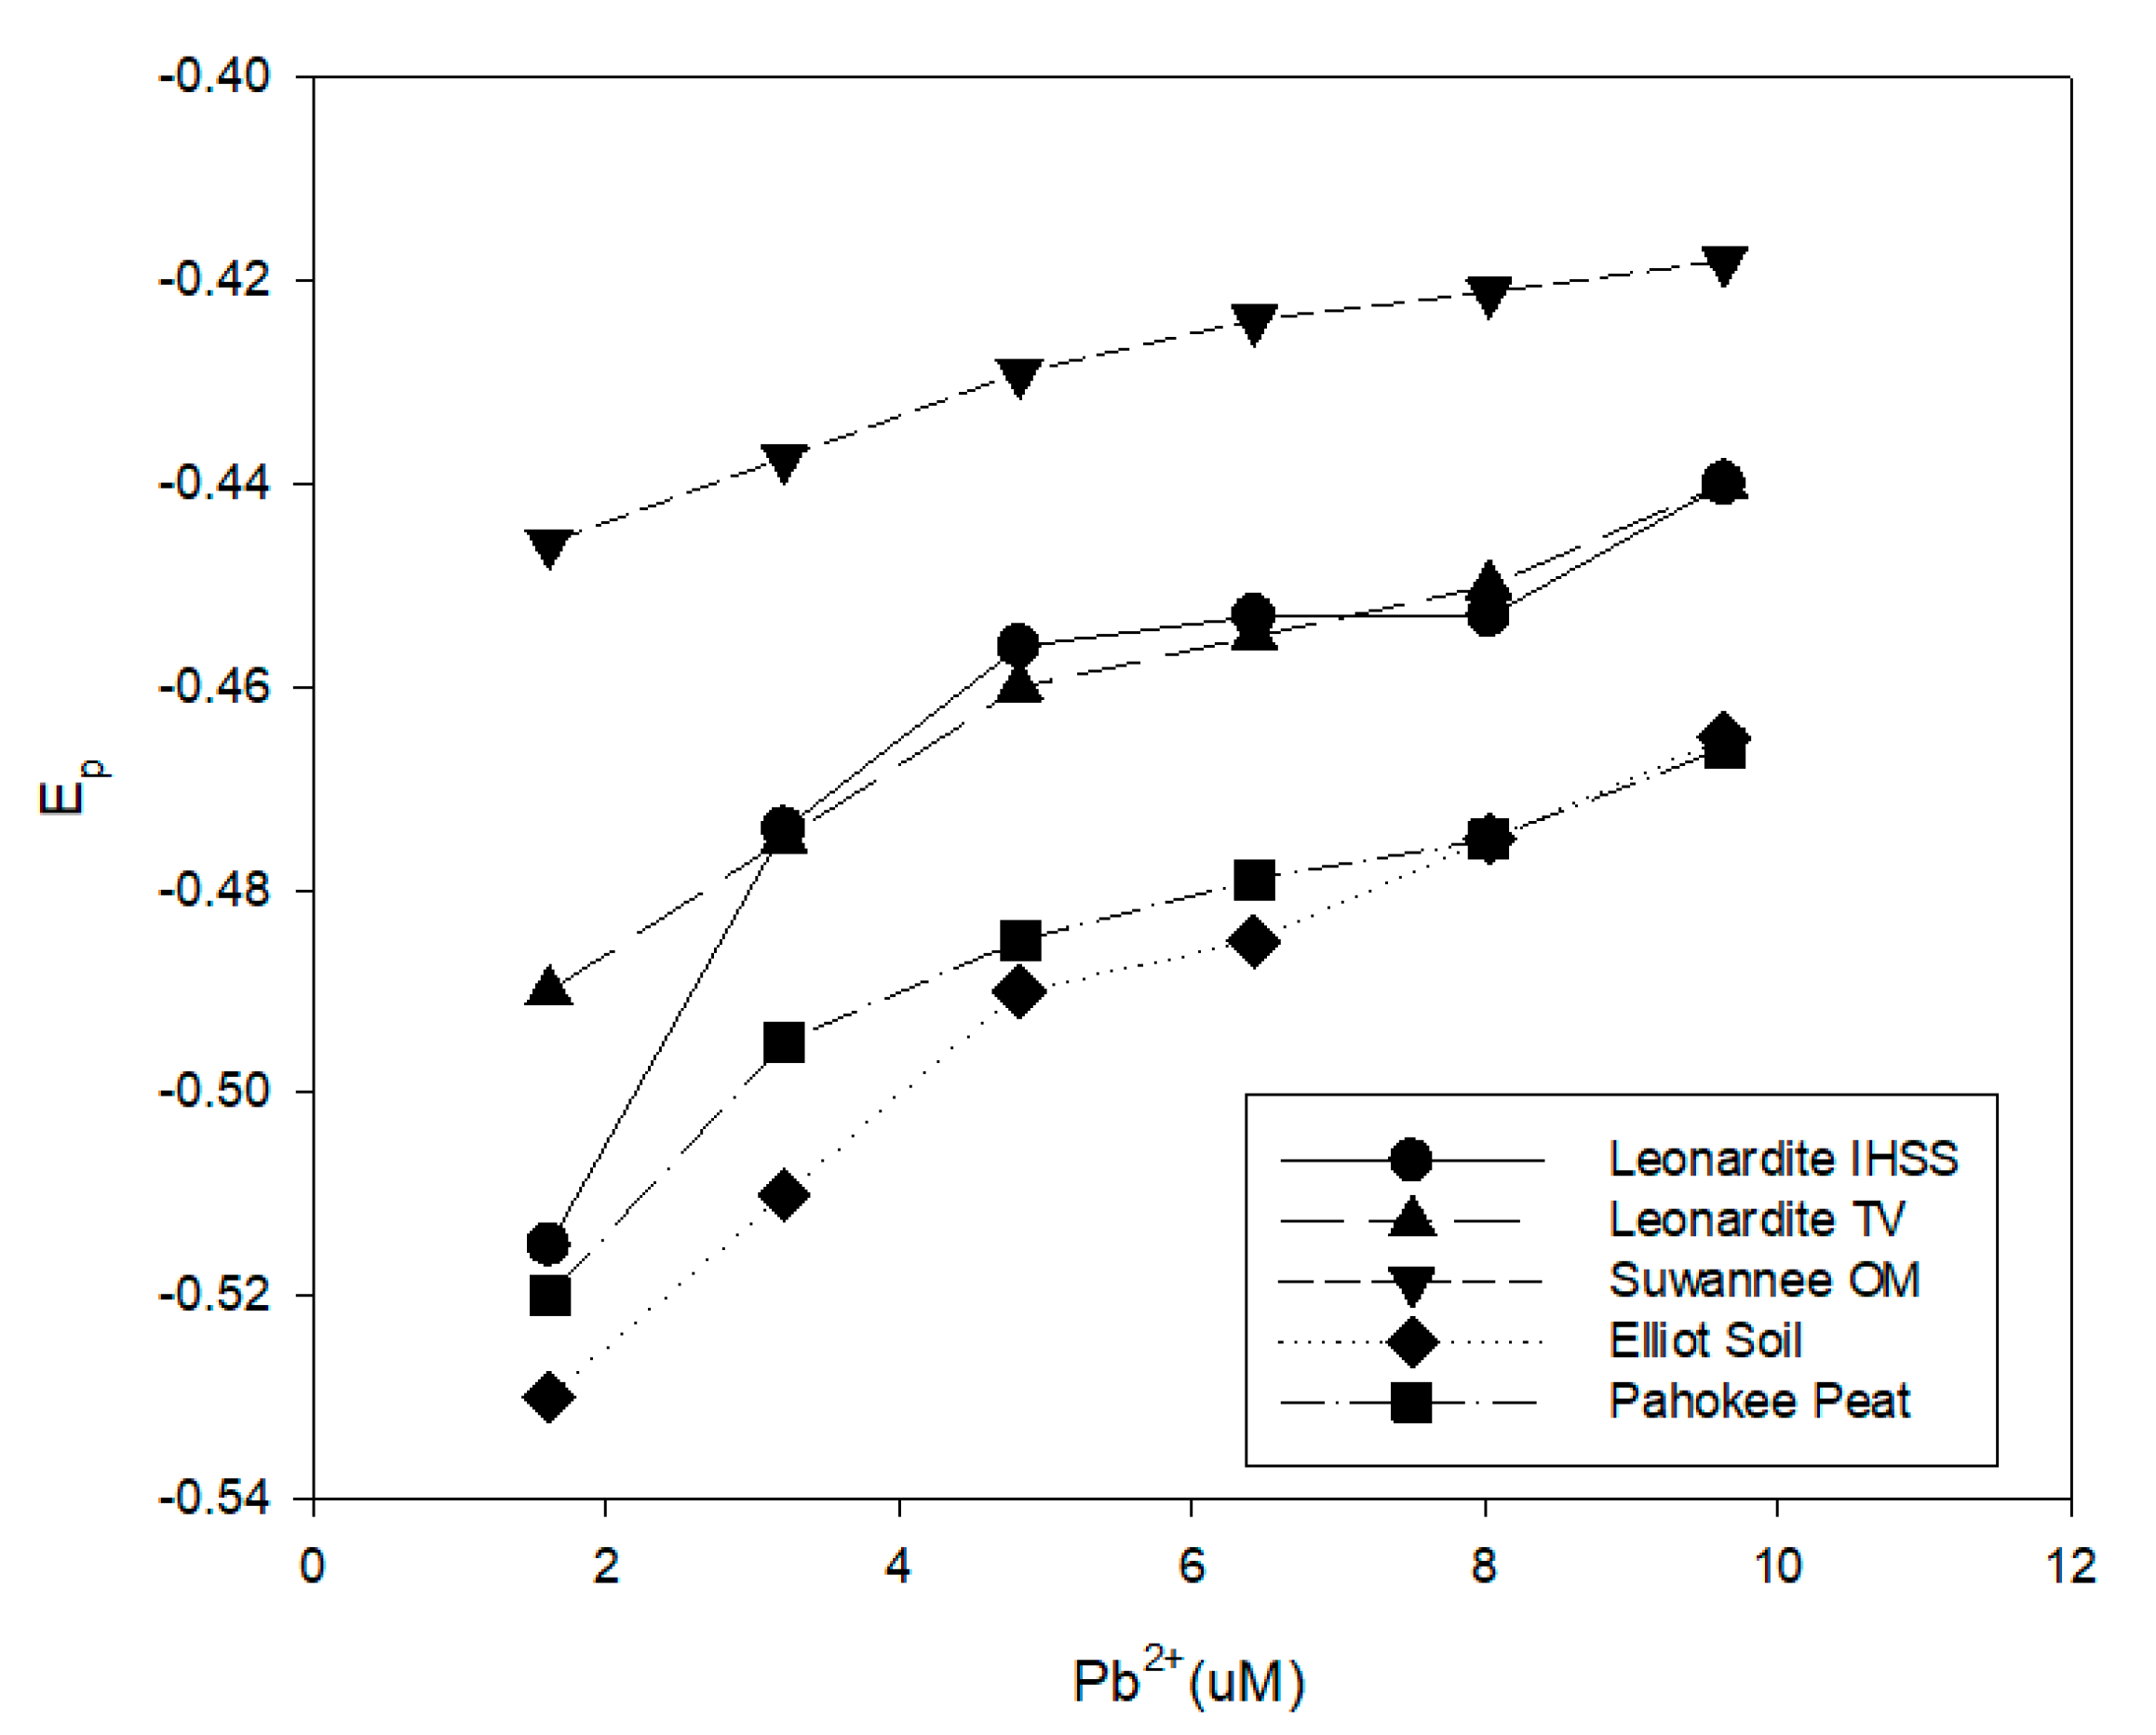
Figure 9.
Comparison of DPP results for Pb2+ at pH 8 in the presence of 100 mg/L Elliot soil humic acid with and without 1.00-M NaNO3.
Figure 9.
Comparison of DPP results for Pb2+ at pH 8 in the presence of 100 mg/L Elliot soil humic acid with and without 1.00-M NaNO3.
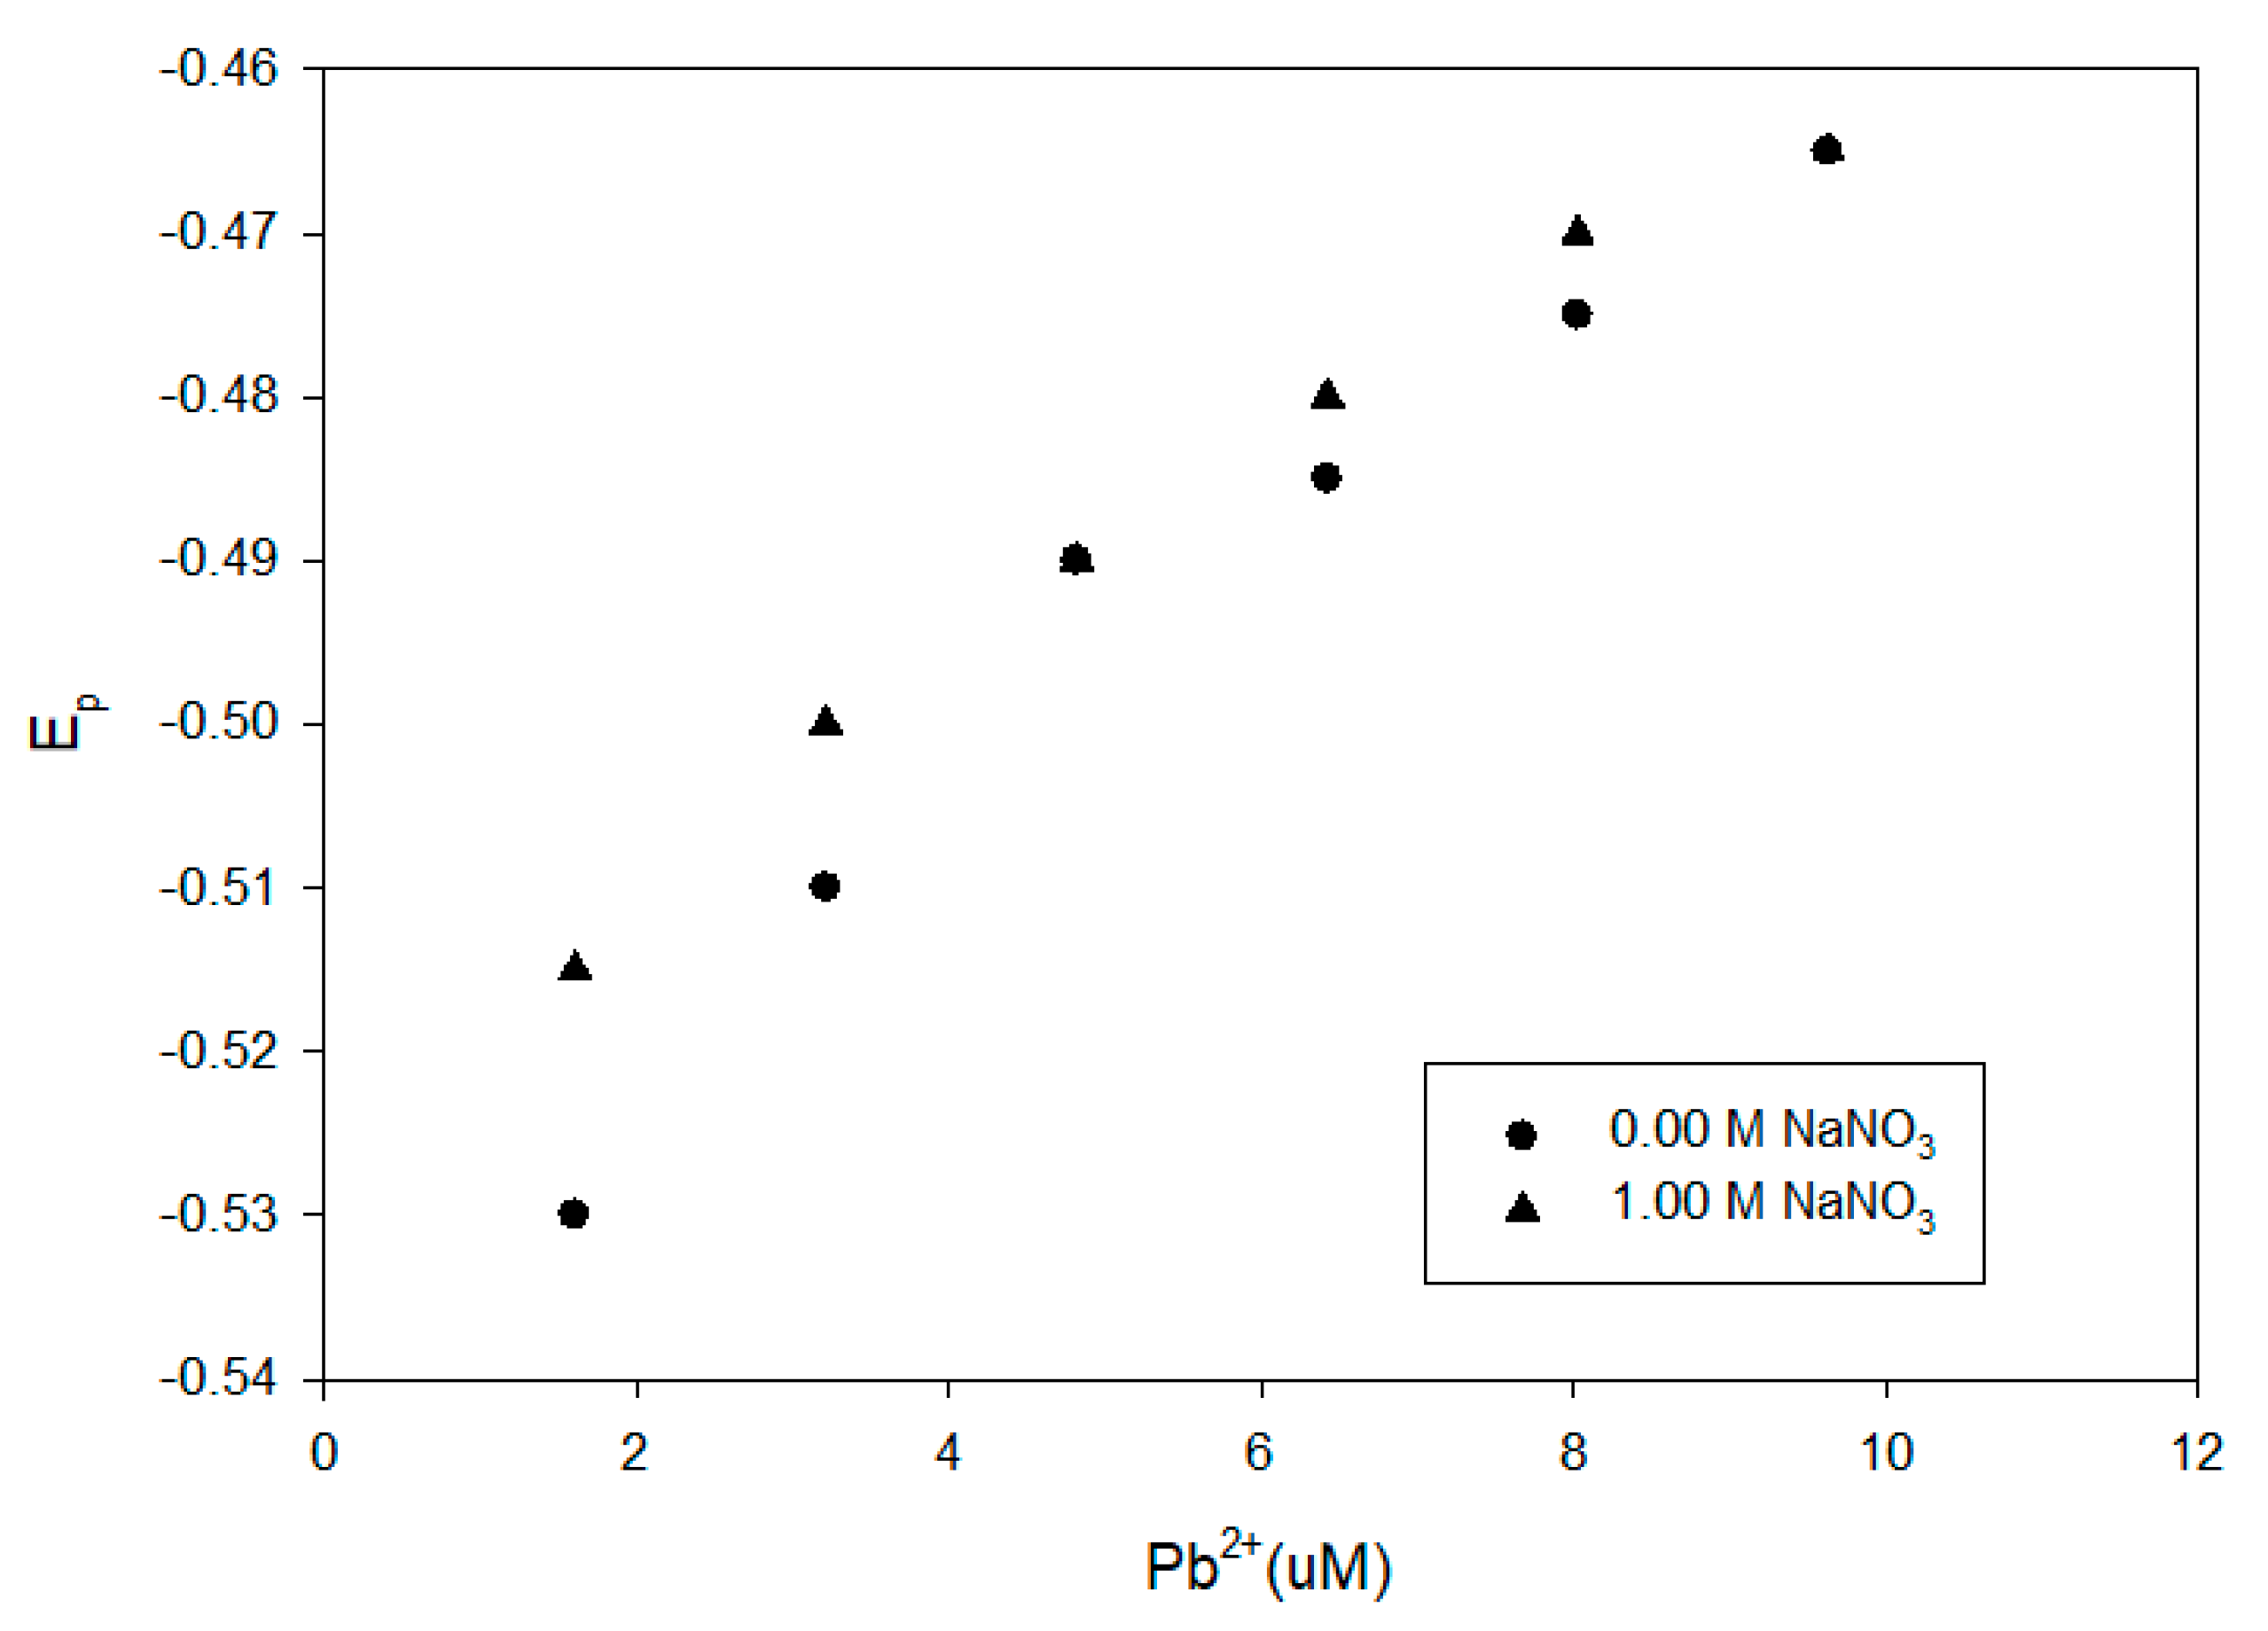
Figure 10.
Comparison of DPP results for Pb2+ at pH 8 in the presence of 100-mg/L Suwannee River NOM with and without 1.00-M NaNO3.
Figure 10.
Comparison of DPP results for Pb2+ at pH 8 in the presence of 100-mg/L Suwannee River NOM with and without 1.00-M NaNO3.
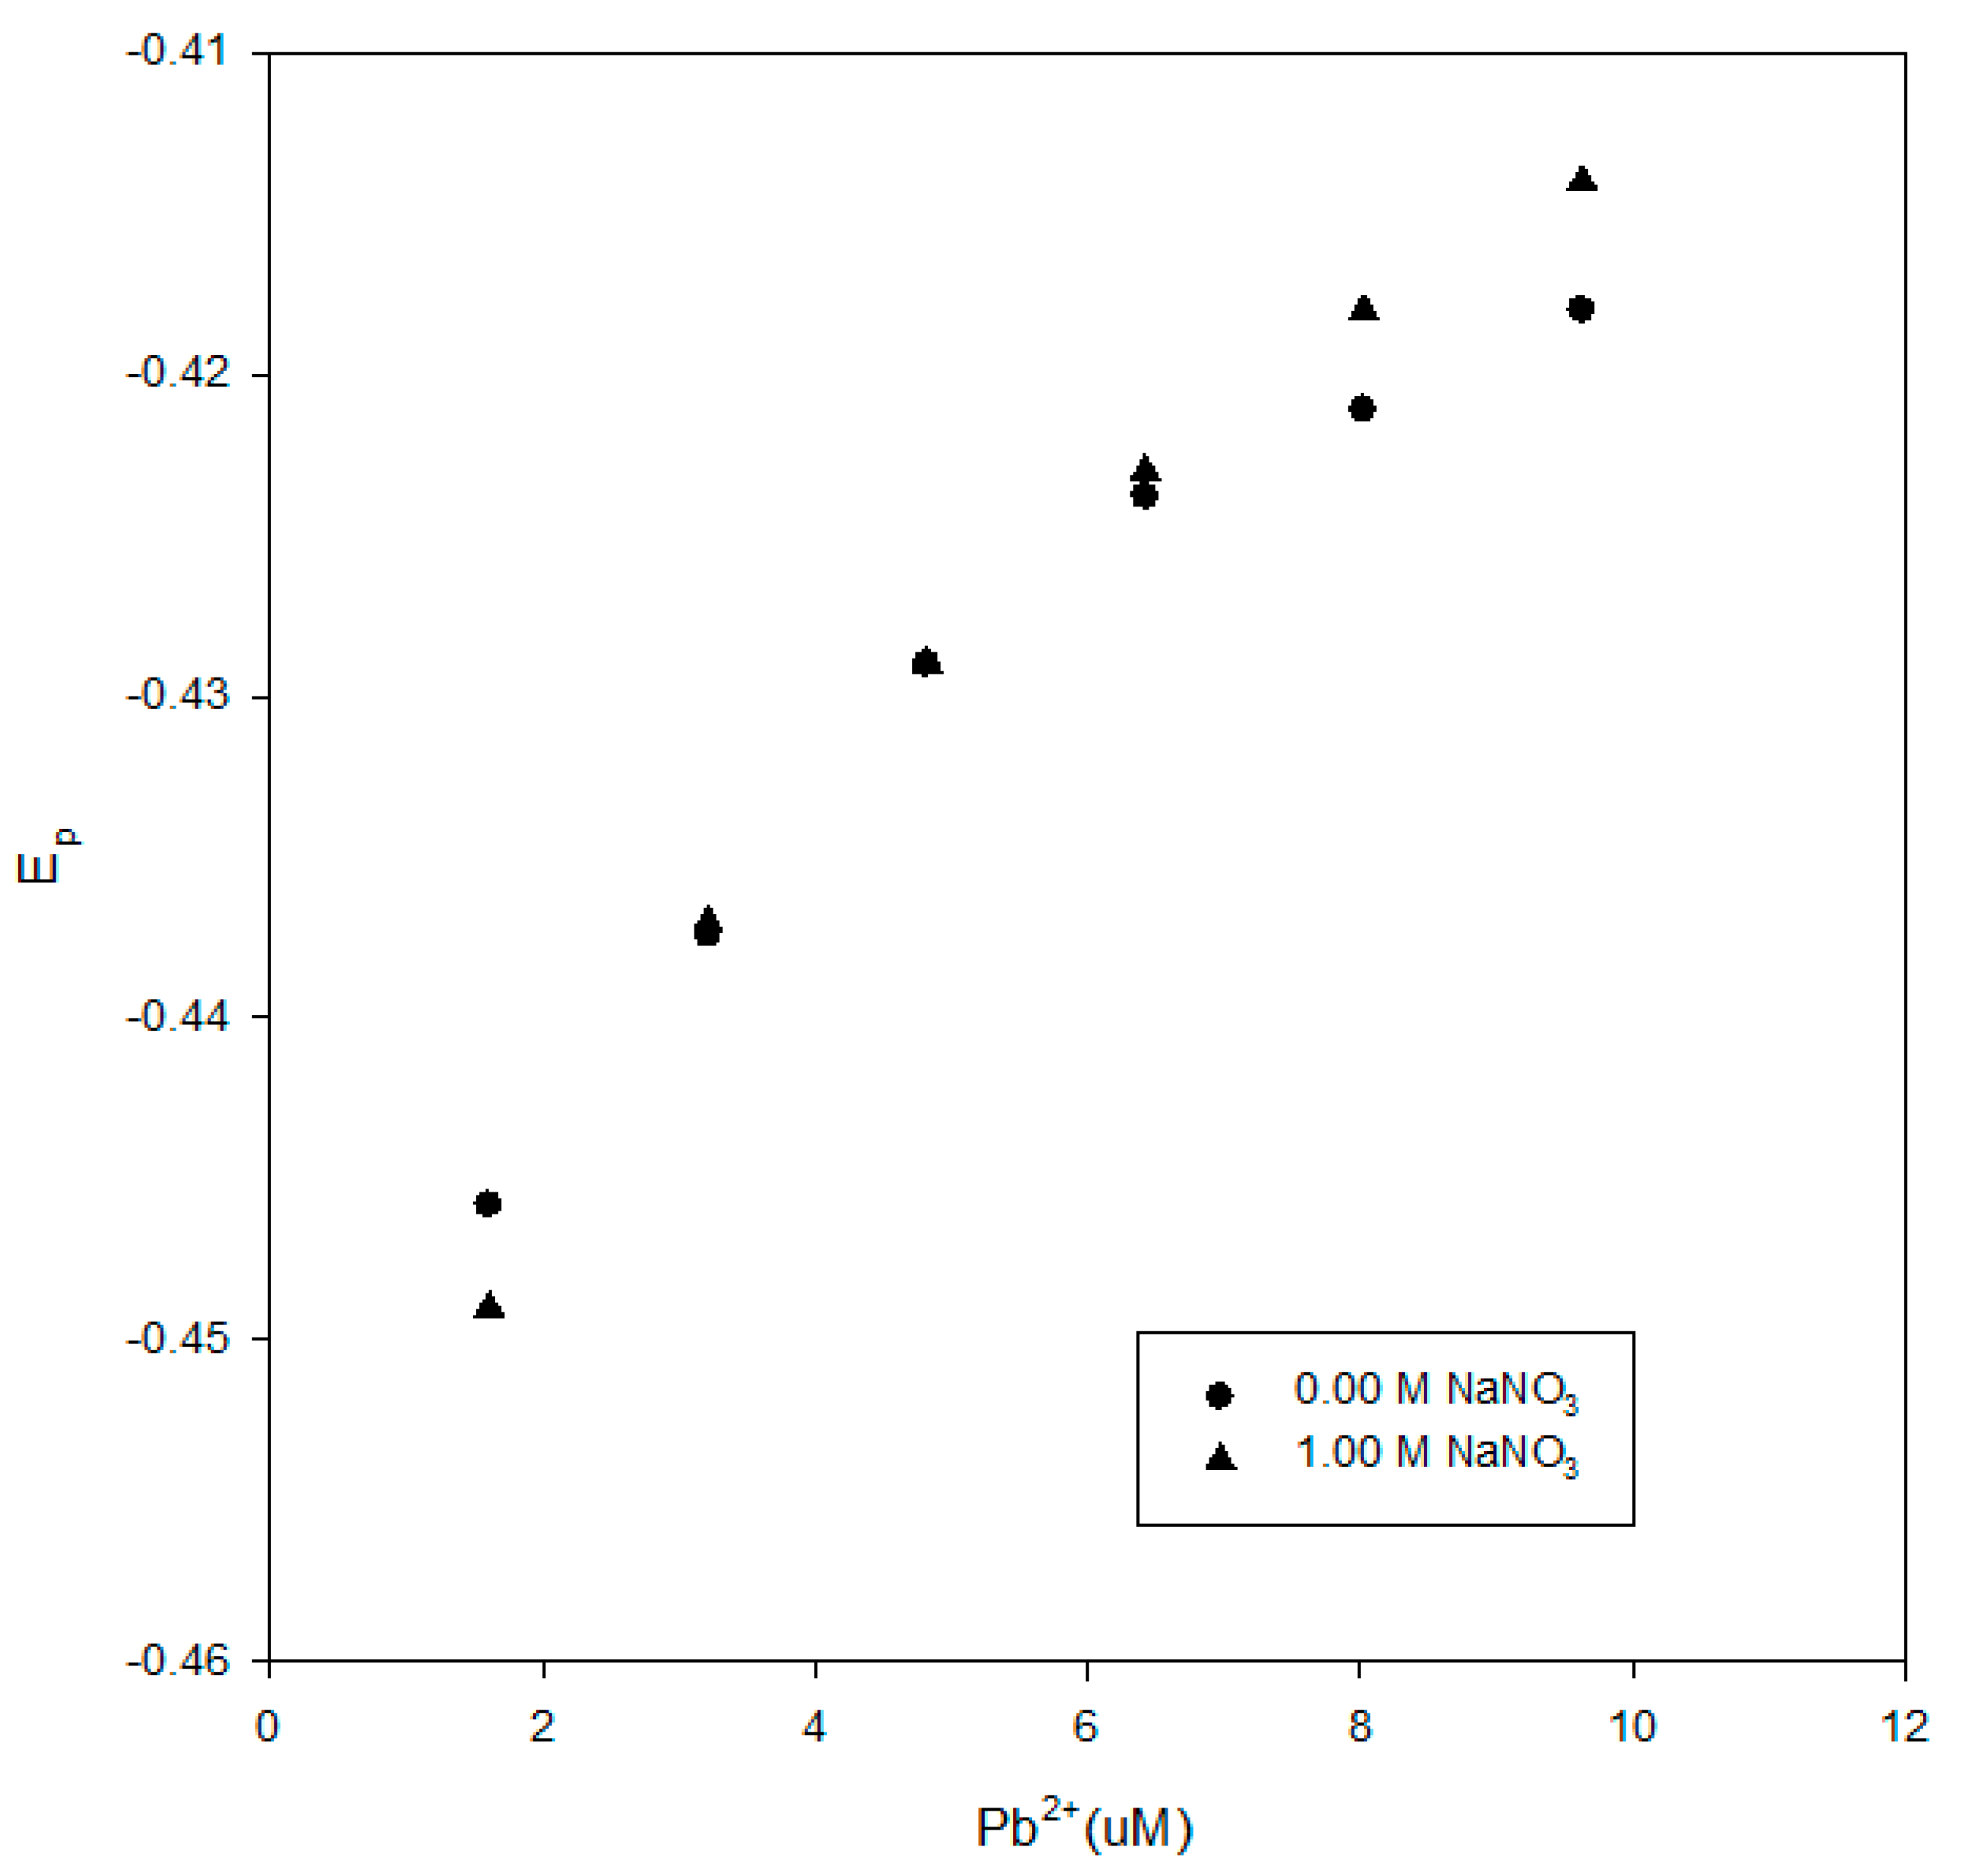
Figure 11.
Comparison of DPP results for Pb2+ at pH 8 in the presence of 100-mg/L International Humic Substances Society (IHSS) leonardite humic acid with and without 1.00-M NaNO3.
Figure 11.
Comparison of DPP results for Pb2+ at pH 8 in the presence of 100-mg/L International Humic Substances Society (IHSS) leonardite humic acid with and without 1.00-M NaNO3.

Figure 12.
Comparison of DPP results for Pb2+ in the presence of a creosote soil extract at three different pH values.
Figure 12.
Comparison of DPP results for Pb2+ in the presence of a creosote soil extract at three different pH values.
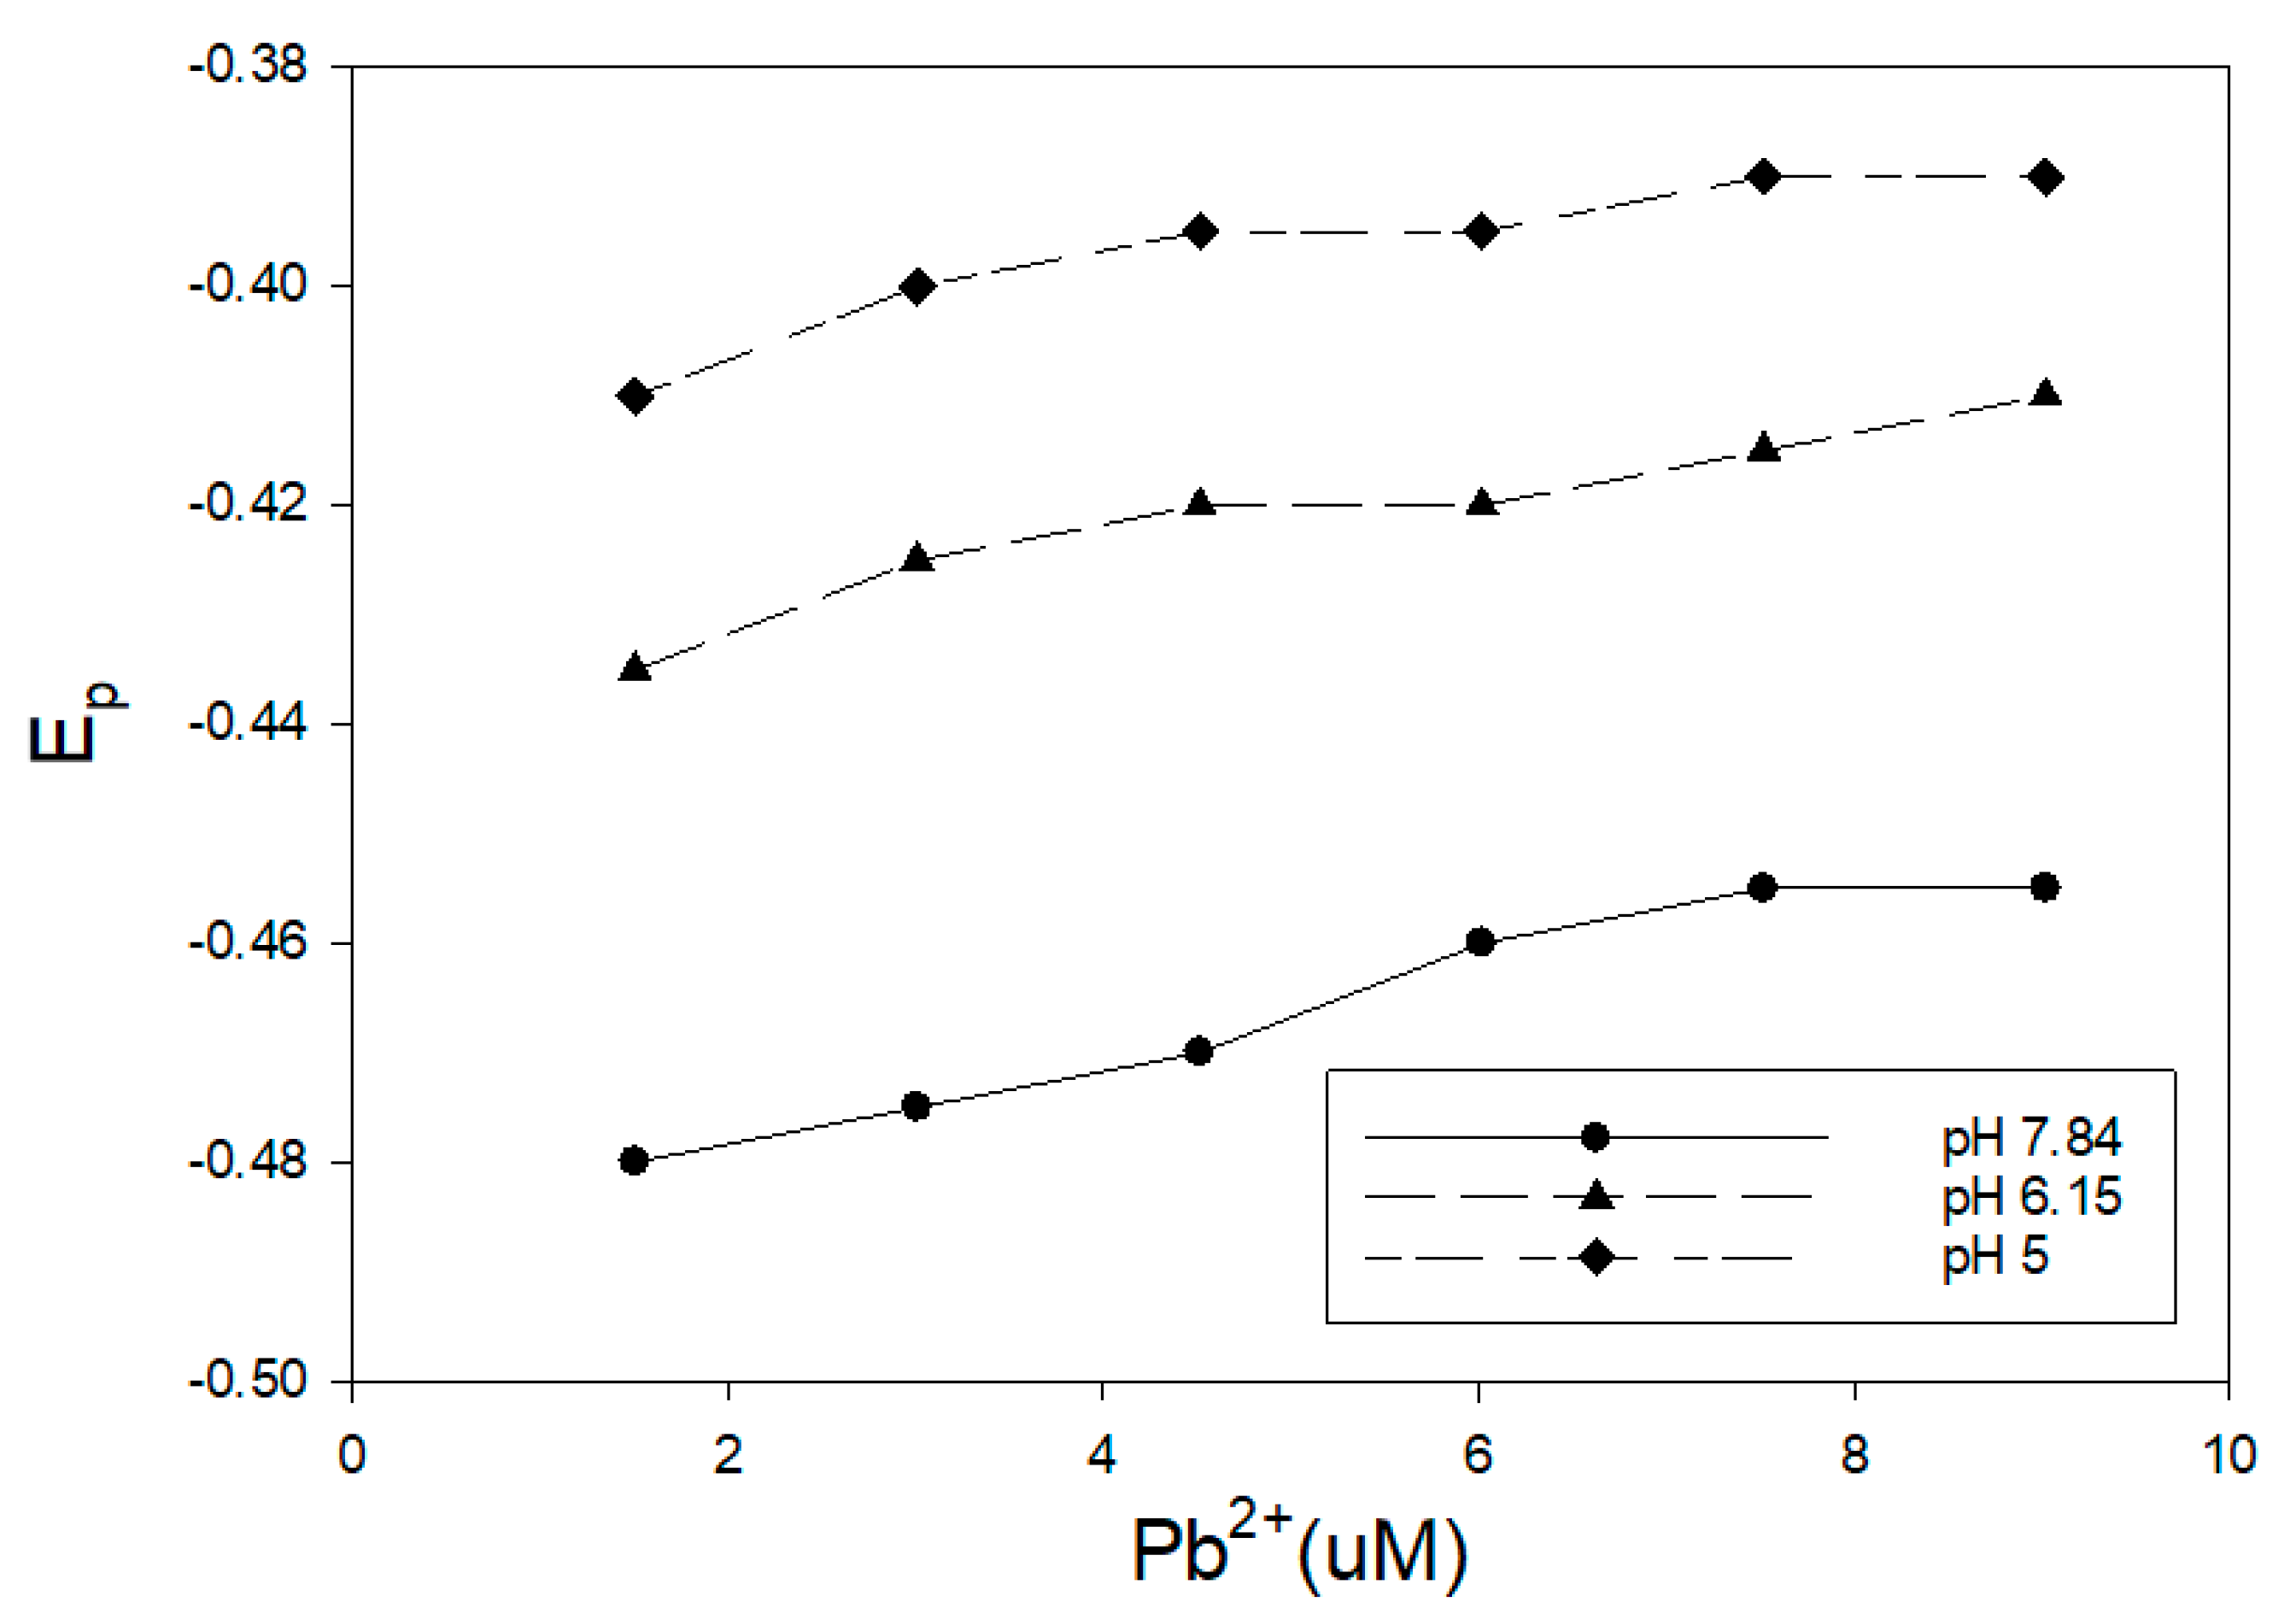
Figure 13.
SEC results for humic materials utilized in this investigations. All of the humic materials had a broad distribution of molecular weights with a significant contribution of materials that are less than 500 mW.
Figure 13.
SEC results for humic materials utilized in this investigations. All of the humic materials had a broad distribution of molecular weights with a significant contribution of materials that are less than 500 mW.

Figure 14.
The influence of the DPP voltage increment (ΔV) on the Ep value. The results are shown for Pahokee peat humic acid at 100 mg/L at a pH of 8 and in the presence of 1.0-M NaNO3. The Pb2+ concentration was 4.8 uM.
Figure 14.
The influence of the DPP voltage increment (ΔV) on the Ep value. The results are shown for Pahokee peat humic acid at 100 mg/L at a pH of 8 and in the presence of 1.0-M NaNO3. The Pb2+ concentration was 4.8 uM.

Figure 15.
The influence of the DPP pulse amplitude on the Ep value. The results are shown for Pahokee peat humic acid at 100 mg/L and a pH of 8 and in the presence of 1.0-M NaNO3. The Pb2+ concentration was 4.8 uM.
Figure 15.
The influence of the DPP pulse amplitude on the Ep value. The results are shown for Pahokee peat humic acid at 100 mg/L and a pH of 8 and in the presence of 1.0-M NaNO3. The Pb2+ concentration was 4.8 uM.

Figure 16.
The influence of the DPP pulse period on the Ep value. The results are shown for Pahokee peat humic acid at 100 mg/L and a pH of 8 and in the presence of 1.0-M NaNO3. The Pb2+ concentration was 4.8 uM.
Figure 16.
The influence of the DPP pulse period on the Ep value. The results are shown for Pahokee peat humic acid at 100 mg/L and a pH of 8 and in the presence of 1.0-M NaNO3. The Pb2+ concentration was 4.8 uM.

Table 1.
The weight average (Mw) and number average (Mn) molecular weights for the humic substances as determined by SEC (Size exclusion chromatography) with detection at 280 nm are reported. Natural Organic Matter (NOM), TV: TeraVita, IHSS: International Humic Substances Society and HA: humic acid.
| Sample | Mw | Mn |
|---|---|---|
| Leonardite TeraVita | 1020 | 175 |
| Leonardite IHSS | 2360 | 537 |
| Pahokee HA | 2020 | 191 |
| Suwannee NOM | 1150 | 648 |
| Elliot Soil HA | 9490 | 1410 |
Table 2.
Estimated conditional logK for humic substances at pH 8.
| Sample | logK (Mw) | logK (Mn) |
|---|---|---|
| Elliot Soil | 11.8 | 11.0 |
| Leonardite IHSS | 10.9 | 10.3 |
| Pahokee Peat | 10.8 | 9.8 |
| Leonardite TeraVita | 9.5 | 8.7 |
| Suwannee NOM | 8.1 | 7.8 |
Publisher’s Note: MDPI stays neutral with regard to jurisdictional claims in published maps and institutional affiliations. |
© 2020 by the authors. Licensee MDPI, Basel, Switzerland. This article is an open access article distributed under the terms and conditions of the Creative Commons Attribution (CC BY) license (http://creativecommons.org/licenses/by/4.0/).
Share and Cite
MDPI and ACS Style
Steinberg, S.; Hodge, V. Lead Complexation by Humic Acids and Their Analogs: A Voltammetric Study. Environments 2020, 7, 94. https://0-doi-org.brum.beds.ac.uk/10.3390/environments7110094
AMA Style
Steinberg S, Hodge V. Lead Complexation by Humic Acids and Their Analogs: A Voltammetric Study. Environments. 2020; 7(11):94. https://0-doi-org.brum.beds.ac.uk/10.3390/environments7110094
Chicago/Turabian StyleSteinberg, Spencer, and Vernon Hodge. 2020. "Lead Complexation by Humic Acids and Their Analogs: A Voltammetric Study" Environments 7, no. 11: 94. https://0-doi-org.brum.beds.ac.uk/10.3390/environments7110094
Note that from the first issue of 2016, this journal uses article numbers instead of page numbers. See further details here.