Visualization of Rare Metal-Enriched Zones in Waste Landfills Using Induced Polarization Method

Faculty of Science and Engineering, Waseda University, 3-4-1, Okubo, Shinjuku-ku, Tokyo 169-8555, Japan
*
Author to whom correspondence should be addressed.
Environments 2020, 7(11), 95; https://0-doi-org.brum.beds.ac.uk/10.3390/environments7110095
Submission received: 12 September 2020
/
Revised: 12 October 2020
/
Accepted: 25 October 2020
/
Published: 27 October 2020
(This article belongs to the Special Issue Development of Advanced Landfill Methods and Remote Sensing for Landfill Monitoring)
Abstract
:We consider the studied landfill site an urban mine and developed a series of projects on metal endowment forms, nondestructive investigation methods for metal-enriched zones, metal extraction methods from enriched zones, and useful metal selection methods. This paper examines the exploration method. Induced polarization (IP) exploration was carried out at a T disposal site filled in the studied valley. In addition, three drillings were conducted in the studied exploration area. Using the core samples, IP parameters and metal contents were measured. Then, by comparing these data, we examined the effectiveness of the IP method for the visualization of metal-enriched zones in unsaturated landfills. The results of this experiment revealed that the iron-sulfide-enriched zone in the valley filling landfill can be identified by IP exploration. In addition, we clarified the types and contents of rare metals that coexist in iron sulfide. This process allows for further evaluation of landfills as a deposit.
1. Introduction
Japan lacks useful metal resources and mostly relies on imports from overseas. In particular, the distribution of rare metal resources on the earth is uneven, and there are concerns about their depletion. Therefore, the stockpiling of necessary metal resources in preparation for future scarcity is important. Furthermore, used resources should be recycled in consideration of environmental sustainability. Japan particularly intends to undertake the aforementioned steps because, as an industrial nation, it has a need for extensive metallic resources.
Since the high economic growth period of the 1960s, Japan has produced and is a consumer of a variety of home appliances. These products contain various useful metals, including rare metals. Some of the used metals are crushed and disposed of in landfill disposal sites. However, almost no metals are detected from the leachate of such disposal sites [1,2]. Most of the surface-layer metals are salts with low solubility such as carbonates, sulfates, and hydroxides, or exist in the form of adsorbents in soil particles [3,4]. In other words, landfilled metals remain in the landfills.
The environment in landfills is anaerobic and easily penetrated by rainwater. In addition, the temperature exceeds 50 °C during a certain period due to the decomposition of organic matter by microorganisms. Metals in the landfills are possibly moved by water seeping into the fills and form a concentrated zone depending on the characteristics of the metal and condition of the fills. Authors have focused on the possibility of such landfills acting as urban mines and electric exploration being a potential approach of identifying metal-enriched zones. There are various methods to conduct this exploration. The resistivity method is effective in elucidating the structure and condition of landfills and has been examined in many studies [5,6,7,8,9,10]. The induced polarization (IP) method is effective for the exploration of sulfide minerals with strong polarizability, such as chalcopyrite and pyrite [11,12,13,14]. As landfills are anaerobic, most metals in the fills are in sulfide form. Therefore, we examined the effectiveness of the IP method in visualizing the metal-enriched zone in landfills.
Authors have already confirmed that the IP method is effective in the identification of the metal-enriched zone at a landfill site where an artificial pond with a rubber sheet at the bottom was filled [15]. However, a disposal site filling the valley, which is relatively more common in Japan, has not been studied. At the disposal site in the artificial pond, the pores of the fills are generally saturated with leachate and are very anaerobic. On the other hand, the fills at the valley site are unsaturated and the distribution of water content in the fills is irregular, which is expected to affect the IP phenomenon.
Therefore, in this study, IP exploration was carried out at a T disposal site in the studied valley. In addition, three drillings were conducted in the exploration area. Using the core samples, IP parameters and metal contents were measured. By comparing these data, we examined the effectiveness of the IP method for the visualization of metal-enriched zones in unsaturated landfills.
2. Experimental Sections
2.1. Field Experiment
2.1.1. Experimental Site
The disposal site used in this study is located in the uppermost part of the valley floor, which is divided into 3 blocks: No. 1 to No. 3. The experimental site corresponds to one section of the No. 2 block, which was operated between 1992 and 2006. The landfill was more than 20 m thick, had a capacity of approximately 1,000,000 m3, and was filled with incinerator ash, sludge, and dust.
2.1.2. Experimental Method
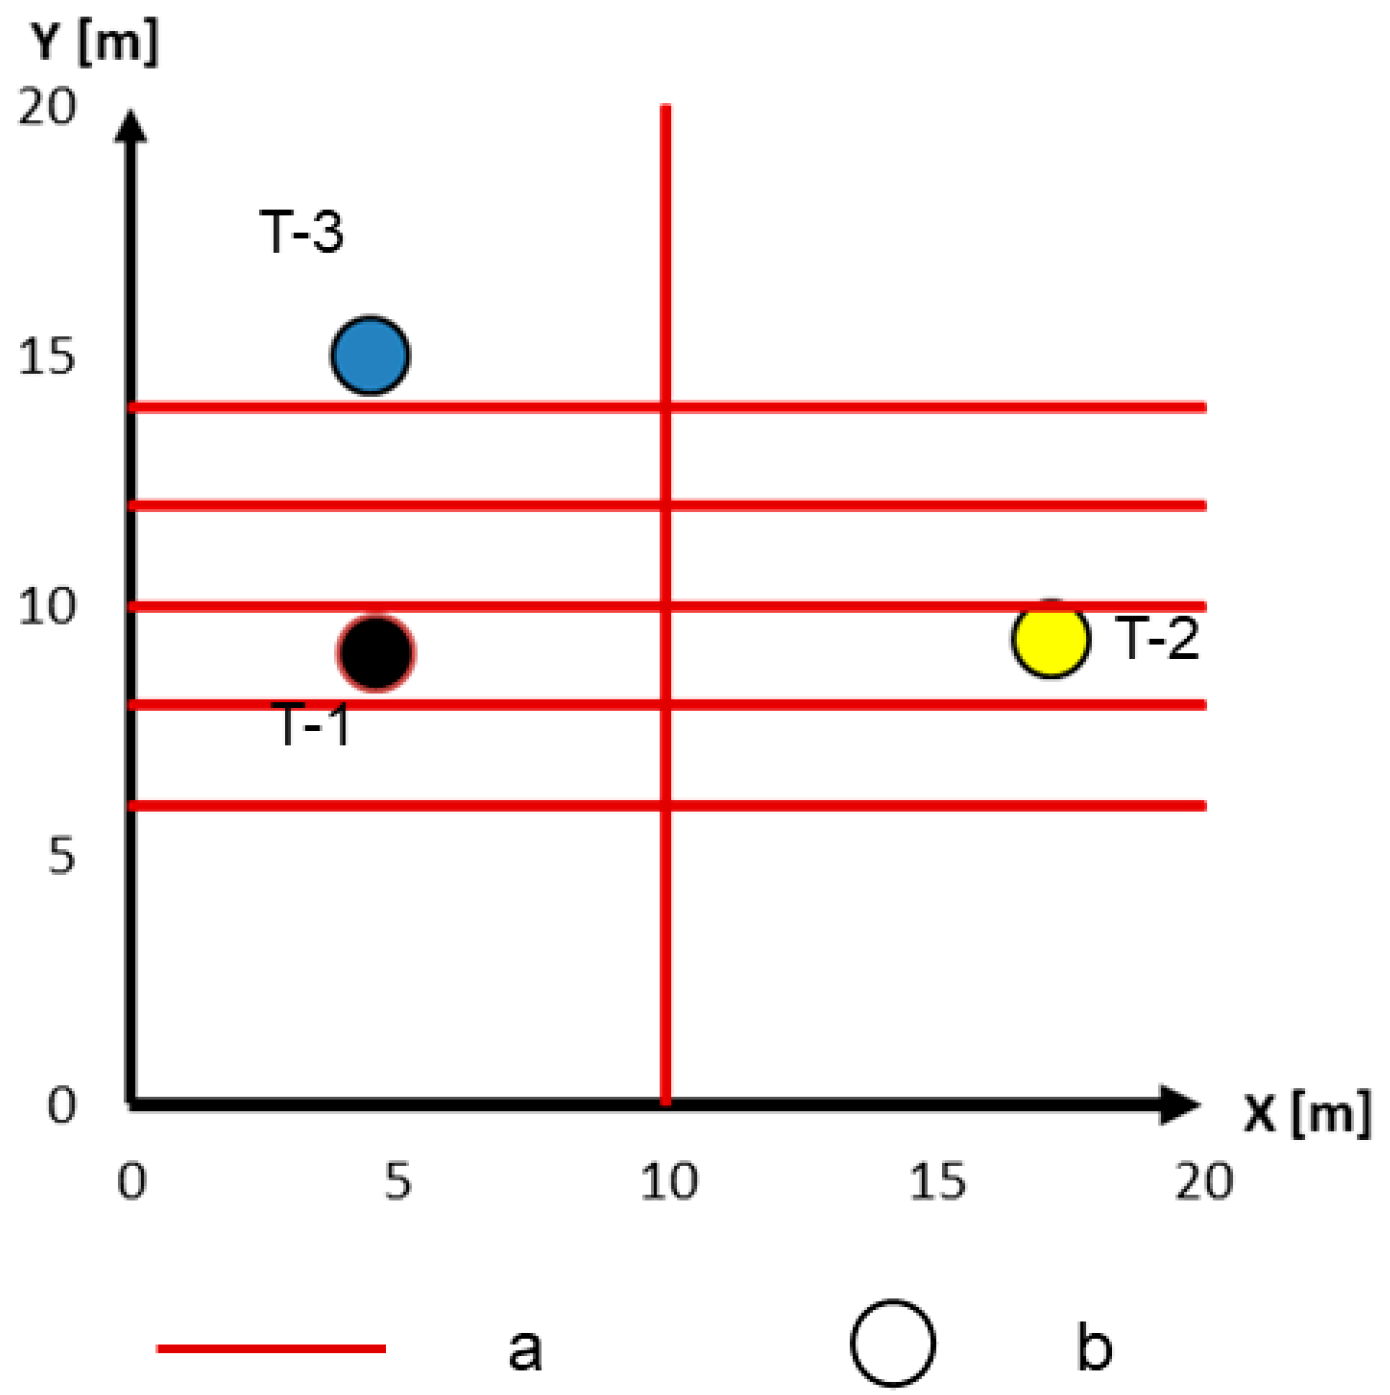
At the No. 2 block of the T disposal site, exploration using the resistivity and IP method was carried out using a dipole/dipole array. Six 20 m survey lines were installed in the block to be surveyed (Figure 1). A stainless steel rod with a diameter of 1 cm and length of 50 cm was used as the current and potential electrode for the measurement of resistivity. Further, the stainless rod used in the resistivity measurement was used in the IP measurement as the current electrode, and the nonpolarized electrode was used as the potential electrode. This electrode was obtained by immersing a copper wire coil into an unglazed pot filled with a copper sulfate solution. The electrode spacing was 2 m. SuperSting R8/IP (manufactured by AGI) was used as the measuring device. Then, by analyzing this exploration result using EarthImager 3D (manufactured by AGI), resistivity and chargeability profiles were obtained. The analysis was performed by setting a semi-infinite region, and the mesh was automatically divided. The disposal site focused on in this study is a site located in the uppermost part of the valley floor. This is divided into 3 blocks: No. 1 to No. 3. The experimental site corresponds to one corner of the No. 2 block. This block was operated between 1992 and 2006. The thickness of the landfill is over 20 m, the capacity is about 1,000,000 m3, and the filling materials are incinerator ash, sludge, and dust.
2.2. Box Experiment
2.2.1. Calibration of the Experiment Box Used
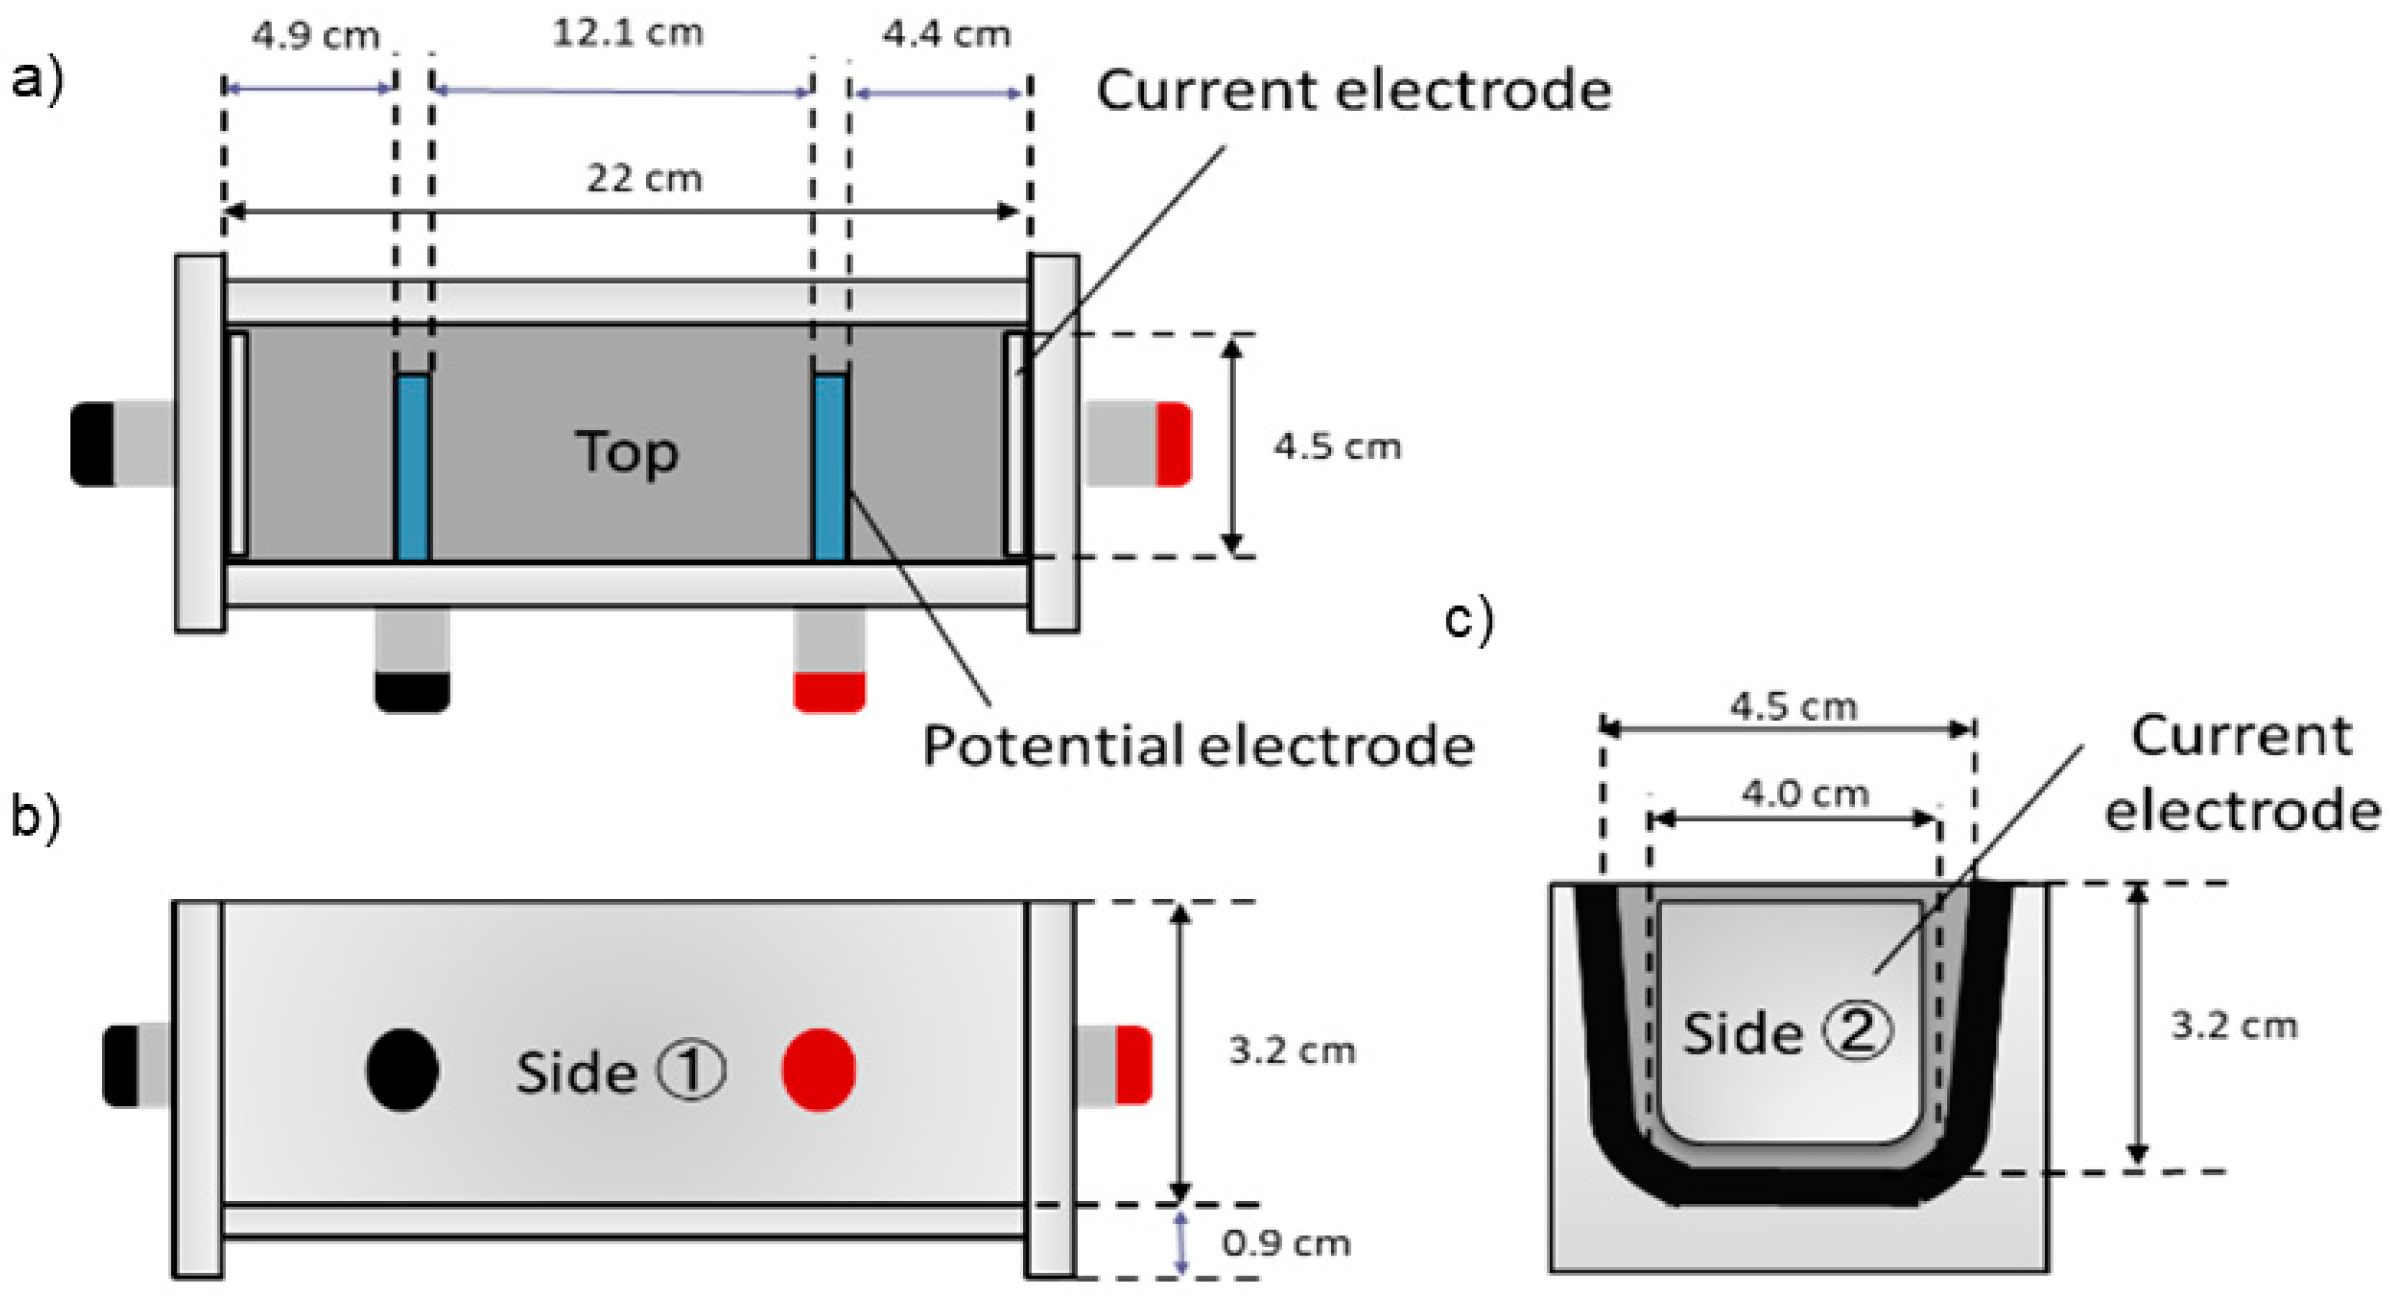
In this experiment, the PFE value and chargeability of each sample were measured using an acrylic sample holder manufactured by AGI (Figure 2). When using a sample holder, the measured value may vary depending on the shape of the holder. We examined whether the measured values obtained using this holder were similar to the values obtained using a conventional holder using a mixed sample of sand and iron sulfide. The mixing ratios of the sand/iron sulfide samples were set to 4:1, 3:2, 1:1, 2:3, and 1:4.
2.2.2. Measurement of IP Effect Using Landfill Core Samples
The drilling sample collected at the above-mentioned field experiment site was used as the box filling sample. These samples were drilling samples at three points selected on the basis of the charging rate profile. Figure 1 shows the excavation points. The excavation depth is 5 m for T-1 and T-3 and 6 m for T-2. Boring cores were categorized according to the landfill contents and evenly sampled from each division. There were 6 samples from T-1, 9 samples from T-2, and 8 samples from T-3. Each sample was air-dried, crushed, and passed through a 2 mm sieve, after which it was used as the filling sample.
2.2.3. Method
The measurement piece was created by dropping and filling the sample in a box filled with pure water. This operation was performed to achieve packing for each sample. The IP effect was examined using the PFE value (Telford et al., 1990) and chargeability. The former measured the specific resistance of the piece at frequencies of 1 and 0.1 Hz using the micro-output IP transmitter TSS-57E and the forced polarization type receiver DF-58CK (manufactured by Yokohama Electronics Research Laboratory). Then, the PFE value was calculated using Equation (1).
where ρ is resistivity.
PFE(%) = {(ρ0.1 Hz − ρ1 Hz)/ρ1 Hz} × 100
The chargeability was measured via SuperSting R8/IP (manufactured by AGI) and used in the field experiment.
2.3. Metal Content Analysis
The main metal concentration of each sample used in the box experiment was measured. Approximately 1 g was randomly obtained from the dried sample and placed in a Teflon beaker. Then, nitric acid and hydrochloric acid were added, and the metal was eluted while heating. After the reaction, a liquid sample for analysis was prepared by filtering the solution. The metal content of these samples was measured using an ICP emission spectrometer (Agilent 5100 type) and an ICP mass spectrometer (Agilent 7700 type). The measurement was performed using ICP-OES for major metal elements such as Fe and ICP-MS for other trace metal elements. The lower limits of quantification of the main elements in this analysis are as follows: Fe: 0.02, Al: 0.02, Cu: 0.004, Pb: 0.02, Zn: 0.003 (ppm); Ti: 0.07, V: 0.02, Cr: 0.02, Mn: 0.02, Ni: 0.03, Ga: 0.01, Sr: 0.005 (ppb).
3. Results
3.1. Chargeability Profile Obtained from Field Experiment
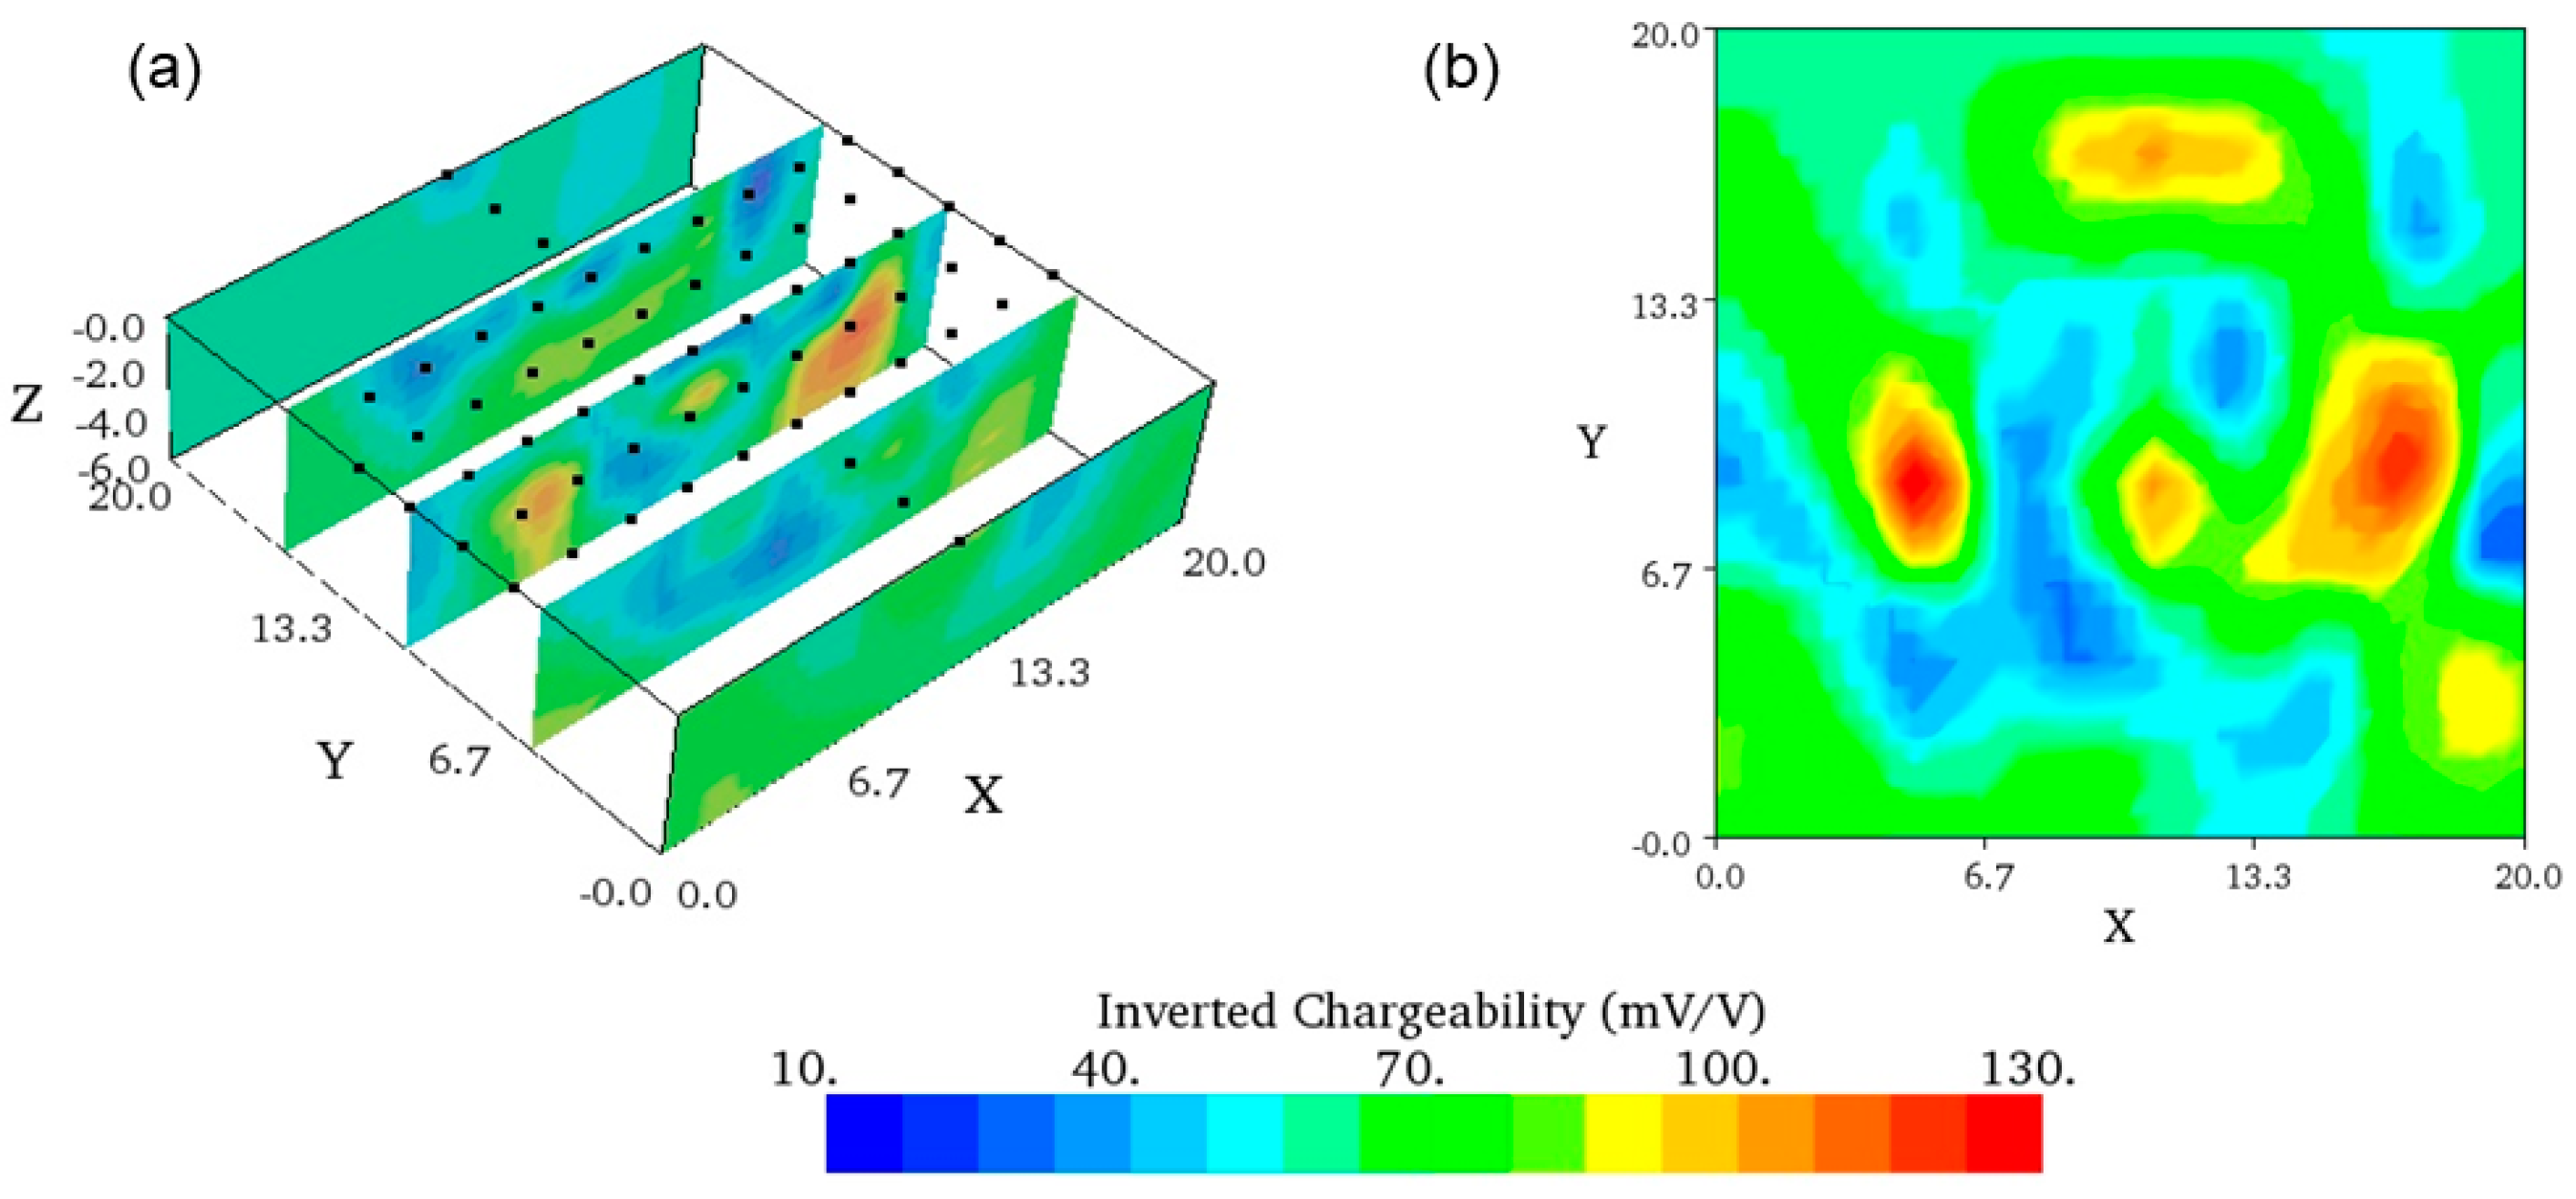
In the obtained profile groups, high chargeability zones over 100 mV/V were scattered. As an example, the profile group parallel to the XZ plane and the profile of the XY plane with a depth Z of 3.0 m are shown in Figure 3a,b, respectively. The drilled points are also added in Figure 3b. Evidently, T-1 and T-2 were the drilling high chargeability zone around 130 mV/V, and T-3 was the low chargeability zone around 50 mV/V.
3.2. IP Effect of the Box-filled Sample
3.2.1. Relationship between IP Effect and Iron Sulfide Content
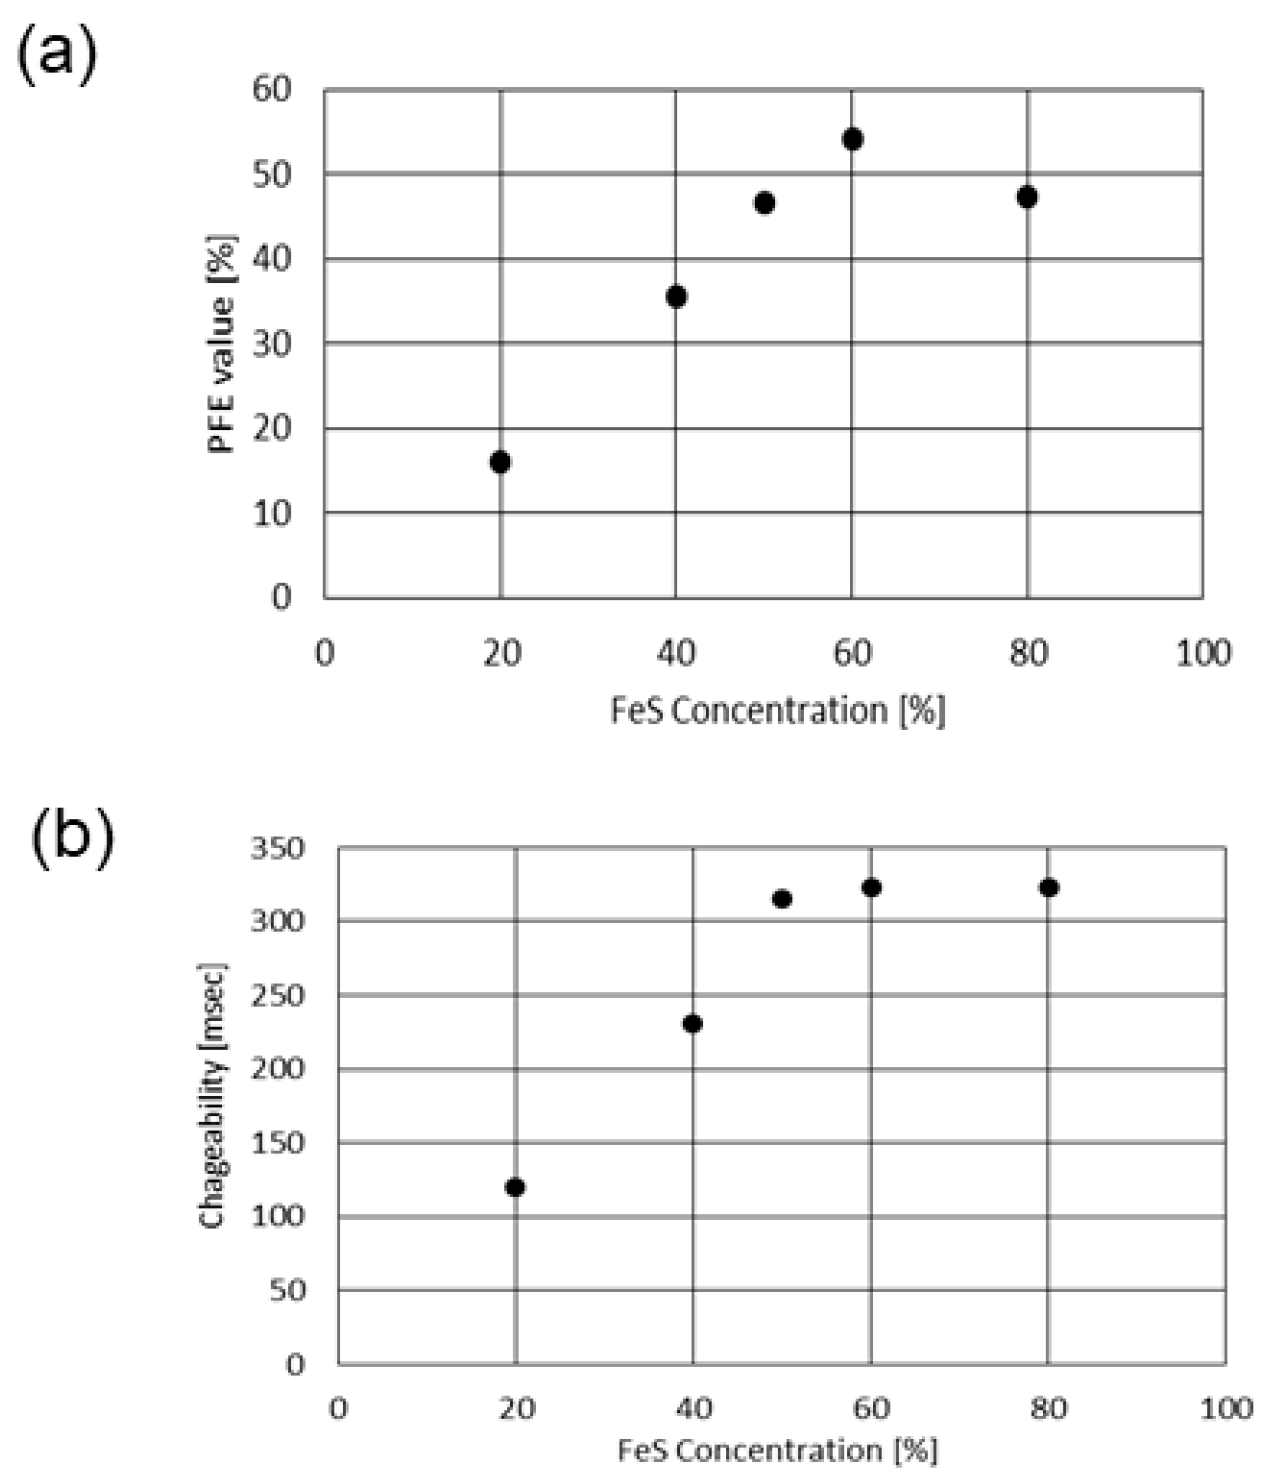
The IP effect of the sample can be indicated by the PFE value or chargeability. The IP effects of the mixtures of sand and iron sulfide particles with weight ratios of 4:1, 3:2, 1:1, 2:3, and 1:4 are shown in Figure 4. The iron sulfide content increased up to approximately 60% in the PFE value and the chargeability and then remained unchanged or decreased slightly. This tendency is almost the same as that observed in the experiment conducted using a differently shaped box [15].
3.2.2. IP Effect of Drilled Samples
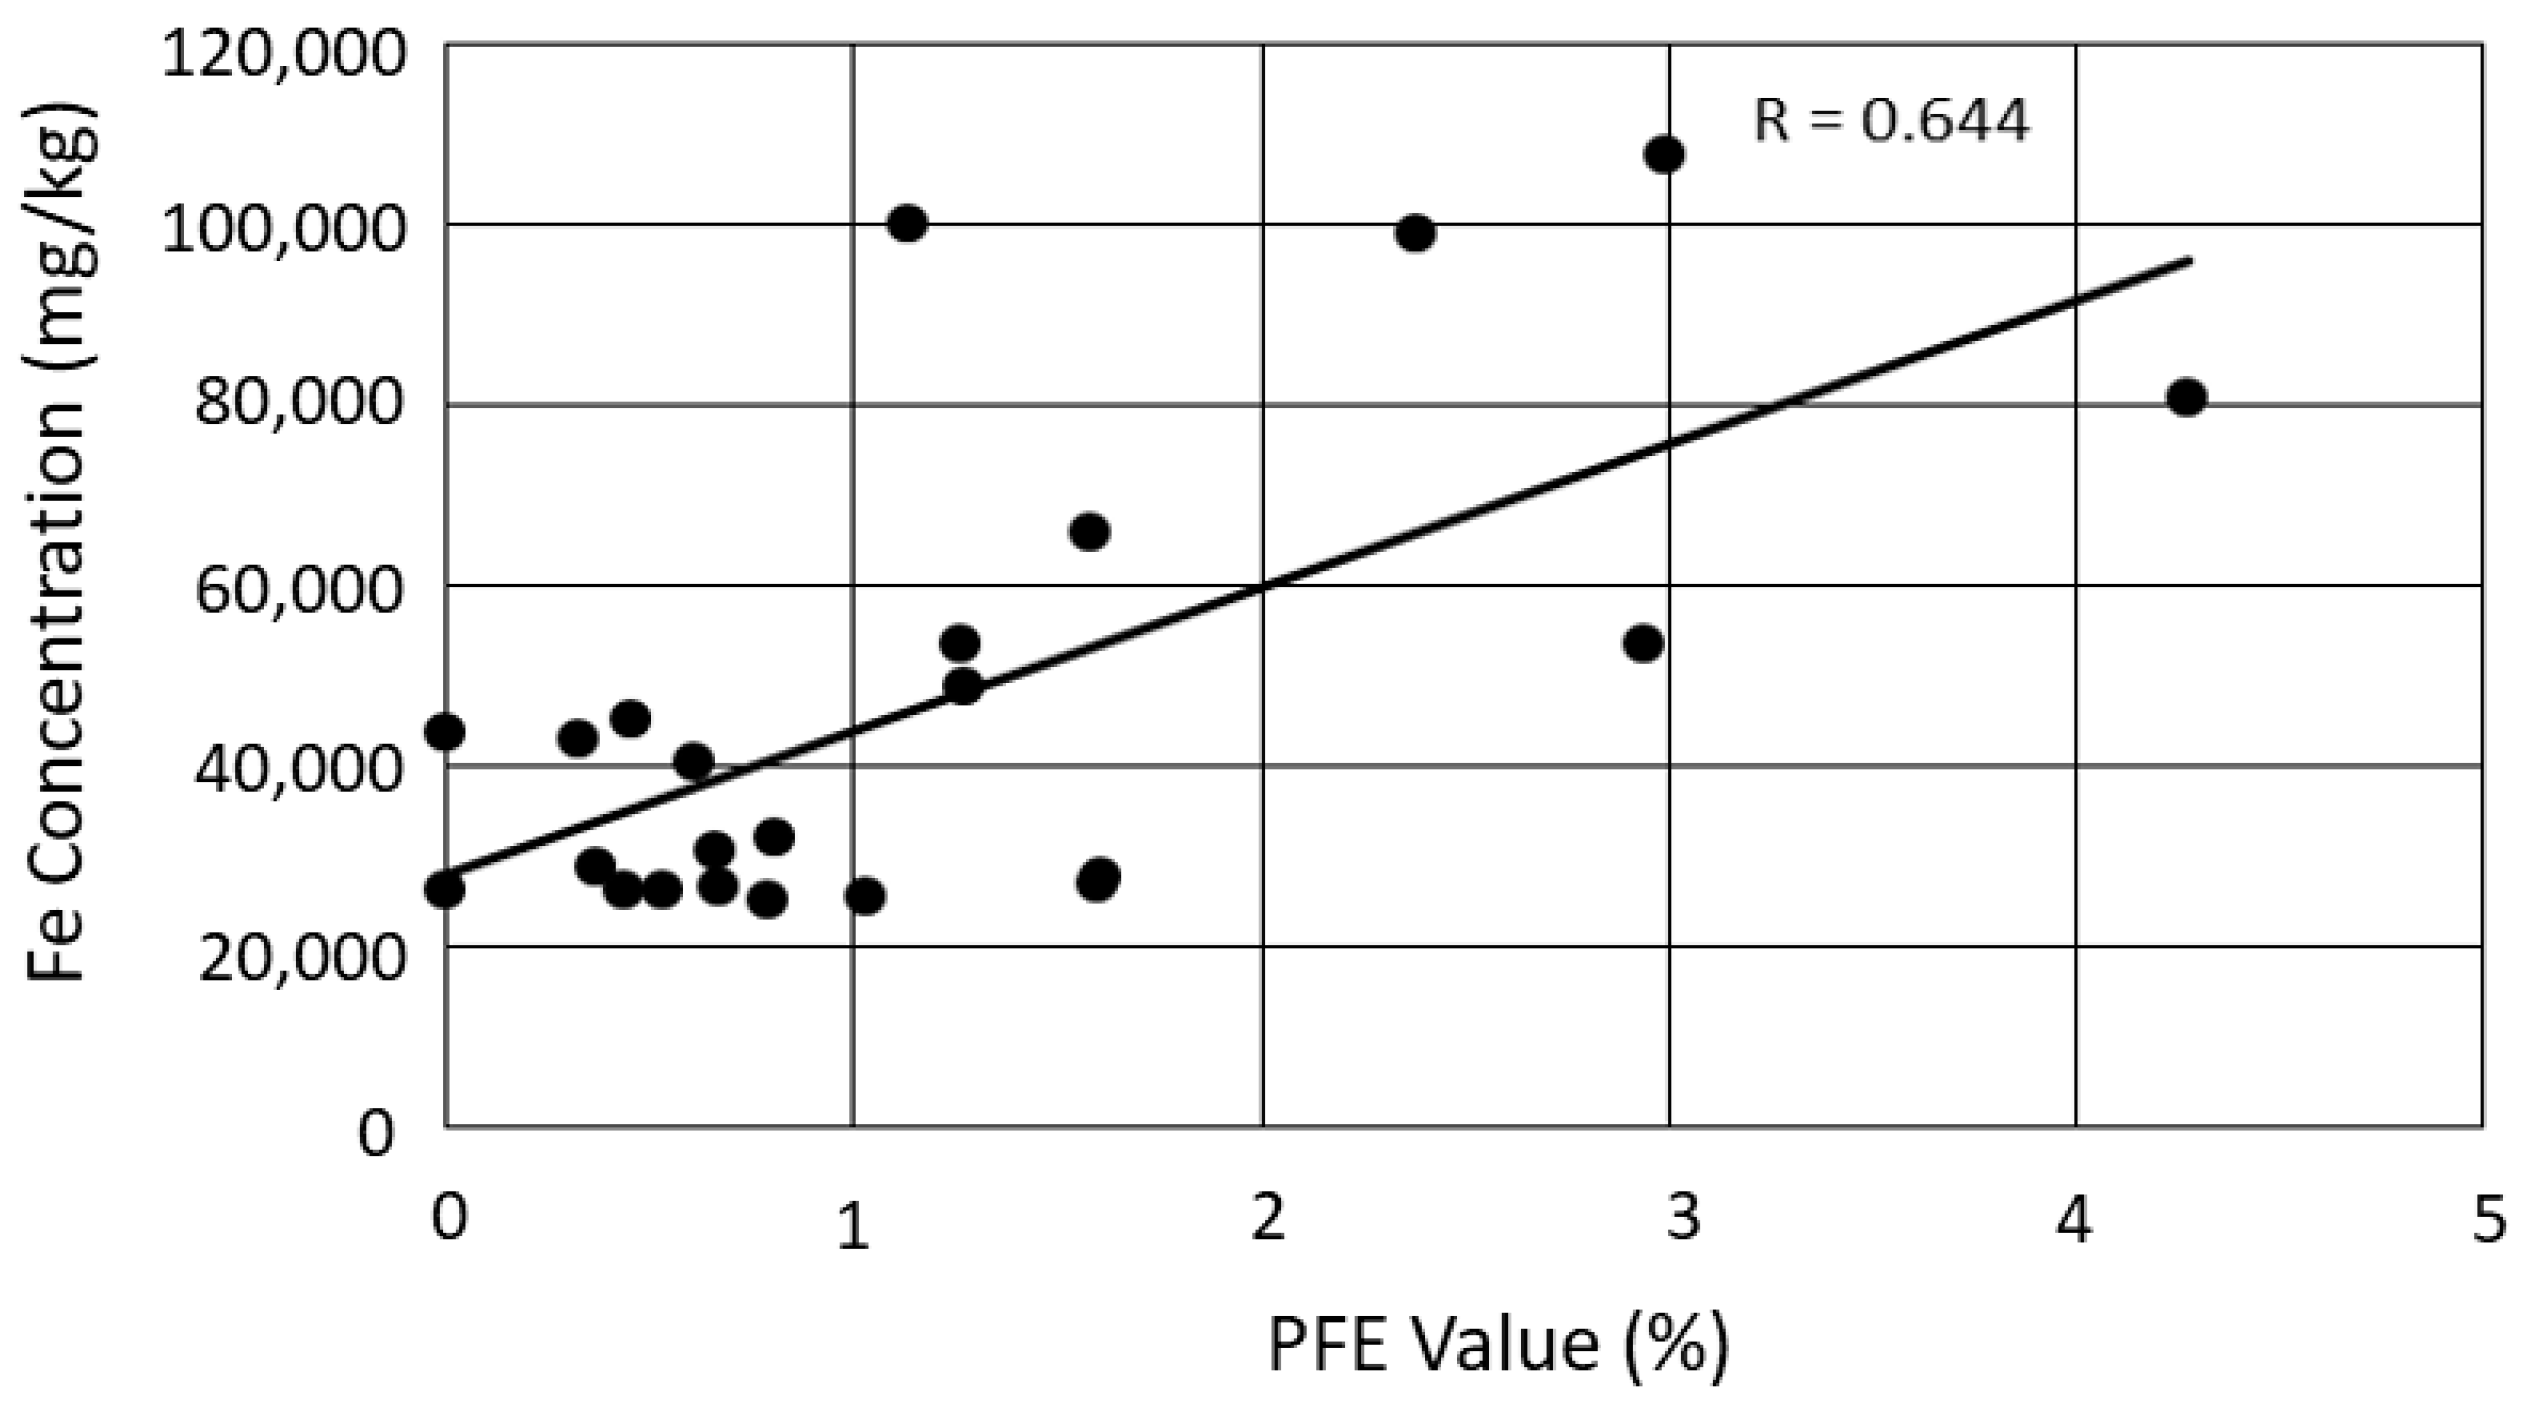
The PFE value and chargeability were measured for each drilled sample of T-1, T-2, and T-3. As shown in 3.2.1, the PFE value correlates with chargeability. Furthermore, the PFE value of each sample correlates with its Fe concentration, and the correlation coefficient was 0.644 (Figure 5).
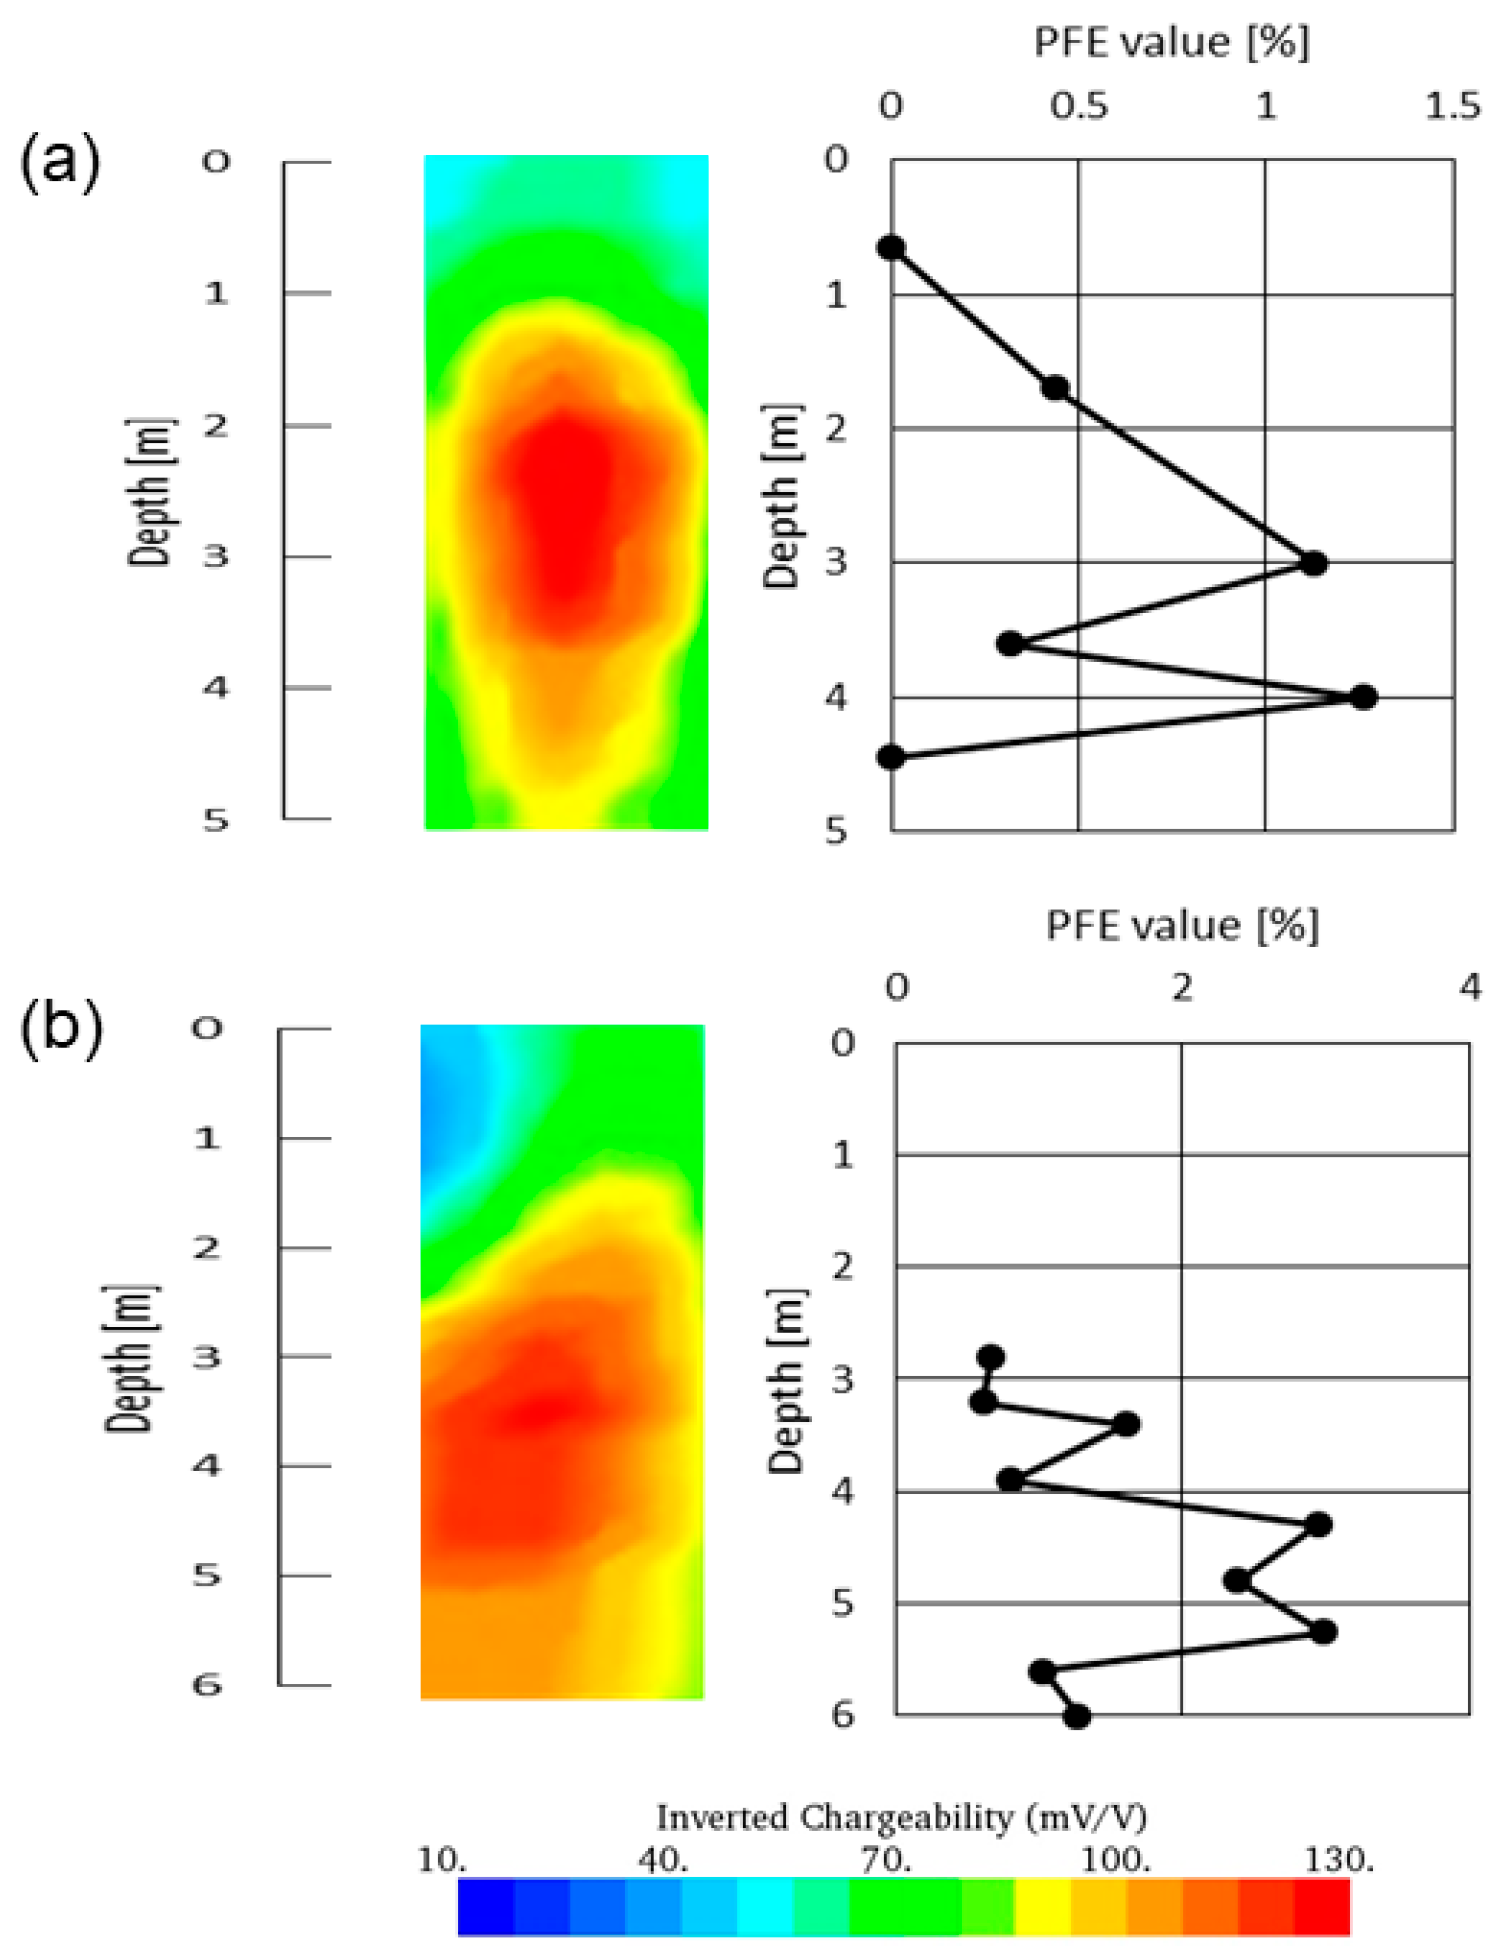
Next, the PFE value trend obtained from the drilled samples was compared with the profile near the drilled position obtained by the field measurement. Here, the results obtained for T-1 and T-2, which showed high chargeability, were examined (Figure 6). In T-1, a good correlation is observed between the profile obtained in the field experiment and the PFE value trend measured from the core. In T-2, the zone with a higher PFE value trend is slightly deeper than the profile of the field experiment. The chargeability shown in the field experiment profile is considered a three-dimensional integral, and the slight differences mentioned above are caused by underground conditions. However, in most cases, it has been observed that the chargeability profile and PFE trends are consistent.
3.3. Main Metal Enrichment in Sample
Table 1 shows the average and maximum concentrations of the main metals contained in the samples obtained from T-1, T-2, and T-3 and subjected to the box test. In this study, the concentrations in each sample are shown for the elements that yielded over 1000 mg/kg for the base metal and over 100 mg/kg for the rare metal in any of the samples at the highest concentration. The base metal has a high iron content, followed by aluminum. The iron content in some samples exceeded 100,000 mg/kg.
4. Discussion
When considering the landfills as a source of resources, the target is rare metals with high added value. In this study, we aimed to nondestructively visualize metal-enriched zones in the landfills, and focused on the existence of Fe, which is the most abundant metal in the landfills. In addition, Fe often takes the form of sulfide in anaerobic conditions.
The experimental results showed that the Fe concentration contained in landfills was correlated to the PFE value. In addition, the PFE value correlates with the chargeability [15]. Furthermore, the chargeability profile and the PFE value with depth match. Thus, the Fe concentrated zone in the landfills can be determined using the IP method.
Therefore, the identification of rare metals enriched in this Fe enrichment zone was investigated. In this study, we attempted to clarify the relationship between the Fe concentration and the concentrations of other rare metals. This was achieved through a comparison of the correlation coefficient between the two factors of Fe and each rare metal and cluster analysis.
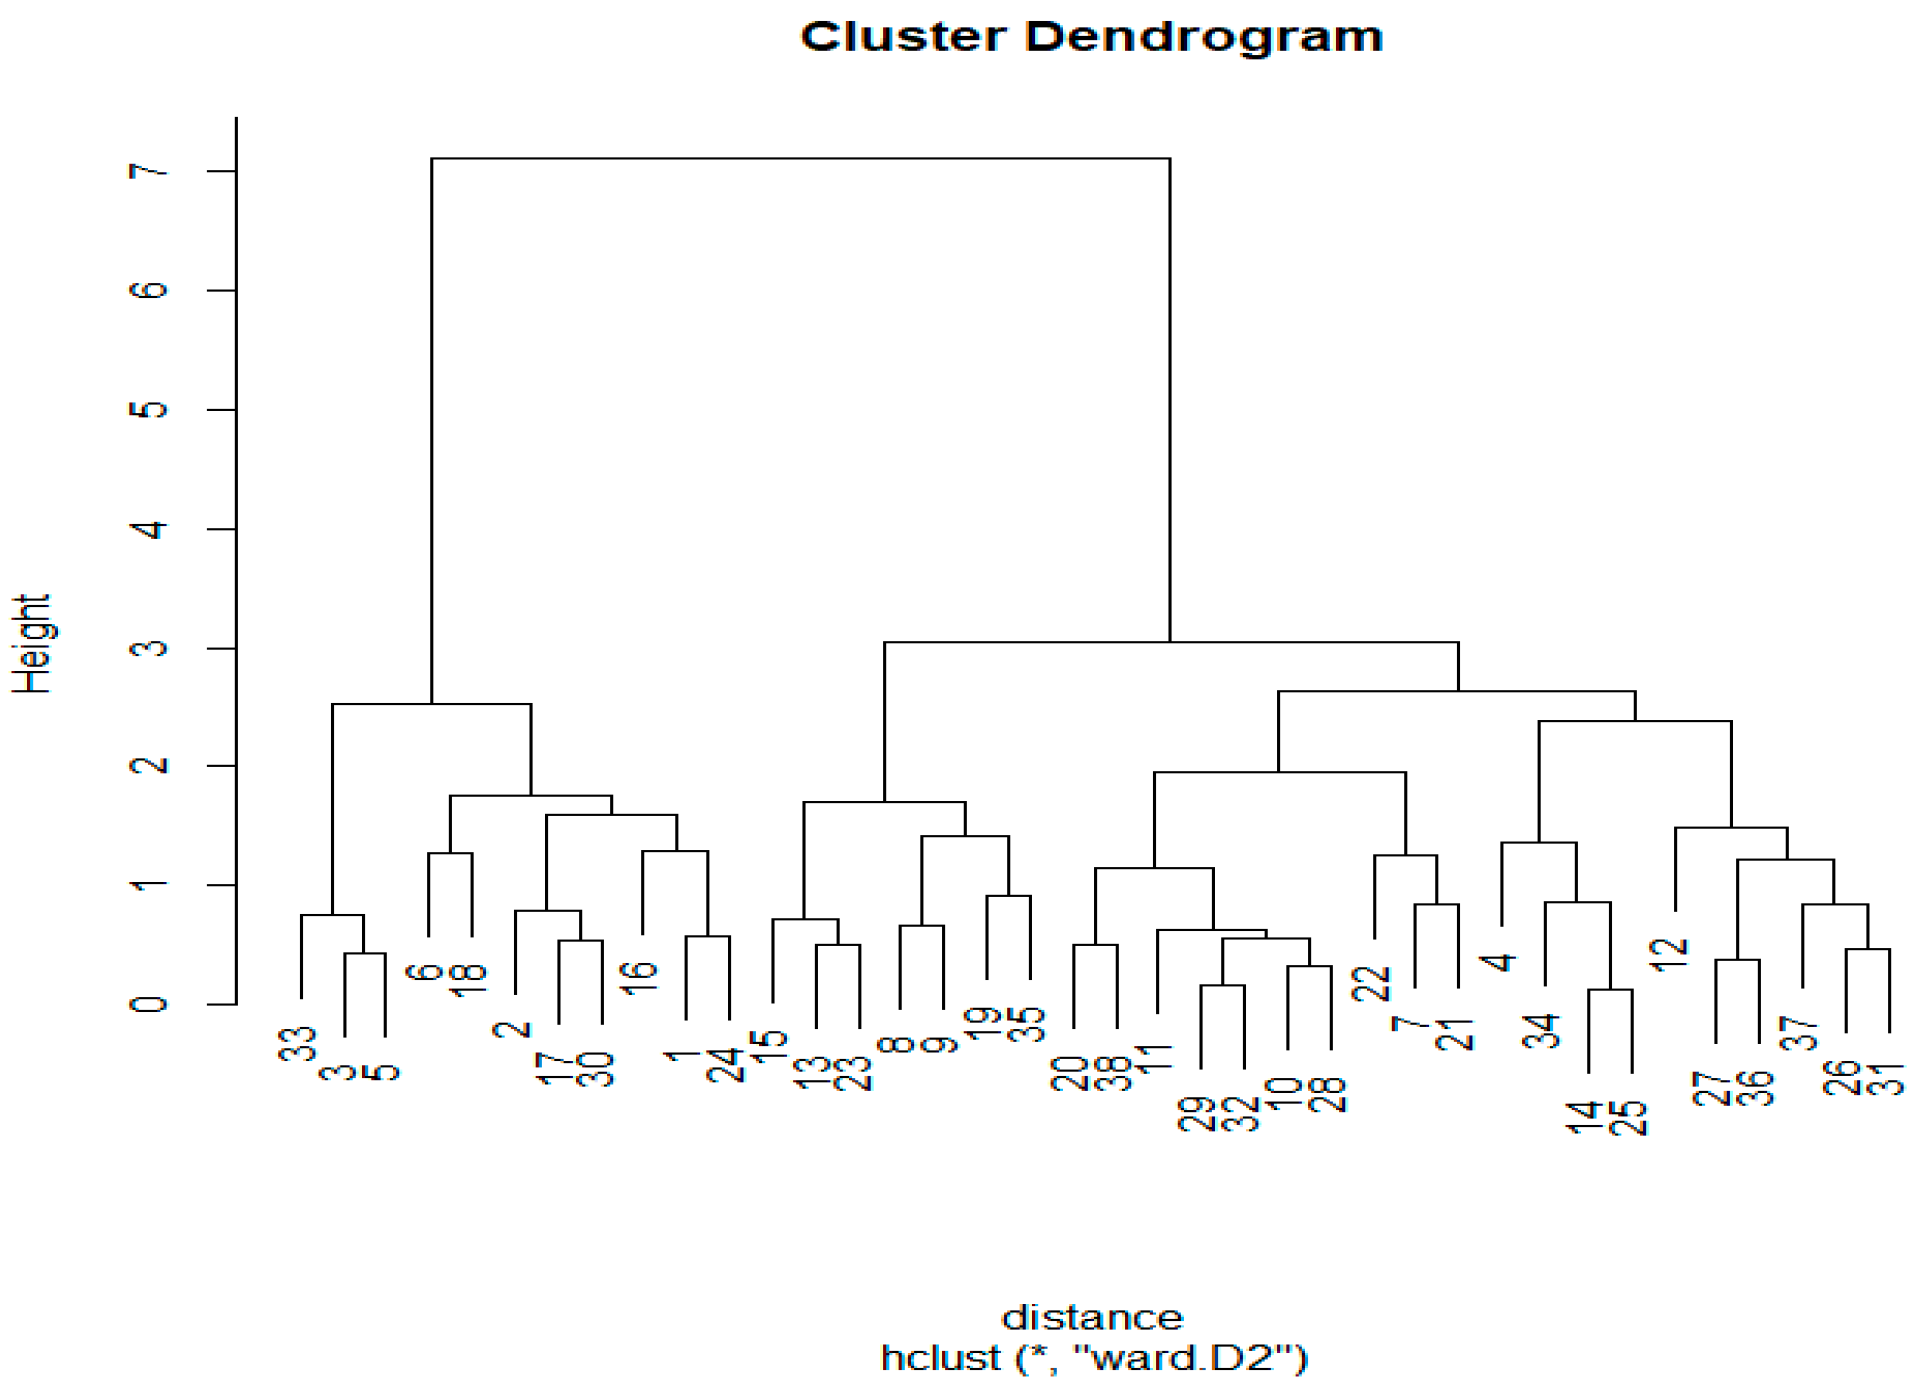
The rare metals that showed a correlation coefficient of 0.60 or more in relation to Fe were Cr, Mn, Nb, W, In, and Bi, and it is highly possible that these are concentrated together with Fe, as shown Table 2. Figure 7 shows a tree diagram obtained through cluster analysis using the statistical analysis software R [16]. Further, the elements examined in the analysis are shown in Table 3. As a result, Mn, Nb, W, and In were determined to be rare metals belonging to the same cluster as Fe.
Despite their similar results, Cr and Bi were excluded from the cluster analysis. This difference stemmed from the result of the determination of the similarity between metals in the cluster analysis. For example, Bi was positively correlated to Fe, but they were not in the same cluster. This is because Bi is distributed in the cluster owing more to its strong positive correlation to Mo than to Fe.
The differences observed with these methods can be attributed to the characteristics of each method. In other words, it can be said that Mn, Nb, W, and In selected by both methods are likely to coexist with Fe.
5. Conclusions
Landfills are considered promising urban mines. Therefore, we are developing a series of projects to elucidate the chemical morphology of metals in landfills, nondestructive investigation methods for metal enrichment zones, metal extraction methods from enrichment zones, and useful metal selection methods. In this paper, we specifically examined exploration methods. In addition, the amount of metal contained in landfills is much smaller than that of natural mines, so the target metals are rare metals with high added value.
As a result of the investigation, the IP phenomenon was determined by measuring the chargeability or PFE value. The former is a factor that indicates the IP phenomenon itself, the latter is an indirect factor, and the chargeability is measured in a general field exploration. However, for low chargeability, such as in box experiments, it may be better to examine the PFE value to determine the electrical characteristics of the object. Both values were obtained in this box experiment, and there is a correlation between the two, as described in Section 3.2.1. By examining these results, it became clear that the iron sulfide enrichment zone of the landfills in the valley can be identified from the chargeability profile of the field experiment. The important point here is that iron is the most abundant metal in landfills. Boring was performed on the iron-sulfide-enriched zone revealed by IP exploration, and the metal in the collected core was analyzed. Based on the results, in Section 4, we examined a method for identifying trace amounts of useful rare metals that coexist with iron sulfide.
Through such a process, it is possible to evaluate whether the target landfill is promising as a rare metal urban mine.
Author Contributions
K.H. and K.K. were involved in study design and data interpretation. All authors were involved in the measurements and the data analysis, and they critically revised the report, commented on drafts of the manuscript, and approved the final report. All authors have read and agreed to the published version of the manuscript.
Funding
Part of this research study was supported by the Grant-in-Aid for Scientific Research of the Japan Society for the promotion of Science (No. 19K05357).
Acknowledgments
Support from and discussions with members of the Geo-environmental Laboratory at Waseda University are gratefully acknowledged.
Conflicts of Interest
Page: 9The authors declare no conflict of interest.
References
- Kamura, K. Relationships between electrochemical properties of leachate and resistivity of strata in the landfill site consisting mainly of combustion residuals. Environ. Geol. 2002, 41, 537–546. [Google Scholar] [CrossRef]
- Kjeldsen, P.; Barlaz, M.A.; Rooker, A.P.; Baun, A.; Ledin, A.; Christensen, T.H. Present and long-term composition of MSW landfill leachate: A review. Crit. Rev. Environ. Sci. Technol. 2002, 32, 297–336. [Google Scholar] [CrossRef]
- Sabbas, T.; Polettini, A.; Pomi, R.; Astrup, T.; Hjelmar, O.; Mostbauer, P.; Cappai, G.; Magel, G.; Salhofer, S.; Speiser, C.; et al. Management of municipal solid waste incineration residues. Waste Manag. 2003, 23, 61–88. [Google Scholar] [CrossRef]
- Saffarzadeh, A.; Shimaoka, T.; Wei, Y.M.; Gardner, K.H.; Musslman, C.N. Impacts of natural weathering on the transformation/neoformation processes in landfilled MSWI bottom ash: A geoenvironmental perspective. Waste Manag. 2011, 31, 2440–2454. [Google Scholar] [CrossRef] [PubMed]
- Carpenter, P.J.; Kaufmann, R.S.; Price, B. Use of resistivity soundings to determine landfill structure. Ground Water 1990, 28, 569–575. [Google Scholar] [CrossRef]
- Kamura, K.; Hara, Y.; Inanc, B.; Yamada, M.; Inoue, Y.; Ono, Y. Effectiveness of resistivity monitoring for interpreting temporal changes in landfill properties. J. Mater. Cycles Waste Manag. 2005, 7, 66–80. [Google Scholar] [CrossRef]
- Imhoff, P.T.; Reinhart, D.R.; Englund, M.; Guerin, R.; Gawande, N.; Han, B.; Jonnalagadda, S.; Townsend, T.G.; Yazdani, R. Review of state of the art methods for measuring water in landfills. Waste Manag. 2007, 27, 729–745. [Google Scholar] [CrossRef] [PubMed]
- Genelle, F.; Sirieix, C.; Riss, J.; Naudet, V. Monitoring landfill cover by electrical resistivity tomography on an experimental site. Eng. Geol. 2012, 145, 19–29. [Google Scholar] [CrossRef] [Green Version]
- Hu, J.; Wu, X.W.; Ke, H.; Xu, X.B.; Lan, J.W.; Zhan, L.T. Application of electrical resistivity tomography to monitor the dewatering of vertical and horizontal wells in municipal solid waste landfills. Eng. Geol. 2019, 254, 1–12. [Google Scholar] [CrossRef]
- Kusuyama, K.; Hidari, K.; Kamura, K. Effectiveness of resistivity monitoring for unsaturated water flow in landfill site. J. Mater. Cycles Waste Manag. 2020, 22, 2029–2038. [Google Scholar] [CrossRef]
- Wong, J. An electrochemical model of the induced-polarization phenomenon in disseminated sulfide ores. Geophysics 1979, 44, 1245–1265. [Google Scholar] [CrossRef]
- Mansoor, N.; Slater, L.; Mansoor, N.; Slater, L. On the relationship between iron concentration and induced polarization in marsh soils. Geophysics 2007, 72, A1–A5. [Google Scholar] [CrossRef]
- Gurin, G.; Titov, K.; Ilyin, Y.; Tarasov, A. Induced polarization of disseminated electronically conductive minerals: A semi-empirical model. Geophys. J. Int. 2015, 200, 1555–1565. [Google Scholar] [CrossRef] [Green Version]
- Hupfer, S.; Marrin, T.; Weller, A.; Gunther, T.; Kuhn, K.; Ngninjio, V.D.N.; Noell, U. Polarization effects of unconsolidated sulfide-sand-mixtures. J. Appl. Geophys. 2016, SI, 456–465. [Google Scholar] [CrossRef]
- Kamura, K.; Omori, M.; Kurokawa, M.; Tanaka, H. Estimation of the potential of landfill mining and exploration of metal-enriched zones. Waste Manag. 2019, 93, 122–129. [Google Scholar] [CrossRef] [PubMed]
- The comprehensive R Archive Network. Available online: https://cran,r-project.org/ (accessed on 26 March 2020).
Figure 1.
Location of the prospecting lines (a) and core sampling points (b).

Figure 2.
Schematic of the box: (a): plan view, (b) elevation, (c) side view.

Figure 3.
Profiles of chargeability. (a)Vertical cross-sectional profiles; (b) Horizontal cross-sectional profile at 3.0 m deep.
Figure 3.
Profiles of chargeability. (a)Vertical cross-sectional profiles; (b) Horizontal cross-sectional profile at 3.0 m deep.

Figure 4.
Induced polarization results for the sand and iron sulfide with weight. (a) Percent frequency effect; (b) chargeability.
Figure 4.
Induced polarization results for the sand and iron sulfide with weight. (a) Percent frequency effect; (b) chargeability.

Figure 5.
Correlation between the percent frequency effect value and Fe content.

Figure 6.
Chargeability distributions around the boreholes and the percent frequency effect values for the core samples. (a) Drilled point T-1; (b) drilled point T-2.
Figure 6.
Chargeability distributions around the boreholes and the percent frequency effect values for the core samples. (a) Drilled point T-1; (b) drilled point T-2.

Figure 7.
Tree diagram by Cluster analysis.


Table 1.
Metal contents of the core samples.
| Concentration (mg/kg) | ||||||||||||
|---|---|---|---|---|---|---|---|---|---|---|---|---|
| Fe | Al | Cu | Pb | Zn | Ti | V | Cr | Mn | Ni | Ga | Sr | |
| T-1 | (Num. of sample = 6) | |||||||||||
| Av. | 48909 | 31632 | 729 | 315 | 1177 | 1325 | 96 | 127 | 630 | 80 | 36 | 154 |
| Max. | 100279 | 32741 | 1690 | 547 | 2584 | 1438 | 117 | 360 | 1292 | 156 | 58 | 180 |
| T-2 | (Num. of sample = 9) | |||||||||||
| Av. | 51420 | 25010 | 1604 | 508 | 916 | 1027 | 79 | 64 | 547 | 56 | 69 | 221 |
| Max. | 107795 | 35785 | 8726 | 1092 | 1985 | 1590 | 111 | 291 | 1098 | 187 | 186 | 297 |
| T-3 | (Num. of sample = 8) | |||||||||||
| Av. | 41338 | 27275 | 2063 | 448 | 846 | 1162 | 105 | 43 | 510 | 94 | 37 | 184 |
| Max. | 80774 | 31210 | 10140 | 1895 | 2335 | 1346 | 195 | 104 | 947 | 443 | 76 | 272 |
Table 2.
Elements that correlate with Fe in concentration (correlation coefficient: >0.6).
| Element | Cr | Mn | Nb | In | W | Bi |
|---|---|---|---|---|---|---|
| Correlation coefficient | 0.77 | 0.83 | 0.84 | 0.63 | 0.77 | 0.64 |
Table 3.
Relationship between numbers and elements in Figure 7.
Table 3.
Relationship between numbers and elements in Figure 7.
| Element | Li | Be | Al | Ti | Ca | V | Cr | Mn | Fe | Co |
|---|---|---|---|---|---|---|---|---|---|---|
| NO. | 1 | 2 | 3 | 4 | 5 | 6 | 7 | 8 | 9 | 10 |
| Element | Ni | Cu | Zn | Ga | As | Sr | Y | Zr | Nb | Mo |
| NO. | 11 | 12 | 13 | 14 | 15 | 16 | 17 | 18 | 19 | 20 |
| Element | Ag | Cd | In | Cs | Ba | La | Ce | Pr | Nd | Eu |
| NO. | 21 | 22 | 23 | 24 | 25 | 26 | 27 | 28 | 29 | 30 |
| Element | Gd | Dy | Er | Ta | W | Tl | Pb | Bi | ||
| NO. | 31 | 32 | 33 | 34 | 35 | 36 | 37 | 38 |
Publisher’s Note: MDPI stays neutral with regard to jurisdictional claims in published maps and institutional affiliations. |
© 2020 by the authors. Licensee MDPI, Basel, Switzerland. This article is an open access article distributed under the terms and conditions of the Creative Commons Attribution (CC BY) license (http://creativecommons.org/licenses/by/4.0/).
Share and Cite
MDPI and ACS Style
Hidari, K.; Miyata, M.; Yamazaki, S.; Kamura, K. Visualization of Rare Metal-Enriched Zones in Waste Landfills Using Induced Polarization Method. Environments 2020, 7, 95. https://0-doi-org.brum.beds.ac.uk/10.3390/environments7110095
AMA Style
Hidari K, Miyata M, Yamazaki S, Kamura K. Visualization of Rare Metal-Enriched Zones in Waste Landfills Using Induced Polarization Method. Environments. 2020; 7(11):95. https://0-doi-org.brum.beds.ac.uk/10.3390/environments7110095
Chicago/Turabian StyleHidari, Kazuhiro, Masato Miyata, Sojiro Yamazaki, and Kazuo Kamura. 2020. "Visualization of Rare Metal-Enriched Zones in Waste Landfills Using Induced Polarization Method" Environments 7, no. 11: 95. https://0-doi-org.brum.beds.ac.uk/10.3390/environments7110095
Note that from the first issue of 2016, this journal uses article numbers instead of page numbers. See further details here.