Article

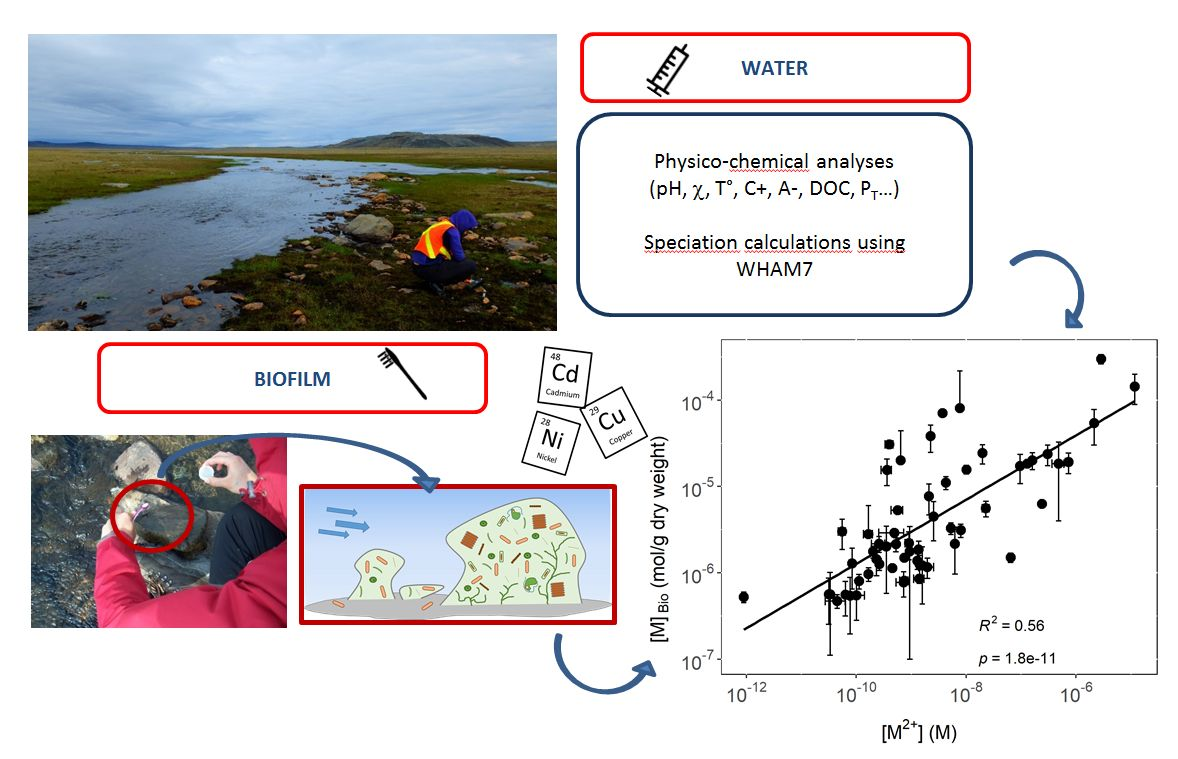
Proton Competition and Free Ion Activities Drive Cadmium, Copper, and Nickel Accumulation in River Biofilms in a Nordic Ecosystem

by
Vincent Laderriere
,
Louise-Emmanuelle Paris
and
Claude Fortin
*
EcotoQ, Centre Eau Terre Environnement, Institut National de la Recherche Scientifique, 490 de la Couronne, Québec, QC G1K 9A9, Canada
*
Author to whom correspondence should be addressed.
Submission received: 25 November 2020 / Revised: 10 December 2020 / Accepted: 11 December 2020 / Published: 15 December 2020
(This article belongs to the Special Issue Feature Papers in Environments in 2020)

Abstract

:
Biofilms can be used as a biomonitoring tool to determine metal bioavailability in streams affected by mining and other anthropogenic activities. Surface water and biofilm were sampled over two years from rivers located in the vicinity of a mine located in a Nordic ecosystem (Nunavik, Quebec). Biofilm metal content (Cd, Cu, and Ni) as well as a variety of physicochemical properties were determined to examine relationships between metal accumulation and water quality. Among the three metals of interest, copper and nickel had the highest levels of accumulation and cadmium had the lowest. When considering the exposure levels, nickel was the most abundant metal in our sampling sites. Both exposure and accumulation levels were consistent over time. Biofilm metal content was highly correlated to the ambient free metal ion concentration for sites of circumneutral pHs for all three metals. When the surface water pH was below 6, biofilm metal content was much lower than at other sites with similar aqueous metal concentrations of exposure. This apparent protective effect of decreasing pH can be explained by proton competition with dissolved metals for uptake binding sites at the surface of the organisms within the biofilm as described by the Biotic Ligand Model principles. The relationships obtained for Cd and Cu were overlapping those observed in previous publications, indicating strong similarities in metal accumulation processes in biofilms over very large geographical areas. Although more data are needed for Ni, our results show that biofilms represent a promising metal biomonitoring tool.

Graphical Abstract

1. Introduction

The demand for base metals has been sharply increasing worldwide since industrialization [1]. Anthropogenic activities involving metals, such as mining, have led to a growing mobilization of elements on a global scale [2]. This has increased metal inputs into the environment, resulting in contamination pressure upon terrestrial and aquatic biota. Environmental regulations were designed to limit metal inputs, usually based on the inherent toxicity of each element. Adequate protection of biota is, however, not straightforward. Indeed, metal impacts vary greatly among elements and between exposure media (air, water, soil, sediments), and they can be modulated by numerous environmental factors. For aquatic ecosystems, the water composition (cations and anions, including organic matter) strongly influences metal bioavailability. In their seminal paper, Sunda and Guillard [3] showed that copper uptake by marine phytoplankton was not related to the total copper concentration, but rather to the free cupric ion activity. This paper and several others led to the current paradigm of the Free Ion Activity Model (FIAM) [4,5]. Briefly, the FIAM stipulates that metal binding by ligands in solution contribute to decreased metal availability for aquatic organisms.
Although the FIAM was based on observations of metal uptake and toxicity in seawater, it was anticipated that the ionic composition would also play a major role in freshwater. This was formally integrated within the Biotic Ligand Model (BLM) in the 1990s [6,7]. Based on the theoretical framework of the BLM, metal bioavailability depends not only on the metal free-ion concentration, but also on the presence of competing ions, such as hardness cations, Ca2+ and Mg2+, and hydronium (H3O+ but commonly called protons and expressed as H+). Metal uptake and toxicity decrease with water hardness; however, the role of pH is more complex as it influences metal complexation. Indeed, on one hand, metal binding generally decreases with pH due to proton competition with metals for ligand binding sites, increasing bioavailability. However, on the other hand, the same principle applies to biological membrane surfaces where protons compete with metals for surface binding sites, including metal uptake sites. Therefore, a low pH can result in a higher proportion of free metal in ambient water, but can also reduce metal bioavailability through competition at the plasma membrane level. The resulting impact thus depends on the relative importance of each of these effects. Despite the simplicity of the BLM principles, the exact impact of water composition on metal bioavailability requires a fairly large amount of data. This includes data on water chemistry (e.g., ionic composition, organic carbon concentrations), the thermodynamics of metal-ligand complexes, metal binding to transport sites of the target organism, and the impacts of each pertinent, potentially competing ion that could provide a protective effect against metal uptake and toxicity. Several BLM-type approaches have been developed in the last two decades to help environmental regulators achieve adequate water criteria that would match the receiving water chemistry. These can be empirically [8] or mechanistically [9] based. Empirical models are usually simpler to build and operate, but mechanistic models tend to offer greater flexibility and some latitude in extrapolating outside of the range of calibration data.
Another tool available for environmental regulators is the use of biomonitoring [10]. This latter approach is based on the idea that metals accumulated by organisms reflect the bioavailability of the metal. The organism thus offers a basis of comparison between sites to determine the extent of metal bioavailability. The selection of this target organism is thus critical for biomonitoring, with many species of fish, invertebrates, and freshwater biofilms being assessed in the last decades [11,12]. Ideally, this organism must be geographically widespread, abundantly available, easy to collect, and, most importantly, tolerant to the contaminants that it accumulates [13].
Among possible candidates, freshwater biofilms have shown great potential as a biomonitor (and bioindicator) for contaminants [14,15,16] and the ecologic quality of rivers [17]. Biofilms develop at the surface of substrates (rocks, sediments, macrophytes, buoys, wharf structures, etc.) and are composed of phototrophic and heterotrophic organisms (including bacteria, algae, fungi, and micro-meiofauna). This heterogeneous community develops quickly and is usually embedded within a self-produced matrix of exopolysaccharides [18]. Although species composition is known to evolve rapidly over time and in the presence of stressors, biofilms have been shown to provide a robust signal in terms of metal accumulation [19]. Biofilms also provide the advantage of being present in the surface waters (streams, rivers, or lakes) of even the most contaminated ecosystems, where they have been shown to respond to a large array of both organic and inorganic contaminants [20,21,22,23]. Biomonitoring can also offer additional information than water sampling techniques alone. In the case of small streams, pulse contamination events may occur which may not be captured at the moment of sampling, whereas such exposures would likely be integrated in the biofilm response [24,25]. Additionally, water sampling requires extensive precautions to avoid inadvertent metal contamination through sample handling and sensitive analytical instruments. Metal accumulation in biomass, however, is usually at high enough concentrations that sample contamination is negligible, and less sensitive instruments are required to quantify metal content [19,26]. Finally, from an ecologic perspective, biofilms are also known to play a key role in aquatic systems, as they are involved in nutrient cycling (e.g., organic matter decomposition). Moreover, they are at the base of the food chain and accumulated metals can be transferred to grazers [27,28,29].
Ideally, these two approaches can be combined in a single tool where metal accumulation in biofilms can be used as a biomonitoring tool but also as a predictive bioavailability tool. This would allow decision makers the possibility of determining the impact of different remediation scenarios on the expected bioavailability of metals. Although biofilms are commonly found in all types of ecosystems, it remains to be demonstrated that their response is robust enough over a large geographical range to be used as a general tool. In previous work, we showed that the accumulation of cadmium, copper, lead, and zinc could be well predicted based on their respective aqueous speciation [30]. This work was undertaken in a temperate region of southern Quebec. In the present work, we wanted to test the coherence of biofilm metal accumulation within a Nordic environment with this previous work. Considering that mineral extraction operations are expanding in the north and that a large portion of the mineral reserves are located in remote areas, the development of biomonitoring tools need widespread applicability to arid, Nordic ecosystems. We thus set out to determine the accumulation of a series of metals in biofilms occupying streams in the immediate surroundings of a nickel mine in Nunavik, Quebec, and compare accumulation levels to those observed in temperate areas. We also fully characterized the water chemistry to identify any potential parameters required to develop a predictive tool for metal bioavailability using stream biofilms.

2. Materials and Methods

The study was conducted in the area surrounding the Nunavik nickel mine. The mine is found on the Ungava Peninsula. At the time of the present study, the mine was exploiting nickel and copper as main products, in addition to cobalt, platinoids, and gold in lower quantities. The mine has two open pits, each one with its own wastewater treatment facility and wastewater effluents discharging into different tributaries of the Puvirnituq River. The Puvirnituq River flows through the Pingualuit National Park, 20 km downstream of the mining installation. It is also the main source of drinking water for the village of Puvirnituq, 260 km further downstream, and its final discharge is in Hudson Bay. Sampling sites were selected to encompass a metal contamination gradient and a detailed map identifying their locations is available in a previous publication [31]. Briefly, sampling sites Ex1 to Ex4C were located near the Expo pit facilities, in close proximity to a wastewater reservoir. Reference sites (C1Ex and C2Ex) were located 2.3 km north of Ex3. These sites are upwind of the main mining activities and are thus less likely to be affected by dry depositions. Wastewaters from the Expo sites are treated on-site and the effluents are discharged ~6 km downstream of the Expo pit. Sampling sites Ef0 and Ef1 to Ef3 were distributed along the river over a distance of 1.4 km. The reference site Ef0 was located on a tributary located downstream of the effluent. Mesamax is the other open pit of the mine, 8.5 km east from the Expo site. The sampling site M1 was close to the wastewater reservoir, while sites M2, MA, M3, and M4 were distributed along the wastewater effluent over a distance of 1.5 km. The reference site M0 was located ~1 km upstream of the wastewater effluent.
Sampling took place in July and August of 2014 and 2015, corresponding to the periods of effluent discharge form the mine. During the sampling period, there were two open-pit mining sites in activity; Expo (since 2012) and Mesamax (since 2013). A total of 18 sampling stations were selected in nearby rivers and streams. At the Mesamax site, five sampling stations were positioned along an expected gradient of metal contamination; starting at the wastewater effluent and reaching 1.2 km downstream. A reference site was sampled upstream from the mining effluent. At the Expo site, three sampling stations were located at the wastewater effluent and further downstream, covering a distance of 1.4 km. A reference station was sampled in a tributary of this river. Four sampling stations were also located in small watercourses within proximity to the Expo site tailings ponds. Two additional reference stations were selected in rivers 1.5 km north of the mine, away from anthropic activities.
Materials used to store samples for analyses of cations, dissolved organic carbon (DOC) and total phosphorus (TP) were previously soaked for 24 h in 10% nitric acid (v/v), and rinsed eight times with ultrapure water (18 MΩ·cm). Materials used to store samples for the analyses of anions were previously rinsed eight times with ultrapure water. After rinsing, all materials were dried under a laminar flow hood. Water samples were collected in triplicate and field blanks were also prepared at each station. Samples for anions, cations, and DOC were collected in 20 mL high-density polyethylene Nalgene bottles using polypropylene syringes with polysulfonate encapsulated filters (0.45 μm; VWR International). Filters were previously purged with 5 mL of surface water for pre-conditioning of the syringe and filter membrane. Samples collected for cation analysis were acidified to 0.26% nitric acid (v/v; trace metal grade; Fisher). For TP samples, 50 mL polypropylene tubes were used and samples were acidified to 0.2% sulfuric acid (v/v; trace metal grade; Fisher). All samples were kept at 4 °C until processed. Water conductivity, temperature, and pH were measured at each station using portable instruments (Conductivity meter SevenGo SG3; Mettler Toledo; Switzerland and pH/mV meter Denver Instrument Model 10; Denver Instrument; Sartorius; Germany).
Biofilm was collected by scraping the top surface of several rocks (composite samples) using a new toothbrush at each station. Biomass was concentrated by centrifugation for 5 min at 4000 rpm. A volume of 10 mL of EDTA (10 mM; pH 7) was added to the pellets, vigorously shaken, and the centrifugation process was repeated after five minutes. The resulting pellets were kept in a freezer at −15 °C and subsequently lyophilised. Each pellet was grinded with a clean plastic spatula directly in the tube, and 30 to 100 mg were weighed in acid-washed Teflon vials. Then, 800 μL of concentrated nitric acid (trace metal grade; Fisher) were added. After 48 h, 200 μL of concentrated hydrogen peroxide (trace metal grade; Fisher) were added for 48 h. Finally, 800 μL of the digested material were diluted in 7.2 mL of ultrapure water (18 MΩ·cm) in a 15 mL polyethylene tube to reach a final acidification of 10% (HNO3; v/v), and kept in a refrigerator. The previous manipulations were also performed on a certified material (Buffalo river sediment 1RM.8704; Sigma Aldrich; USA), and on blank samples containing only reagents. Measured metal contents of certified material were within 80 to 116% of certified values for Al, Ca, Mg, Mn, Ni, and Zn. Total digestions were also tested on four random samples to compare the metal concentrations measured in comparison to the partial digestion method used in the present protocol; Cu and Ni recoveries ranged from 77 to 88 and 76 to 86%, respectively. Anions (Cl, Br; NO2; NO3, SO42−) were analyzed by ion chromatography (Dionex DX- 300 Gradient Chromatography Systems, Dionex, Thermo Fisher Scientific; Netherlands), total phosphorus was analyzed by persulfate digestion and manual colorimetry (SM 4500-PB), and DOC was analyzed with a total organic carbon analyzer (TOC-500A, Shimadzu Scientific Instruments, Japan).
Cations in surface water and in digested biofilms (Al3+, Ca2+, Fe3+, K+, Mg2+, Na+, Mn2+, Ni2+, Zn2+) were analyzed by inductively coupled plasma–atomic emission spectrometry (ICP-AES; Varian Vista AX CCD; Agilent Technologies; USA) while trace metals (Cd2+, Cu2+, Pb2+, Zn2+) were also analyzed by ICP-mass spectrometry (ICP-MS; Element X series, model X7; Thermo Fisher Scientific; Netherlands). The certified controls 900Q30.100 (SCP Science) and FP95-06 (Environment and Climate change Canada PT Study) were also used with both ICP–MS and ICP–AES. Finally, spiked samples were analyzed to validate the ICP–MS and ICP–AES measurements. Detection limits (DL) were used to validate the analytical methods; the DL is three times the standard deviation of ten replicate measurements of the lowest standard used. Any concentrations lower than the mean field blank values were systematically excluded from subsequent analyses. Almost all field sample concentrations were inferior to the field blank for zinc and lead due to very low concentrations in samples. Therefore, these two metals were excluded for data interpretation and discussion.
The Windermere humic–aqueous model VII (WHAM; Centre for Ecology & Hydrology, UK) was used to estimate the free ion concentrations of Cd2+, Cu2+, and Ni2+. This model requires the ionic composition as determined above as input data. It also requires the humic and fulvic acid concentrations; these were estimated from the DOC by assuming that the ratio of DOM and DOC is 2:1 and that 60% of DOM is composed of humic and fulvic acids in a 1:3 ratio [30,32].

3. Results and Discussion

Full dataset including basic physico-chemical characteristics and mean dissolved cation concentrations is publicly available (https://0-doi-org.brum.beds.ac.uk/10.5683/SP2/MH5EWX). Bromide and nitrite were not considered as most samples were below the detection limit (DL = 0.13 µM and 0.04 µM respectively). Briefly, pH was between 6.3 and 6.9 except for Ex2, Ex3, and EX4C stations where mean pH values were between 4.1 and 4.9. These sites are in close proximity of the “Expo” operating site, which was a source of acidification. Dissolved organic carbon was generally low with means ranging from 0.64 to 2.62 mg C/L. Phosphate concentrations were comparable between stations with concentrations in the µg P/L range. Total dissolved concentrations of metals spanned over five orders of magnitude, from tens of nM to hundreds of µM for Cu and Ni, and from tens of pM to hundreds of nM for Cd. The measured concentrations were consistent between sampling periods suggesting stable exposure conditions over the sampling period. Reference sites (CEx1, CEx2, C, and M0) were characterized by the lowest concentrations for the three metals with concentrations in the nM range. The highest concentrations of the three metals studied were measured near the Expo site (Ex2, Ex3, Ex4 and Ex4C). Site Ex3 was the most contaminated site in our study with average concentrations (n = 12) of 156 ± 2 µM Cu, 411 ± 4 µM Ni, and 33.3 ± 4.6 µM Cd. The Ex4C site also had high concentrations, comparable to those of Ex3, but this last site was only sampled on August 2015. The effluent sites (Ef0–Ef3) were located close to the discharge point of the wastewater effluent. These sites presented high metal concentrations in the µM range in comparison to reference sites. Mesamax sites (M0 to M4 and MA) were close to the Mesamax mining operation. These sites showed lower metal concentrations than those of the Expo or the effluent sites, and were slightly higher than reference sites.

3.1. Identifying Key Modifying Variables for Metal Accumulation in Biofilms

Using the water composition determined at each site, we calculated the predicted free metal ion concentration and plotted biofilm metal content ([M]Bio in mol/g dry weight) to test simple relationships with this key parameter (Figure 1). Results showed significant linear trends for Cu and Ni but not for Cd. The Cu2+ data spanned over six orders of magnitude, the Ni2+ data over four orders of magnitude, and finally, Cd2+ spanned over only three orders of magnitude. The significance of the trends thus decreased with the dynamic range of the data, resulting in an increase of the signal-to-noise ratio.
Visual examination of the data indicated, as observed by Leguay et al. [30], that biofilms from sites with low pHs (<6) had distinctively lower metal content for a given exposure concentration. Indeed, when metal content was plotted again using only data where pH > 6, this resulted in significant trends for all three metals and improved determination coefficients and significance levels (Figure 1d–f). From a biological perspective, this break in trends with pH could potentially be explained by a change in biofilm composition [31]. Should metal tolerant species become dominant, this could result in lower metal accumulation than at higher pHs. From a chemical perspective, the observed pH effect could also reflect the inhibition of metal uptake typically observed at high proton concentrations [33,34,35]. Indeed, the binding of protons to membrane proteins can prevent metal binding and thus decrease metal uptake. The fact that the accumulation of all three metals is inhibited around the same pH value suggests that the proton binding affinity to metal uptake sites is similar among the sites involved and that the binding constant is in the vicinity of 106. This value is close to published proton binding constants to biological membranes for these metals (e.g., 105.4−106.7 for fish [36,37]; 105.2−106.1 for invertebrates [38,39,40]; 105.2 for algae [41]). Overall, these results confirm that the concentration of free metals in the water explains a large amount of the variability in biofilm metal content at pH > 6 and that below this pH, protons are inhibiting metal uptake in agreement with the premises of the BLM.
In order to investigate the potential influence of other cations on the accumulation of a given metal, we normalized metal content for the ambient calculated free metal exposure concentration [30]. Such normalized data should result in constant values for a given element if its free metal ion concentration in solution is the only determining parameter in our data set. In Figure 2, we show how the normalized Cd, Cu, and Ni biofilm content ([M]Bio/[M2+] in L/g) varies as a function of calculated free proton, magnesium, manganese, and calcium concentrations at each site. All tested relationships were significant, suggesting that more than one parameter needs to be considered.
Protons (Figure 2a,e,i) reveal a distinct pattern in which a large number of sites have similar pH (~ 6.5) but with a large spread in metal content. This clearly indicates that for a given pH and free metal concentration, other factors can modulate metal accumulation. Additionally, as anticipated, metal content decreased at low pHs, confirming the importance of pH. For both Mg2+ and Mn2+, results show a gradual decrease in normalized Cd, Cu, and Ni biofilm content when the concentrations of these elements increase in the water column. This suggests that Mg and/or Mn have a potential protective effect with threshold concentration values of ~10−4 and ~10−8 M, respectively. More specifically for Cu, there seems to be a plateau at low Mg2+ and Mn2+ concentrations. This could be explained by a larger difference in the metal affinity of Cu2+ for uptake sites with respect to that of Mg2+ and/or Mn2+ than for Ni2+ and Cd2+. Indeed, normalized accumulation levels reveal that Cu uptake is two orders of magnitude higher than that of Cd and Ni for a given free metal ion concentration. It would thus be coherent that more Mg2+ and/or Mn2+ are required to trigger a significant inhibition of Cu uptake by the biofilm community than for Cd and Ni. Finally, when plotted as a function of Ca2+, the normalized data was quite scattered and had the lowest determination coefficients among all cations tested. This was somewhat surprising since calcium is usually considered as a key variable in protecting aquatic species from metal accumulation and toxicity [42,43,44]. Pinpointing the exact contributions of each competing ion is difficult, since most ions are correlated to each other. Indeed, Figure 3 shows the correlation coefficients between the calculated free cation concentrations and the biofilm metal contents. These indicate that, for our three metals of interest, Cd, Cu, and Ni, all other cation concentrations have correlation coefficients between 0.48 and 0.94. For example, if [Cu]Bio is correlated to [Cu2+] (r = 0.71), because [Cu2+] is correlated to other parameters such as [Mn2+], [Ni2+], [Cd2+] (r values of 0.9, 0.93 and 0.91, respectively). The Cu biofilm content is thus also strongly correlated to three metals (even more than with [Cu2+] with r values of 0.74, 0.76 and 0.76, respectively) or other components of the water column. The same reasoning can be applied to Ni and Cd, [Ni]Bio being as much correlated to [Mn2+] and [Cd2+] as [Ni2+], while [Cd]Bio being as much correlated to [Mn2+] and [Ni2+] as to [Cd2+]. In simple terms, because all elements co-vary to some extent, internalized metal normalized to its free ion concentration will be strongly influenced by the correlation between the free ion and the competing ion studied. This point makes it difficult to distinguish interactions correctly.
Because the metal concentrations can reach high levels, it is also possible that some competitive effects occur between metals for uptake sites. Significant relationships were observed between the biofilm metal content normalized to free ion concentration and our three metals of interest (Figure 4). Internalized Ni and Cd normalized to its free ion concentration was observed to gradually decrease with ambient free metal concentration across the board (Figure 4d–i) in a manner similar to that observed for Mg2+ and Mn2+ (Figure 2f,g). A slightly different pattern was observed for Cu. Indeed, the normalized Cu content was somewhat constant, between 103 and 104 L/g, at free Ni2+ concentrations below ~10−6 M but decreased when Ni2+ increased further (Figure 4b). Even larger data spread can be seen in the biofilm normalized Cu content as a function of free Cd2+. This pattern for Cu accumulation is similar to that observed with increasing Mg2+ and Mn2+ concentrations (Figure 2b,c). This strongly suggests that the overall binding affinity for membrane transporters is much higher for Cu2+ than for Cd2+ and Ni2+. This difference in binding affinity results in higher uptake levels for Cu while high ambient free ion concentrations of other metals are required in order to induce a significant competitive behavior, as expected based on the BLM principles [45,46]. On the other hand, Cd2+ and Ni2+ uptake are being progressively reduced with increasing concentrations of free ions in surface waters. In their laboratory exposures of periphyton, Mebane et al. observed that Cd uptake was clearly reduced when Cu and Zn were also present while the uptake of Cu, Ni, and Zn seemed less affected by the presence of other metals [47]. The fact that the normalized biofilm metal content is decreasing with increasing free concentration of the same metal could reflect possible, gradual saturation of metal transport sites. As pointed out by McGeer et al. [48], bioconcentration factors (ratio of metal content over ambient concentration, equivalent to our normalized metal content) often show inverse relationships due to non-linearity of ion transport across membranes.

3.2. Geographical Implications

The present set of data is, to our knowledge, the first one available for biofilms in a Nordic environment (North of 60° latitude). To determine if the observed accumulation of metals were coherent with those determined much further South, we compared the present data set to values previously published [30]. As can be seen from Figure 5, biofilm Cu and Cd content as a function of their ambient free metal ion concentration show significant linear correlations and data overlap between the studies. In this figure, data obtained in acidic waters (pH < 6) were omitted, but these nevertheless show that free metal ion concentration is the main uptake driver for neutral to alkaline systems. At low pHs, predicting metal uptake by biofilms becomes challenging due to protons competing with metals for membrane surface binding sites, and acidic waters are often rich in all elements which increases competition for binding sites. Although our data set has allowed us to identify potential candidates for this ionic competition, we were not able to tease out their relative importance. Due to high correlations between these variables in field data, laboratory data could provide further information.
In their publication, Leguay et al. [30] had shown temporal and spatial robustness in signal as accumulation was coherent over several years and over a large geographical area of southern Quebec (sampling sites more than 500 km apart) incorporating sites of different geological characteristics. The data presented in this study were obtained ~1600 km north of these sites and yet show good overlap. Indeed, for metals determined in both studies, Leguay et al. [30] found similar normalized biofilm content for Cu and Cd at neutral pH values with values around 103 L/g for Cu and between 102 and 101 L/g for Cd. This point is important, because it suggests that biofilm, for a given free metal concentration, will internalize a similar quantity of metals regardless of the environment considered. This is promising for the development of a generic metal biomonitoring tool. There is, however, a lack of data for nickel (and metals other than Cd and Cu) to determine the robustness of biofilm accumulation for metals over large geographical scales. In order to further develop a biofilm metal biomonitoring tool, more data over a large geographical area are required.

Author Contributions

All authors made substantial contributions to this paper. L.-E.P. was in charge of coordinating field trips, sample collection, data analysis, and manuscript drafting. V.L. contributed to field sampling, sample analysis, quality control/quality assurance, data analysis, and final draft preparation. C.F. was involved in the original project conception, for funding acquisition, project management, manuscript preparation, writing, review, and editing. All authors have read and agreed to the published version of the manuscript.

Funding

This research was funded by the Fonds de recherche du Québec–Nature et technologies, grant number 2014-MI-183237 and by the Canada Research Chair Program, grant number 950-231107.

Acknowledgments

The authors would like to thank Nunavik Nickel for providing logistic support during sampling (air transportation to the mining site, accommodation, etc.). Special thanks to Isabelle Lavoie, Sébastien Leguay, and Sandra Kim Tiam for their assistance during sampling. Language assistance provided by Scott Hepditch is gratefully acknowledged.

Conflicts of Interest

The authors declare no conflict of interest. The funders had no role in the design of the study; in the collection, analyses, or interpretation of data; in the writing of the manuscript; or in the decision to publish the results.

Data of the Materials

Our dataset for this study is publicly available. This data can be found at https://0-doi-org.brum.beds.ac.uk/10.5683/SP2/MH5EWX. This dataset includes temperature, pH, and means ± standard deviations (n = 3) of dissolved ions at sampling sites, calculated free metal ion concentrations, and measured metal biofilm content.

References

  1. Schaffartzik, A.; Mayer, A.; Eisenmenger, N.; Krausmann, F. Global patterns of metal extractivism, 1950–2010: Providing the bones for the industrial society’s skeleton. Ecol. Econ. 2016, 122, 101–110. [Google Scholar] [CrossRef]
  2. Pacyna, J.M.; Pacyna, E.G. An assessment of global and regional emissions of trace metals to the atmosphere from anthropogenic sources worldwide. Environ. Rev. 2001, 9, 269–298. [Google Scholar] [CrossRef]
  3. Sunda, W.G.; Guillard, R.R.L. The relationship between cupric ion activity and the toxicity of copper to phytoplankton. J. Mar. Res. 1976, 34, 511–529. [Google Scholar]
  4. Morel, F.M.M. Principles of Aquatic Chemistry; John Wiley & Sons: New York, NY, USA, 1983; p. 446. [Google Scholar]
  5. Campbell, P.G.C. Interactions between trace metals and aquatic organisms: A critique of the free-ion activity model. In Metal Speciation and Bioavailability in Aquatic Systems; Tessier, A., Turner, D.R., Eds.; John Wiley & Sons: New York, NY, USA, 1995; pp. 45–102. [Google Scholar]
  6. Di Toro, D.M.; Allen, H.E.; Bergman, H.L.; Meyer, J.S.; Paquin, P.R.; Santore, R.C. Biotic ligand model of the acute toxicity of metals. 1. Technical basis. Environ. Toxicol. Chem. 2001, 20, 2383–2396. [Google Scholar] [CrossRef]
  7. Mebane, C.A.; Chowdhury, M.J.; Vlaeminck, K.; Lofts, S.; Paquin, P.R.; Santore, R.C.; Wood, C.M. Metal Bioavailability models: Current status, lessons learned, considerations for regulatory use, and the path forward. Environ. Toxicol. Chem. 2020, 39, 60–84. [Google Scholar] [CrossRef] [Green Version]
  8. Brix, K.V.; Deforest, D.K.; Tear, L.; Peijnenburg, W.; Peters, A.; Middleton, E.T.; Erickson, R. Development of empirical bioavailability models for metals. Environ. Toxicol. Chem. 2020, 39, 85–100. [Google Scholar] [CrossRef] [Green Version]
  9. Campbell, P.G.C.; Fortin, C. Biotic Ligand Model. In Encyclopedia of Aquatic Ecotoxicology; Springer: Dordrecht, The Netherlands, 2013; pp. 237–246. [Google Scholar]
  10. Magalhães, D.D.P.; Marques, M.R.D.C.; Baptista, D.F.; Buss, D.F. Metal bioavailability and toxicity in freshwaters. Environ. Chem. Lett. 2015, 13, 69–87. [Google Scholar] [CrossRef]
  11. Morin, S.; Gómez, N.; Tornés, E.; Licursi, M.; Rosebery, J. Benthic Diatom Monitoring and Assessment of Freshwater Environments: Standard Methods and Future Challenges. In Aquatic Biofilms: Ecology, Water Quality and Wastewater Treatment; Caister Academic Press: Poole, UK, 2016; pp. 111–124. [Google Scholar]
  12. Hare, L. Sentinels (Biomonitors) of Trace Metals in Freshwaters. In Encyclopedia of Aquatic Ecotoxicology; Springer: Dordrecht, The Netherlands, 2013; pp. 1037–1046. [Google Scholar]
  13. Ponton, D.E.; Hare, L. Nickel dynamics in the lakewater metal biomonitor Chaoborus. Aquat. Toxicol. 2010, 96, 37–43. [Google Scholar] [CrossRef]
  14. Bonnineau, C.; Artigas, J.; Chaumet, B.; Dabrin, A.; Faburé, J.; Ferrari, B.J.D.; Lebrun, J.D.; Margoum, C.; Mazzella, N.; Miège, C.; et al. Role of biofilms in contaminant bioaccumulation and trophic transfer in aquatic ecosystems: Current state of knowledge and future challenges. In Reviews of Environmental Contamination and Toxicology (Continuation of Residue Reviews); Springer: New York, NY, USA, 2020. [Google Scholar]
  15. Morin, S.; Cordonier, A.; Lavoie, I.; Arini, A.; Blanco, S.; Duong, T.T.; Tornés, E.; Bonet, B.; Corcoll, N.; Faggiano, L.; et al. Consistency in Diatom Response to Metal-Contaminated Environments. In ICT for Smart Water Systems: Measurements and Data Science; Springer Nature: Basel, Switzerland, 2012; pp. 117–146. [Google Scholar]
  16. Newman, M.C.; McIntosh, A.W. Appropriateness of Aufwuchs as a monitor of bioaccumulation. Environ. Pollut. 1989, 60, 83–100. [Google Scholar] [CrossRef]
  17. Lavoie, I.; Campeau, S.; Zugic-Drakulic, N.; Winter, J.G.; Fortin, C. Using diatoms to monitor stream biological integrity in Eastern Canada: An overview of 10 years of index development and ongoing challenges. Sci. Total Environ. 2014, 475, 187–200. [Google Scholar] [CrossRef]
  18. Flemming, H.-C.; Wingender, J. The biofilm matrix. Nat. Rev. Genet. 2010, 8, 623–633. [Google Scholar] [CrossRef] [PubMed]
  19. Lavoie, I.; Lavoie, M.; Fortin, C. A mine of information: Benthic algal communities as biomonitors of metal contamination from abandoned tailings. Sci. Total Environ. 2012, 425, 231–241. [Google Scholar] [CrossRef] [PubMed]
  20. Hobbs, W.O.; Collyard, S.A.; Larson, C.; Carey, A.J.; O’Neill, S.M. Toxic burdens of freshwater biofilms and use as a source tracking tool in rivers and streams. Environ. Sci. Technol. 2019, 53, 11102–11111. [Google Scholar] [CrossRef] [PubMed]
  21. Dranguet, P.; Le Faucheur, S.; Slaveykova, V.I. Mercury bioavailability, transformations, and effects on freshwater biofilms. Environ. Toxicol. Chem. 2017, 36, 3194–3205. [Google Scholar] [CrossRef]
  22. Markwart, B.; Liber, K.; Xie, Y.; Raes, K.; Hecker, M.; Janz, D.M.; Doig, L.E. Selenium oxyanion bioconcentration in natural freshwater periphyton. Ecotoxicol. Environ. Saf. 2019, 180, 693–704. [Google Scholar] [CrossRef]
  23. Lopez, A.R.; Funk, D.H.; Buchwalter, D.B. Arsenic (V) bioconcentration kinetics in freshwater macroinvertebrates and periphyton is influenced by pH. Environ. Pollut. 2017, 224, 82–88. [Google Scholar] [CrossRef]
  24. Bradac, P.; Wagner, B.; Kistler, D.; Traber, J.; Behra, R.; Sigg, L. Cadmium speciation and accumulation in periphyton in a small stream with dynamic concentration variations. Environ. Pollut. 2010, 158, 641–648. [Google Scholar] [CrossRef]
  25. Le Faucheur, S.; Behra, R.; Sigg, L. Thiol and metal contents in periphyton exposed to elevated copper and zinc concentrations: A field and microcosm study. Environ. Sci. Technol. 2005, 39, 8099–8107. [Google Scholar] [CrossRef]
  26. Allen, H.E. Importance of clean techniques and speciation in assessing water quality for metals. Hum. Ecol. Risk Assess. Int. J. 2000, 6, 989–1002. [Google Scholar] [CrossRef]
  27. Conley, J.M.; Funk, D.H.; Buchwalter, D.B. Selenium bioaccumulation and maternal transfer in the mayfly Centroptilum triangulifer in a life-cycle, periphyton-biofilm trophic assay. Environ. Sci. Technol. 2009, 43, 7952–7957. [Google Scholar] [CrossRef]
  28. Xie, L.; Funk, D.H.; Buchwalter, D.B. Trophic transfer of Cd from natural periphyton to the grazing mayfly Centroptilum triangulifer in a life cycle test. Environ. Pollut. 2010, 158, 272–277. [Google Scholar] [CrossRef] [PubMed]
  29. Kim, K.S.; Funk, D.H.; Buchwalter, D.B. Dietary (periphyton) and aqueous Zn bioaccumulation dynamics in the mayfly Centroptilum triangulifer. Ecotoxicology 2012, 21, 2288–2296. [Google Scholar] [CrossRef] [PubMed]
  30. Leguay, S.; Lavoie, I.; Levy, J.L.; Fortin, C. Using biofilms for monitoring metal contamination in lotic ecosystems: The protective effects of hardness and pH on metal bioaccumulation. Environ. Toxicol. Chem. 2016, 35, 1489–1501. [Google Scholar] [CrossRef]
  31. Lavoie, I.; Morin, S.; Laderriere, V.; Paris, L.-E.; Fortin, C. Assessment of diatom assemblages in close proximity to mining activities in Nunavik, Northern Quebec (Canada). Environments 2019, 6, 74. [Google Scholar] [CrossRef] [Green Version]
  32. Perdue, E.; Ritchie, J. Dissolved Organic Matter in Freshwaters; Elsevier BV: Amsterdam, The Netherlands, 2003; Volume 5, pp. 273–318. [Google Scholar]
  33. Campbel, P.G.C.; Stokes, P.M. Acidification and toxicity of metals to aquatic biota. Can. J. Fish. Aquat. Sci. 1985, 42, 2034–2049. [Google Scholar] [CrossRef]
  34. Wilde, K.L.; Stauber, J.L.; Markich, S.J.; Franklin, N.M.; Brown, P.L. The effect of pH on the uptake and toxicity of copper and zinc in a tropical freshwater alga (Chlorella sp.). Arch. Environ. Contam. Toxicol. 2006, 51, 174–185. [Google Scholar] [CrossRef] [PubMed]
  35. François, L.; Fortin, C.; Campbell, P.G.C.; François, L. pH modulates transport rates of manganese and cadmium in the green alga Chlamydomonas reinhardtii through non-competitive interactions: Implications for an algal BLM. Aquat. Toxicol. 2007, 84, 123–132. [Google Scholar] [CrossRef] [PubMed]
  36. Playle, R.C. Modelling metal interactions at fish gills. Sci. Total. Environ. 1998, 219, 147–163. [Google Scholar] [CrossRef]
  37. Brown, P. Evaluation of the free ion activity model of metal-organism interaction: Extension of the conceptual model. Aquat. Toxicol. 2000, 51, 177–194. [Google Scholar] [CrossRef]
  38. Hare, L.; Tessier, A. Predicting animal cadmium concentrations in lakes. Nat. Cell Biol. 1996, 380, 430–432. [Google Scholar] [CrossRef]
  39. Croteau, M.-N.; Hare, L.; Tessier, A. Refining and testing a trace metal biomonitor (Chaoborus) in highly acidic lakes. Environ. Sci. Technol. 1998, 32, 1348–1353. [Google Scholar] [CrossRef]
  40. Ponton, D.E.; Hare, L. Assessment of nickel contamination in lakes using the phantom midge Chaoborus as a biomonitor. Environ. Sci. Technol. 2009, 43, 6529–6534. [Google Scholar] [CrossRef] [PubMed]
  41. Kola, H.; Wilkinson, K.J. Cadmium uptake by a green alga can be predicted by equilibrium modelling. Environ. Sci. Technol. 2005, 39, 3040–3047. [Google Scholar] [CrossRef] [PubMed]
  42. Paquin, P.R.; Gorsuch, J.W.; Apte, S.; Batley, G.E.; Bowles, K.C.; Campbell, P.G.; Delos, C.G.; Di Toro, D.M.; Dwyer, R.L.; Galvez, F.; et al. The biotic ligand model: A historical overview. Comp. Biochem. Physiol. Part C Toxicol. Pharmacol. 2002, 133, 3–35. [Google Scholar] [CrossRef]
  43. Pagenkopf, G.K. Gill surface interaction model for trace-metal toxicity to fishes: Role of complexation, pH, and water hardness. Environ. Sci. Technol. 1983, 17, 342–347. [Google Scholar] [CrossRef]
  44. Ardestani, M.M.; Van Straalen, N.M.; Van Gestel, C.A.M. Biotic ligand modeling approach: Synthesis of the effect of major cations on the toxicity of metals to soil and aquatic organisms. Environ. Toxicol. Chem. 2015, 34, 2194–2204. [Google Scholar] [CrossRef] [Green Version]
  45. Crémazy, A.; Brix, K.V.; Wood, C.M. Using the Biotic Ligand Model framework to investigate binary metal interactions on the uptake of Ag, Cd, Cu, Ni, Pb and Zn in the freshwater snail Lymnaea stagnalis. Sci. Total Environ. 2019, 647, 1611–1625. [Google Scholar] [CrossRef]
  46. Lavoie, M.; Campbell, P.G.C.; Fortin, C. Predicting cadmium accumulation and toxicity in a green alga in the presence of varying essential element concentrations using a biotic ligand model. Environ. Sci. Technol. 2014, 48, 1222–1229. [Google Scholar] [CrossRef]
  47. Mebane, C.A.; Schmidt, T.S.; Miller, J.L.; Balistrieri, L.S. Bioaccumulation and toxicity of cadmium, copper, nickel and zinc and their mixtures to aquatic insect communities. Environ. Toxicol. Chem. 2020, 39, 812–833. [Google Scholar] [CrossRef] [Green Version]
  48. McGeer, J.C.; Brix, K.V.; Skeaff, J.M.; Deforest, D.K.; Brigham, S.I.; Adams, W.J.; Green, A. Inverse relationship between bioconcentration factor and exposure concentration for metals: Implications for hazard assessment of metals in the aquatic environment. Environ. Toxicol. Chem. 2003, 22, 1017–1037. [Google Scholar] [CrossRef]
Figure 1. Biofilm metal content (mol/g dry weight) plotted as a function of calculated free metal concentration in solution (M). (a,d) Copper; (b,e) Nickel; (c,f) Cadmium. Lines represent linear regressions. Top panels are for the entire data set while bottom panels show results for sites where pH is greater than 6. Error bars represent standard deviations around the mean (n = 3). White circles correspond to sites where pH < 6.
Environments 07 00112 g001
Figure 2. Biofilm metal content normalized for exposure free metal concentration (L/g dry weight) are plotted as a function of calculated free competing ion (H+, Mg2+, Mn2+, and Ca2+) concentration in solution (M). (ad) Copper; (eh) Nickel; (il) Cadmium. Determination coefficients and p-values from linear regressions are presented. White circles correspond to sites where pH < 6.
Environments 07 00112 g002
Figure 3. Pearson correlation matrix for all calculated free cation concentrations in the sampled surface waters of Nunavik and biofilm Cd, Cu, and Ni content. Pearson coefficients (r) were calculated using a log transformation of the mean for each site (n = 3) including all data regardless of pH.
Environments 07 00112 g003
Figure 4. Biofilm copper (ac), nickel (df), and cadmium (gi) content normalized for exposure free metal concentration (L/g dry weight) are plotted as a function of calculated free competing ion (Cu2+, Ni2+, and Cd2+) concentration in solution (M). Determination coefficients and p-values from linear regressions are presented. White circles correspond to sites where pH < 6.
Environments 07 00112 g004
Figure 5. Biofilm metal contents (mol/g dry weight) plotted as a function of calculated free metal concentration in solution (M) at sampling sites where pH > 6. Copper (a); Cadmium (b). Lines represent linear regressions. Error bars represent standard deviations around the mean (n = 3). Black circles: Current data; white circles: Data from Leguay et al. [30].
Environments 07 00112 g005
Publisher’s Note: MDPI stays neutral with regard to jurisdictional claims in published maps and institutional affiliations.

