Article

Associations of Exposure to Nitrogen Oxides with Prevalent Asthma and Other Atopic Diseases in Israel

1
Braun School of Public Health and Community Medicine, The Hebrew University of Jerusalem-Hadassah, Jerusalem 9112102, Israel
2
Air Quality and Climate Change Division, Israel Ministry of Environmental Protection, Jerusalem 34033, Israel
3
Department of Preventive Medicine, School of Public Health, Sackler Faculty of Medicine, Tel Aviv University, Tel Aviv 6997801, Israel
4
Department of Military Medicine, Faculty of Medicine, The Hebrew University, Jerusalem 9112102, Israel
5
Israel Defense Forces Medical Corps, Ramat Gan 5262000, Israel
6
Institute of Endocrinology, Sheba Medical Center, Tel Hashomer, Ramat Gan 5262000, Israel
7
Technion Center of Excellence in Exposure Sciences and Environmental Health (TCEEH), Haifa 3200003, Israel
8
Academic Center for Continuing Medical Education, Sackler School of Medicine, Tel Aviv University, Tel Aviv 6997801, Israel
9
Department of Geography, The Hebrew University of Jerusalem, Jerusalem 9190501, Israel
10
Remote Sensing Research Centre, School of Earth and Environmental Sciences, University of Queensland, Brisbane, QLD 4072, Australia
11
Pediatric Pulmonology Unit, Department of Pediatrics & The Wohl Institute for Translational Medicine, Hadassah Medical Center, Faculty of Medicine, The Hebrew University of Jerusalem, Jerusalem 9112102, Israel
12
Pediatric Pulmonary Institute, Ruth Children’s Hospital, Rambam Health Care Campus, Haifa 3109601, Israel
*
Author to whom correspondence should be addressed.
Submission received: 6 September 2021 / Revised: 1 October 2021 / Accepted: 13 October 2021 / Published: 19 October 2021

Abstract

:
Childhood exposure to nitrogen oxides (NOx) is considered a risk factor for the onset of asthma. However, associations of this exposure with other atopic diseases and factors that modify this association are less clear. We aimed to study associations between exposure to NOx and the prevalence of atopic diseases in Israeli adolescents using a cross-sectional design. The study population comprised all Israeli-born adolescents whose medical status was evaluated for mandatory military recruitment during 1967–2017 (n = 2,523,745), of whom 5.9% had prevalent asthma. We based the exposure assessments on a land-use regression model and estimated associations using multivariable logistic regression models. Across all periods, mean exposure to NOx from birth to adolescence was associated with prevalent asthma at the examination in a dose-response manner, with an odds ratio for the upper quintile of 1.61 (95% CI: 1.56–1.67), in comparison to the lowest quintile. Associations were stronger in males and in lower socioeconomic strata. We found the strongest associations for asthma with comorbid rhinitis, with an almost twofold increase in the odds of upper versus lower quintile of exposure (odds ratio = 1.96, 95% CI: 1.82–2.11). Rhino-conjunctivitis and allergic atopic dermatitis suggested a possible threshold level with NOx. Capsule Summary: Research indicates that half of the global population will suffer from an allergic condition at some point in life. Childhood exposure to nitrogen oxides is a risk factor for the onset of asthma. The association between exposure and allergic diseases other than asthma is unclear. We demonstrate a strong, dose-response relationship between exposure and a group of allergic outcomes, using data comprising 2.5 million subjects over 50 years. The large health benefits from clean air should motivate governments to prioritize mitigation measures.

1. Introduction

Air pollution is a risk factor for new-onset asthma [1,2]. Recent systematic reviews reported links between traffic-related air pollution (TRAP), asthma exacerbations, and new-onset asthma throughout childhood and adolescence [3,4,5,6,7,8,9,10,11,12,13], with the strength of the evidence depending on the pollutant [7].
Mainly, discrepancies and inconsistencies exist concerning the role of nitrogen oxides (NOx) in asthma [3,14,15]. Specifically, whereas some recent studies [13,16,17] provide evidence of associations between NOx and asthma, other recent studies did not reproduce these and found no such indications [18]. Furthermore, although the epidemiological evidence of the different associations between air pollution and respiratory health for males and females is expanding, discrepancies and contradictory results are still reported [19,20].
Associations of other atopic diseases with ambient air pollution are not well established [21,22,23,24]. A meta-analysis of five European birth cohorts from seven areas in five European countries found no indication of an association of long-term air pollution exposure with the prevalence of current pediatric eczema, rhinoconjunctivitis, or asthma [18]. In a prospective birth cohort study of 14,126 participants from Germany, Sweden, and the Netherlands, there was no association of air pollution with rhino-conjunctivitis [8]. In a birth cohort including 732 children from France, no association of early postnatal traffic air pollution exposure with allergic rhinitis was found [16].
Other studies, however, did report evidence for significant relevant associations. For example, exposure to NOx was found to be associated with allergic rhinitis in Taiwanese children [25]. A study that examined associations of exposure to air pollution in early life and various health outcomes throughout childhood and adolescence in Canada found exposures to ozone and nitrogen dioxide to be is associated with incidents of asthma and eczema in children [11] Further evidence indicates that various air pollutants, including NOx, are risk factors for developing allergic atopic dermatitis [11,26,27,28,29]. However, these results need to be confirmed because of the limited number of studies and their limitations, including address data, diagnosis methodology, and sample size.
Here we report a population-based cross-sectional study of associations between childhood exposure to ambient NOx air pollution and prevalence of asthma and other atopic diseases at age 17 in adolescents. We based the medical diagnoses on computerized records of mandatory health examinations at military recruitment centers between 1967–2017 in Israel (N~2.5 million).

2. Methods

2.1. Study design and Study Population

In Israel, all residents are obligated to serve in the Israeli Defense Forces, except for the Arab population. Some ultra-orthodox adolescents and a fraction of orthodox females are exempted from service, and many adolescents who belong to the Bedouin and Druze minorities volunteer. As part of the draft process and to assess suitability for military roles, they go through medical examination at approximately 17 years. This is a nationwide population-based cross-sectional study of adolescents aged 16–20 who were born between 1947–2001 in Israel and who underwent a medical examination in the army medical corps during 1967–2017. After excluding 303 cases for whom age at medical evaluation was missing, the study population included n = 2,523,745 adolescents. Ethical permission for the study was granted by the institutional review board of the Israeli medical corps (protocol 1663–2011).

2.2. Cases Ascertainment

Identification of health outcomes at regional military recruitment centers in Israel has been described previously [30]. Briefly, these health examinations include a medical interview, a medical history review provided by the primary care physician, and a physical exam performed by a physician. Subsequently, standardized numerical codes are assigned to each examinee to denote medical diagnoses. We retrieved data about prevalent asthma, allergic rhinitis, allergic atopic dermatitis, and rhino-conjunctivitis. We examined the changes in the definition of these diagnoses over the years and harmonized them into unified diagnoses.

2.3. Exposure Assessment

Ambient air pollution measurements in Israel are performed routinely at over 100 monitoring stations. The Ministry of Environmental Protection, municipal associations for environmental protection, and the Israel Electric Corporation operate these stations. We based the exposure to NOx on a land-use regression model that relies on 20 years (1992–2011) of air quality monitoring data and estimates of NOx levels since 1961. The model assesses annual exposure to NOx with a 50 m resolution in all municipal areas [31,32]. We generated spatial variables for the model by developing and reconstructing environmental data on a national scale, based on historical 1:50,000 topographic maps for each decade and satellite imagery, and constructed annual changes in the traffic volume of Israel’s highways. The modeling approach was to find the model to produce the best-predicted NOx levels over the entire study domain. We used reconstructed historical spatial data to calculate exposure several decades before measurements were available. The model’s leave-one-out cross-validation (CV) adjusted-R2 was 0.74 (p-value < 0.0001), and the correlation between the model’s annual averages and the national annual NOx emissions between 1965 and 2011 was 0.75. Additional information about the model can be found elsewhere [31,32]. We calculated exposure estimates as the average NOx concentrations from birth to age 17 years in the official residential addresses of each adolescent. Eighty percent of the addresses were geocoded with very good accuracy (full address or street level), and an additional 10.0% were geocoded at the neighborhood or the locality level.

2.4. Statistical Methods
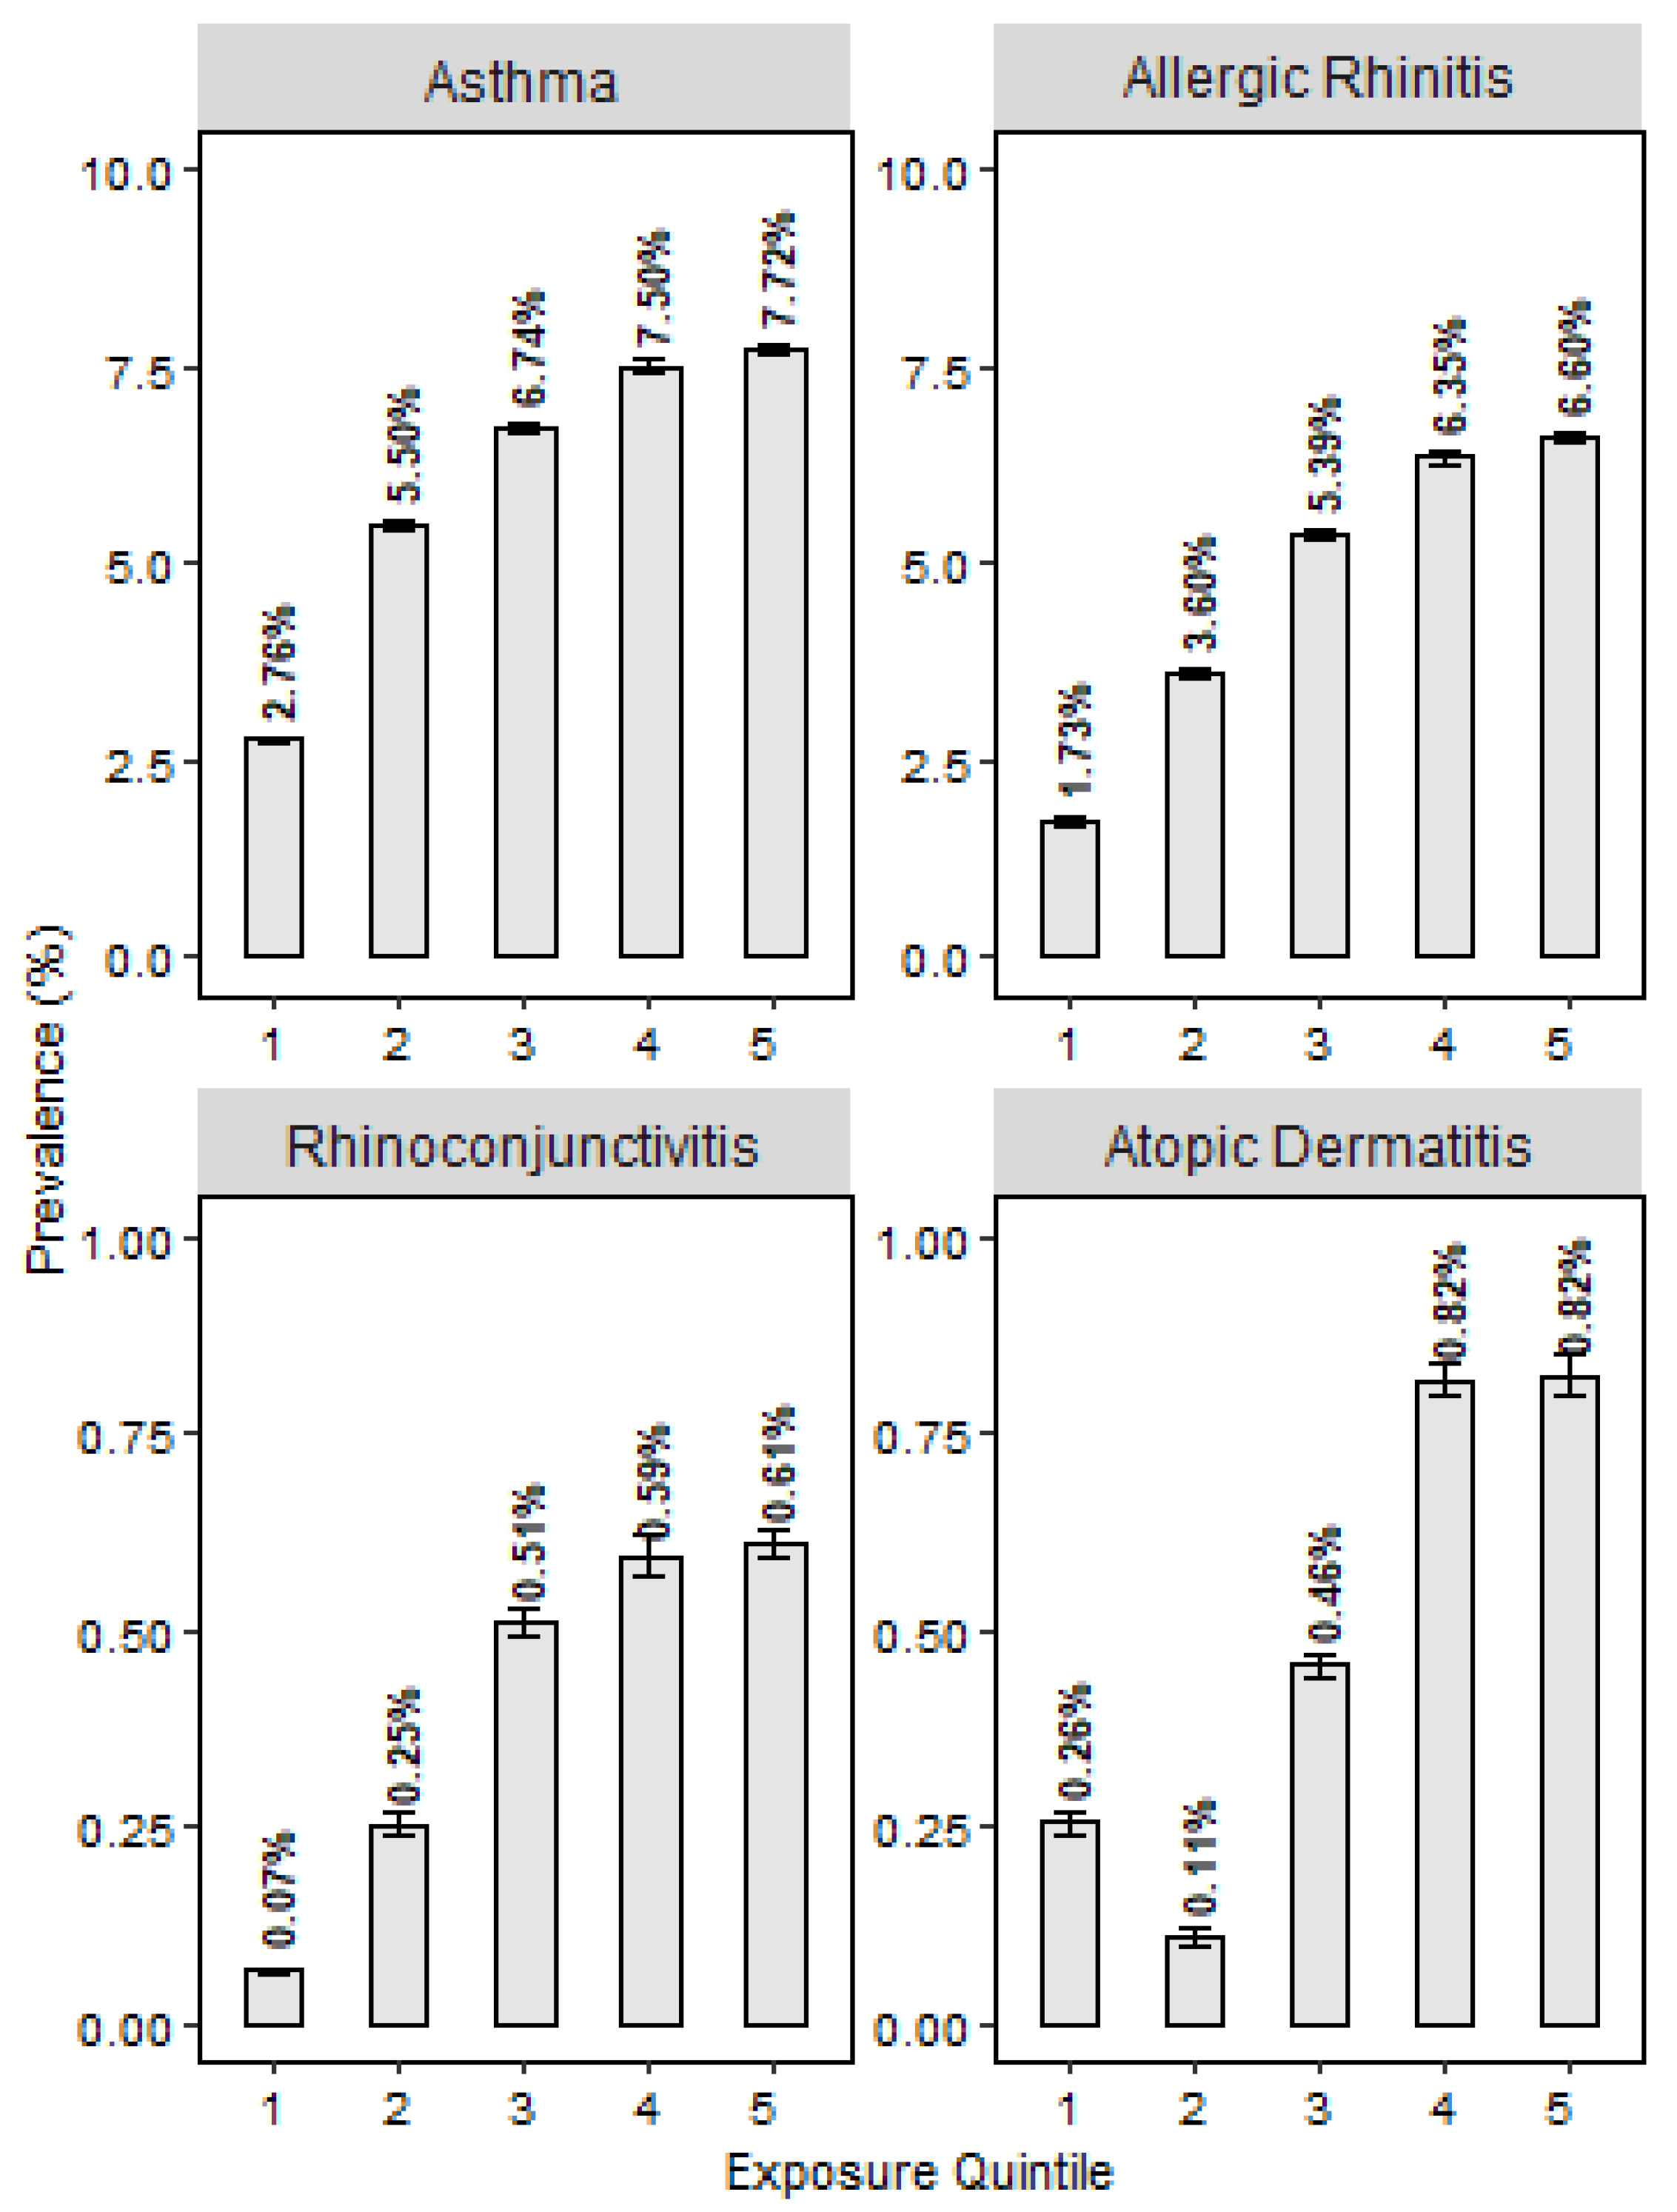
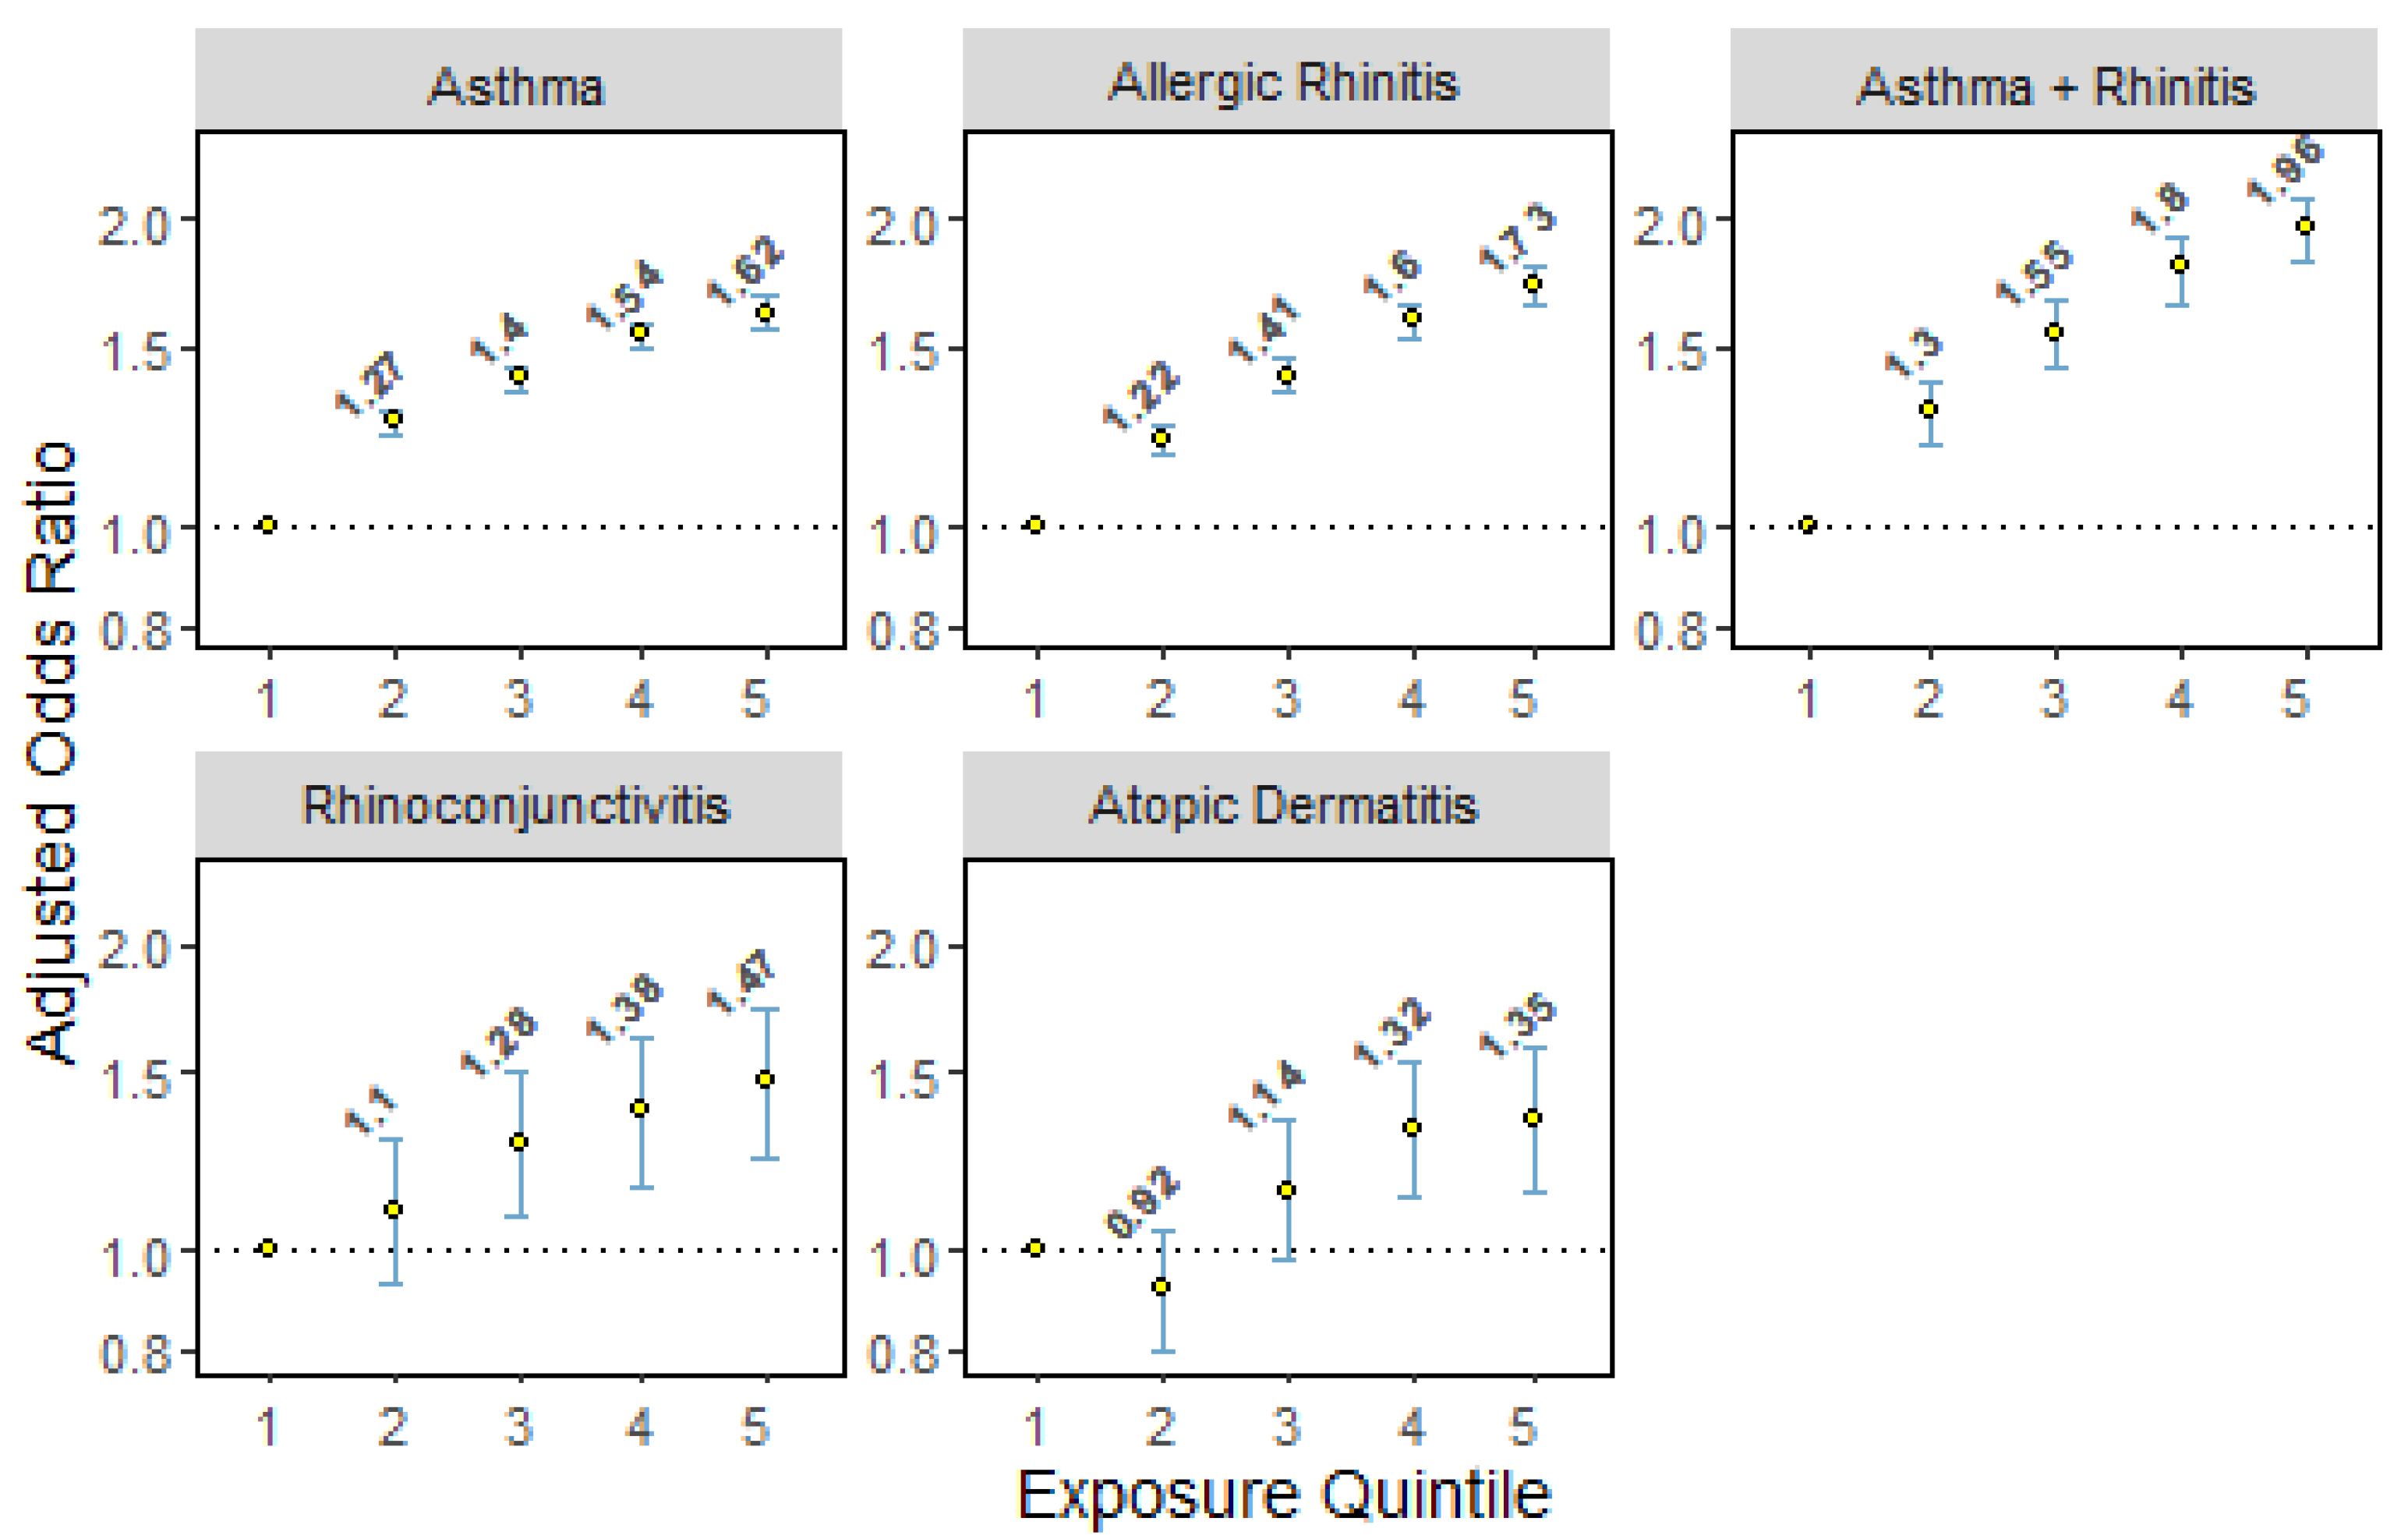
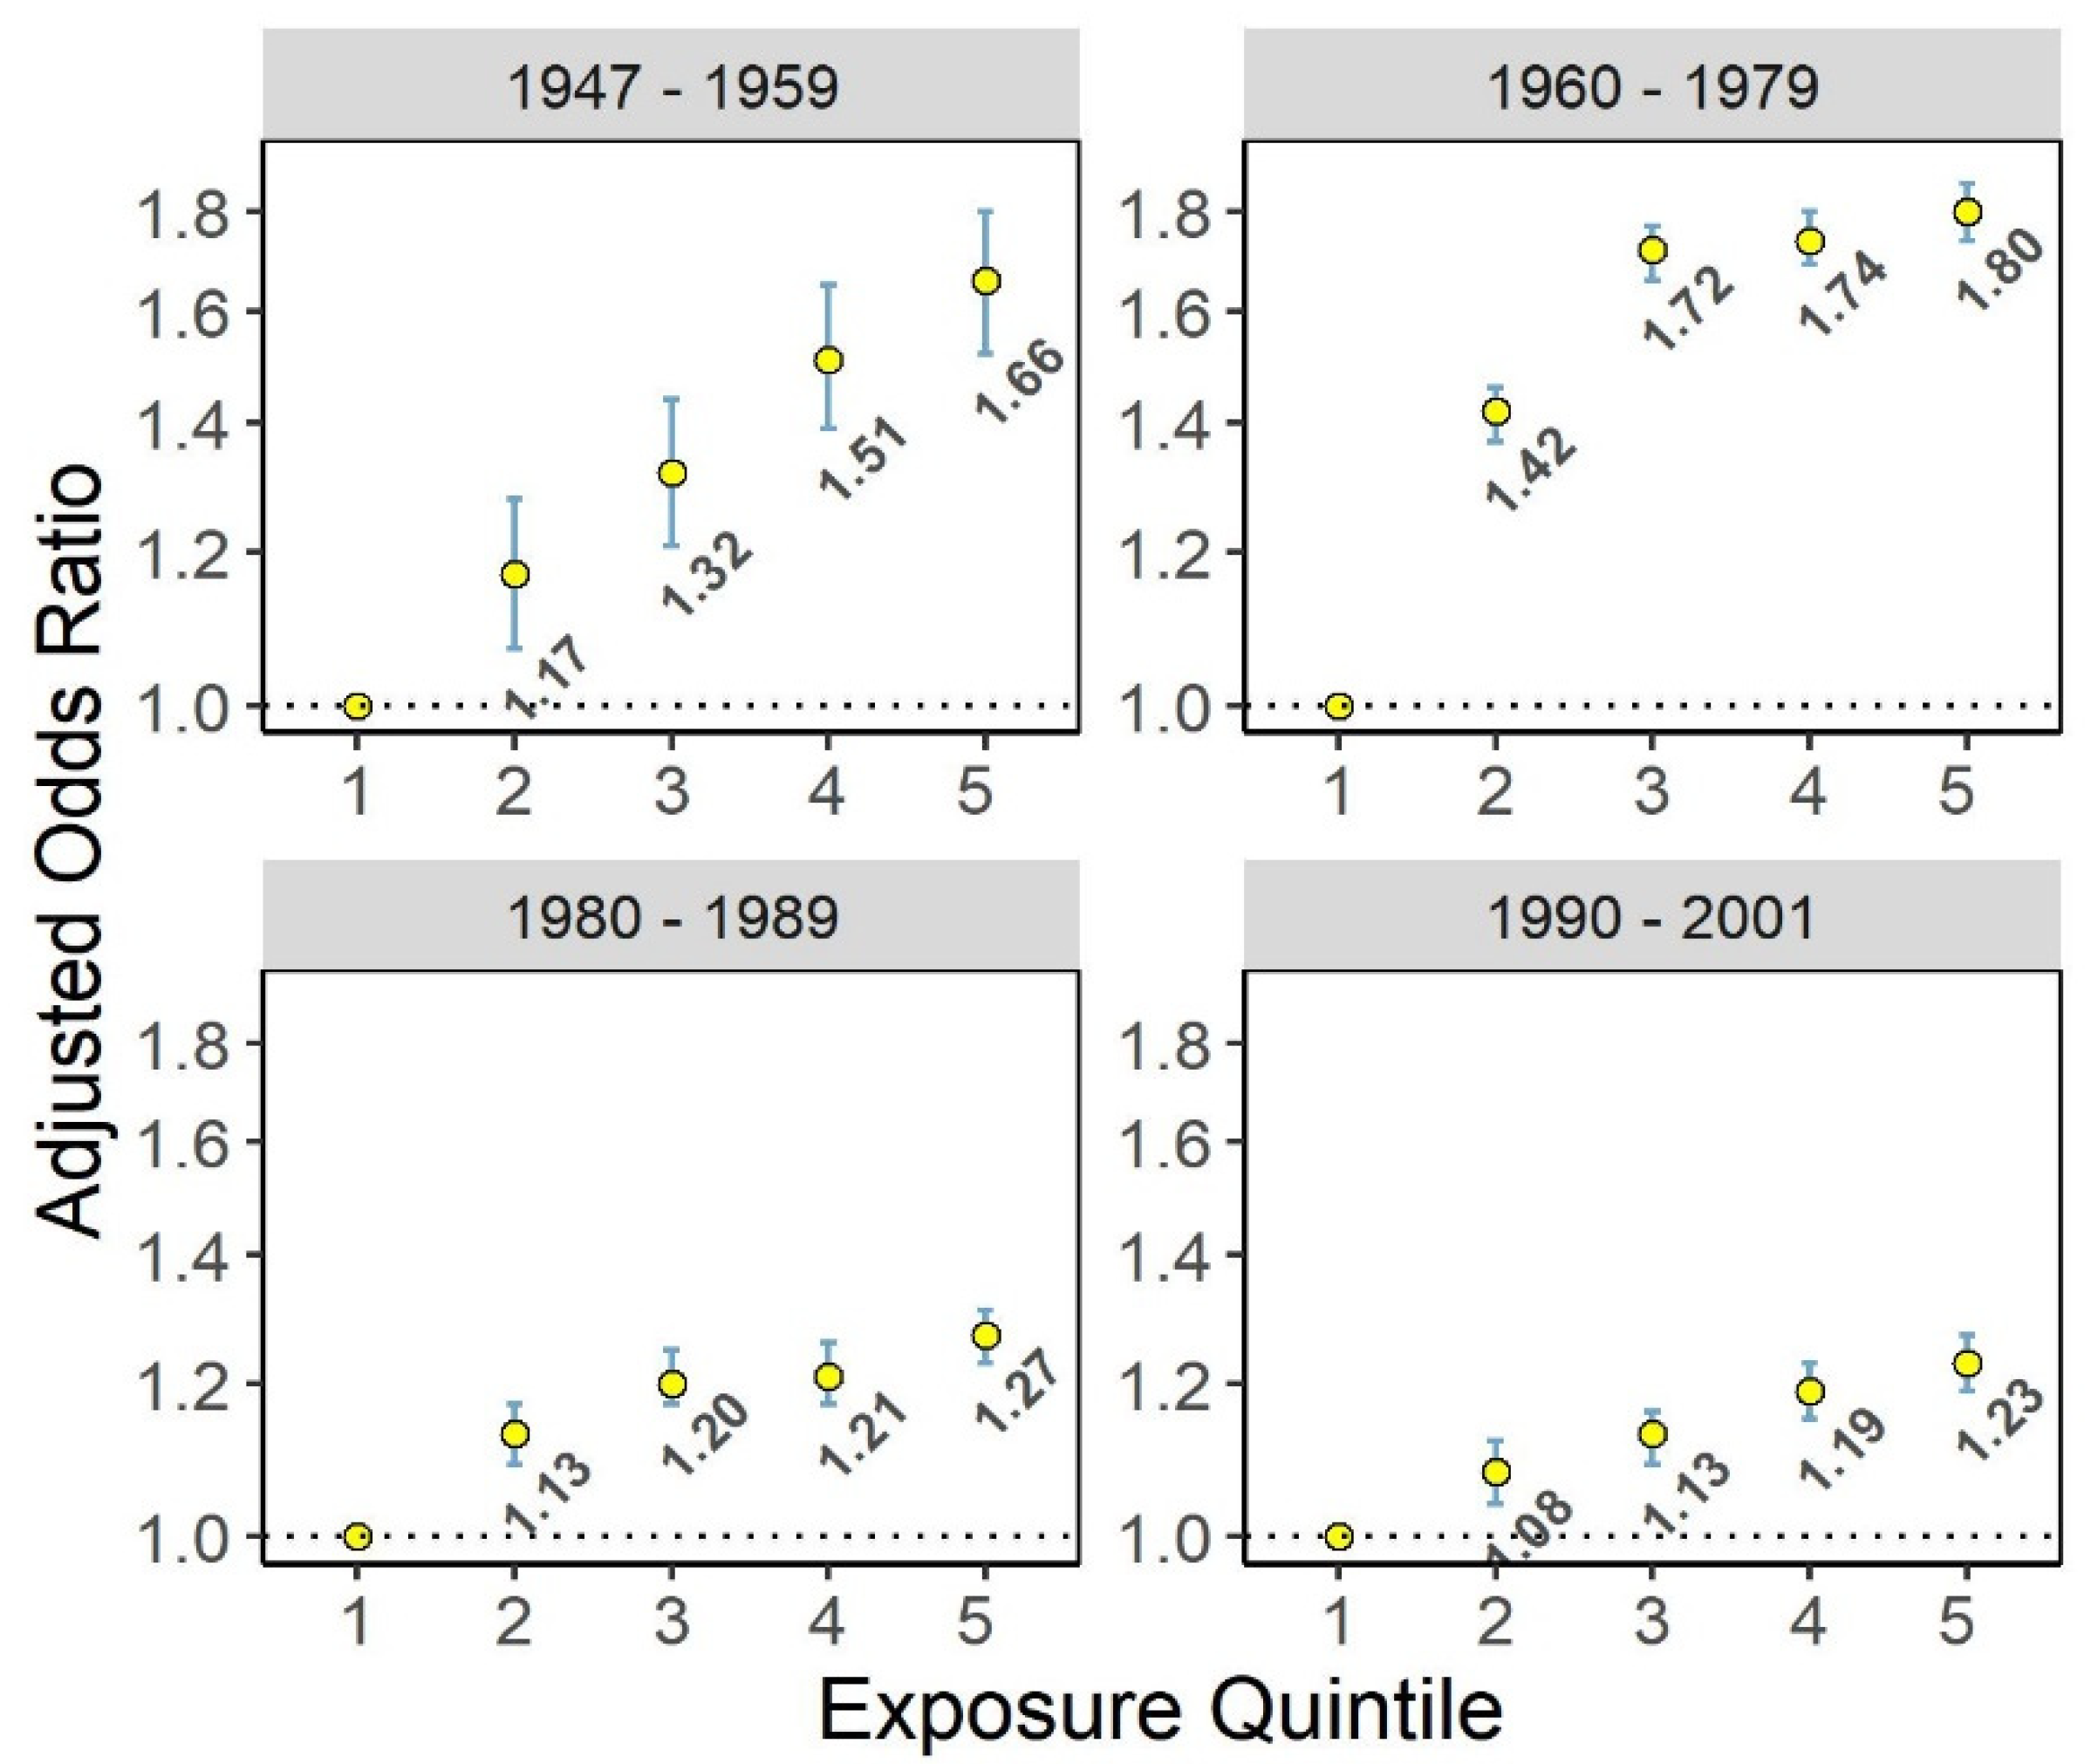
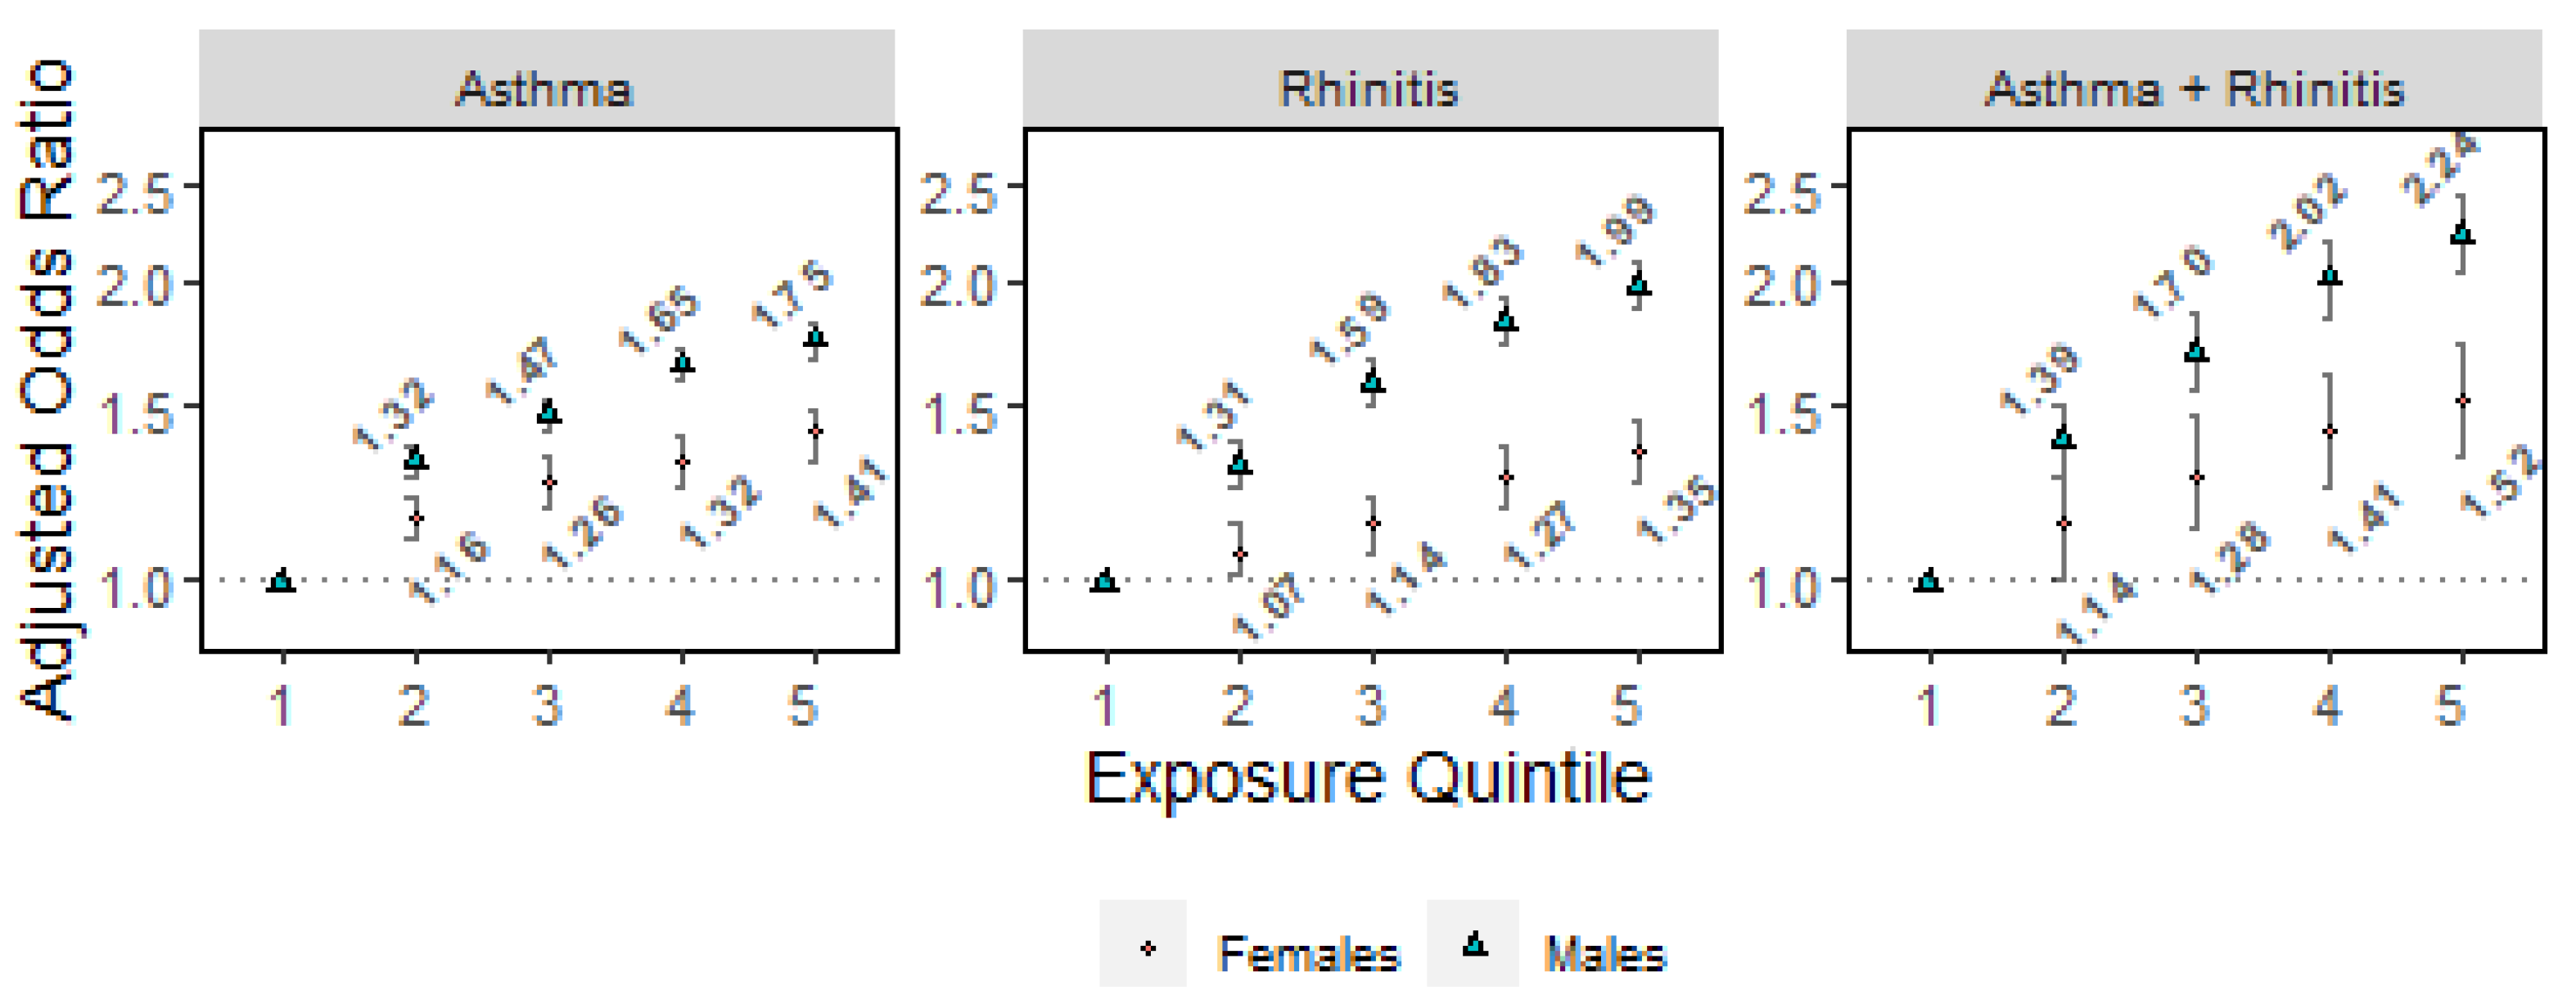
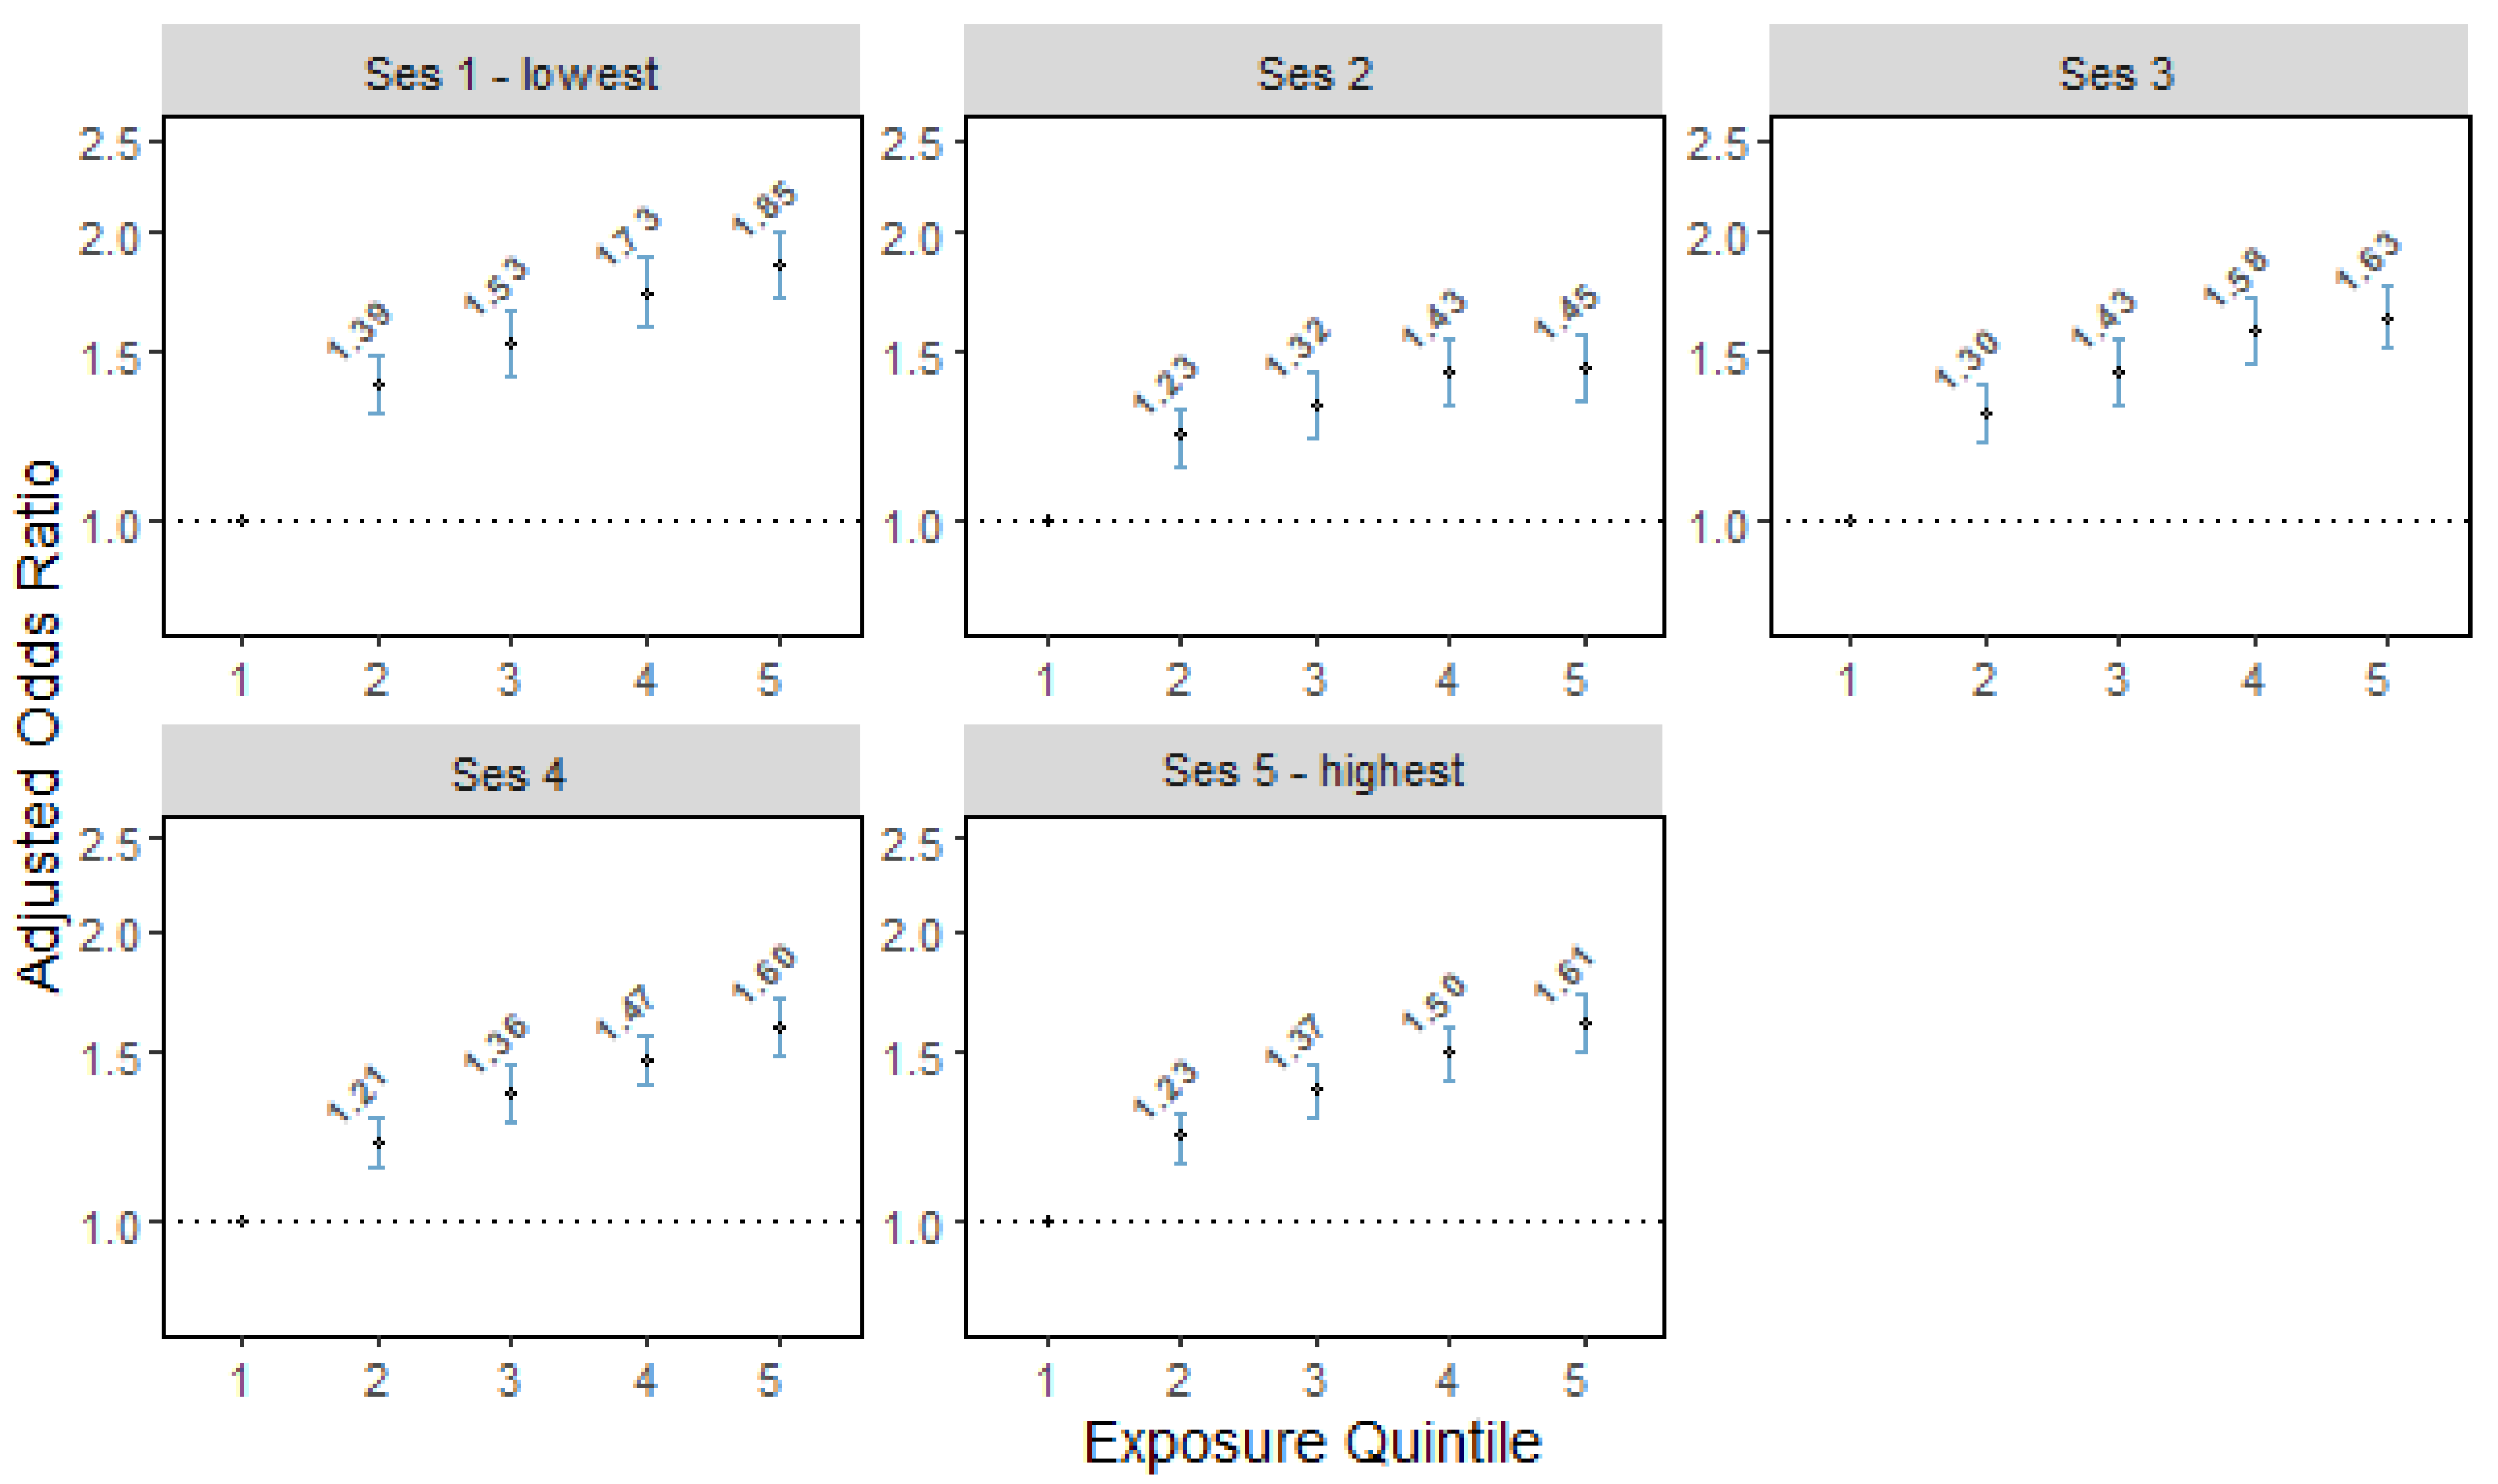
We categorized exposure to NOx into five quintiles: <5.63, 5.63–10.5, 10.5–14.7, 14.7–19.1, and >19.1 ppb. We calculated the crude prevalence and its 95% confidence interval (CI) by exposure quintiles for each health outcome. Associations between exposure and health outcomes were examined via generalized linear models applying multivariable logistic regression analyses and reported as odds ratios (OR) and 95% CI per each quintile of exposure compared to the lowest quintile. We adjusted the models for the following set of pre-specified confounders: year of birth, sex, school religious orientation (secular, religious, ultra-orthodox), and socioeconomic status (SES, taken from the Central Bureau of Statistics at the level of small statistical area). The SES is an economic and social status measure based on standardized small statistical area education, income, employment, transportation, and other variables [33]. We categorized census SES into equal-participant number intervals, such that with the first quintile having (the group with the lowest SES) is the 20th centile or less, and the fifth quintile (the group with the highest SES) corresponds to the 80th percentile or higher. We constructed stratified analyses to check for effect modification by sex, year of birth, and SES. We conducted all data analyses in R version 3.5.3.

3. Results

Table 1 presents the characteristics of the study population and the prevalence of the relevant health outcomes. The distribution of the main characteristics of the population according to the exposure quintiles is presented in Supplementary Table S1.
The prevalence of asthma, allergic rhinitis, rhino-conjunctivitis, atopic dermatitis, and asthma with comorbid allergic rhinitis in the study population were 5.9%, 4.6%, 0.4%, 0.5%, and 1.6%, respectively. The mean NOx exposure from birth until medical evaluation was 13.9 ppb, with a standard deviation of 9.8 ppb. Figure 1 shows the prevalence proportions and their 95% CI for asthma, allergic rhinitis, rhino-conjunctivitis, atopic dermatitis by exposure quintiles. Interestingly, exposure to ambient NOx concentration demonstrated classic exposure-response relationships in the four lowest quintiles with the prevalence of asthma, allergic rhinitis, and rhino-conjunctivitis, but not with atopic dermatitis.
Figure 2 displays adjusted associations between exposure and the presence of each disease. All associations demonstrated a dose-response curve except for atopic dermatitis, which suggested a threshold exposure level. Associations of NOx with asthma or allergic rhinitis were strongest for asthma with comorbid allergic rhinitis, with an almost two-fold increased risk of upper versus lower quintile of exposure (OR = 1.96, 95% CI: 1.82–2.11).
When stratifying the study population by the decade of birth, we found that the shape of the exposure-response curve between NOx and asthma remained similar in all periods (Figure 3). The weakening of the associations in the last two periods may be a result of the varying absolute levels of the exposure quintiles. In addition, the associations of NOx with asthma, allergic rhinitis, or both were stronger in males vs. females (Figure 4). Finally, the association with asthma was stronger in the lower SES quintile than all other quintiles (Figure 5).

4. Discussion

We aimed to explore associations between exposure to ambient NOx and the prevalence of asthma and other atopic diseases in adolescence in Israel. In most of the relevant period for this study, NOx was emitted in Israel mainly from industrial sources, power plants, and transportation [34].
We found a higher prevalence of asthma with increasing exposure to NOx. This finding strengthens previous findings on the relationship between NOx and the onset of asthma [3,6,8,11]. In a birth cohort of 24,608 children from Georgia, U.S., the risk of asthma increased from the first to second quintile of the first year of life exposure to NOx but was comparable with higher exposure [17]. In our study, the associations are characterized by a classical exposure-response curve.
The common mechanistic explanations for our findings are the induction of pulmonary oxidative stress and antioxidant depletion, inflammation, and activation of receptors of the bronchial epithelium, and an increase in Th2 and Th17 cytokines. Additional effects may involve epigenetic changes, pulmonary microbiome modifications, and interaction of NOx with environmental antigens to enhance their activity [17,35,36,37,38].
In addition to asthma, our analyses show a higher prevalence of allergic rhinitis, atopic dermatitis, and rhino-conjunctivitis with increased exposure to NOx. These results have particular importance given the forecast that half of the global population will suffer from an allergic condition at some point in life [39]. Previous studies that examined associations between air pollution and atopic diseases other than asthma did not result in definitive conclusions [21]. Concerning atopic dermatitis, exposure during gestation and three months after birth was calculated for each Taiwan birth cohort subject at a spatial level of administrative divisions [27]. In another study that recruited newborns and followed them up to age six, participation depended to an extent on the exposure level, with more highly exposed children less likely to participate [28]. In a recent study [11], the small sample size (n = 1286) limited the ability to detect weak effects of pollutants on some outcomes.
We found the strongest association in our study for asthma with comorbid allergic rhinitis, with an almost twofold increased risk of upper versus lower exposure quintile. Asthma and allergic rhinitis are often comorbid conditions and share various characteristics [40,41,42,43]. Compared to asthma alone, patients with comorbid allergic rhinitis and asthma have greater use of health care resources, including visits to the general practitioners, emergency departments, and hospitalizations [44].
We also found that associations of NOx with asthma, allergic rhinitis, and their co-morbidity were more substantial in males and in the lowest SES quintile, agreeing with previous studies that examined this possible effect modifier [45,46,47,48]. Previous work indicates limitations in comparing childhood cohorts, stressing the need to investigate larger populations [20]. Our study examined a large population, and we assessed exposure with a 50 m resolution, allowing enhanced statistical power to detect possible effect modifiers.
Our study has several strengths. Firstly, we based it on a comprehensive national dataset that includes mandatory medical examinations by relevant medical experts, minimizing selection bias due to lack of participation and active collaboration. Secondly, it spans over 50 years of data, making the associations robust for time-varying confounding structures. Thirdly, its sample size enables efficient sub-group analyses to examine effect modification and possible confounding by time-varying factors.
We also recognize several limitations of this study. The first is the cross-sectional design, which is a constraint of having only prevalence data at a particular time point, and this bounds our ability to derive causal relationships. This design cannot examine disease onset, disease exacerbation, or further clinical information. Secondly, exposure error components need to be addressed. The assessment of the mean exposure from birth to evaluation at conscription relied on addresses known at the time of medical evaluation. Unfortunately, data about indoor exposures, an important component of the exposure matrix [49], was unavailable in this study. To partially tackle an unknown address change problem, we have limited our sample to Israeli-born adolescents. In addition, as long as the errors that stem from such inaccuracy of exposure data do not distribute differently among adolescents with and without the relevant health condition we have examined, we can regard this error as non-differential. Thirdly, as this study spans over 50 years of data, changes in the health outcomes diagnoses definitions have occurred throughout this long period. Nevertheless, we have harmonized the nomenclature that changed over time into unified diagnoses. Fourthly, we acknowledge our inability to better adjust for potential confounders. Smoking (including environmental tobacco smoking) is a potential confounder of the associations between air pollution and asthma [50]. We reduced possible confounding by adjusting for SES and school religious orientation, which we expect to be associated with smoking [51,52]. Finally, our study lacks sensitization data, which is important in the differentiation between atopic and non-atopic diseases. However, atopic asthma comprises up to 80% of all pediatric asthma cases. [53,54]. Atopic dermatitis and allergic rhinitis are atopic conditions by definition.
In summary, childhood exposure to NOx is associated with a higher prevalence of asthma and other atopic diseases in Israeli adolescents. Our findings also suggest that the association with asthma is more potent in boys and children of the lowest SES. Future research should examine the possible role of genetic factors in these associations.

Supplementary Materials

The following are available online at https://0-www-mdpi-com.brum.beds.ac.uk/article/10.3390/environments8100110/s1, Table S1: Main Characteristics of the Population by Quintiles of Exposure to NOx.

Author Contributions

Conceptualization R.R., G.T., I.L., and D.M.B.; methodology, R.R., and N.L.; validation, R.L.B.-O., A.L., D.T., E.D., and R.R.; formal analysis, R.R. and R.L.B.-O.; resources, R.R., D.M.B., G.T., A.L., and N.L.; data curation, R.R., R.L.B.-O., D.T., and E.D.; investigation, R.R., and R.L.B.-O.; writing—original draft preparation, R.L.B.-O., and R.R.; writing—review and editing, I.L., D.M.B., A.G.-H., N.L., E.D., B.S., A.G.-H., L.B., and G.T.; visualization, R.R., and R.L.B.-O.; supervision, R.R. and G.T.; project administration, R.R., G.T., and D.M.B. All authors have read and agreed to the published version of the manuscript.

Funding

This research received no external funding.

Institutional Review Board Statement

The study was conducted according to the guidelines of the Declaration of Helsinki, and approved by the Institutional Review Board of the Israeli medical corps (protocol code 1663-2011).

Informed Consent Statement

Patient consent was waived due to the characteristics of the study and its large sample size.

Data Availability Statement

Confidential Military data was used in this study.

Conflicts of Interest

The authors declare no conflict of interest.

References

  1. Cohen, A.J.; Brauer, M.; Burnett, R.; Anderson, H.R.; Frostad, J.; Estep, K.; Balakrishnan, K.; Brunekreef, B.; Dandona, L.; Dandona, R.; et al. Estimates and 25-year trends of the global burden of disease attributable to ambient air pollution: An analysis of data from the Global Burden of Diseases Study 2015. Lancet 2017, 389, 1907–1918. [Google Scholar] [CrossRef] [Green Version]
  2. Burbank, A.J.; Sood, A.K.; Kesic, M.J.; Peden, D.B.; Hernandez, M.L. Environmental determinants of allergy and asthma in early life. J. Allergy Clin. Immunol. 2017, 140, 1–12. [Google Scholar] [CrossRef] [PubMed] [Green Version]
  3. Anderson, H.R.; Favarato, G.; Atkinson, R.W. Long-term exposure to air pollution and the incidence of asthma: Meta-analysis of cohort studies. Air Qual. Atmos. Health 2013, 6, 47–56, Erratum Air Qual. Atmos. Health 2013, 6, 541–542. [Google Scholar] [CrossRef]
  4. Bowatte, G.; Lodge, C.; Lowe, A.J.; Erbas, B.; Perret, J.; Abramson, M.J.; Matheson, M.; Dharmage, S.C. The influence of childhood traffic-related air pollution exposure on asthma, allergy and sensitization: A systematic review and a meta-analysis of birth cohort studies. Allergy 2015, 70, 245–256. [Google Scholar] [CrossRef] [PubMed]
  5. Burbank, A.J.; Peden, D.B. Assessing the impact of air pollution on childhood asthma morbidity: How, when, and what to do. Curr. Opin. Allergy Clin. Immunol. 2018, 18, 124–131. [Google Scholar] [CrossRef]
  6. Eguiluz-Gracia, I.; Mathioudakis, A.G.; Bartel, S.; Vijverberg, S.J.H.; Fuertes, E.; Comberiati, P.; Cai, Y.S.; Tomazic, P.V.; Diamant, Z.; Vestbo, J.; et al. The need for clean air: The way air pollution and climate change affect allergic rhinitis and asthma. Allergy 2020, 75, 2170–2184. [Google Scholar] [CrossRef]
  7. Guarnieri, M.; Balmes, J.R. Outdoor air pollution and asthma. Lancet 2014, 383, 1581–1592. [Google Scholar] [CrossRef] [Green Version]
  8. Gehring, U.; Wijga, A.H.; Hoek, G.; Bellander, T.; Berdel, D.; Brüske, I.; Fuertes, E.; Gruzieva, O.; Heinrich, J.; Hoffmann, B.; et al. Exposure to air pollution and development of asthma and rhino-conjunctivitis throughout childhood and adolescence: A population-based birth cohort study. Lancet Respir. Med. 2015, 3, 933–942. [Google Scholar] [CrossRef] [Green Version]
  9. Khreis, H.; Kelly, C.; Tate, J.; Parslow, R.; Lucas, K.; Nieuwenhuijsen, M. Exposure to traffic-related air pollution and risk of development of childhood asthma: A systematic review and meta-analysis. Environ. Int. 2017, 100, 1–31. [Google Scholar] [CrossRef] [Green Version]
  10. Gehring, U.; Wijga, A.H.; Brauer, M.; Fischer, P.; de Jongste, J.C.; Kerkhof, M.; Oldenwening, M.; Smit, H.A.; Brunekreef, B. Traffic-related air pollution and the development of asthma and allergies during the first 8 years of life. Am. J. Respir. Crit. Care Med. 2010, 181, 596–603. [Google Scholar] [CrossRef] [Green Version]
  11. To, T.; Zhu, J.; Stieb, D.; Gray, N.; Fong, I.; Pinault, L.; Jerrett, M.; Robichaud, A.; Ménard, R.; van Donkelaar, A.; et al. Early life exposure to air pollution and incidence of childhood asthma, allergic rhinitis and eczema. Eur. Respir. J. 2020, 55, 1900913. [Google Scholar] [CrossRef]
  12. Gowers, A.M.; Cullinan, P.; Ayres, J.G.; Anderson, H.R.; Strachan, D.P.; Holgate, S.T.; Mills, I.C.; Maynard, R.L. Does outdoor air pollution induce new cases of asthma? Biological plausibility and evidence; a review. Respirology 2012, 17, 887–898. [Google Scholar] [CrossRef] [PubMed] [Green Version]
  13. Muñoz, X.; Barreiro, E.; Bustamante, V.; Lopez-Campos, J.L.; González-Barcala, F.J.; Cruz, M.J. Diesel exhausts particles: Their role in increasing the incidence of asthma. Reviewing the evidence of a causal link. Sci. Total Environ. 2019, 652, 1129–1138. [Google Scholar] [CrossRef]
  14. Health Effects Institute. HEI Special Report 17: Traffic-Related Air Pollution: A Critical Review of the Literature on Emissions, Exposure, and Health Effects; Health Effects Institute: Boston, MA, USA, 2010. [Google Scholar]
  15. Graziella Favarato, H.; Anderson, R.; Atkinson, R.; Fuller, G.; Mills, I.; Walton, H. Traffic-related pollution and asthma prevalence in children. Quantification of associations with nitrogen dioxide. Air Qual. Atmos. Health 2014, 7, 459–466. [Google Scholar] [CrossRef] [PubMed] [Green Version]
  16. Citerne, A.; Roda, C.; Viola, M.; Rancière, F.; Momas, I. Early postnatal exposure to traffic-related air pollution and asthma in adolescents: Vulnerability factors in the PARIS birth cohort. Environ. Res. 2021, 201, 111473. [Google Scholar] [CrossRef]
  17. Pennington, A.F.; Strickland, M.J.; Klein, M.; Zhai, X.; Bates, J.T.; Drews-Botsch, C.; Hansen, C.; Russell, A.G.; Tolbert, P.E.; Darrow, L.A. Exposure to mobile source air pollution in early life and childhood asthma incidence: The Kaiser Air Pollution and Pediatric Asthma Study. Epidemiology 2018, 29, 22. [Google Scholar] [CrossRef] [PubMed]
  18. Fuertes, E.; Sunyer, J.; Gehring, U.; Porta, D.; Forastiere, F.; Cesaroni, G.; Vrijheid, M.; Guxens, M.; Annesi-Maesano, I.; Slama, R.; et al. Associations between air pollution and pediatric eczema, rhinoconjunctivitis and asthma: A meta-analysis of European birth cohorts. Environ. Int. 2020, 136, 105474. [Google Scholar] [CrossRef]
  19. Khare, M. (Ed.) Air Pollution: Monitoring, Modelling and Health; BoD–Books on Demand; Intechopen: London, UK, 2021; pp. 347–348. [Google Scholar]
  20. Almqvist, C.; Worm, M.; Leynaert, B.; Working Group of GA2LEN WP 2.5 ‘Gender’. Impact of gender on asthma in childhood and adolescence: A GA2LEN review. Allergy 2008, 63, 47–57. [Google Scholar] [CrossRef]
  21. Hassoun, Y.; James, C.; Bernstein, D.I. The Effects of Air Pollution on the Development of Atopic Disease. Clin. Rev. Allergy Immunol. 2019, 57, 4013–4014. [Google Scholar] [CrossRef] [PubMed]
  22. Kelly, F.J.; Fussell, J.C. Air pollution and airway disease. Clin. Exp. Allergy 2006, 41, 1056–1071. [Google Scholar] [CrossRef]
  23. Deng, Q.; Lu, C.; Yu, Y.; Li, Y.; Sundell, J.; Norback, D. Early life exposure to traffic-related air pollution and allergic rhinitis in preschool children. Respir. Med. 2016, 121, 67–73. [Google Scholar] [CrossRef] [PubMed] [Green Version]
  24. Burte, E.; Leynaert, B.; Bono, R.; Brunekreef, B.; Bousquet, J.; Carsin, A.-E.; De Hoogh, K.; Forsberg, B.; Gormand, F.; Heinrich, J.; et al. Association between air pollution and rhinitis incidence in two European cohorts. Environ. Int. 2018, 115, 257–266. [Google Scholar] [CrossRef] [Green Version]
  25. Hwang, B.F.; Jaakkola, J.J.; Lee, Y.L.; Lin, Y.C.; Guo, Y.L. Relation between air pollution and allergic rhinitis in Taiwanese schoolchildren. Respir. Res. 2006, 7, 1–7. [Google Scholar] [CrossRef] [PubMed] [Green Version]
  26. Ahn, K. The role of air pollutants in atopic dermatitis. J. Allergy Clin. Immunol. 2014, 134, 993–999. [Google Scholar] [CrossRef] [PubMed]
  27. Huang, C.; Wen, H.; Chen, P.; Chiang, T.; Lin, S.; Guo, Y. Prenatal air pollutant exposure and occurrence of atopic dermatitis. Br. J. Dermatol. 2015, 173, 981–988. [Google Scholar] [CrossRef]
  28. Krämer, U.; Sugiri, D.; Ranft, U.; Krutmann, J.; von Berg, A.; Berdel, D.; Behrendt, H.; Kuhlbusch, T.; Hochadel, M.; Wichmann, H.E.; et al. Eczema, respiratory allergies, and traffic-related air pollution in birth cohorts from small-town areas. J. Dermatol. Sci. 2009, 56, 99–105. [Google Scholar] [CrossRef]
  29. Hüls, A.; Abramson, M.J.; Sugiri, D.; Fuks, K.; Krämer, U.; Krutmann, J.; Schikowski, T. Nonatopic eczema in elderly women: Effect of air pollution and genes. J. Allergy Clin. Immunol. 2019, 143, 378–385. [Google Scholar] [CrossRef] [PubMed] [Green Version]
  30. Twig, G.; Yaniv, G.; Levine, H.; Leiba, A.; Goldberger, N.; Derazne, E.; Ben-Ami Shor, D.; Tzur, D.; Afek, A.; Shamiss, A.; et al. Body-mass index in 2.3 million adolescents and cardiovascular death in adulthood. N. Engl. J. Med. 2016, 374, 2430–2440. [Google Scholar] [CrossRef] [PubMed]
  31. Levy, I.; Levin, N.; Schwartz, J.D.; Kark, J.D. Back-extrapolating a land use regression model for estimating past exposures to traffic-related air pollution. Environ. Sci. Technol. 2015, 49, 3603–3610. [Google Scholar] [CrossRef] [PubMed] [Green Version]
  32. Cohen, G.; Levy, I.; Yuval Kark, J.D.; Levin, N.; Broday, D.M.; Steinberg, D.M.; Gerber, Y. Long-term exposure to traffic-related air pollution and cancer among survivors of myocardial infarction: A 20-year follow-up study. Eur. J. Prev. Cardiol. 2017, 24, 92–102. [Google Scholar] [CrossRef] [PubMed]
  33. Central Bureau of Statistics. Statistical Abstract of Israel, no.46; CBS: Jerusalem, Israel, 2018. [Google Scholar]
  34. Chen, S.; Broday, D.M. A new modeling approach for assessing the contribution of industrial and traffic emissions to ambient NOx concentrations. Atmos. Environ. 2018, 173, 173–184. [Google Scholar] [CrossRef]
  35. Esposito, S.; Tenconi, R.; Lelii, M.; Preti, V.; Nazzari, E.; Consolo, S.; Patria, M.F. Possible molecular mechanisms linking air pollution and asthma in children. BMC Pulm. Med. 2014, 14, 1–8. [Google Scholar] [CrossRef] [Green Version]
  36. Melén, E.; Standl, M.; Gehring, U.; Altug, H.; Antó, J.M.; Berdel, D.; Bergström, A.; Bousquet, J.; Heinrich, J.; Koppelman, G.H.; et al. Air pollution and IgE sensitization in 4 European birth cohorts—the MeDALL project. J. Allergy Clin. Immunol. 2021, 147, 713–722. [Google Scholar] [CrossRef]
  37. Havet, A.; Li, Z.; Zerimech, F.; Sanchez, M.; Siroux, V.; Le Moual, N.; Brunekreef, B.; Künzli, N.; Jacquemin, B.; Varraso, R.; et al. Does the oxidative stress play a role in the associations between outdoor air pollution and persistent asthma in adults? Findings from the EGEA study. Environ. Health 2019, 18, 1–9. [Google Scholar] [CrossRef] [Green Version]
  38. Rouadi, P.W.; Idriss, S.A.; Naclerio, R.M.; Peden, D.B.; Ansotegui, I.J.; Canonica, G.W.; Gonzalez-Diaz, S.N.; Rosario Filho, N.A.; Ivancevich, J.C.; Hellings, P.W.; et al. Immunopathological features of air pollution and its impact on inflammatory airway diseases (IAD). World Allergy Organ. J. 2020, 13, 100467. [Google Scholar] [CrossRef]
  39. Pawankar, R.; Canonica, G.W.; Holgate, S.T.; Lockey, R.F.; World Allergy Organization. White Book on Allergy 2011–2012 Executive Summary. Available online: http://www.worldallergy.org/UserFiles/file/WAO-White-Book-on-Allergy_web.pdf (accessed on 11 February 2018).
  40. Leynaert, B.; Neukirch, F.; Demoly, P.; Bousquet, J. Epidemiologic evidence for asthma and rhinitis co-morbidity. J. Allergy Clin. Immunol. 2000, 106, S201–S205. [Google Scholar] [CrossRef] [PubMed]
  41. Egan, M.; Bunyavanich, S. Allergic rhinitis: The “Ghost Diagnosis” in patients with asthma. Asthma Res. Pract. 2015, 1, 8. [Google Scholar] [CrossRef] [Green Version]
  42. Pinart, M.; Benet, M.; Annesi-Maesano, I.; von Berg, A.; Berdel, D.; Carlsen, K.C.L.; Carlsen, K.-H.; Bindslev-Jensen, C.; Eller, E.; Fantini, M.P.; et al. Co-morbidity of eczema, rhinitis, and asthma in IgE-sensitised and non-IgE-sensitised children in MeDALL: A population-based cohort study. Lancet Respir. Med. 2014, 2, 131–140. [Google Scholar] [CrossRef] [Green Version]
  43. Bousquet, J.; Khaltaev, N.; Cruz, A.A.; Denburg, J.; Fokkens, W.J.; Togias, A.; Zuberbier, T.; Baena-Cagnani, C.E.; Canonica, G.W.; van Weel, C.; et al. Allergic rhinitis and its impact on asthma (ARIA) 2008. Allergy 2008, 63, 8–160. [Google Scholar] [CrossRef]
  44. Tohidinik, H.R.; Mallah, N.; Takkouche, B. History of allergic rhinitis and risk of asthma; a systematic review and meta-analysis. World Allergy Organ. J. 2019, 12, 100069. [Google Scholar] [CrossRef] [PubMed] [Green Version]
  45. Fu, L.; Freishtat, R.; Gordish-Dressman, H.; Teach, S.J.; Resca, L.; Hoffman, E.; Wang, Z. Natural progression of childhood asthma symptoms and strong influence of sex and puberty. Ann. Am. Thorac. Soc. 2014, 11, 939–944. [Google Scholar] [CrossRef]
  46. Basagaña, X.; Sunyer, J.; Kogevinas, M.; Zock, J.-P.; Duran-Tauleria, E.; Jarvis, D.; Burney, P.; Anto, J.M. Socioeconomic status and asthma prevalence in young adults: The European Community Respiratory Health Survey. Am. J. Epidemiol. 2004, 160, 178–188. [Google Scholar] [CrossRef] [PubMed] [Green Version]
  47. Kozyrskyj, A.L.; Kendall, G.E.; Jacoby, P.; Sly, P.D.; Zubrick, S.R. Association between socioeconomic status and the development of asthma: Analyses of income trajectories. Am. J. Public Health 2010, 100, 540–546. [Google Scholar] [CrossRef] [PubMed]
  48. Almqvist, C.; Pershagen, G.; Wickman, M. Low socioeconomic status as a risk factor for asthma, rhinitis and sensitization at 4 years in a birth cohort. Clin. Exp. Allergy 2005, 35, 612–618. [Google Scholar] [CrossRef]
  49. Fernández, L.C.; Alvarez, R.F.; González-Barcala, F.J.; Portal, J.A. Indoor air contaminants and their impact on respiratory pathologies. Arch. Bronconeumol. Engl. Ed. 2013, 49, 22–27. [Google Scholar] [CrossRef]
  50. US Department of Health and Human Services. The Health Consequences of Involuntary Exposure to Tobacco Smoke: A Report of the Surgeon General—Executive Summary; US Department of Health and Human Services, Centers for Disease Control and Prevention, Coordinating Center for Health Promotion, National Center for Chronic Disease Prevention and Health Promotion, Office on Smoking and Health: Atlanta, GA, USA, 2006; pp. 1–27.
  51. Garrett, B.E.; Martell, B.N.; Caraballo, R.S.; King, B.A. Socioeconomic Differences in Cigarette Smoking among Sociodemographic Groups. Prev. Chronic Dis. 2019, 16, E74. [Google Scholar] [CrossRef] [Green Version]
  52. Burbank, P.J. Effect of smoking on symptoms of allergic rhinitis. Ann. Allergy Asthma Immunol. 2009, 103, 195–200. [Google Scholar]
  53. Comberiati, P.; Di Cicco, M.E.; D’Elios, S.; Peroni, D.G. How much asthma is atopic in children? Front. Pediatrics 2017, 5, 122. [Google Scholar] [CrossRef]
  54. Akar-Ghibril, N.; Casale, T.; Custovic, A.; Phipatanakul, W. Allergic endotypes and phenotypes of asthma. J. Allergy Clin. Immunol. Pract. 2020, 8, 429–440. [Google Scholar] [CrossRef]
Figure 1. Crude prevalence and 95% confidence intervals for asthma, allergic rhinitis, rhino-conjunctivitis, and atopic dermatitis by NOx exposure quintiles for the study population. 1 = lowest NOx exposure category (< 5.63 ppb), 2 = (5.63–10.5 ppb), 3 = (10.5–14.7 ppb), 4 = (14.7–19.1 ppb) and 5 = (19.1–130 ppb).
Environments 08 00110 g001
Figure 2. Odds ratios and 95% confidence intervals for exposure to NOx and atopic diseases, adjusted for year of birth, census SES, and school religious orientation. n = 2,311,240, n cases: asthma 140,166; allergic rhinitis 109,807; asthma with comorbid allergic rhinitis 37,311; rhino-conjunctivitis 9,452; atopic dermatitis 11,415. 1 = lowest NOx exposure category (<5.63 ppb), 2 = (5.63–10.5 ppb), 3 = (10.5–14.7 ppb), 4 = (14.7–19.1 ppb) and 5 = >19.1 ppb).
Environments 08 00110 g002
Figure 3. Odds ratios and 95% confidence intervals for exposure to NOx and asthma, stratified by the decade of birth and adjusted for census SES, and school religious orientation. 1959–1947: n = 280,140, cases = 6,002; 1960–1979: n = 910,203, cases = 48,555; 1980–1989: n = 483,787, cases = 41,560; 1990–2001: n = 582,574, cases = 39,789. Exposure categories: 1947–1959: 1 < 2.55 ppb, 2 = (2.55–3.1 ppb), 3 = (3.1–3.67 ppb), 4 = (3.67–4.51 ppb) and 5 = (4.51–21.7 ppb). Exposure categories: 1960–1979: 1 < 5.34 ppb, 2 = (5.34–7.32 ppb), 3 = (7.32–9.58 ppb), 4 = (9.58–12.7 ppb) and 5 = (12.7–81.4 ppb). Exposure categories: 1980–1989: 1 < 13.2 ppb, 2 = (13.2–15.6 ppb), 3 = (15.6–17.9 ppb), 4 = (17.9–21.8 ppb) and 5 = (21.8–128.0 ppb). Exposure categories: 1990–2001: 1 < 14.3 ppb, 2 = (14.3–16.7 ppb), 3 = (16.7–19.1 ppb), 4 = (19.1–22.9 ppb) and 5 = (22.9–130.0 ppb).
Environments 08 00110 g003
Figure 4. Odds radios and 95% confidence intervals of effect modification by sex for the association between NOx and asthma, allergic rhinitis and their co-morbidity, adjusted for year of birth, census SES, and school religious orientation. Females: n = 945,942, cases: asthma-47,962, allergic rhinitis-38,274, co-occurrence (asthma and allergic rhinitis)-12,101. Males: n = 1,365,298, cases: asthma-92,204, allergic rhinitis-71,533, co-occurrence (asthma and allergic rhinitis)-25,210. 1 = lowest NOx exposure category (< 5.63 ppb), 2 = (5.63–10.5 ppb), 3 = (10.5–14.7 ppb), 4 = (14.7–19.1 ppb) and 5 = (19.1–130 ppb).
Environments 08 00110 g004
Figure 5. Odds radios and 95% confidence intervals of effect modification by SES for the association between NOx and asthma, adjusted for year of birth and school religious orientation. Higher scores in the census SES index represent higher socioeconomic status. SES 1: n = 471,201, cases = 20,899; SES 2: n = 444,992, cases = 25,514; SES 3: n = 459,409, cases = 29,906; SES 4: n = 464,322, cases = 30,643; SES 5: n = 471,316, cases = 33,204. 1 = lowest NOx exposure category (<5.63 ppb), 2 = (5.63–10.5 ppb), 3 = (10.5–14.7 ppb), 4 = (14.7–19.1 ppb) and 5 = (19.1–130 ppb).
Environments 08 00110 g005
Table 1. Characteristics of the Population, Israel, 1967–2017.
Characteristicn (%)
Male sex1,492,361 (59.0)
Year of birth
1947–194911,283 (<1.0)
1950–1959309,236 (12.0)
1960–1969391,228 (15.0)
1970–1979563,971 (22.0)
1980–1989574,040 (23.0)
1990–1999619,558 (24.0)
2000–200154,429 (2.0)
Age at evaluation
16 yrs.78,672 (3.1)
17 yrs.1,661,356 (65.8)
18 yrs.709,430 (28.1)
19 yrs.60,220 (2.3)
20 yrs.14,067 (0.6)
School Religious Orientation
Secular 1,903,096 (75.0)
Religious206,645 (8.3)
Ultra-orthodox44,735 (1.8)
Missing366,269 (14.5)
BMI (kg/m2)
Underweight (<18.5)328,508(13.0)
Normal [18.5–25)1,750,191(69.3)
Overweight [25–30)279,283(11.1)
Obese (>30)85,259 (3.4)
Missing80,504(3.2)
SES quintile
1482,540 (19.1)
2481,556 (19.1)
3478,686 (19.0)
4478,570 (18.9)
5481,542 (19.1)
Missing120,851 (4.8)
Prevalence of Atopic Disorders
Asthma149,109 (5.9)
Allergic Rhinitis116,229 (4.6)
Rhino-conjunctivitis10,126 (0.4)
Atopic Dermatitis12,506 (0.5)
Asthma + Rhinitis39,168 (1.5)
Publisher’s Note: MDPI stays neutral with regard to jurisdictional claims in published maps and institutional affiliations.

