
Leaching Potential of Phosphite Fertilizer in Sandy Soils of the Southern Coastal Plain, USA


United States Department of Agriculture, Agricultural Research Service, Coastal Plain, Soil, Water and Plant Research Center, 2611 W. Lucas Street, Florence, SC 29501, USA
*
Author to whom correspondence should be addressed.
Environments 2021, 8(11), 126; https://0-doi-org.brum.beds.ac.uk/10.3390/environments8110126
Submission received: 29 September 2021
/
Revised: 11 November 2021
/
Accepted: 12 November 2021
/
Published: 16 November 2021
(This article belongs to the Special Issue Feature Papers in Environments in 2021)
Abstract
:Novel biotechnology on transgenic plants capable of metabolizing phosphite (Phi), a reduced form of P, could improve the effectiveness of P fertilizers and reduce the P footprint in agriculture with the benefit of suppressing weed growth. However, potassium Phi (K-Phi) salts used as fertilizer are highly soluble in water. At the same time, sandy soils of the Southern Coastal Plain are vulnerable to leaching losses resulting from long-term Pi fertilizer application. We performed a replicated leaching trial using five soil materials that included three surface and two subsurface layers from cultivated topsoil (Ap horizon) with contrasting Phi and Pi sorption capacities. Each soil received three treatments K-Phi at rates 0 (control), 24, and 49 kg P ha−1 and leached twice with de-ionized water. All K-Phi-treated soils leached Phi except for the controls. A phosphorus saturation ratio (PSR) calculated from P, Al, and Fe in acid extracts indicated increasing environmental risk of Phi leaching in soils with lower Phi and Pi sorption capacities at rising rates of applied K-Phi. Because plants rapidly absorb Phi, further studies on the environmental impact of K-Phi fertilizer use should include the interaction of plants with soil properties and soil microbial activity at optimal Phi application rates for growing transgenic plants able to use Phi as a nutrient source.
1. Introduction
For sustainable food production, nutrients removed by crops need replacement in sufficient amounts to prevent nutrient deficiencies in the next crop season. Plants require phosphorus (P), an essential nutrient, in large amounts to avoid crop yield failure. High application of P fertilizers above crop requirements usually occurs in P-fixing soils to provide sufficient plant-available P [1]. Although soils have a high capacity to retain P, continued application of P fertilizers could eventually exceed the plant and soil assimilative capacities, resulting in the loss of P from soil to water bodies through runoff or leaching [2,3]. In turn, global demand for P fertilizers in intensive agriculture due to a growing population leads to the depletion of finite reserves of rock phosphate to produce inorganic P fertilizers [4]. Therefore, improving P use efficiency (PUE) could help ensure global food security by slowing the exhaustion of rock phosphate resources and reducing P’s negative impact on the environment [5]. Among various emerging approaches to improve PUE, transgenic plants capable of metabolizing phosphite (Phi) could help reduce the P footprint in agriculture [5,6,7]. Nevertheless, the environmental impact of intensive use of Phi fertilizer for the production of these novel transgenic crops is still unclear.
Phosphites (Phi) are alkali metal salts of phosphorous acid (H3PO3), a reduced form of P, widely used as fungicides in agriculture [8,9]. The most common form of Phi in fungicide or fertilizer products is potassium phosphite (K-Phi), commercially available in liquid formulations [10]. K-Phi as a P fertilizer source is harmful to P-starved plants and suppresses plant growth because of its nutritional ineffectiveness as a P source [11,12]. Nevertheless, transgenic plants expressing the bacterial-derived phosphite dehydrogenase (ptxD) gene can catalyze the oxidation of Phi into orthophosphate P (PO43−–P), hereafter called Pi [13]. For that reason, ptxD-transgenic cotton (Gossypium hirsutum L.), corn (Zea mays L.), and soybean (Glycine max (L.) Merr.) plants can select Phi over Pi as a P fertilizer source. Therefore, transgenic plants may require 30 to 50% less P to attain similar productivity than non-transgenic ones using Pi fertilizer [6]. Besides reducing the P footprint for crop production and possibly improving PUE, Phi application to plants expressing the ptxD gene can have the additional benefit of suppressing the growth of weeds [5,14].
The successful production of ptxD-transgenic crops in the Southern Coastal Plain will require soils with low concentrations of plant-available Pi for the unhindered growth of crop plants, such as cotton expressing the ptxD gene, and simultaneous weed growth suppression due to Pi starvation [15]. Still, K-Phi fertilizer applications could lead to an undesirable buildup of soil Pi because of soil microbial oxidation of Phi into Pi [16,17].
Aside from plant genetics, environmental factors such as temperature, rainfall timing, intensity and amount, and interactions of temperature and rainfall, management factors such as timing and placement, tillage, and soil type can lead to significant losses of soluble fertilizers from the root zone and subsequent water pollution [18,19]. A conventional soil Pi test can determine if the soil has low Pi before planting ptxD-transgenic crop plants. However, the additional chemical analysis of Phi in soils can help assess Phi’s impact on potential runoff and leaching due to the higher water solubilities and higher content of P in Phi fertilizers than traditional Pi [10,20]. Studies comparing Pi and Phi soil applications reported that Phi binds less strongly to soils with slower removal than Pi [21,22]. Although the slow Phi removal would imply the use of less total P relative to Pi-fertilizer systems for equivalent crop production, it also suggests greater mobility of applied Phi reaching roots in deeper soil layers but increasing the risk of Phi loss by leaching [10,21,22]. Our investigation had the objective of assessing the potential environmental consequences of using K-Phi as a source of P fertilizer for ptxD-transgenic crops in sandy soils of the Southern Coastal Plain region. We excluded the use of plants in this study because of K-Phi’s complex mode of action in soils due to its high solubility, rapid plant tissue absorption of Phi and Pi by the same Pi transporters, and systemic translocation through the xylem and phloem to all areas of the plant [8,14]. Because the success of the ptxD-transgenic crop technology for weed suppression hinges on the low content of plant available Pi in soils, we focused our investigation on evaluating the potential short-term loss of K-Phi in sandy soils attributable to soil leaching immediately after Phi application to soils.
2. Materials and Methods
2.1. Soil Properties
The Southern Coastal Plain physiographic region covers a large area formed from marine sediments, including Virginia, North Carolina, South Carolina, Georgia, Florida, Alabama, Mississippi, and Louisiana. Cash crops such as cotton, soybean, corn, and peanuts are produced throughout the Southern Coastal Plain region, in soils mainly classified as Ultisols [23]. The Ultisols are naturally acidic and low in soil organic carbon (C), with surface soil textures ranging from loam to loamy sands with cation exchange capacities (CEC) of less than 9 cmol kg−1 [24]. For this study, we selected the following three Ultisols for our investigation: Dothan (fine-loamy, kaolinitic, thermic Plinthic Kandiudults) obtained from a cotton field in Dooly County, GA (32°08′ N, 83°41′ W), while the Norfolk (fine-loamy, kaolinitic, thermic Typic Kandiudults), and Uchee (loamy, kaolinitic, thermic Arenic Kanhapludults) were obtained at the Pee Dee Research and Education Center, Clemson University, Florence County, SC (34°18′ N, 79°44′ W).
The Dothan soil included the surface (0–15 cm depth) and the subsurface (15–30 cm depth) soil layers from the Ap horizon. The Norfolk soil included only the surface soil (0–15 cm) collected from the Ap horizon. The Uchee soil included the surface (0–15 cm depth) and the subsurface (15–30 cm depth) soil layers collected from the Ap and E horizons. Hereafter, we refer to the Dothan surface soil as Dt_a, the Dothan subsurface soil as Dt_b, the Norfolk surface soil as Nf_a, the Uchee surface soil as Uc_a, and the Uchee subsurface soil as Uc_b (Table 1). We air-dried the soils and passed them through a 2-mm sieve before performing physicochemical analyses. The soil texture was determined by the micro-pipette method [25]. The soil C was determined by dry combustion (CNS Analyzer, Elementar Americas, Ronkoma, NY, USA). The soil pH was measured using a glass pH electrode in a 1:1 ratio soil/water mixture. The CEC was determined by the neutral ammonium acetate method. The soil Pi, Ca, and Mg content was determined in Mehlich 1 extracts at the Clemson University, Agricultural Service Laboratory, Clemson, SC (http://www.clemson.edu/agsrvlb (accessed on 15 November 2021)).
The Pi and Phi sorption of the five soil materials was determined through the single-point adsorption isotherm method [26] further adapted to Phi. Duplicate samples of 1.0 g of soil were placed in 50-mL centrifuge tubes with 25 mL 0.01 M CaCl2 and the necessary amount of Phi to provide a load of 250 mg Phi kg−1. Samples were shaken for 24 h, centrifuged at 3000 rpm for 10 min. The decanted supernatant was filtered with a 0.2-µm pore filter and analyzed for Phi. The difference between initial Phi concentration and what was left in solution after 24 h was considered sorbed to the soil. Soil clay fractions were analyzed by X-ray diffraction (XRD) (Department of Soil and Crop Sciences, Texas A&M University, College Station, TX, USA) for clay mineral identification [27]. The identified minerals included kaolinite, gibbsite, and goethite in the three soil materials. We confirmed these minerals’ presence through thermo-gravimetric analysis (TGA) of the same clay fractions [28].
2.2. Experimental
We performed a leaching experiment with the five soil materials presented in Table 1. Each soil received three treatments: Phi application rates of 0, 14.6, 29.2 mg Phi per pot (0, 24, and 49 kg P ha−1) using liquid K-Phi Ele-Max Fertilizer 0-28-26 (Helena Agri-Enterprises LLC, Collierville, TN, USA). The Phi application rates of 25 and 49 kg ha−1 (based on the surface area of the top of the pots) were equivalent to Pi requirements of dryland cotton production with medium and low soil Pi contents according to Clemson University Soil Testing recommendations (http://www.clemson.edu/agsrvlb (accessed on 15 November 2021)). Each treatment had three replicates. We conducted the soil leaching in open-top flowerpots (10.3-cm diam. and 8.5-cm tall) with six drainage holes (5-mm diam.) containing about 500 g of air-dry soil per pot. The soil bulk densities in g cm−3 for each soil material were 1.18, 1.28, 1.27, 1.33, and 1.42 for the Dt_a, Dt_b, Nf_a, Uc_a), and Uc_b, respectively. A nylon mesh fabric covered the pot’s drainage holes to retain the soil inside the pots. The K-Phi treatments were applied in equal volumes of 50-mL de-ionized (DI) water to each pot, letting the K-Phi react with the soil overnight. The day after the K-Phi application, we added a volume of 200 mL of DI water to each pot, which is equivalent to about a 3.5-cm rainfall. Plastic containers placed under the pots collected the leachates to measure the volume of water leached and sampling for Phi and Pi analysis. Three days later, we leached the pots again with another 200 mL of DI water and repeated the measurement of leached volume and water sampling. At the end of the experiment, the soils were sampled and air-dried before Phi and Pi extraction and analysis. The soils were extracted with the DI water (DW) and the Mehlich 1 (0.5 M HCl + 0.0125 M H2SO4) extraction procedures according to Self-Davis et al. [29] and Sims [30]. All water samples, soils extracts, and analytical standards were filtered with 0.2-µm polyethersulfone (PES) filters and stored at 4 °C before analysis.
2.3. Analytical Methods
Water samples and soil extractions were analyzed for Phi and Pi by chemically suppressed ion chromatography (IC) using a Dionex ICS-2000 (Thermo Fisher Scientific, Waltham, MA, USA) with KOH as the eluent. The IC system included an AS-17-C analytical column, an AG17-C guard column [31], and a Dionex IonPac ATC-3 trap column to remove carbonate from the eluent, preventing spurious peaks and minimizing baseline shifts during gradient operation [32]. The IC calibrating standards were prepared from a multi-element custom stock standard of 100 mg L−1 of F, Cl, NO3–N, NO2–N, Pi, and SO4–S (Inorganic Ventures, Christiansburg, VA, USA) and a 100 mg Phi L−1 solution made of sodium Phi dibasic pentahydrate [Na2H(PO3) * 5H2O], 98% (Acros Organics, NJ, USA). We prepared the 100 mg Phi L−1 stock solution by adding 0.6974 g of salt to 1.000 L of DW water and confirmed the total P concentration of the stock Phi solution was equivalent to 100 mg Phi L−1 by inductively coupled plasma–atomic emission spectrometry (ICP). The combined stock solutions were used to create IC calibration curves ranging from 0.2 to 20 mg L−1 of each analyte. The detection limit of the method for Phi was 0.05 mg L−1.
We evaluated the IC method for possible interferences of soil constituents in the soil extracts for analytical quality assurance. First, we compared the Pi analysis data of Mehlich 1 soil extracts obtained by IC to data from a routine colorimetric method [33]. We found that the IC analysis Pi data had a high linear correlation with the colorimetric Pi analysis data (IC-Pi = 1.08*Colorimetric-Pi + 0.48; R2 = 0.986, n = 180). Therefore, we deemed the IC suitable for the analysis of Pi in Mehlich 1 soil extracts. Second, we conducted a spike recovery of Phi in DW and Mehlich 1 soil extracts. Soil extracts samples (n = 60) were spiked with 5 mg Phi L−1 and re-analyzed to evaluate the percent recovery of the IC analysis method in DW and Mehlich 1 extracts (Table 2). The high recovery rates for DW (>97%) and Mehlich 1 (>93%) indicated that the IC method did not have significant interferences of other anions for the determination of Phi in the soil extracts from our study.
The cumulative Phi soil loss in the leaching trials expressed in percentage to the initial total K-Phi fertilizer applied to each soil on a mass basis (LM) was estimated as follows:
where Vol = volume of leachate (L) and C = Phi concentration in the leachate (mg L−1) and M0 = initial mass of Phi applied per pot (mg). Because of the negligible concentration of organic P, the sum of Phi and Pi concentrations determined by the IC method obtained in the leachates were called dissolved leached phosphorus (DLP) and water-soluble phosphorus (WSP) from the DW soil extractions. Additionally, the soil Mehlich 1 (M1) extracts were analyzed by ICP to determine P, Al, and Fe. Although the ICP method does not discriminate between Phi and Pi-P forms, the ICP analysis data were used to estimate the phosphorus saturation ratio (PSR) to predict P losses in water leaching [34,35] at increasing Phi application rates:
Phi Leached % = [(Vol1 × C1) + (Vol2 × C2)/M0] × 100
2.4. Statistical Analysis
The leaching experiment was analyzed as a completely randomized design (CRD) using SAS 9.4 (SAS Institute, Cary, NC, USA). Repeated measures analyses were conducted to assess time series data collected from the same pot using the GLIMMIX procedure with a heterogeneous autoregressive covariance structure. The following model was used to determine treatment effects of leaching, soil type, and rate of application on the amount of Phi leached:
where Y = Phi leached, µ = mean, E = leaching, B = replication, S = soil type, R = rate of application, and ε = experimental error, along with their accompanying interactions. Leaching, soil type, and rate of application were treated as fixed effects, while replication and the leaching × replication interaction were treated as random effects.
Yijkl = µ + Ei + Bj + Sk + ESik + Rl + ERil + SRkl +ESRikl +ε(ijkl)
The following model was used to determine the effects of soil type and rate of application on the cumulative Phi leached using GLIMMIX, but it was not analyzed using repeated measures:
where Y = percent total Phi leached, µ = mean, B = replication, S = soil type, R = rate of application, and ε = experimental error, along with their accompanying interactions. Soil type and rate of application were fixed effects, while replication was a random effect. The REG procedure in SAS 9.4 was used to conduct linear regression analyses of the pooled data of the five soils for the relationship between WSP and PSR. An analysis of variance (ANOVA) was first conducted to determine significant interactions at a probability (P) level of α = 0.05. Interactions were then partitioned to evaluate the changes in Phi or Pi for each soil type over time. Mean separation was determined by the standard error of the mean (SEM) among treatments using the PDIFF/Lines option within GLIMMIX.
Yijk = µ + Bi + Sj + Rk + SRjk +εijk
3. Results
3.1. Phosphite Leached
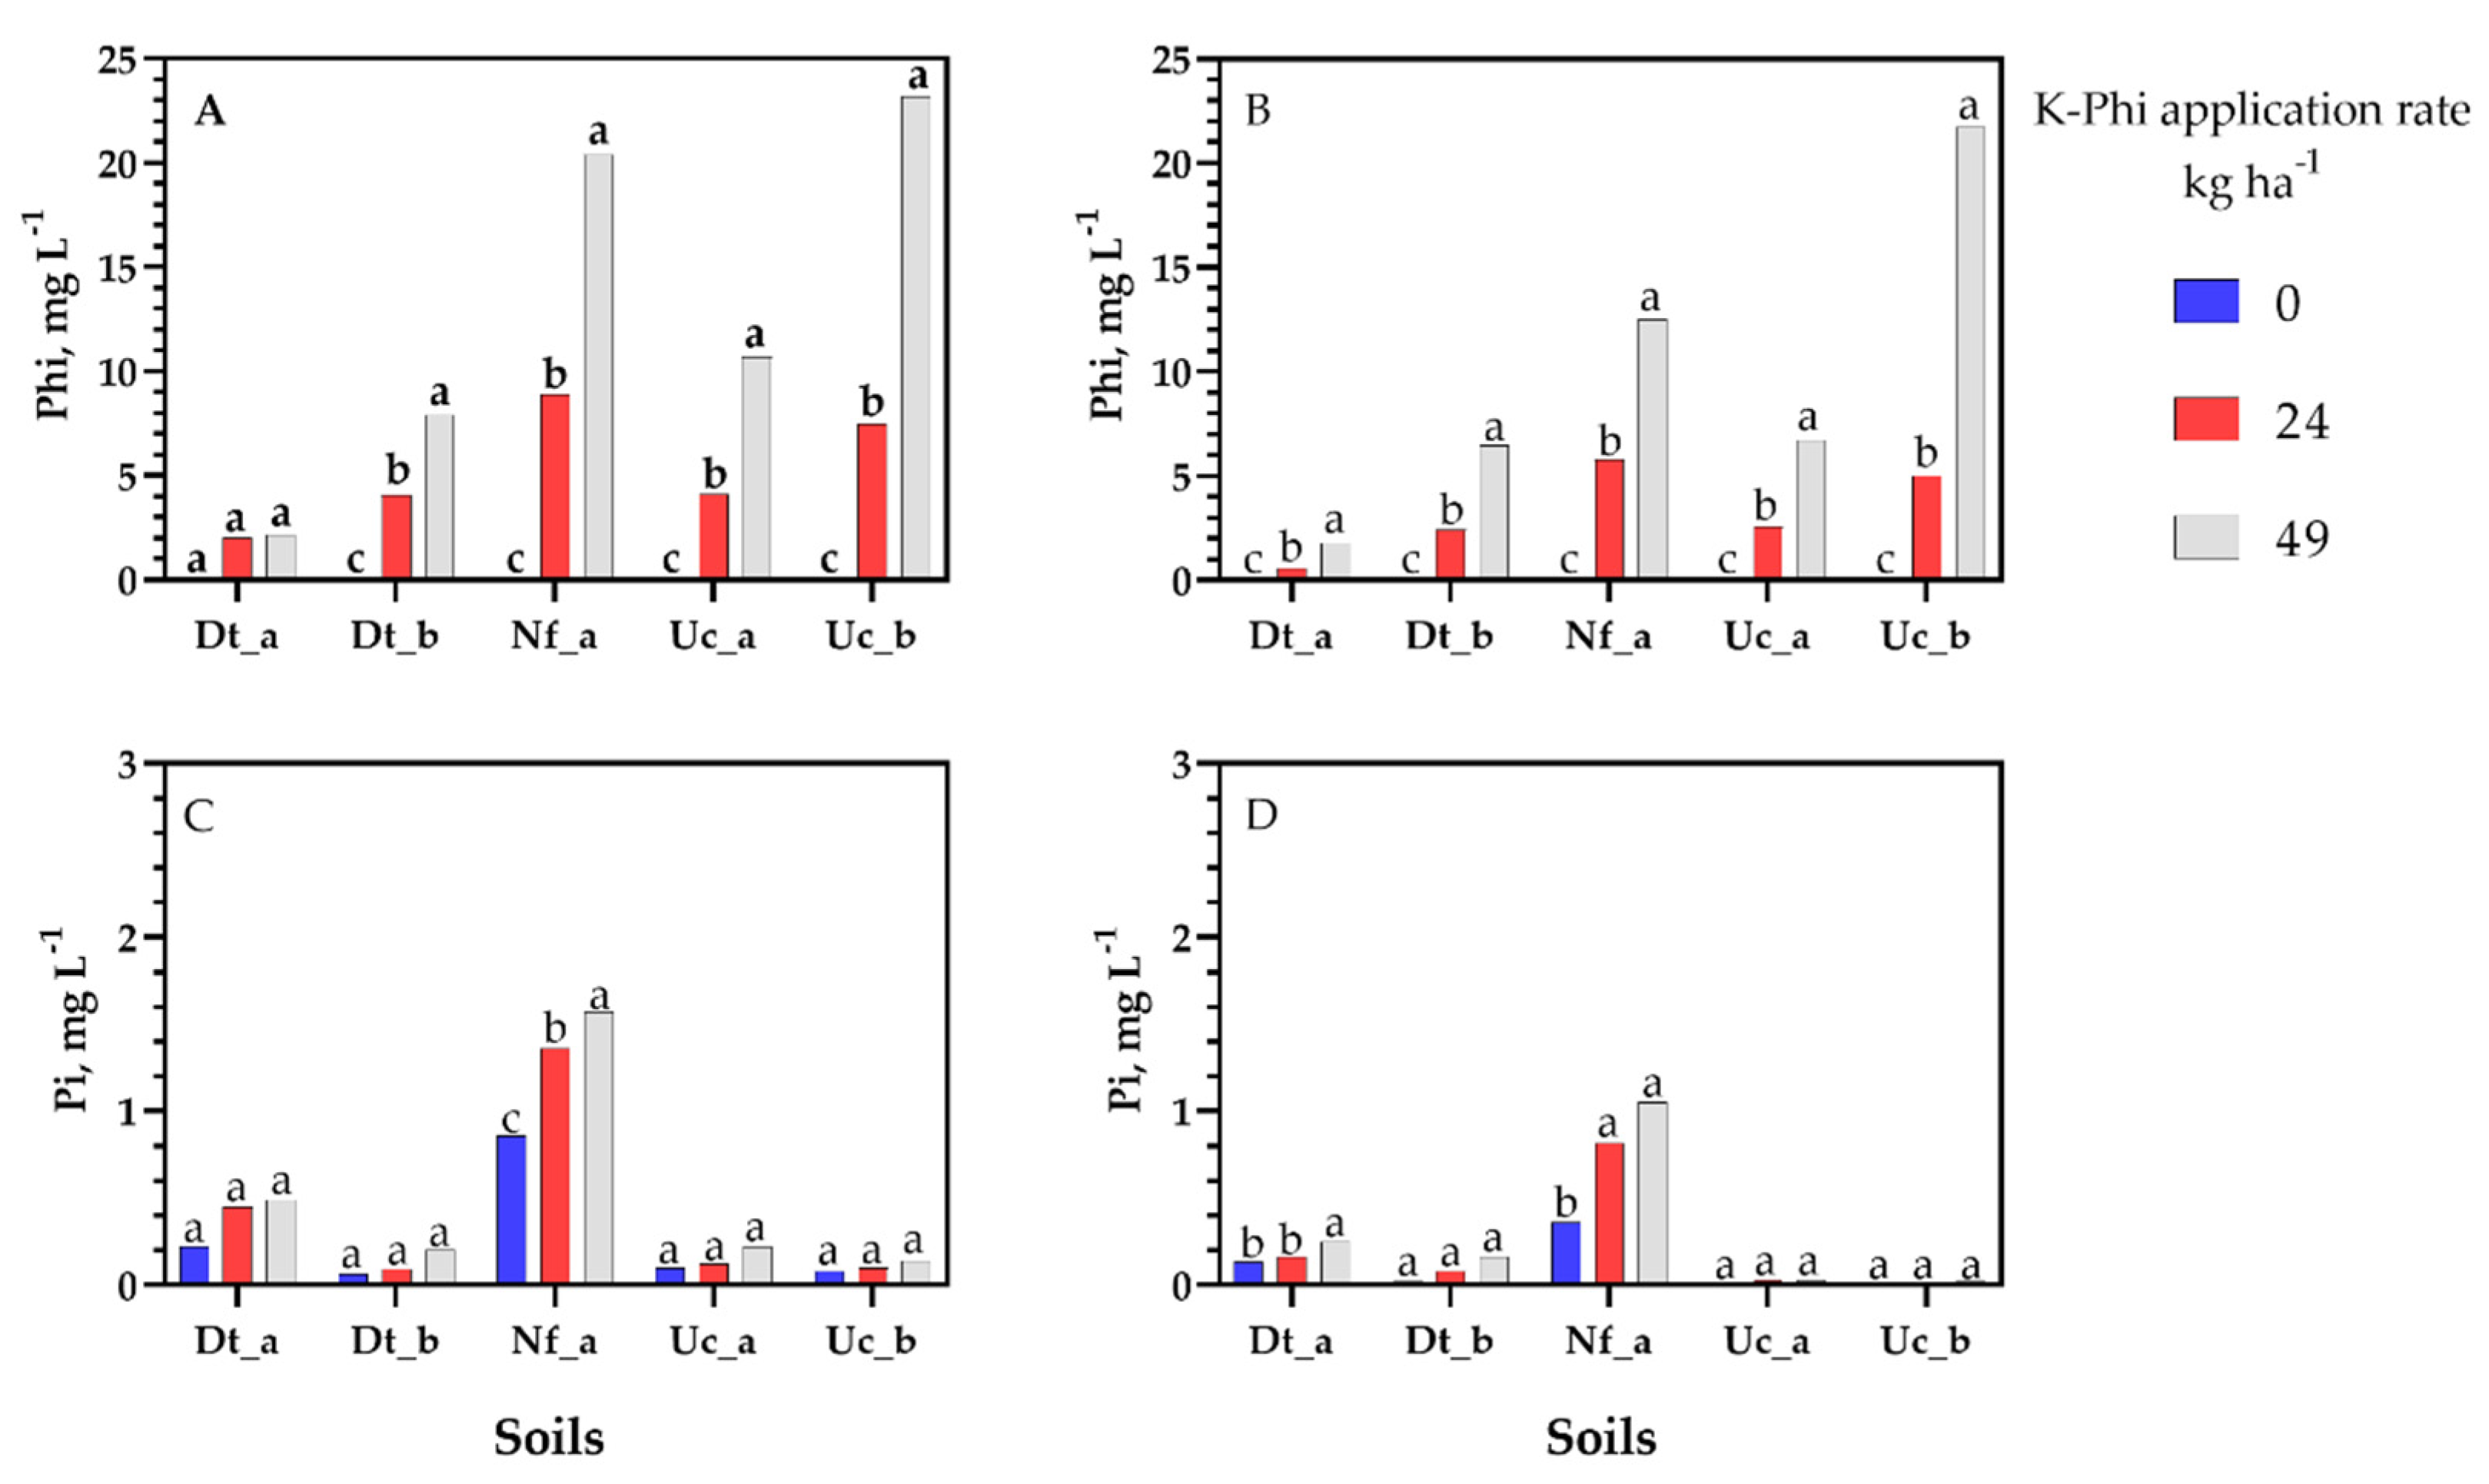
Phosphite leached from all K-Phi treated soils except for the controls (Figure 1A,B). The results from the ANOVA revealed a three-way interaction among leaching, soil material, and rate of K-Phi fertilizer application (p < 0.05). For each soil, the first leachate (Figure 1A) showed a higher Phi concentration than in the second leachate for both Phi treatment rates (Figure 1B). Except for the Dt_a soil in the first leaching trial (Figure 1A), the other four soils had a significantly higher concentration of Phi in their leachates when the K-Phi application rate increased from 24 to 49 kg ha−1. The significant interaction effect of soil material and application rate on the Phi concentration of the leachates showed similar trends for the second leaching trial (Figure 1B).
The Pi concentrations in the leachates from the control and all K-Phi treated soils shown in Figure 1C,D indicate a minimal increase in soluble Pi at increasing Phi application rates. Differences in Pi concentrations between the control and the K-Phi treatments were only statistically significant for the Nf_a soil in both leaching trials and the Dt_a soil in the second leaching trial (p < 0.01). Overall, all Pi concentration values in the leachates remained in a lower range of 0.1–1.7 mg Pi L−1 concentrations (Figure 1C,D) compared to Phi concentrations in 0–23.2 mg Phi L−1 (Figure 1A,B).
The cumulative Phi loss in percentage of the initial total K-Phi fertilizer applied to each soil resulting from the combined data of the two leaching trials is shown in Figure 2. On average, the volume of leachate obtained at each Phi treatment did not differ greatly for each soil (Appendix A, Table A1). Therefore, the increase in the cumulative mass of Phi leached had a similar trend to the Phi concentration in the leachates from soils receiving 24 or 49 kg K-Pi ha−1 treatments (Figure 1). The cumulative mass of Phi released from each soil increased in the order: Dt_a < Dt_b < Uc_a < Nf_a < Uc _b. Although the application rates of K-Phi did not significantly affect the percentage of cumulative Phi leached (p < 0.01) except for the Uc_b soil, the results confirm that each soil material had a significant effect on the percent mass of Phi leached from the soil. These results hint that the quantity of soluble Phi that could be lost by leaching increased as the soils became steadily “saturated” with the increase in K-Phi application rate.
3.2. Phosphite Interaction in the Leached Soils
For all five soils, the P (Phi + Pi) values from each soil extraction method were significantly correlated (p < 0.01) to cumulative DLP (Phi + Pi) values obtained ensuing the passage of 400 mL of water in the leaching trials (Table 3). For both extraction methods, the linear regression slope indicates the change of dissolved P concentration in the leachate (DLP) per unit of soil P extracted. For instance, in the case of WSP, the soil with the lowest regression slope (Dt_a) had the lowest WSP and the lowest DLP. The percent of Phi mass released from each soil in the order of Dt_a < Dt_b < Uc_a < Nf_a < Uc _b is shown in Figure 2, but this trend was different for slopes of the regression between Mehlich 1 and DLP values.
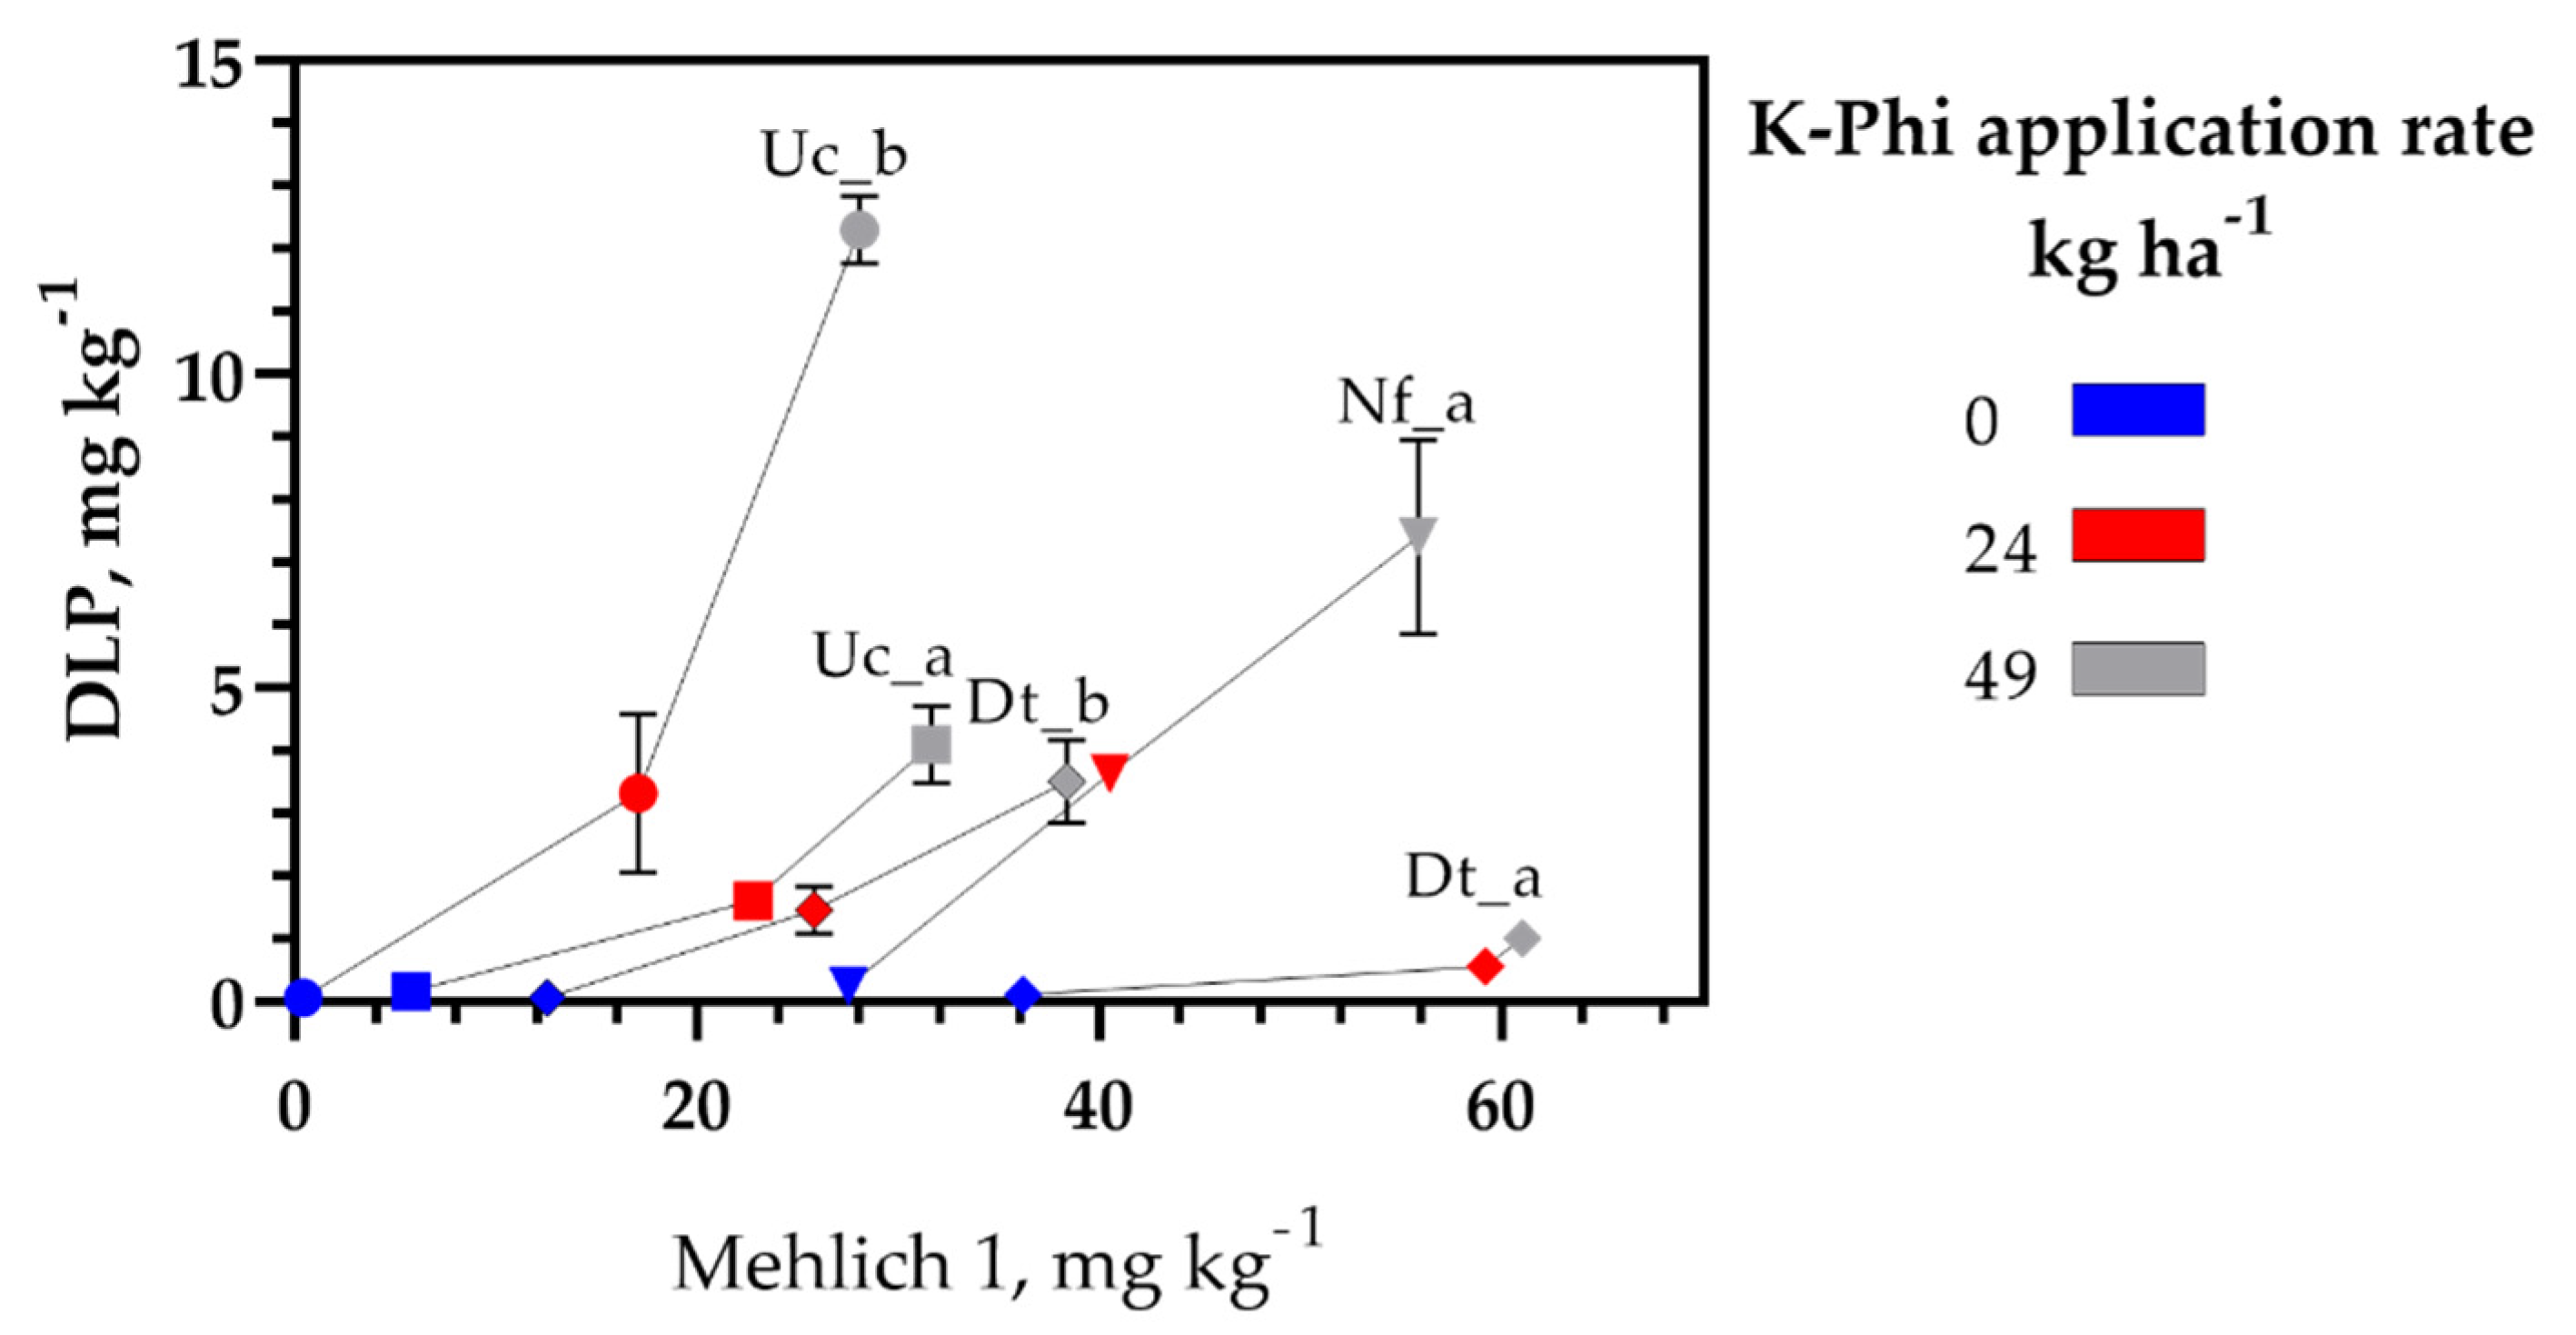
The increase in Mehlich 1 and DSL at increasing rates of K-Phi fertilizer is shown in Figure 3. For the three low-Pi status soils (Uc_b, Uc_a, and Dot_b), the increasing K-Phi application rates resulted in significant increases in Mehlich 1 values (p < 0.01). For instance, the “native” Mehlich 1 value for Uc_b was 4 mg kg−1 in the control with a DLP release of 0.1 mg kg−1 (2.5% cumulative P loss). Applying 24 and 49 kg K-Phi ha−1 to Uc_b raised Mehlich 1 values to 17.1 and 28.7 mg kg−1 with DLP releases of 3.32 (10% P loss) and 12.3 mg kg−1 (20% P loss), respectively. The Uc_a_and the Dt_b followed a similar trend of increasing Mehlich 1 values at increasing rates of K-Phi application but with lower amounts of mean DLP losses than the Uc_b soil. However, in the two medium-Pi soils (Nf_a and Dt_a), increasing Mehlich 1 soil levels due to K-Phi application differed markedly on the DLP. The DLP values were low (<1%) from the controls of both Nf_a and Dt_a soils. Relative to the Phi application rates of 24 and 49 kg ha−1, K-Phi fertilizer addition to the Nf_a soil increased P loss to 6 and 9%, whereas K-Phi fertilizer addition to the Dt_a soil at the highest rate of 49 kg ha−1 resulted in a mean P loss of 1%.
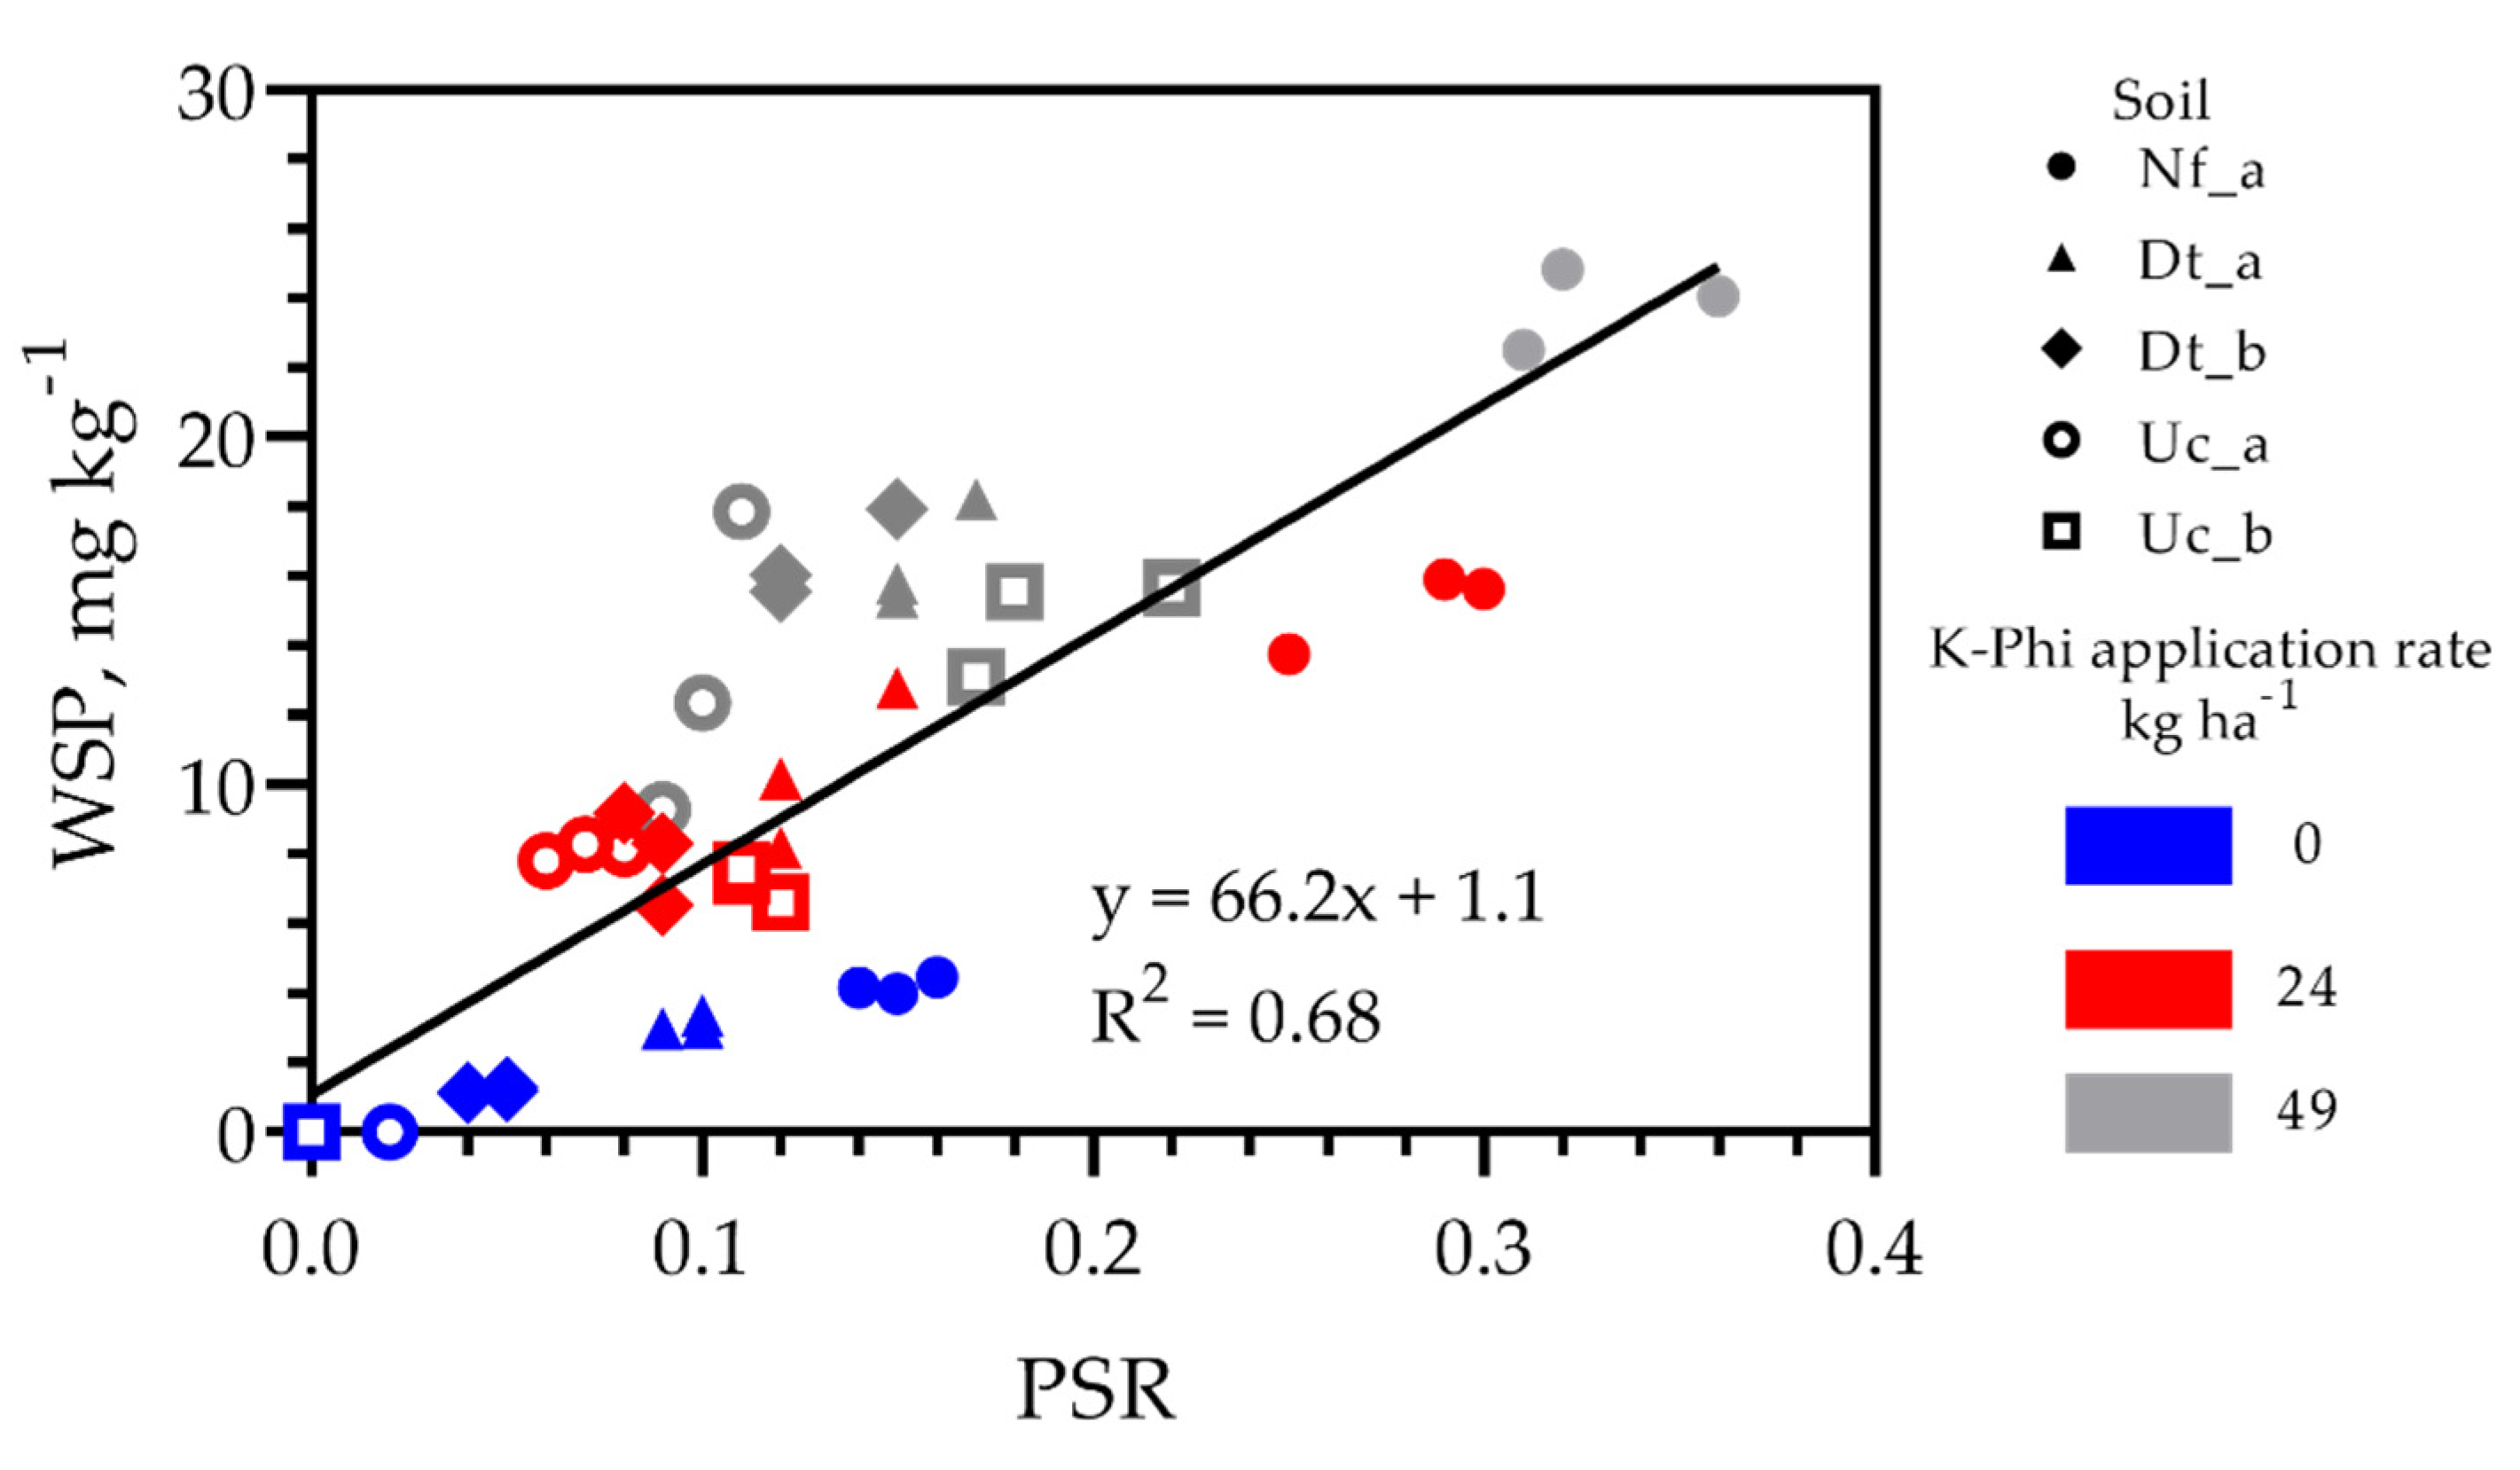
Given the significant high correlation between WSP and DLP (Table 3), we combined the five soil datasets used in the regression analyses to assess the potential Phi and Pi leaching losses due to soil Phi saturation using the PSR approach. A low PSR (< 0.06) for the controls (no Phi applied) of Dt_b, Uc_a, and Uc_b (Figure 4, blue dataset) is related to the low Pi contents (4–12 mg L−1) shown in Table 1, indicating a low risk of P loss. Instead, the control of the Uc_a with a medium range of Pi content (25 mg kg−1) shows a PSR of 0.10, which is considered a threshold value for soil Pi losses [36]. The Nf_a soil with a PSR > 0.10 in the range (0.14–0.16) relates to the significant Pi leaching losses data shown in Figure 1C,D. As a result of adding K-Phi, soils became sufficiently “saturated” with Phi with an increased risk for P loss. The leaching potential increased at the application rate of 24 kg Phi ha−1 (Figure 4, red dataset). The Dt_a, Dt_b, Uc_a, and Uc_b soils with PSR values in the 0.06–0.15 range retained sufficient Phi, resulting in WSP values in the range of 6–13 mg kg−1. The Nf_a soil had high PSR values in the 0.25–0.30 range, indicating a high risk for Phi leaching losses, with WSP values in the 14–16 mg kg−1 range. The application rate of 49 kg Phi ha−1 further increased the risk of Phi leaching with PSR values beyond 0.10 for all soils (Figure 4). The elevated values of WSP for the Nf_a and Uc_b soils agree with the percent Phi leaching losses on a mass basis (Figure 2) and the lowest Phi sorption index values reported in Table 1.
4. Discussion
The soils in this study contained a low to medium range of Mehlich 1 Pi (4–25 mg kg−1) as shown in Table 1. We attribute the differences in Mehlich 1 Pi among soils to different histories of fertilizer application, cropping, liming, and tillage. Because of liming, the Dt_a, Dt_b, and Nf_a show pH values > 5.9 and medium to high contents of Ca (400–500 mg kg−1) and Mg (> 30 mg kg−1) in Melich 1 extracts [37]. Mehlich 1 Pi extracted from these acid soils (pH 4.6–6.4) likely included a large portion of Pi sorbed to Al and Fe hydroxides (goethite and gibbsite), common minerals in Ultisols of the Southern Coastal Plain. Moreover, the extent of Pi leaching in sandy soils from the application of highly water-soluble Pi fertilizers (e.g., superphosphate, triple superphosphate, or di-ammonium phosphate) depends on several factors such as the fertilizer application rate, soil matrix–soil solution contact time, rainfall pattern, and Pi sorption capacity of topsoil and subsurface layers [19,38,39]. In our study, we assumed that Phi would completely replace Pi as a fertilizer compound. Therefore, we did not include Pi treatments to compare Pi to Phi leaching losses. However, others described trials comparing Pi and Phi sorption performed in soils called Latosols [21,40,41], which are soils with a relatively high content of Al and Fe oxides, including many Ultisols [42]. The study of Rothbaum and Baillie [21] reported lower retention and slower removal of Phi from soil solution than Pi. This lower soil retention of Phi to Pi could help Phi reach much deeper roots, but it makes Phi more susceptible to surface runoff losses and leaching, as noted by Morton et al. [22]. Since there are similarities between the two molecules of Phi and Pi [43], the sorption of Phi to soil seems analogous to Pi sorption, depending on soil pH and the mechanisms of soil sorption and precipitation on surfaces of clay minerals, Al and Fe oxides, and carbonates [1,41]. Therefore, the DW and Mehlich 1 Pi and Phi analysis would represent together the soil P generic pools of solution P and labile P, respectively [1]. We assumed that the DW extracted soil Phi and Pi represented WSP loosely bound and solution forms. The Mehlich 1 soil Phi and Pi represented the labile P pool in equilibrium with the soil solution P.
The Southern Coastal Plain region has a relatively high annual precipitation, but rainfed agriculture, a ubiquitous practice in the region, is exposed to changes in precipitation frequencies and intensities during the crop season [44]. In particular, the high solubility of K-Phi in water and weak soil sorption [20,21] may make Phi susceptible to leaching losses in the case of intense rainfall immediately after field application of K-Phi fertilizer. Despite using disturbed soil samples and the non-natural soil packing in the pots used in the leaching trials, the amounts leached of Phi rather than Pi were significantly affected by the application rate of Phi and the soil material properties.
Soil texture, pH, and Phi sorption capacity are key soil properties to control the amount of Phi leached according to the statistically significant interaction of soil material with the concentration of Phi and Pi in the leachates (Figure 1) and total percent Phi leached on a mass basis (Figure 2). In sandy soils, the Pi leaching can be greatly affected by the sorption capacity in the subsoil layers [39]. Similarly, the Phi concentrations in the leachate from the subsurface layers (15–30 cm depth) of the Dt_b and Uc_b soils suggest that Phi leaching losses could increase in deeper soil layers with a lower Phi sorption capacity than in their respective surface soils (Dt_a_and Uc_a). Although one can argue that applying the Phi rates of 24 mg kg−1 and 49 mg kg−1 were high for the subsurface soils (Dt_b and Uc_b), the statistically significant differences in their values of Phi leached (Figure 2) strongly support our assumption that soil properties have a significant effect on Phi’s mobility into deeper soil layers.
The risk of Phi loss from the soil after receiving K-Phi fertilizer applications is soil-specific and depends on the capacity of each soil to retain Phi. As shown in Figure 3, the Dt_a soil had a high Mehlich 1 P-value of 61 mg kg−1 with an application of 49 kg Phi ha−1 but a low DLP of 1.0 mg kg−1. However, the Nf_a soil that had a Mehlich 1 P-value of 58 mg kg−1 at the same K-Phi application rate but with DLP losses over 7-fold higher (7.4 mg kg−1) than the Dt_a soil. Because soils with high Pi sorption capacity also show high Phi sorption capacity [21], the Dt_a sorption capacities of 98.0 mg Pi kg−1 and 95 Phi mg kg−1 against the Nf_a’s sorption capacity of 42.0 mg Pi kg−1 and 43.9 Phi kg−1 can explain in part the significantly lower leaching losses of the Dt_a soil. The risks of Phi losses according to PSR values presented in Figure 4 shows that soils with the same PSR may differ in their environmental P loss risk due to differences in the P retention capacity of the soil [35]. Besides, we presume the PSR values presented here could be transient because Phi can be transformed to Pi in soils by biological oxidation [16,17,45]. In an incubation study, Phi was converted to Pi mostly within 60 days in a Marvyn loamy sand, a sandy soil of the Coastal Plain, receiving K-Phi in the range of 50–140 kg P ha−1 [46]. This transformation of Phi into Pi could change the equilibrium between the labile and soluble P pools and alter the risk of Phi and Pi leaching in a relatively short time. Future studies on the risk of Phi leaching losses should include the transformation of Phi into Pi in time, the effect of soil pH on sorption and desorption of Phi and Pi, and potential contributions of Phi to legacy P [2].
Several studies showed that ensuing foliar or soil application, plants readily absorb and accumulate Phi in roots or leaves at high concentrations [9,12,47]. Since Phi is more soluble and less soil-reactive, its rapid absorption by transgenic plants expressing the ptxD gene will require less P and reduce the potential risk of P leaching losses. Studies on the selective Phi fertilization of transgenic cotton expressing the ptxD gene showed high efficacy in suppressing the growth of herbicide-resistant weeds at soil Pi contents lower than 18 mg kg−1 [15,48]. In our study, the soil test data for Pi (Mehlich 1) shown in Table 1 indicate that the Dt_a and Nf_a soils are in the medium Pi range (16–30 mg kg−1) and the Dt_b, Uc_a, and Uc_b in the lower Pi range (<16 mg kg−1) according to Clemson University soil test recommendations. On one hand, we speculate that sandy soils of the Southern Coastal Plain with low Pi content could affect Pi starvation response and control herbicide-resistant weeds growth through the K-Phi fertilization of ptxD-transgenic crops. On the other hand, soils in the medium Pi range would require depletion of Pi to the low Pi range for high efficacy of the ptxD transgenic crop technology. Because plants rapidly absorb Phi, further studies on the environmental impact of Phi use as fertilizer should include the interaction of plants with soil properties and soil microbial population at optimal Phi application rates for the growth of ptxD transgenic plants.
Author Contributions
Conceptualization, A.A.S., and P.J.B.; methodology, A.A.S., and P.D.S.; statistical analysis, A.A.S., and E.D.B.; investigation, A.A.S., P.D.S., and P.J.B., data curation P.D.S.; writing—original draft preparation, A.A.S., P.D.S., and E.D.B.; writing—review and editing A.A.S., P.D.S., E.D.B. and P.J.B. All authors have read and agreed to the published version of the manuscript.
Funding
This research was supported by Cooperative Research Agreement 18-499 “Phosphite as a source of phosphorus for cotton” between Cotton Incorporated and the U.S. Department of Agriculture, Agricultural Research Service.
Institutional Review Board Statement
Not applicable.
Informed Consent Statement
Not applicable.
Data Availability Statement
The data presented in this study will be published and openly available to the public in the data repository Dryad (dryad.org) or an equivalent data repository within 30 months after the date of publication and catalogs in the National Agricultural Library (NAL) Ag Data Common with additional information on the USDA funding, dataset description, and associated publications.
Conflicts of Interest
The authors declare no conflict of interest.
Appendix A

Table A1.
Mean volume and (standard deviation) of two combined leachates recovered for each soil (n = 6) at three application rates of phosphite (Pi).
Table A1.
Mean volume and (standard deviation) of two combined leachates recovered for each soil (n = 6) at three application rates of phosphite (Pi).
| Soil | Pi Rate | Volume Leached |
|---|---|---|
| kg ha−1 | mL | |
| Dt_a | 0 | 110 (48) |
| 24 | 110 (48) | |
| 49 | 112 (47) | |
| Dt_b | 0 | 116 (46) |
| 24 | 119 (42 | |
| 49 | 123 (42) | |
| Nf_a | 0 | 116 (53) |
| 24 | 118 (53) | |
| 49 | 114 (51) | |
| Uc_a | 0 | 125 (39) |
| 24 | 124 (39) | |
| 49 | 123 (39) | |
| Uc_b | 0 | 138 (30) |
| 24 | 137 (34) | |
| 49 | 138 (36) |
References
- Penn, C.J.; Camberato, J.J. A critical review on soil chemical processes that control how soil pH affects phosphorus availability to plants. Agriculture 2019, 9, 120. [Google Scholar] [CrossRef] [Green Version]
- Cerven, V.; Novak, J.M.; Szögi, A.A.; Pantuck, K.; Watts, D.W.; Johnson, M.G. The occurrence of legacy P soils and potential mitigation practices using activated biochar. Agronomy 2021, 11, 1289. [Google Scholar] [CrossRef]
- Szogi, A.A.; Vanotti, M.B.; Ro, K.S. Methods for treatment of animal manures to reduce nutrient pollution prior to soil application. Curr. Pollut. Rep. 2015, 1, 47–56. [Google Scholar] [CrossRef]
- Cordell, D.; Drangert, J.-O.; White, S. The story of phosphorus: Global food security and food for thought. Glob. Environ. Chang. 2009, 19, 292–305. [Google Scholar] [CrossRef]
- Heuer, S.; Gaxiola, R.; Schilling, R.; Herrera-Estrella, L.; López-Arredondo, D.; Wissuwa, M.; Delhaize, E.; Rouached, H. Improving phosphorus use efficiency: A complex trait with emerging opportunities. Plant J. 2017, 90, 868–885. [Google Scholar] [CrossRef] [Green Version]
- López-Arredondo, D.L.; Herrera-Estrella, L. Engineering phosphorus metabolism in plants to produce a dual fertilization and weed control system. Nat. Biotechnol. 2012, 30, 889–893. [Google Scholar] [CrossRef] [PubMed]
- Weeks, J.J., Jr.; Hettiarachchi, G.M. A review of the latest in phosphorus fertilizer technology: Possibilities and pragmatism. J. Environ. Qual. 2019, 48, 1300–1313. [Google Scholar] [CrossRef] [PubMed] [Green Version]
- Guest, D.; Grant, B. The complex action of phosphonates as antifungal agents. Biol. Rev. 1991, 66, 159–187. [Google Scholar] [CrossRef]
- Thao, H.T.B.; Yamakawa, T. Phosphite (phosphorous acid): Fungicide, fertilizer or bio-stimulator? Soil Sci. Plant Nutr. 2009, 55, 228–234. [Google Scholar] [CrossRef]
- Lovatt, C.; Mikkelsen, R. Phosphite fertilizers: What are they? Can you use them? What can they do. Better Crop. 2006, 90, 11–13. [Google Scholar]
- McDonald, A.E.; Grant, B.R.; Plaxton, W.C. Phosphite (phosphorous acid): Its relevance in the environment and agriculture and influence on plant phosphate starvation response. J. Plant Nutr. 2001, 24, 1505–1519. [Google Scholar] [CrossRef]
- Ratjen, A.M.; Gerendás, J. A critical assessment of the suitability of phosphite as a source of phosphorus. J. Plant Nutr. Soil Sci. 2009, 172, 821–828. [Google Scholar] [CrossRef]
- Nahampun, H.N.; López-Arredondo, D.; Xu, X.; Herrera-Estrella, L.; Wang, K. Assessment of ptxD gene as an alternative selectable marker for Agrobacterium-mediated maize transformation. Plant Cell Rep. 2016, 35, 1121–1132. [Google Scholar] [CrossRef]
- Achary, V.M.M.; Ram, B.; Manna, M.; Datta, D.; Bhatt, A.; Reddy, M.K.; Agrawal, P.K. Phosphite: A novel P fertilizer for weed management and pathogen control. Plant Biotechnol. J. 2017, 15, 1493–1508. [Google Scholar] [CrossRef] [PubMed] [Green Version]
- Pandeya, D.; López-Arredondo, D.L.; Janga, M.R.; Campbell, L.M.; Estrella-Hernández, P.; Bagavathiannan, M.V.; Herrera-Estrella, L.; Rathore, K.S. Selective fertilization with phosphite allows unhindered growth of cotton plants expressing the ptxD gene while suppressing weeds. Proc. Natl. Acad. Sci. USA 2018, 115, E6946–E6955. [Google Scholar] [CrossRef] [PubMed] [Green Version]
- Adams, F.; Conrad, J.P.J.S.S. Transition of phosphite to phosphate in soils. Soil Sci. Soc. Am. J. 1953, 75, 361–371. [Google Scholar] [CrossRef]
- Stone, B.L.; White, A.K. Most probable number quantification of hypophosphite and phosphite oxidizing bacteria in natural aquatic and terrestrial environments. Arch. Microbiol. 2012, 194, 223–228. [Google Scholar] [CrossRef]
- Morris, T.F.; Murrell, T.S.; Beegle, D.B.; Camberato, J.J.; Ferguson, R.B.; Grove, J.; Ketterings, Q.; Kyveryga, P.M.; Laboski, C.A.; McGrath, J.M. Strengths and limitations of nitrogen rate recommendations for corn and opportunities for improvement. Agron. J. 2018, 110, 1. [Google Scholar] [CrossRef] [Green Version]
- Szogi, A.A.; Bauer, P.J.; Vanotti, M.B. Vertical distribution of phosphorus in a sandy soil fertilized with recovered manure phosphates. J. Soils Sediments 2012, 12, 334–340. [Google Scholar] [CrossRef]
- Frazier, A.; Waerstad, K. Crystallography and equilibrium solubility for ammonium and potassium orthophosphites and hypophosphites. Fertil. Res. 1992, 32, 161–168. [Google Scholar] [CrossRef]
- Rothbaum, H.P.; Baillie, W.J.H. The use of red phosphorus as a fertiliser. 4. Phosphite and phosphate retention in soils. N. Z. J. Sci. 1964, 7, 51–66. [Google Scholar]
- Morton, S.C.; Glindemann, D.; Wang, X.; Niu, X.; Edwards, M. Analysis of reduced phosphorus in samples of environmental interest. Environ. Sci. Technol. 2005, 39, 4369–4376. [Google Scholar] [CrossRef]
- Staff, S.S. Soil taxonomy: A basic system of soil classification for making and interpreting soil surveys. In Agriculture Handbook (USDA); Soil Conservation Service: Washington, DC, USA, 1999. [Google Scholar]
- Crozier, C.; Hardy, D.; Kissel, D.; Mitchell, C.; Oldham, J.; Phillips, S.; Sonon, L. Soil Testing and Recommendations for Cotton on Coastal Plain Soils, Southern Cooperative Series Bulletin no.10; Auburn University: Auburn, AL, USA, 2010. [Google Scholar]
- Miller, W.; Miller, D. A micro-pipette method for soil mechanical analysis. Commun. Soil Sci. Plant Anal. 1987, 18, 1–15. [Google Scholar] [CrossRef]
- Karathanasis, A.D.; Shumaker, P.D. Organic and inorganic phosphate interactions with soil hydroxy-interlayered minerals. J. Soils Sediments 2009, 9, 501–510. [Google Scholar] [CrossRef]
- Harris, W.; Norman White, G. X-ray diffraction techniques for soil mineral identification. In Methods of Soil Analysis Part 5 Mineralogical Methods; Soil Science Society of America: Madison, WI, USA, 2008; pp. 81–115. [Google Scholar]
- Karathanasis, A. Thermal analysis of soil minerals. In Methods of Soil Analysis Part 5 Mineralogical Methods; Soil Science Society of America: Madison, WI, USA, 2008; pp. 117–160. [Google Scholar]
- Self-Davis, M.; Moore, P.; Joern, B.; Kovar, J.; Pierzynski, G. Water-or dilute salt-extractable phosphorus in soil. In Methods for Phosphorus Analysis for Soils, Sediments, Residuals, and Waters; Southern Cooperative Series Bulletin; Virginia Tech University: Blacksburg, VA, USA, 2009; pp. 22–24. [Google Scholar]
- Sims, J.T. Soil test phosphorus: Principles and methods. In Methods of Phosphorus Analysis for Soils, Sediments, Residuals and Waters, 2nd ed.; Southern Cooperative Series Bulletin; Virginia Tech University: Blacksburg, VA, USA, 2009; pp. 9–19. [Google Scholar]
- ASTM. Anions in Water by Suppressed Ion Chromatography ASTM Standard D4327-11; ASTM International: West Conshohocken, PA, USA, 2011. [Google Scholar]
- McDowell, M.M.; Ivey, M.M.; Lee, M.E.; Firpo, V.V.; Salmassi, T.M.; Khachikian, C.S.; Foster, K.L. Detection of hypophosphite, phosphite, and orthophosphate in natural geothermal water by ion chromatography. J. Chromatogr. A 2004, 1039, 105–111. [Google Scholar] [CrossRef] [PubMed]
- D’Angelo, E.; Crutchfield, J.; Vandiviere, M. Rapid, sensitive, microscale determination of phosphate in water and soil. J. Environ. Qual. 2001, 30, 2206–2209. [Google Scholar] [CrossRef] [PubMed] [Green Version]
- Maguire, R.O.; Sims, J.T. Soil testing to predict phosphorus leaching. J. Environ. Qual. 2002, 31, 1601–1609. [Google Scholar] [CrossRef]
- Nair, V.D. Soil phosphorus saturation ratio for risk assessment in land use systems. Front. Environ. Sci. 2014, 2, 6. [Google Scholar] [CrossRef] [Green Version]
- Dari, B.; Nair, V.D.; Colee, J.; Harris, W.G.; Mylavarapu, R. Estimation of phosphorus isotherm parameters: A simple and cost-effective procedure. Front. Environ. Sci. 2015, 3, 70. [Google Scholar] [CrossRef] [Green Version]
- Mylavarapu, R.; Miller, R. Mehlich-1. Soil test methods from the Southeastern United States. In Southern Cooperative Series Bulletin No. 419; Clemson University: Clemson, SC, USA, 2014; pp. 95–99. [Google Scholar]
- Weaver, D.; Ritchie, G.; Anderson, G.; Deeley, D. Phosphorus leaching in sandy soils. I. Short-term effects of fertilizer applications and environmental conditions. Soil Res. 1988, 26, 177–190. [Google Scholar] [CrossRef]
- Andersson, H.; Bergström, L.; Djodjic, F.; Ulén, B.; Kirchmann, H. Topsoil and subsoil properties influence phosphorus leaching from four agricultural soils. J. Environ. Qual. 2013, 42, 455–463. [Google Scholar] [CrossRef] [Green Version]
- Bastisse, E. Sub-surface applications of fertilizer phosphorus in soils. Compte Rendu Hebd. Seances L’academie Sci. 1970, 271, 1820–1822. [Google Scholar]
- Kumar, R.A.; Velayudhan, K.; Vasu, K.; Ramachandran, V.; Bhai, R.S.; Unnikrishnan, G. Interaction of potassium phosphonate fungicide in laterite soil. J. Environ. Sci. Eng. 2005, 47, 276–285. [Google Scholar] [PubMed]
- Cline, M.G. Origin of the term Latosol. Soil Sci. Soc. Am. J. 1975, 39, 162. [Google Scholar] [CrossRef]
- Havlin, J.L.; Schlegel, A.J. Review of Phosphite as a Plant Nutrient and Fungicide. Soil Syst. 2021, 5, 52. [Google Scholar] [CrossRef]
- Sohoulande, C.D.; Stone, K.; Szogi, A.; Bauer, P. An investigation of seasonal precipitation patterns for rainfed agriculture in the Southeastern region of the United States. Agric. Water Manag. 2019, 223, 105728. [Google Scholar] [CrossRef]
- Malacinski, G.; Konetzka, W.A. Bacterial oxidation of orthophosphite. J. Bacteriol. 1966, 91, 578–582. [Google Scholar] [CrossRef] [Green Version]
- Chang, B. Phosphite in Soil and Turfgrass. Master’s Thesis, Auburn University, Auburn, AL, USA, 2016. [Google Scholar]
- Schroetter, S.; Angeles-Wedler, D.; Kreuzig, R.; Schnug, E. Effects of phosphite on phosphorus supply and growth of corn (Zea mays). Landbauforsch. Volkenrode 2006, 56, 87. [Google Scholar]
- Pandeya, D.; Campbell, L.M.; Nunes, E.; Lopez-Arredondo, D.L.; Janga, M.R.; Herrera-Estrella, L.; Rathore, K.S. ptxD gene in combination with phosphite serves as a highly effective selection system to generate transgenic cotton (Gossypium hirsutum L.). Plant Mol. Biol. 2017, 95, 567–577. [Google Scholar] [CrossRef]
Figure 1.
Mean phosphite-P (Phi) concentration in leachates from the first (A) and second leaching (B) trial; and mean phosphate-P (Pi) concentration in leachates from the first (C) and second leaching (D) trial for the five soils described in Table 1. Each soil received potassium phosphite (K-Phi) application rates equivalent to 0, 24, and 49 kg P ha−1 before the first leaching trial. For each soil, means followed by the same letter are not significantly different at a probability p < 0.01.

Figure 2.
Percent of cumulative phosphite (Phi) leached with respect to initial Phi on a mass basis. Combined data of two leaching trials for each K-Phi application rate. For each soil, means followed by the same letter are not significantly different at a probability p < 0.01.
Figure 2.
Percent of cumulative phosphite (Phi) leached with respect to initial Phi on a mass basis. Combined data of two leaching trials for each K-Phi application rate. For each soil, means followed by the same letter are not significantly different at a probability p < 0.01.

Figure 3.
Relationship between mean Mehlich 1 soil P (Phi + Pi) and cumulative dissolved leached P (DLP = Phi + Pi) for each of the five soils in this study (Dt_a, Dt_b, Nf_a, Uc_a, Uc_b) at three application rates of potassium phosphite (K-Phi). Error bars are one standard deviation of the mean.
Figure 3.
Relationship between mean Mehlich 1 soil P (Phi + Pi) and cumulative dissolved leached P (DLP = Phi + Pi) for each of the five soils in this study (Dt_a, Dt_b, Nf_a, Uc_a, Uc_b) at three application rates of potassium phosphite (K-Phi). Error bars are one standard deviation of the mean.

Figure 4.
Relationship between the concentration of water-soluble phosphorus (WSP = Phi + Pi) and the phosphorus saturation ratio (PSR) for the five sandy soils of this study at three application rates of potassium phosphite.
Figure 4.
Relationship between the concentration of water-soluble phosphorus (WSP = Phi + Pi) and the phosphorus saturation ratio (PSR) for the five sandy soils of this study at three application rates of potassium phosphite.

Table 1.
Select properties of experimental soils.
| Soil 1 | Depth | Sand | Silt | Clay | Soil C | pH | CEC 2 | M1-Pi 3 | Ca | Mg | Sorption | |
|---|---|---|---|---|---|---|---|---|---|---|---|---|
| Pi | Phi | |||||||||||
| cm | % | % | % | g kg−1 | cmolc kg−1 | mg kg−1 | mg kg−1 | mg kg−1 | mg kg−1 | mg kg−1 | ||
| Dt_a | 0–15 | 66 | 18 | 16 | 13.4 | 5.3 | 6.4 | 25 | 466 | 79 | 98.0 | 95.5 |
| Dt_b | 15–30 | 81 | 10 | 9 | 7.4 | 6.2 | 6.0 | 12 | 502 | 107 | 70.6 | 77.8 |
| Nf_a | 0–15 | 79 | 16 | 5 | 7.0 | 5.9 | 4.6 | 21 | 402 | 50 | 42.0 | 43.9 |
| Uc_a | 0–15 | 91 | 6 | 3 | 8.7 | 4.7 | 3.3 | 6 | 67 | 11 | 78.1 | 93.6 |
| Uc_b | 15–30 | 91 | 6 | 3 | 1.5 | 5.0 | 1.6 | 4 | 37 | 7 | 72.2 | 37.1 |
1 Dt (Dotham), Nk (Norfolk), Uc (Uchee); a (surface soil 0–15 cm), b (subsurface soil, 15–30 cm). 2 Cation exchange capacity. 3 Available soil phosphorus, Mehlich 1.
Table 2.
Measurement of Phi in de-ionized water (DW) and Mehlich 1 soil extracts spiked with 5 mg L−1 Phi.
Table 2.
Measurement of Phi in de-ionized water (DW) and Mehlich 1 soil extracts spiked with 5 mg L−1 Phi.
| Soil 1 | DW | Mehlich 1 | ||||
|---|---|---|---|---|---|---|
| NS 2 | S 3 | Recovery | NS | S | Recovery | |
| mg L−1 | mg L−1 | % | mg L−1 | mg L−1 | % | |
| Dt_a | 0.85 | 6.01 | 97 | 1.39 | 6.31 | 101 |
| Dt_b | 1.19 | 6.26 | 98 | 1.44 | 6.56 | 98 |
| Nf_a | 1.63 | 6.64 | 99 | 1.85 | 6.98 | 98 |
| Uc_a | 1.13 | 6.29 | 97 | 1.86 | 7.29 | 93 |
| Uc_b | 1.49 | 6.52 | 99 | 2.16 | 7.42 | 96 |
1 Dt (Dotham), Nf (Norfolk), Uc (Uchee); a (surface soil, 0–15 cm), b (subsurface soil, 15–30 cm); 2 NS = Not spiked; 3 S = Spiked.
Table 3.
Water-soluble P (WSP) and Mehlich 1 P correlation to dissolved leachate P (DLP) from five soils. WSP and Mehlich 1 P are extracted mg (Phi + Pi) kg−1 soil; DLP is the combined P (Phi + Pi) concentration of two leaching trials in mg L−1.
Table 3.
Water-soluble P (WSP) and Mehlich 1 P correlation to dissolved leachate P (DLP) from five soils. WSP and Mehlich 1 P are extracted mg (Phi + Pi) kg−1 soil; DLP is the combined P (Phi + Pi) concentration of two leaching trials in mg L−1.
| WSP | Mehlich 1 | |||
|---|---|---|---|---|
| Soil | Regression line | Regression coefficient (R2) | Regression line | Regression coefficient (R2) |
| Dt_a | y = 0.30x − 0.19 | 0.83 | y = 1.34x − 34.8 | 0.88 |
| Dt_b | y = 0.91x − 0.53 | 0.91 | y = 0.17x − 6.5 | 0.85 |
| Nf_a | y = 1.7x − 6.5 | 0.93 | y = 0.67x − 9.6 | 0.96 |
| Uc_a | y = 1.0x + 1.1 | 0.74 | y = 0.66x − 2.5 | 0.83 |
| Uc_b | y = 3.0x − 2.7 | 0.92 | y = 1.77x − 17.2 | 0.76 |
Publisher’s Note: MDPI stays neutral with regard to jurisdictional claims in published maps and institutional affiliations. |
© 2021 by the authors. Licensee MDPI, Basel, Switzerland. This article is an open access article distributed under the terms and conditions of the Creative Commons Attribution (CC BY) license (https://creativecommons.org/licenses/by/4.0/).
Share and Cite
MDPI and ACS Style
Szogi, A.A.; Shumaker, P.D.; Billman, E.D.; Bauer, P.J. Leaching Potential of Phosphite Fertilizer in Sandy Soils of the Southern Coastal Plain, USA. Environments 2021, 8, 126. https://0-doi-org.brum.beds.ac.uk/10.3390/environments8110126
AMA Style
Szogi AA, Shumaker PD, Billman ED, Bauer PJ. Leaching Potential of Phosphite Fertilizer in Sandy Soils of the Southern Coastal Plain, USA. Environments. 2021; 8(11):126. https://0-doi-org.brum.beds.ac.uk/10.3390/environments8110126
Chicago/Turabian StyleSzogi, Ariel A., Paul D. Shumaker, Eric D. Billman, and Philip J. Bauer. 2021. "Leaching Potential of Phosphite Fertilizer in Sandy Soils of the Southern Coastal Plain, USA" Environments 8, no. 11: 126. https://0-doi-org.brum.beds.ac.uk/10.3390/environments8110126
Note that from the first issue of 2016, this journal uses article numbers instead of page numbers. See further details here.