Article

Discontinuous Geochemical Monitoring of the Galleria Italia Circumneutral Waters (Former Hg-Mining Area of Abbadia San Salvatore, Tuscany, Central Italy) Feeding the Fosso Della Chiusa Creek

1
Department of Earth Sciences, University of Florence, Via G. La Pira 4, 50121 Florence, Italy
2
CNR-IGG Institute of Geosciences and Earth Resources, Via G. La Pira 4, 50121 Florence, Italy
3
Unione dei Comuni Amiata Val d’Orcia, Unità di Bonifica, Via Grossetana 209, Piancastagnaio, 53025 Siena, Italy
4
Parco Museo Minerario di Abbadia San Salvatore–Via Suor Gemma, Abbadia San Salvatore 1, 53021 Siena, Italy
5
INSTM—National Interuniversity Consortium of Materials Science and Technology, Via Giusti 9, 50121 Florence, Italy
*
Author to whom correspondence should be addressed.
Submission received: 30 December 2020 / Revised: 8 February 2021 / Accepted: 9 February 2021 / Published: 20 February 2021
(This article belongs to the Special Issue Mercury in Fluvial Systems: Distribution and Cycling Processes)

Abstract

:
The Galleria Italia waters drain the complex tunnel system of the former Hg-mining area of Abbadia San Salvatore (Tuscany, central Italia) and feed the 2.5 km-long Fosso della Chiusa creek. The mining exploitation was active for more than one century and more than 100,000 tons of liquid mercury were produced by roasting processes of cinnabar (HgS). In this work, a discontinuous geochemical monitoring of the Galleria Italia circumneutral waters was carried out from February 2009 to October 2020, during which the main physicochemical parameters, main and minor dissolved species and trace elements (including Hg) were determined. In the observation period, significant variations in the water chemistry were recorded, particularly when flooding waves, due to intense precipitations, occurred, with the two main events being recorded in February 2009 and January 2010. The chemical composition of the Galleria Italia waters was Ca(Mg)-SO4 and related to congruent dissolution of gypsum/anhydrite at which a contribution from carbonatic and silicatic minerals and partial solubilization of CO2 and and H2S oxidation is to be added. Regarding the trace elements, Al, Mn and Fe were up to 1500, 768 and 39520 μg L−1, with these elements also showing high contents in the sediment precipitating by the Galleria Italia waters. In most cases, dissolved mercury was below the instrumental detection limit (<0.1 μg L−1), although occasionally it reached >1 μg L−1. Considering a mean flow rate of 40 L s−1 of the discharged water, the amount of dissolved mercury released from Galleria Italia was computed, although most mercury was occurring in the sediment (1.2 mg kg−1). A more realistic computation of mercury released from Galleria Italia should involve a sampling network along the Fosso della Chiusa before entering the riverine system of the Tiber basin, into which dissolved and suspended mercury are to be determined along with that occurring in the sediments.

1. Introduction

Mine drainage is mostly considered to be acidic (pH < 5) although circumneutral (pH between 6 and 8) to basic (pH > 8) waters are also found. The redox and pH conditions of these waters are expected to control the concentrations of toxic metals, mostly heavy metals and metalloids. Acidic Mining Drainage (AMD) has received a lot of attention, likely due to the sometimes devastating effects on the environment resulting from the oxidation of pyrite and other poly-metallic sulfides (e.g., [1,2,3,4]). Pyrite tends to be altered at surface conditions, as follows (e.g., [5])
FeS2(s) + 15/4O2(aq) + 7/2H2O = Fe(OH)3(s) + 2SO42−(aq) + 4H+(aq)
Conversely, circumneutral mine waters (e.g., [6] and references therein) have been less investigated. They can be related to interaction processes between meteoric waters and rocks containing low contents of metal- and metalloid-sulfides. The neutralizing agents of the acidic waters resulting from sulfide oxidation are carbonate- (e.g., CaCO3 and MgCO3) and silicate-bearing (e.g., feldspars) rocks (e.g., [7])
CaCO3 + H+ = HCO3(aq) + Ca2+(aq)
CaAl2Si2O8(s) + 2H+(aq) + H2O = Ca2+(aq) + Al2Si2O5(OH)4(s)
Thus, mixing between acidic and circumneutral waters or water–rock interactions with low sulfide-bearing silicatic rocks produce a slightly acidic or neutral pH that favors the precipitation of metals as oxy-hydroxides and gypsum. Consequently, circumneutral waters contain lower concentrations of toxic elements than those recorded in acidic waters. Nevertheless, trace elements can be dissolved at slightly higher or near to acceptable concentrations whereas those of sulfate may remain high (e.g., [4,8,9]), thus requiring decontamination treatment technologies (e.g., [10,11]). Among the trace elements that can be found dissolved in circumneutral waters, arsenic and, to a lesser amount, antimony showed concentrations up to mmol L−1 ([12]). According to [13], mining waters with pH approaching neutrality can indeed be of environmental concern, since the mobilization of chalcophile elements can occur.
To the best of our knowledge, few studies relate to the concentration of mercury in circumneutral waters (e.g., [8,10,11]), and intending, at least partially, to fill this gap, in this work, we have analyzed the waters discharged from Galleria Italia that represent the draining waters of the tunnels drilled in the former Hg-mining area of Abbadia San Salvatore (Tuscany, central Italy), from which cinnabar was exploited to produce liquid mercury. Since these meteoric-fed waters showed variations in terms of flow rate, from 2009 to 2020, periodic discontinuous samplings were carried out to evidence possible chemical changes by investigating the main physicochemical parameters and geochemistry and selected trace elements, including mercury. The Galleria Italia waters are the main supply of the Fosso della Chiusa, a small creek that enters the river network of the Tiber basin. Consequently, evaluating the presence of mercury and other toxic elements is of environmental importance.

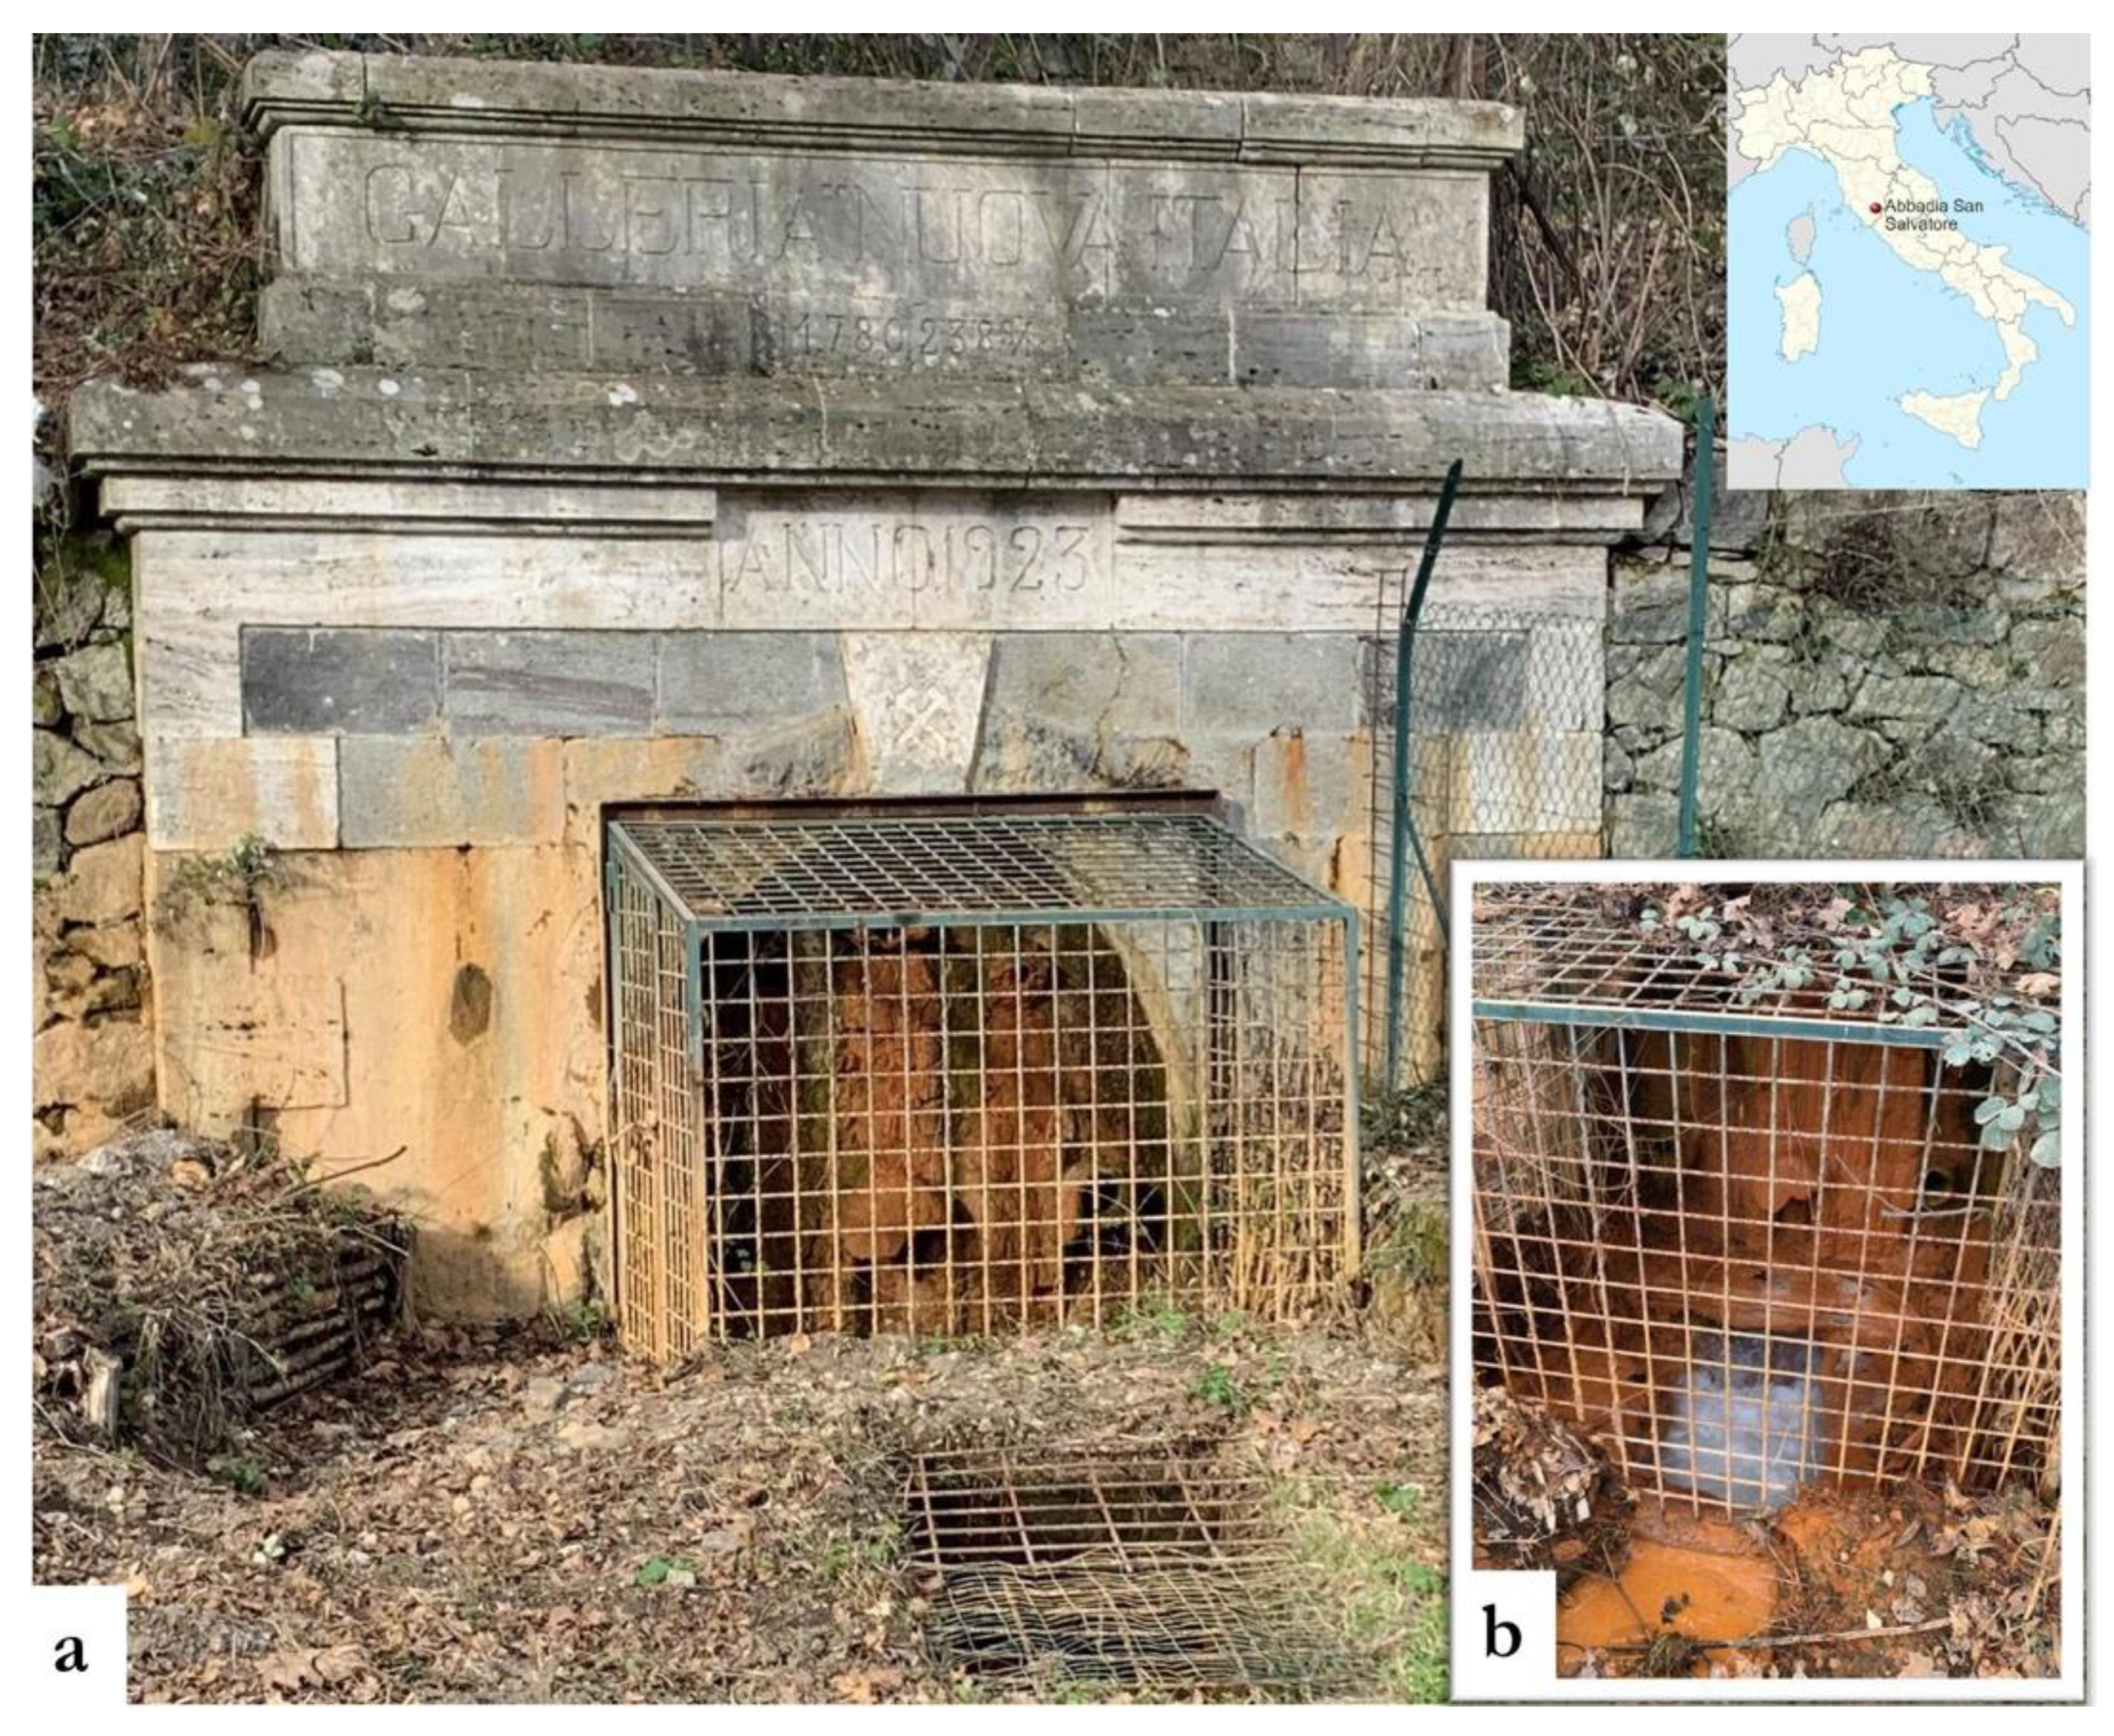
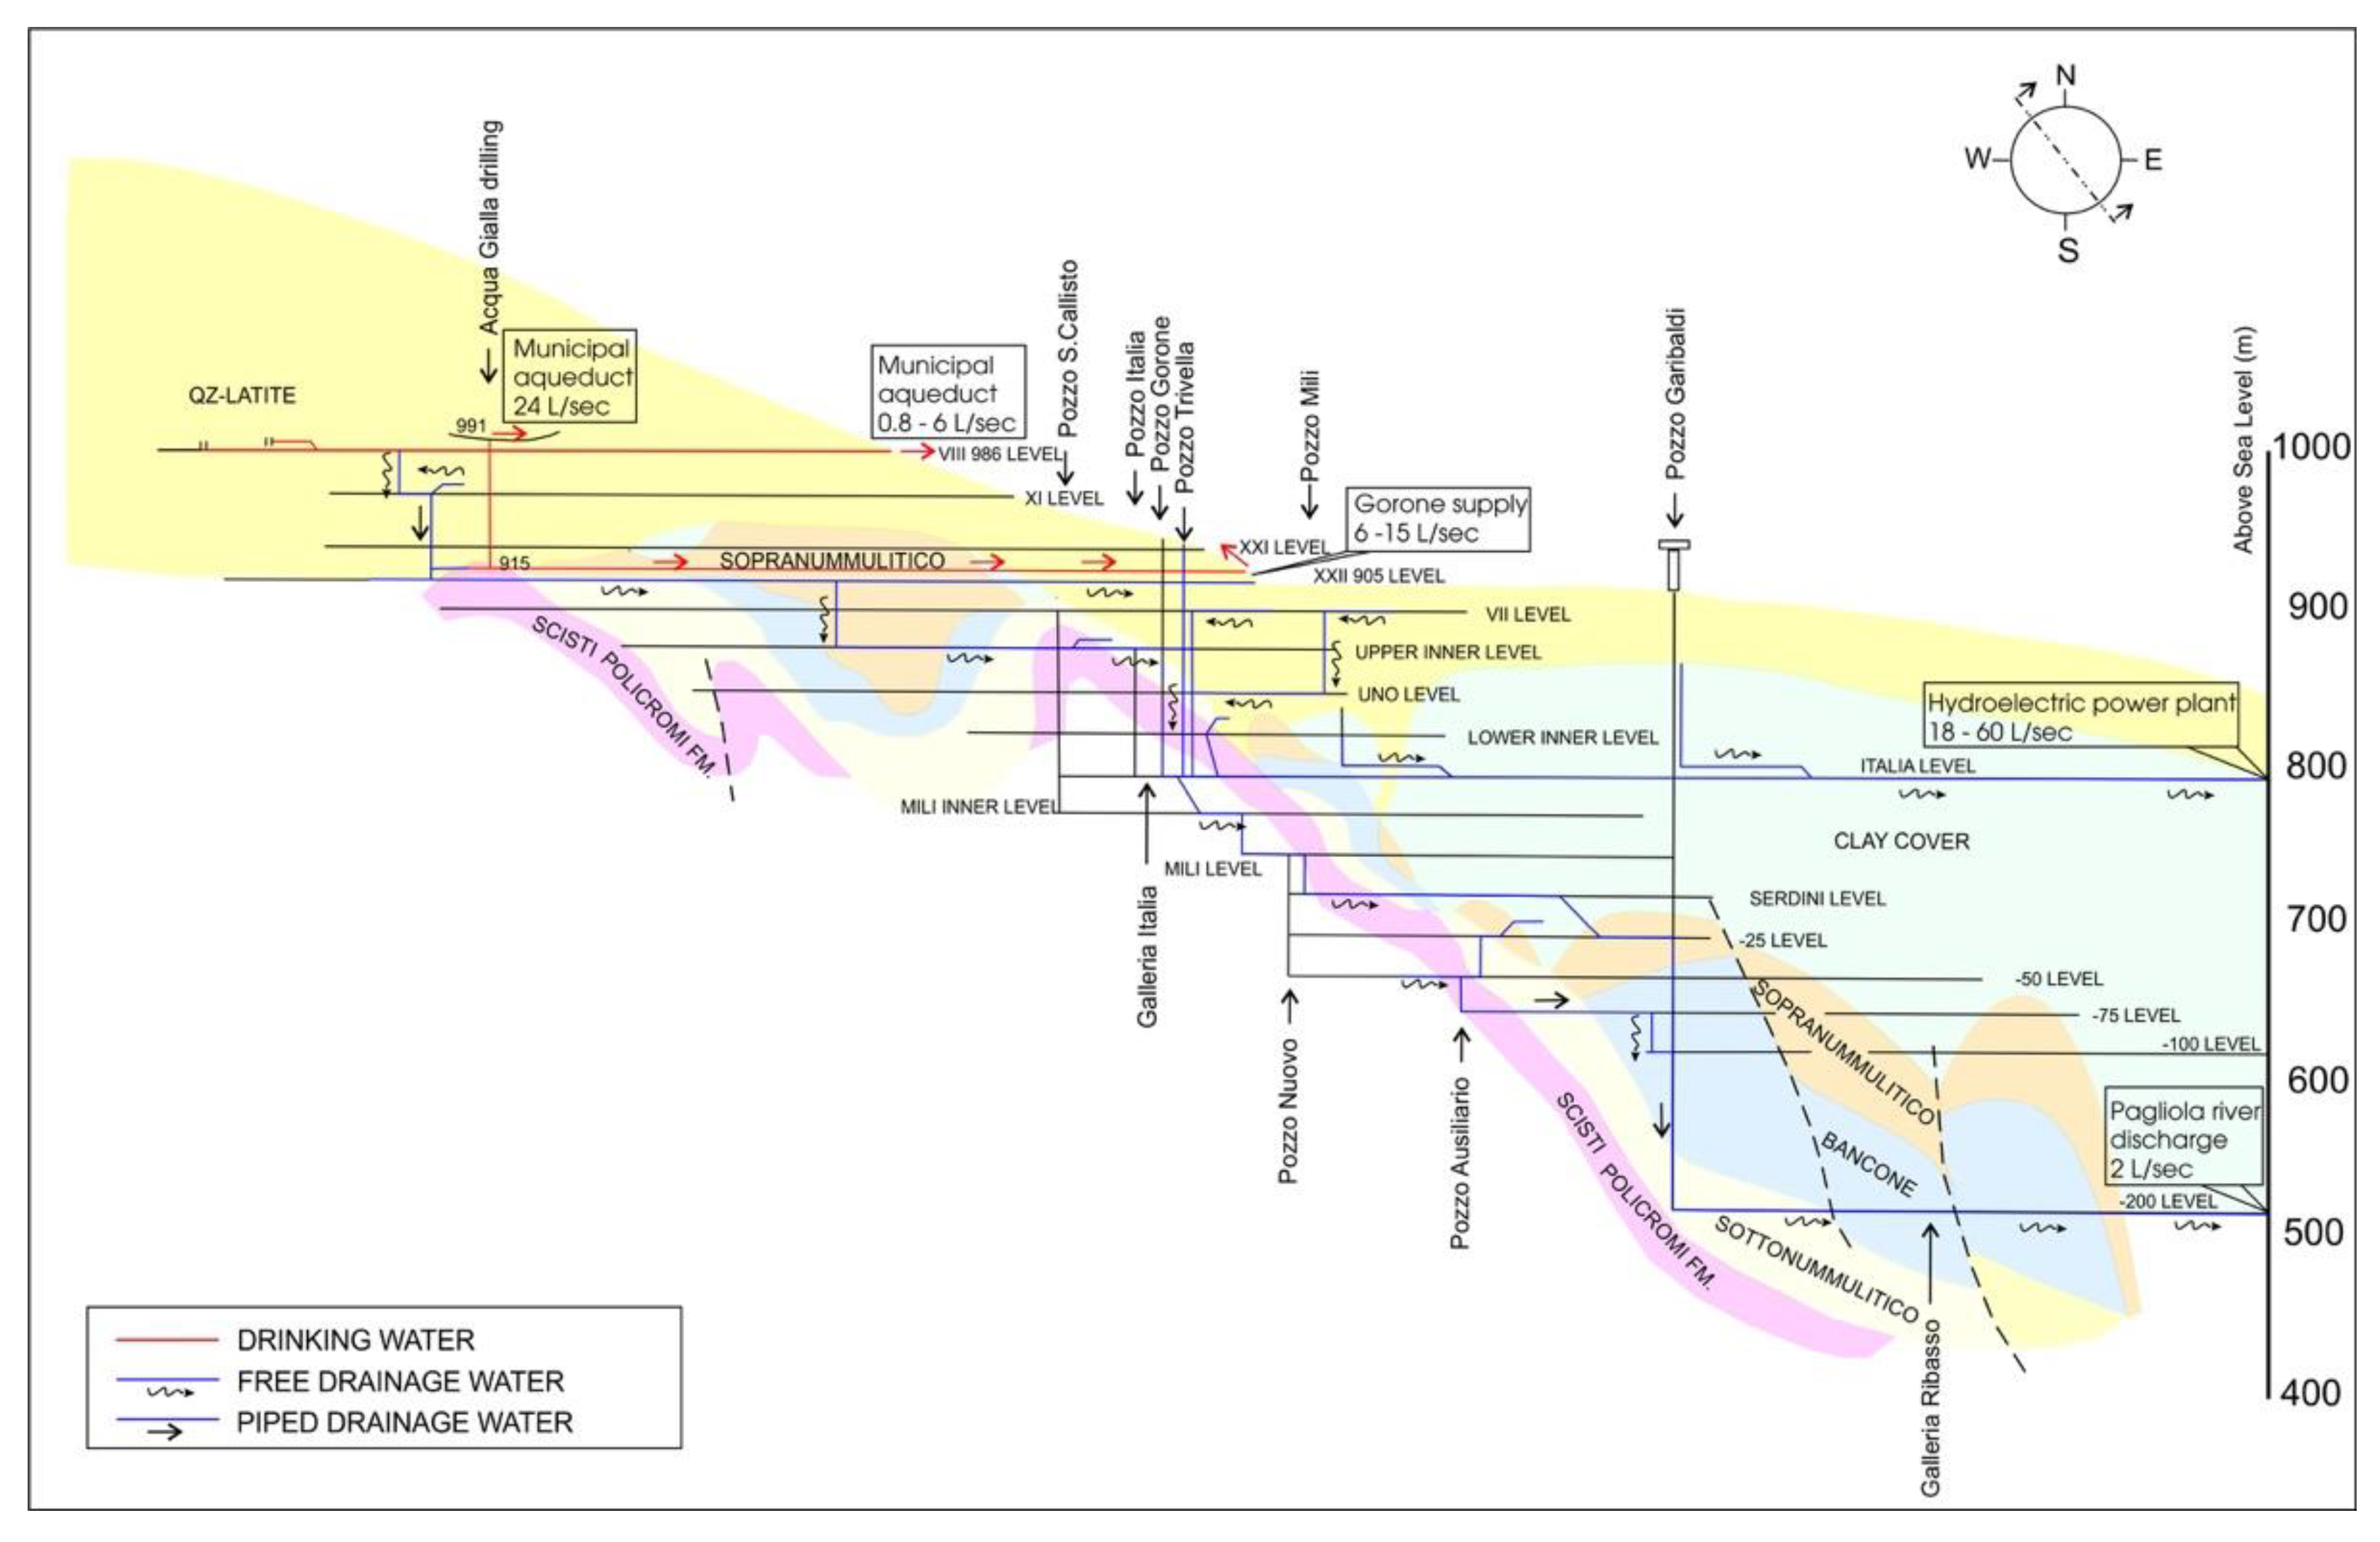
2. Geological Outlines and the Study Site

The Mt. Amiata mining district was one of the most important areas worldwide for the production of mercury, whose activity lasted for more than one century (1847–1976). The Hg(cinnabar)-ore deposits were found in both sedimentary formations and volcanic rocks, the latter being related to the 200–300 ka old Mt. Amiata volcano. The origin of the ore deposits is still matter of debate, although [14,15,16,17] argued that a complex mobilization process of mercury (and antimony) affecting the Paleozoic phyllites occurred between the Late Oligocene and Early Miocene. Then, a second mobilization (Pliocene to Pleistocene) was invoked for the formation of the Mt. Amiata epithermal deposits. According to [18], the mobilization/deposition process is still ongoing. At least 15 sites in the Mt. Amiata mining district were operating to exploit cinnabar (e.g., [19]), but that of Abbadia San Salvatore (Figure 1a) was by far the most important. It was estimated that more than 100,000 tons of liquid mercury were produced (e.g., [20]). The environmental impact due to the production of mercury has left most of the geological and biological compartments, as well as the mining structures, polluted (e.g., [21,22,23,24,25,26,27,28,29,30,31,32,33,34,35,36,37,38,39,40,41,42,43]). Surface and ground waters were evidenced to be particularly affected by the presence of high mercury concentrations (e.g., [36] and references therein). The waters from Galleria Italia (42°53′4.9″ N, 11°40′32″ E; emerging at 786.50 m a.s.l.) are discharged slightly below the urban center of Abbadia San Salvatore. They play a key role in the management of the mining waters since they are convoyed to Galleria Italia (Figure 1a,b). In the past, there was another water discharge system at the Galleria Ribasso–200 m (42°53′17′′ N, 11°41′53′′ E; altitude 511.50 m a.s.l.), which was not functioning when the water monitoring at Galleria Italia started in 2009. It was suggested that the collapse of the Galleria Ribasso−200 m is preventing any outflow at the surface [44]. To date, a schematic geological section with the hydrogeological circuit of the mining tunnels in the former mining area of Abbadia San Salvatore is reported in Figure 2. The mean flow rates, measured by the personnel of the local municipality, are also reported. It is notable that, from 2009 to 2020, the flow rates of the Galleria Italia waters showed a mean value of 40 L s−1, although they ranged from 20–30 up to 110 L s−1 [44]. A few meters after the emergence, half of the flow rate is diverted to feed a small hydroelectric plant, named “La Turbina”.
No direct access to the mining tunnel was possible, since it was cemented after the closure of the mining activity and only few nozzles were left, to allow the water to flow through [45]. According to the miners, thermal waters (ca. 35–37 °C) were observed and they were mixed with the main drainage system before emergence (M. Niccolini, pers. comm.). The Galleria Italia waters, which are reddish-whitish in color, feed the Fosso della Chiusa creek, which, in turn, enter the Pagliola River after about 2.5 km. Eventually, these surface waters reach the Paglia River, and then the Tiber River [46]. This implies that variations in the physicochemical parameters and the water chemistry can be regarded as diagnostic of the geochemical processes occurring inside the underground mining structures and a good proxy for evaluating the effects of potential contaminants entering the riverine network. During the monitoring activity, three important events occurred: (i) a flow wave on the 12th of February, 2009 (a similar phenomenon was reported to occur in 2006); (ii) an abrupt change in the water color on the 17th of February, 2009 when the waters turned from a reddish color, typical of the presence of suspended Fe-oxy-hydroxides, to milky reddish-whitish, indicating the presence of suspended Al-compounds, as also suggested by the chemical composition of the precipitating material; (iii) a flow wave on the 10th of January, 2010, though less intense than that of February 2009. Further details on these events, mostly related to extraordinary precipitations that provoked a flow rate increase >110 L s−1, are reported in [44].

3. Sampling and Analytical Methods

From January 2009 to October 2020, 42 water samplings were carried out at the emergence of Galleria Italia. The water turbulently outflows and enters after 70 cm in a small (80 cm wide) channel. The water (about 20 cm thick) rapidly flows away in a turbulent regime and feeds the Fosso della Chiusa creek. Temperature, pH and electrical conductivity were measured in situ with portable instrumentations (Crison MM40+ and HI98194, respectively; HACH, Barcelona, Spain). During each sampling, four aliquots were collected: (i) 0.45 mm filtered sample in 125 mL PE bottles equipped with counter-cap for anions and NH4+; (ii) 0.45 μm filtered and acidified (1% suprapur HCl) sample in PE 50 mL bottles for Na, K, Ca and Mg; (iii) 0.45 μm filtered and acidified (1% suprapur HNO3) sample in PE 50 mL bottles for trace elements (Al, B, Fe, Mn, Co, Cr, Ni, As, Sb, Zn and Sr); (iv) 0.45 μm filtered and acidified (1% suprapur HCl) in 75 mL dark glass bottles for mercury. The bottles were cleaned prior to sampling several times with MilliQ water and dilute HCl. Blank analyses produced Hg concentrations < 0.1μg L−1. The sediment, <10 cm thick and reddish in color, was collected at the water emergence with a plastic scoop and transferred to a plastic bag and analyzed for some major (Na, K, Ca, Mg, Al, Fe) and trace elements (Mn, Cr, Ni, Zn, As, Sb and Hg). Bicarbonates were measured by acidimetric titration with 0.01 N HCl and methyl-orange as indicators. The main anions and cations were determined by ion-chromatography using a 761 Compact IC and an 861 Advanced Compact IC (Metrohm, Herisau, Switzerland), respectively. Ammonium was measured by molecular spectrophotometry (DR2010 HACH, Barcelona, Spain) by the Nessler method. The analytical error for these dissolved species was < 3%. Trace elements in water were analyzed by ICP-MS (Model 7500CE Agilent, Santa Clara, USA; method: EPA 6020B 2014) at the CSA Research Group of Rimini (Italy), accredited by group ACCREDIA. Appropriate internal standards, e.g., 6Li, 45Sc, 89Y and 115In, were used to set up the ICP-MS instruments. Specific details on the ICP-MS set up are reported in [47,48]. The QA/QC protocol for ICP-MS is reported in Table S1 (Supplementary Materials). In the laboratory, the sediment, consisting of an impalpable powder, was dried at 40 °C. Then, 0.5 g were digested in aqua regia and the trace elements were analyzed by ICP-AES (720ES Agilent, Santa Clara, USA; method EPA 200.7). Dissolved and total mercury was determined by DMA-80 (Direct Mercury Analysis; Milestone, Sorisole (BG), Italy), in full compliance with EPA method 7473. DMA allows to determine Hg by thermal decomposition, mercury amalgamation and atomic absorption spectrometry with pure (>> 99.999%) O2 as a carrier (e.g., [49] at the CSA Research Group of Rimini (Italy). The analytical error was <10%.

4. Results

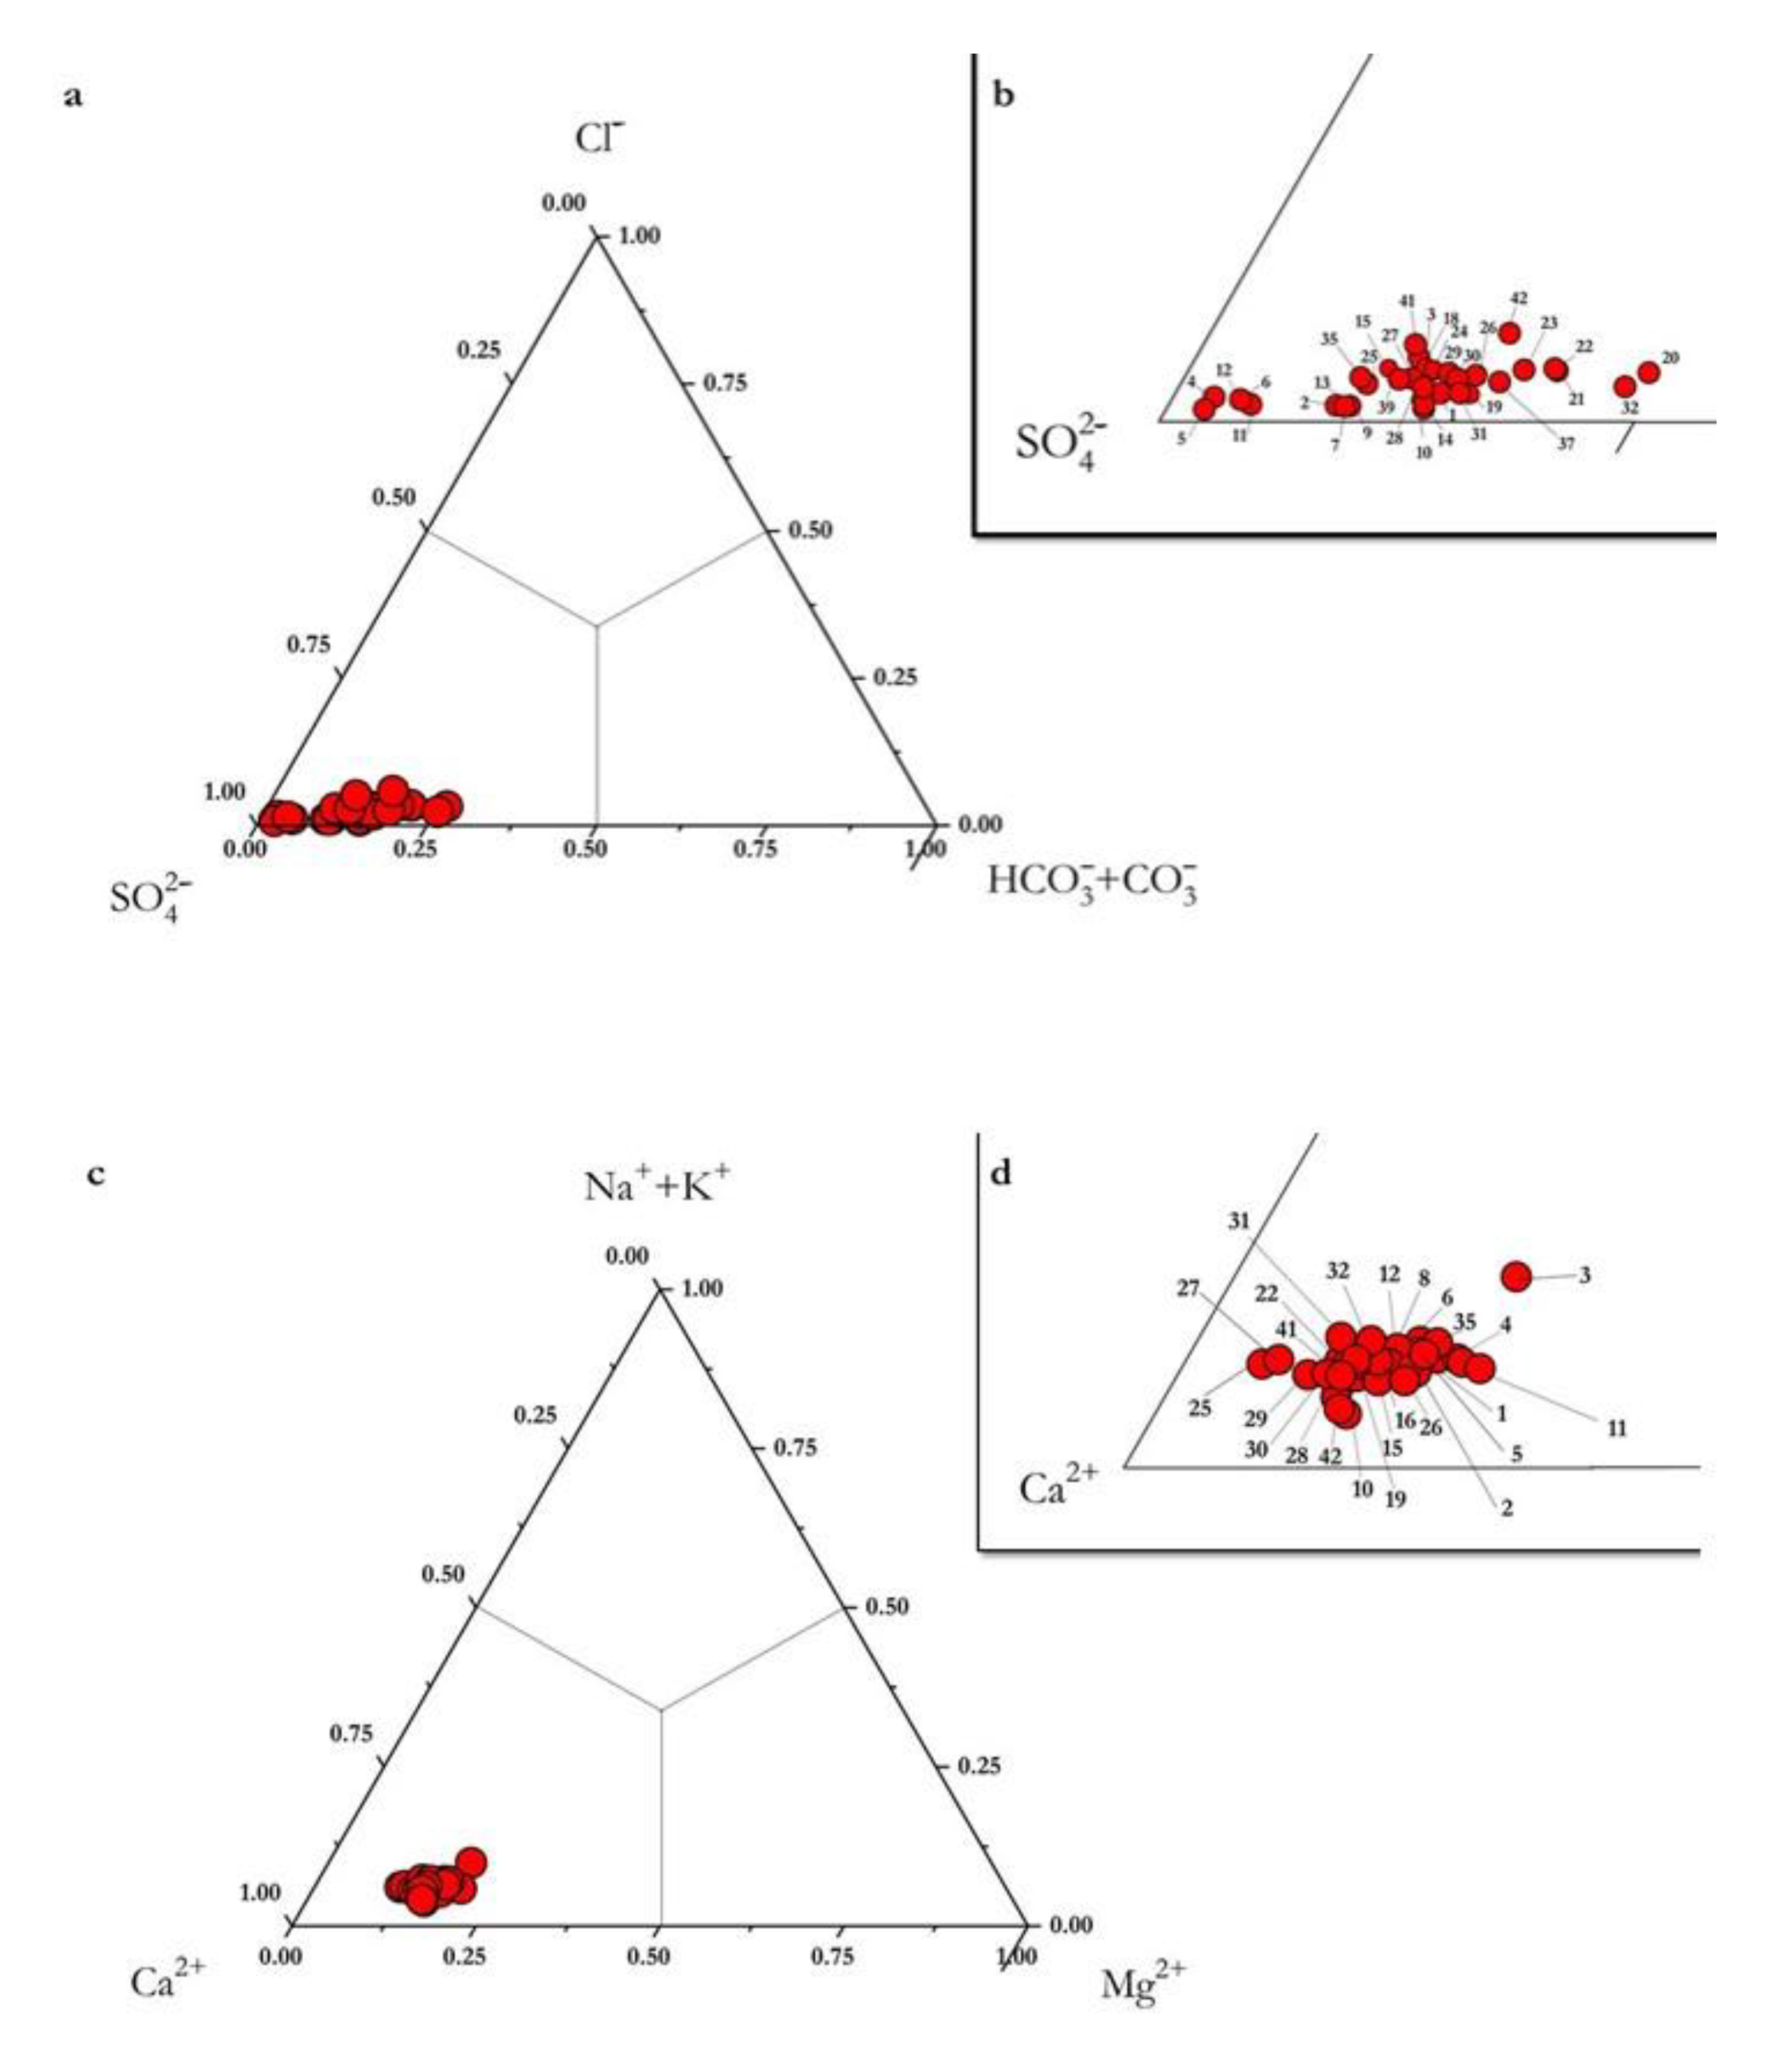
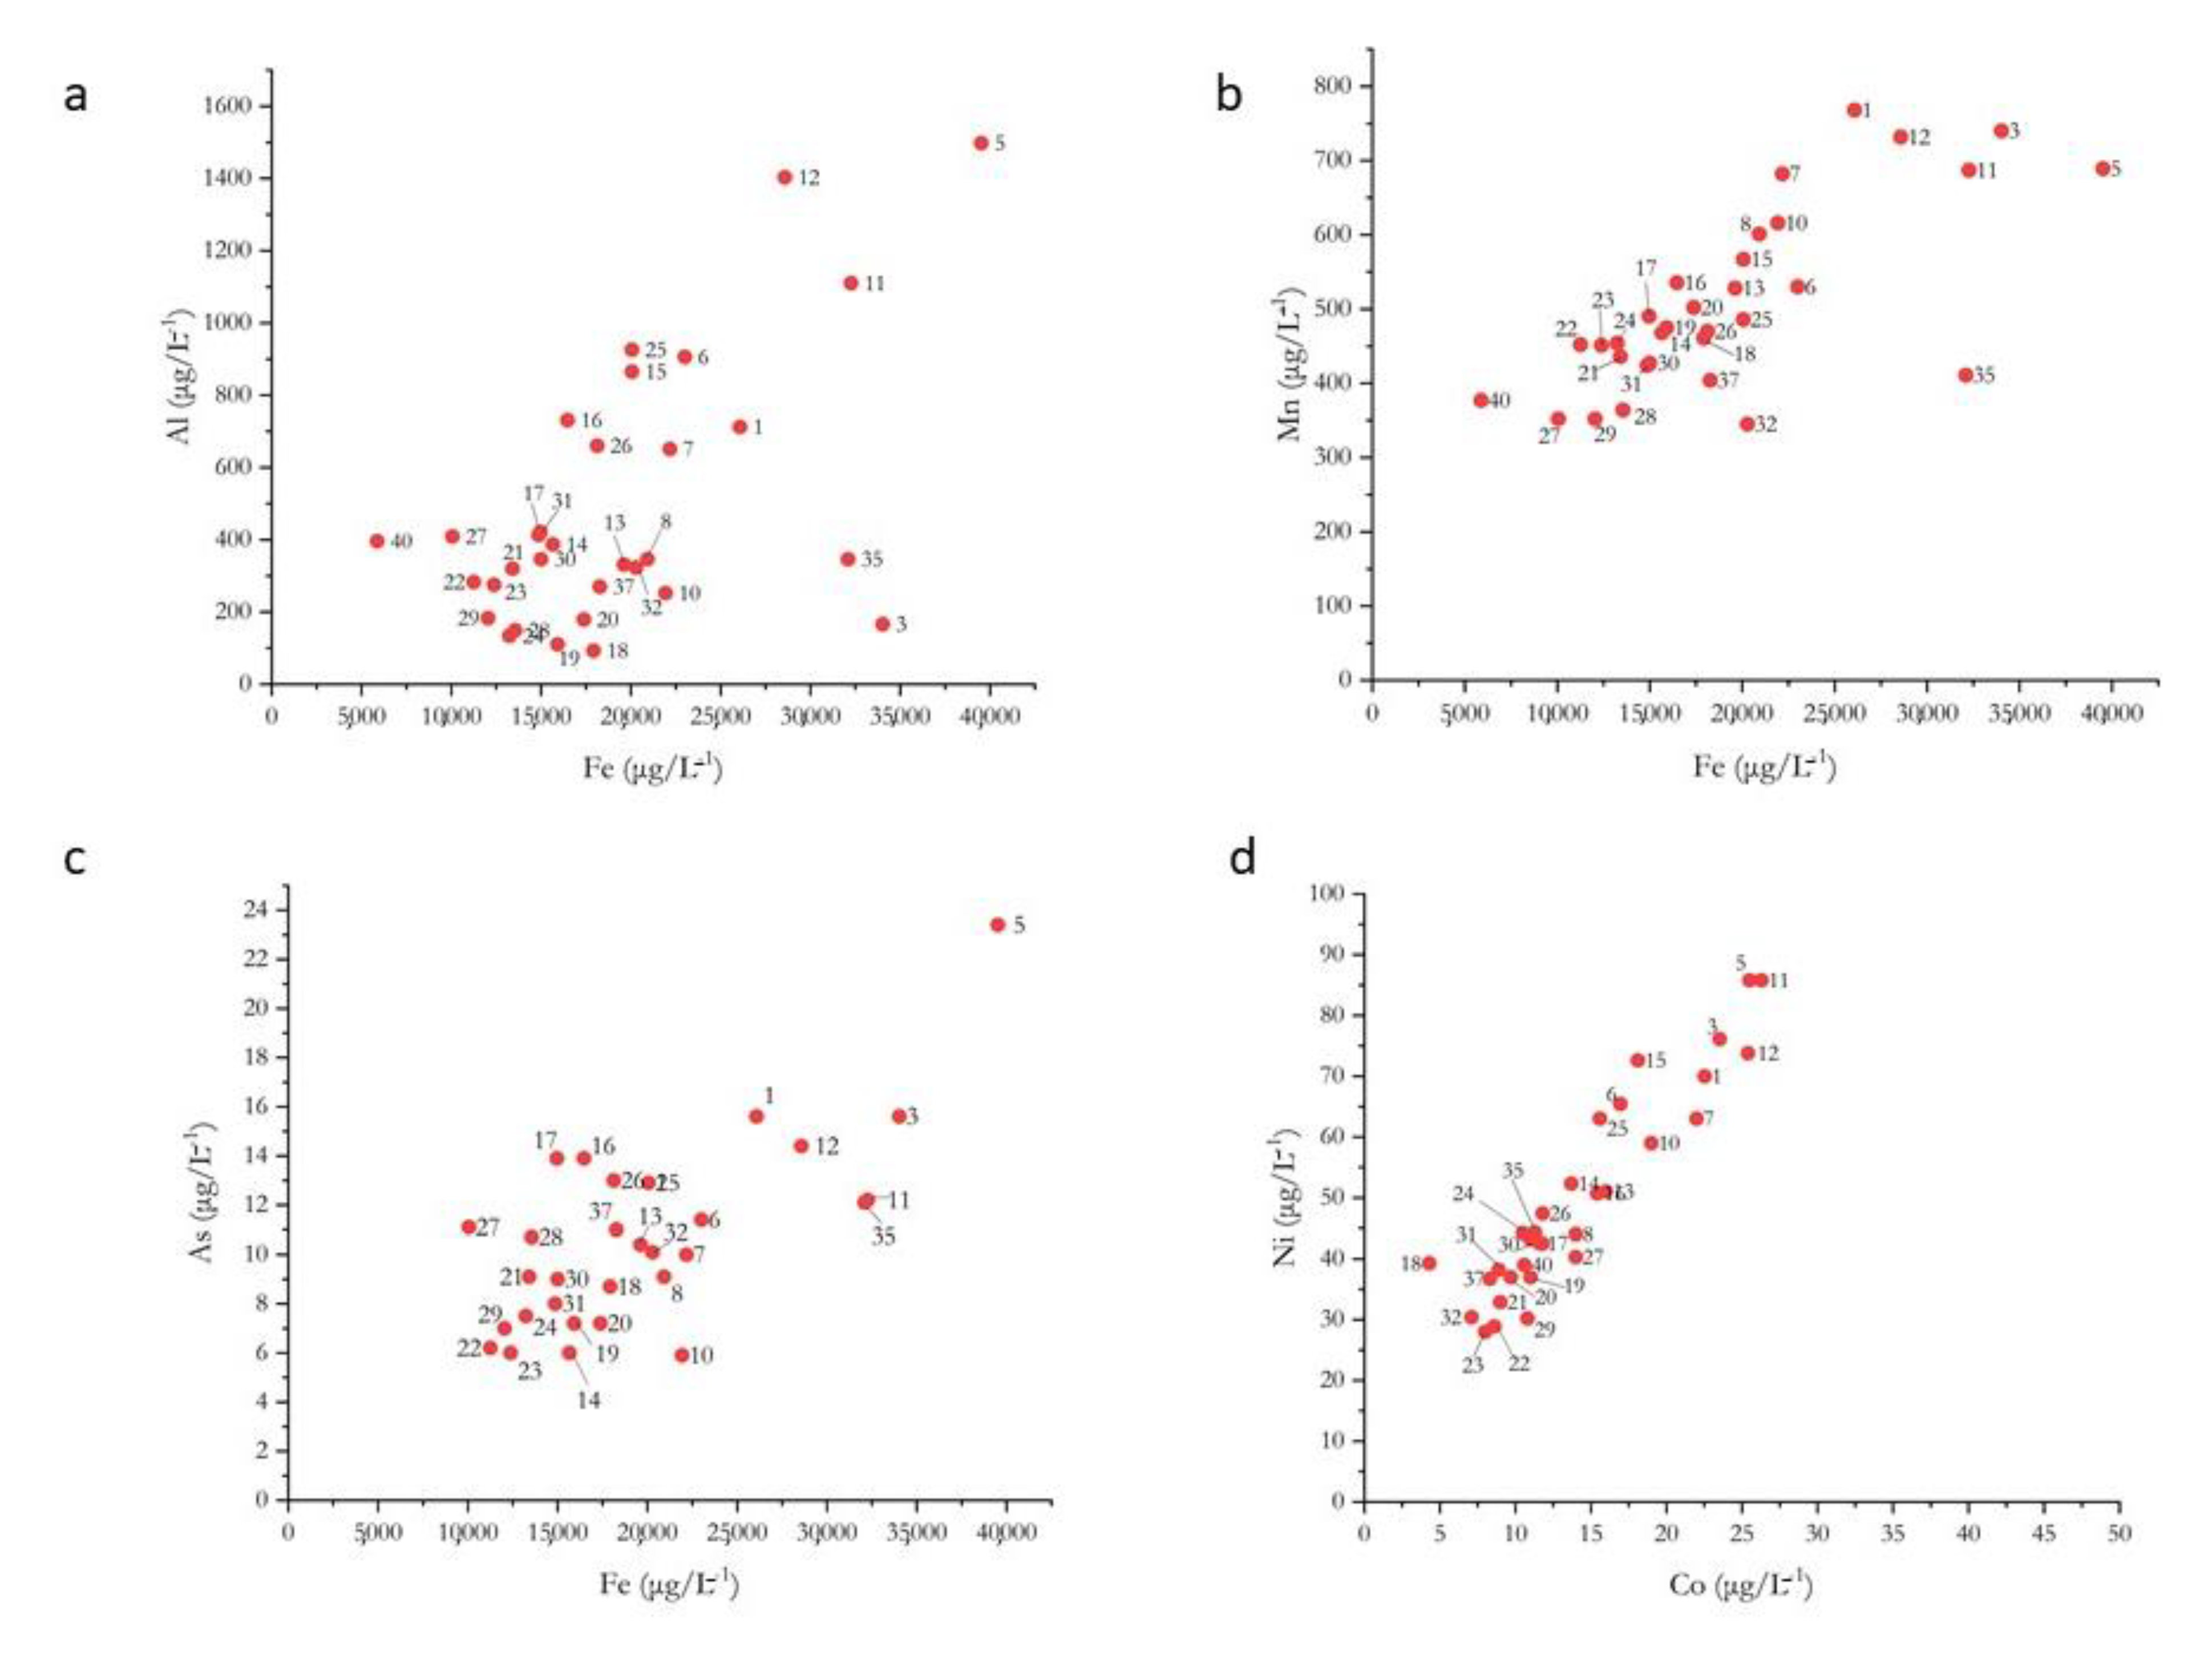
4.1. Water Geochemistry

Temperature (in °C), pH and the concentration (in mg L−1) of the main and minor dissolved species determined in the last 12 years for the Galleria Italia waters are reported in Table 1, along with the sampling date, Total Dissolved Solids (TDS). The electroneutrality parameter calculated according to [50] was always < 5%. Not all the geochemical parameters were determined for the waters collected in September 2017, January 2018, November 2018, May 2019 and January 2020 and they were only partially analyzed (Table 1). Each sample was identified with a progressive number and these numbers were used in the geochemical diagrams. The minimum, maximum and mean values of temperature, pH and TDS (in mg L−1) were 7.6, 18 and 14.8 °C, 5.45, 6.99 and 6.16 and 757, 1567 and 962 mg L−1, respectively. In most cases, the lower the pH the higher the TDS values, which is likely related to a higher leaching capacity and a higher concentration of dissolved CO2 [44]. Moreover, the highest TDS value was recorded a few days after the February 2009 flooding wave. According to the cation and anion triangular diagrams (by recalculating the concentrations in meq L−1 to 100%) reported in Figure 3, and the pH values, the Galleria Italia waters can be classified as circumneutral and Ca(Mg)-SO4 in composition. The Ca and SO4 concentrations varied from 180 and 342 mg L−1 and 403 and 996 mg L−1, respectively, while those of Mg were between 16.5 and 48 mg L−1. HCO3, the second most abundant anion, had concentrations between 21 and 213 mg L−1. Notably, the lowest contents of bicarbonates were recorded after the flood events and they started to recover after December 2009. Na, K and Cl were always below 20, 37 and 26 mg L−1, respectively. Finally, NH4, F and NO3 never exceeded 9.3, 2.02 and 2.8 mg L−1, respectively.
The selected trace element concentrations (in μg L−1), ordered according to the increasing atomic number, are listed in Table 2. Despite the circumneutral pH values, high concentrations of Fe, Mn, and Al (up to 39,520; 768 and 1500 μg L−1) were measured. When measured, the Sr contents were always above 176 μg L−1. Boron, zinc, cobalt and nickel varied between 20.5 and 96.5, 33.6 and 244, 4.3 and 26.3, and 28 and 86 μg L−1, respectively. In most cases, Cr and Sb were below the instrumental detection limit (0.1 μg L−1), while those of As were comprised between 5.9 and 23.4 μg L−1. Finally, Hg showed concentrations up to 25.6 μg L−1, although they were < 0.1 μg L−1 in 15 samples out 38 (Table 2) and only eight samples had concentrations > 1 μg L−1.

4.2. Sediment Geochemistry

The concentration of the main (Na, Mg, Al, K, Ca and Fe) and trace (Cr, Mn, Ni, Zn, As, Sb and Hg) elements in the sediment precipitating from the Galleria Italia waters is reported in Table 3 and they refer to the mean values of three sampling campaigns carried out between 2009 and 2010. Iron and Al showed by far the highest contents, since they were of 37.20 and 4.42 wt.% whereas Na, K, Ca and Mg were below 0.7 wt.%. Mn, As and Zn were characterized by contents of 257, 192 and 191 mg kg−1, respectively, whereas Cr, Ni and Sb showed concentrations of one order of magnitude less than those of the other analyzed trace elements, with the exception of that of mercury, whose content was of 1.2 mg kg−1.

5. Discussion

5.1. Origin of Solutes

The Galleria Italia waters can be classified as belonging to the circumneutral waters, with the pH values clustering around 6.2 and characterized by a Ca(Mg)-SO4 geochemical facies (Figure 3), as also evidenced by the (Ca + Mg) + SO4 vs. TDS (in mg L−1) diagram (Figure 4). In most cases, these ions represent > 80% of the TDS, whereas the other main ions (HCO3, Cl, Na and K) are subordinate. These chemical features are similar to those recorded for the surface and ground waters occurring inside the former mining area of Abbadia San Salvatore and whose origin was referred to water–rock interaction processes where relatively soluble minerals (e.g., sulfates and, at minor extent, carbonates) are involved along with a silicate component [36]. When SO4 (in meq L−1) is subtracted to the sum of Ca + Mg (in meq L−1), most water samples are stoichiometrically associated with HCO3, suggesting that carbonate dissolution also contributes to the geochemical features of the Galleria Italia waters. The Na/Cl ratio (in meq L−1) is always higher than the stoichiometry and seawater ratios, thus indicating the presence of a Na-silicate contribution.
According to [44], sulfate can also be related to both oxidation processes of polymetallic-sulfides and H2S, as supported by the δ34S-SO4 values and alteration processes of calcine and slags operated by meteoric waters feeding the Galleria Italia waters [36]. As observed by [51,52], the Mt. Amiata waters can be distinguished into four groups: (i) low TDS (<250 mg L−1) waters with (Na + K)/(Ca + Mg) and (HCO3)/(Cl + SO4) ratios close to 1 and circulating in the Mt. Amiata volcanics; (ii) Ca-HCO3 waters with TDS of about 400 mg L−1 and associated with Mesozoic carbonate and Oligo-Miocene turbidites; (iii) waters with TDS > 2000 mg L−1 and temperatures up to 50 °C [53] and belonging to a Ca(Mg)-SO4(HCO3) composition, since they circulate in evaporitic–carbonatic formation; iv) SO4-rich acidic waters. In addition, Na-Cl were found to characterize the geothermal fluids exploited in the eastern-southern part of Mt. Amiata [51].
The Galleria Italia waters, characterized by low contents of Na and Cl (Table 1), can be regarded as compositionally intermediate between the previously reported first three types of waters. This composition could suggest that a thermal component occurring inside the mining tunnels, as reported by some miners, is likely.
As previously mentioned, relatively high concentrations of Fe, Mn and Al were measured in both the Galleria Italia waters and sediments (Table 1 and Table 2). Normally, these elements tend to be immobile during chemical alteration processes. However, such high contents can be indicative of relatively acidic and/or reductive conditions inside the Galleria Italia to favor the formation of hydroxylate complexes or, with the sulfate ion, allowing the presence of these elements in solution even when dilution processes with shallower waters occur. It can be suggested that the relatively slow kinetic processes do not prevent their precipitation before the Galleria Italia waters emerge at the surface. This is supported by their high contents in both the water and the sediment. The As behavior is peculiar since it tends to be strongly enriched in the solid phase (Table 3), although in solution the concentration is often higher than 10 μg L−1, which is the maximum permissible concentration for drinkable waters.
It is notable that the access inside the Galleria Italia is presently not viable and, consequently, the geochemical processes governing the composition of the circumneutral drainage waters of the former mining area of Abbadia San Salvatore can only be hypothesized. Fe, Al, Mn and As can, however, be related to a common origin (e.g., [54,55]), as also shown in Figure 5a–c.
As far as the relatively high contents of Ni and Co in the Galleria Italia waters, which are characterized by a positive correlation (Figure 5d), are concerned, they are likely due to dissolution processes of Ni-sulfides such as millerite and vaesite (e.g., [19] and references therein), while Zn concentrations may be related to the presence of sphalerite. Finally, Sr tends to replace Ca, and thus its origin can be ascribed to gypsum/anhydrite dissolution, while the contents of boron are a further clue to the presence of thermal waters, likely discharging into the drainage waters inside the Galleria Italia [56].
According to the chemical data reported in Table 1 and Table 2, from 2009 to 2020 significant variations are recorded. Since there are no data about the flow rates during the monitored period, to verify the temporal variations and highlight possible significant changes due to either climatic events, such as those occurring in February 2009 and January 2010, or modifications in terms of relationships between the deep and shallow component, the analytical ratios (in meq L−1) were then considered. The latter are not affected by flow rate variations, although the mean flow rate was of about 40 L sec−1 (F. Piccinelli, pers. comm.). The temporal variability of the Ca/SO4 and HCO3/SO4 ratios is reported in Figure 6, where Ca is mostly related to dissolution processes of sulfate and carbonate minerals and SO4 may record congruent dissolution of gypsum/anhydrite and sulfide oxidation. HCO3 can be regarded as derived by both the dissolution of carbonate phases and CO2. In the diagrams of Figure 6, the February 2009 and January 2010 events are also evidenced. The considered ratios move in a synchronous way, i.e., the higher the Ca/SO4 ratio the higher that of HCO3/SO4. The flooding events do not seem to affect the considered ratios since, during the February 2009 event, the Ca/SO4 and HCO3/SO4 ratios are much lower than those recorded after December 2011 and, with a few exceptions, April 2017. The Ca/SO4 and HCO3/SO4 ratios show a tendency to increase with time after December 2009 although no significant pH variations were observed (Table 1). No indicative relationships were observed in terms of trace elements (including mercury). This decoupling may suggest that inside the Galleria Italia, an interplay between deep and shallow waters (both of meteoric origin, e.g., [44]) could govern the observed chemical variations. Nevertheless, more information about the geochemical processes can only be gathered by following the water path inside the Galleria Italia.

5.2. Mercury

As mentioned, the concentrations of mercury in solution (Table 2) are relatively variable although, in most cases, the contents were below the instrumental detection limit. Only occasionally were they higher than the maximum permissible concentration (1 μg L−1) for drinkable water. However, it is a matter of fact that most mercury is stored in the sediments (Table 3). Nevertheless, it was possible to compute the amount of dissolved mercury discharged from Galleria Italia by considering a reference value of 1 μg L−1 and a flow rate of 40 L s−1. According to this computation the amount of dissolved mercury discharged from Galleria Italia is of about 1.26 kg y−1. It is clear that this Hg load may be decreasing along the 2.5 km long Fosso della Chiusa creek, since mercury may be precipitating and allocated in the sediment. Conversely, the discharged mercury may be increasing when higher concentrations were recorded although, according to our data, they tend to decrease in a relatively short time. However, this calls for a detailed investigation of the dissolved and suspended mercury to be correlated with that occurring in the sediments [57].
If the computed dissolved mercury released from Galleria Italia is compared to those calculated by [33] for the surrounding rivers of the Mt. Amiata mining district, our dissolved load is of orders of magnitude lower. This observation fits with the circumneutral waters of Galleria Italia when the (Hg + As + Sb) vs. pH binary diagram ([58] and references therein) is considered (Figure 7), since near-neutral waters tend to be less enriched in these chalcophile elements with respect to the typical waters from acidic mine drainage.

6. Conclusions

The waters from Galleria Italia represent the main drainage system of the mining tunnels of the former Hg-mining area of Abbadia San Salvatore. Consequently, they are the only way to possibly understand the geochemical processes occurring inside the exploited HgS-ore deposits. The infiltrating meteoric waters are indeed interacting with sulfide and carbonate-sulfate and silicate minerals, with the latter phases likely responsible for the circumneutral waters (Figure 7) recorded at the emergence of Galleria Italia. Nevertheless, the high concentrations of Fe, Al and Mn suggest that acidic waters may be occurring in the inner portions of Galleria Italia and buffered by alkaline hydrolysis processes. From 2009 to 2020, a relatively high chemical variability was recorded, suggesting that important changes were occurring due to climatic events and/or different degrees of mixing between a deep (thermal waters) and shallow (meteoric water interacting with the ore deposit) component. The concentrations of mercury were also variable although, in most cases, its content was < 1 mg L−1, being mainly hosted in the sediment precipitating from the Galleria Italia waters. A similar behavior was observed for As. This provides evidence that, despite being in an abandoned Hg-mining district, Hg does seem to significantly impact the Fosso della Chiusa waters, with this creek being fed by the Galleria Italia waters. A detailed investigation on both the dissolved and suspended mercury and sediments along the Fosso della Chiusa creek is presently taking place to better constrain the amount of mercury discharged in the lower reaches of the riverine network. Presently, Galleria Italia is not accessible since it was cemented in the 1980s when the mining activity terminated. However, in order to avoid further flooding events that may have stronger and more destructive impacts that those that occurred in 2009 and 2010, a better water and sediment management is required. This can only be achieved by restoring access to Galleria Italia. By doing so, the geochemical processes could further be constrained.

Supplementary Materials

The following are available online at https://0-www-mdpi-com.brum.beds.ac.uk/2076-3298/8/2/15/s1, Table S1: Description of QA/QC, the criterion of acceptability and the frequency adopted during the analysis of this work.

Author Contributions

Conceptualization, O.V., D.R., B.N., M.L.; methodology, O.V., J.C., M.L., B.N., F.T., F.M.; software, O.V., M.L., B.N.; investigation, O.V., M.L., B.N., J.C., F.T., F.M.; data curation, O.V., B.N., M.L., F.M.; writing—original draft preparation, O.V., M.L., B.N.; writing—review and editing, all authors; funding acquisition, O.V., D.R., F.T. All authors have read and agreed to the published version of the manuscript.

Funding

This research received no external funding.

Institutional Review Board Statement

Not applicable.

Informed Consent Statement

Not applicable.

Data Availability Statement

Data is contained within the article or supplementary material.

Acknowledgments

Many thanks are due to F. Bianchi, A. Esposito, M. Niccolini and F. Piccinelli for their help during the sampling sessions. Three anonymous reviewers and Georgiana Paun are gratefully acknowledged for their useful suggestions and comments to an early version of the manuscript.

Conflicts of Interest

The authors declare no conflict of interest.

References

  1. Nordstrom, D.K. Mine waters: Acidic to circumneutral. Elements 2011, 7, 393–398. [Google Scholar] [CrossRef]
  2. Nordstrom, D.K.; Blowes, D.W.; Ptacek, C.J. Hydrogeochemistry and microbiology of mine drainage: An update. Appl. Geochem. 2015, 57, 3–16. [Google Scholar] [CrossRef]
  3. Skousen, J.G.; Ziemkiewicz, P.F.; McDonald, L.M. Acid mine drainage formation, control and treatment: Approaches and strategies. Extr. Ind. Soc. 2019, 6, 241–249. [Google Scholar] [CrossRef]
  4. Galván, L.; Olías, M.; Cerón, J.C.; Fernández de Villarán, R. Inputs and fate of contaminants in a reservoir with circumneutral water affected by acid mine drainage. Sci. Total Environ. 2021, 762. [Google Scholar] [CrossRef]
  5. Stumm, W.; Morgan, J.J. Aquatic Chemistry—An Introduction Emphasizing Chemical Equilibria in Natural Waters; John Wiley & Sons, Inc.: Hoboken, NJ, USA, 1981; p. 470. [Google Scholar]
  6. Henne, A.; Hamilton, J.; Craw, D.; Paterson, D.; Southam, G. The influence of metal mobility on resource potential in circumneutral pH iron-rich copper mine waste rocks. J. Geochem. Expl. 2020, 219. [Google Scholar] [CrossRef]
  7. Lapakko, K.A. Preoperational assessment of solute release from waste rock at proposed mining operations. Appl. Geochem. 2015, 57, 106–124. [Google Scholar] [CrossRef]
  8. Banks, D.; Younger, P.L.; Arnesen, R.L.; Egil, R.; Iversen, E.R.; Banks, S.B. Mine-water chemistry: The good, the bad and the ugly. Environ. Geol. 1997, 32, 157–174. [Google Scholar] [CrossRef]
  9. Madzivire, G.; Gitari, W.M.; Kumar Vadapalli, V.R.; Ojumu, T.V.; Petrik, L.F. Fate of sulphate removed during the treatment of circumneutral mine water and acid mine drainage with coal fly ash: Modelling and experimental approach. Min. Engin. 2011, 24, 1467–1477. [Google Scholar] [CrossRef] [Green Version]
  10. Mare, J.P. Sulphate Removal from Industrial Effluents; University of the Free State: Bloemfontein, South Africa, 1988. [Google Scholar]
  11. Bosman, D.J.; Clayton, J.A.; Maree, J.P.; Adlem, C.J.L. Removal of sulphates from mine water with sulphide. In Proceedings of the Lisbon 90 International Symposium: Acidic Mine Water in Pyritic Environments, Lisbon, Portugal, 16–19 September 1990; p. 16. [Google Scholar]
  12. Asta, M.P.; Nordstrom, D.K.; McCleskey, R.B. Simultaneous oxidation of arsenic and antimony at low and circumneutral pH, with and without microbial catalysis. Appl. Geochem. 2012, 27, 281–291. [Google Scholar] [CrossRef]
  13. Navarro, A. Hydrogeochemistry of circum-neutral mine waters in the Anglès old mining area, North Eastern Spain. In Advances in Hydrogeochemistry Research; Eslamian, S.S., Eslamian, F., Eds.; Nova Science Publishers: New York, NY, USA, 2020; pp. 1–21. [Google Scholar]
  14. Tanelli, G. Mineralizzazioni metallifere e minerogenesi della Toscana. Mem. Soc. Geol. It. 1983, 25, 91–109, (In Italian with English Abstract). [Google Scholar]
  15. Lattanzi, P.; Benvenuti, M.; Costagliola, P.; Tanelli, G. An overview on recent research on the metallogeny of Tuscany, with special reference to the Apuane Alps. Mem. Soc. Geol. It. 1994, 48, 613–625. [Google Scholar]
  16. Dini, A.; Benvenuti, M.; Costagliola, P.; Lattanzi, P. Mercury deposits in metamorphic settings: The example of Levigliani and Ripa mines (Apuane Alps, Tuscany, Italy). Ore Geol. Rev. 2001, 18, 149–167. [Google Scholar] [CrossRef]
  17. Regoli, R.; Berni, S. Ritrovamento di cinabro cristallizzato lungo il Fiume Farma (Siena, Toscana). Atti Museo St. Nat. Maremm. 2001, 19, 141–147, (In Italian with English Abstract). [Google Scholar]
  18. Morteani, G.; Ruggieri, G.; Möller, P.; Preinfalk, C. Geothermal mineralized scales in the pipe system of the geothermal Piancastagnaio power plant (Monte Amiata geothermal area): A key to understand the stibnite, cinnabarite and gold mineralization of Tuscany (central Italy). Miner. Dep. 2010, 46, 197–210. [Google Scholar] [CrossRef]
  19. Rimondi, V.; Chiarantini, L.; Lattanzi, P.; Benvenuti MBeutel, M.; Colica, A.; Costagliola, P.; Di Benedetto, F.; Gabbani, G.; Gray, J.E. Metallogeny, exploitation and environmental impact of the Mt. Amiata mercury ore district (Southern Tuscany, Italy). It. J. Geosci. 2015, 134, 323–336. [Google Scholar] [CrossRef]
  20. Ferrara, R.; Mazzolai, U.B.; Edner, H.; Svanberg, S.; Wallinder, E. Atmospheric mercury sources in the Mt. Amiata area, Italy. Sci. Total Environ. 1998, 213, 12–23. [Google Scholar] [CrossRef]
  21. Bombace, M.A.; Cigna Rossi, L.; Clemente, G.F.; Zuccaro Labellarte, G.; Allegrini, M.; Lanzola, L.; Gatti, L. Ricerca ecologica sulle zone mercurifere del Monte Amiata. Igiene Sanità Pubblica 1973, 29, 191–237. [Google Scholar]
  22. Bacci, E.; Leonzio, C.; Renzoni, A. Mercury decontamination in a river of Mount Amiata. Bull. Environ. Contam. Toxicol. 1978, 20, 577–581. [Google Scholar] [CrossRef] [PubMed]
  23. Bacci, E.; Gaggi, C.; Duccini, M.; Bargagli, R.; Renzoni, A. Mapping mercury vapours in an abandoned cinnabar mining area by azalea (Azalea indica) leaf trapping. Chemosphere 1994, 29, 641–656. [Google Scholar] [CrossRef]
  24. Bacci, E.; Gaggi, C.; Lanzillotti, E.; Ferrozzi, S. Studio per l’individuazione dei residui di mercurio in forme mobili e della presenza di altri elementi in tracce di interesse ai fini della predisposizione di un progetto di bonifica dell’area di pertinenza della ex-miniera di mercurio di Abbadia San Salvatore (SI); ENI S.p.A.—Divisione AGIP, Mining Italiana S.p.A.: Roma, Italy, 1997; Volume 17. (In Italian) [Google Scholar]
  25. Bargagli, R.; Barghigiani, C.; Maserti, B.E. Mercury in vegetation of the Mt. Amiata area (Italy). Chemosphere 1986, 15, 1035–1042. [Google Scholar] [CrossRef]
  26. Barghigiani, C.; Ristori, T. Preliminary study on mercury uptake by Rosmarinus officinalis L.(Rosemary) in a mining area (Mt. Amiata, Italy). Bull. Environ. Contamin. Toxicol. 1995, 54, 519–525. [Google Scholar] [CrossRef]
  27. Breder, R.; Flucht, R. Mercury levels in the atmosphere of various regions and locations in Italy. Sci. Total Environ. 1984, 40, 231–244. [Google Scholar] [CrossRef]
  28. Edner, H.; Ragnarson, P.; Svanberg, S.; Wallinder, E.; Ferrara, R.; Maserti, B.E.; Bargagli, R. Atmospheric mercury mapping in a cinnabar mining area. Sci. Total Environ. 1993, 133, 1–15. [Google Scholar] [CrossRef]
  29. Ferrara, R.; Maserti, B.E.; Breder, R. Mercury in abiotic and biotic compartments of an area affected by a geochemical anomaly (Mt. Amiata, Italy). W. Air Soil Pollut. 1991, 56, 219–233. [Google Scholar] [CrossRef]
  30. Ferrara, R.; Maserti, B.E.; Andersson, M.; Edner, H.; Ragnarson, P. Mercury degassing rate from mineralized areas in the Mediterranean Basin. W. Air. Soil Pollut. 1997, 93, 59–66. [Google Scholar] [CrossRef]
  31. Bellander, T.; Merler, E.; Ceccarelli, F.; Boffetta, P. Historical Exposure to Inorganic Mercury at the smelter works of Abbadia San Salvatore, Italy. Am. Occup. Hyg. 1998, 42, 81–90. [Google Scholar] [CrossRef]
  32. Rimondi, V.; Bardelli, F.; Benvenuti, M.; Costagliola, P.; Gray, J.E.; Lattanzi, P. Mercury speciation in the Mt. Amiata mining district (Italy): Interplay between urban activities and mercury contamination. Chem. Geol. 2014, 380, 110–118. [Google Scholar] [CrossRef]
  33. Rimondi, V.; Costagliola, P.; Gray, J.E.; Lattanzi, P.; Nannucci, M.; Paolieir, M.; Salvadori, A. Mass loads of dissolved and particulate mercury and other trace elements in the Mt. Amiata mining district, Southern Tuscany (Italy). Environ. Sci. Pollut. Res. 2014, 21, 5575–5585. [Google Scholar] [CrossRef] [PubMed]
  34. Rimondi, V.; Gray, J.E.; Costagliola, P.; Vaselli, O.; Lattanzi, P. Concentration, distribution, and translocation of mercury and methylmercury in mine-waste, sediment, soil, water, and fish collected near the Abbadia San Salvatore mercury mine, Monte Amiata district, Italy. Sci. Total. Environ. 2011, 414, 318–327. [Google Scholar] [CrossRef]
  35. Vaselli, O.; Higueras, P.; Nisi, B.; Esbrì, J.M.; Cabassi, J.; Martìnez-Coronado, A.; Tassi, F.; Rappuoli, D. Distribution of gaseous Hg in the Mercury mining district of Mt. Amiata (Central Italy): A geochemical survey prior the reclamation project. Env. Res. 2013, 125, 179–187. [Google Scholar] [CrossRef] [PubMed] [Green Version]
  36. Vaselli, O.; Nisi, B.; Rappuoli, D.; Bianchi, F.; Cabassi, J.; Venturi, S.; Tassi, F.; Raco, B. Geochemical characterization of the ground waters from the former Hg-mining area of Abbadia San Salvatore (Mt. Amiata, central Italy): Criticalities and perspectives for the reclamation process. It. J. Geosci. 2015, 134, 23–31. [Google Scholar] [CrossRef]
  37. Vaselli, O.; Nisi, B.; Rappuoli, D.; Cabassi, J.; Tassi, F. Gaseous Elemental Mercury and Total and Leached Mercury in Building Materials from the Former Hg-Mining Area of Abbadia San Salvatore (Central Italy). Int. J. Environ. Res. Pub. 2017, 14, 425. [Google Scholar] [CrossRef] [Green Version]
  38. Gray, J.E.; Rimondi, V.; Costagliola, P.; Vaselli, O.; Lattanzi, P. Long distance transport of Hg, Sb, and As from a mined area, conversion of Hg to methyl-Hg, and uptake of Hg by fish on the Tiber River, west central Italy. Environ. Geochem. Health 2014. [Google Scholar] [CrossRef]
  39. Pattelli, G.; Rimondi, V.; Benvenuti, M.; Chiarantini, L.; Colica, A.; Costagliola, P.; Di Benedetto, F.; Lattanzi, P.; Paolieri, M.; Rinaldi, M. Effects of the November 2012 Flood Event on the Mobilization of Hg from the Mount Amiata Mining District to the Sediments of the Paglia River Basin. Minerals 2014, 4, 241–256. [Google Scholar] [CrossRef]
  40. Chiarantini, L.; Rimondi, V.; Benvenuti, M.; Beutel, M.W.; Costagliola, P.; Gonnelli, C.; Lattanzi, P.; Paolieri, M. Black pine (Pinus Nigra) barks as biomonitors of airborn mercury pollution. Sci. Total Environ. 2016, 569–570, 105–113. [Google Scholar] [CrossRef]
  41. Chiarantini, L.; Rimondi, V.; Bardelli, F.; Benvenuti, M.; Cosio, C.; Costagliola, P.; Di Benedetto, F.; Lattanzi, P.; Sarret, G. Mercury speciation on Pinus Nigra barks from Monte Amiata (Italy): An X-ray absorption spectroscopy study. Environ. Poll. 2017, 227, 83–88. [Google Scholar] [CrossRef]
  42. Lazzaroni, M.; Nisi, B.; Rappuoli, D.; Cabassi, J.; Vaselli, O. A New Low-Cost and Reliable Method to Evaluate the Release of Hg0 from Synthetic Materials. Processes 2020, 8, 1282. [Google Scholar] [CrossRef]
  43. Pribil, M.J.; Rimondi, V.; Costagliola, P.; Lattanzi, P.; Rutherford, D.L. Assessing mercury distribution using isotopic fractionation of mercury processes and sources adjacent and downstream of a legacy mine district in Tuscany, Italy. Appl. Geochem. 2020, 117. [Google Scholar] [CrossRef]
  44. Vaselli, O.; Rappuoli, D.; Nisi, B.; Bianchi, F.; Tassi, F.; Cabassi, J.; Giannini, L.; Magi, F.; Capecchiacci, G.; Maddii, V. Geochimica delle acque di Galleria Italia (Abbadia San Salvatore, Siena). In Il vulcano di Monte Amiata; Principe, C., Vezzoli, L., Lavorini, G., Eds.; Edizioni Scientifiche e Artistiche: Torre del Greco, Italy, 2017; pp. 283–302. [Google Scholar]
  45. Sammarco, O. Abandoning mines: Hydrodynamic evolution controlled in order to avoid surface damage. Proc. Acid Mine Water Pyritic Environ. Lisb. Port. 1990, 9, 277–289. [Google Scholar] [CrossRef]
  46. Rimondi, V.; Costagliola, P.; Lattanzi, P.; Morelli, G.; Cara, G.; Cencetti, C.; Fagotti, C.; Fredduzzi, A.; Marchetti, G.; Sconocchia, A.; et al. A 200 km-long mercury contamination of the Paglia and Tiber floodplain: Monitoring results and implications for environmental management. Environ. Poll. 2019, 225. [Google Scholar] [CrossRef]
  47. Appelo, C.A.J.; Postma, D. Geochemistry, Groundwater and Pollution; Balkema, A.A., Ed.; Brookfield: Rotterdam, The Netherlands, 1993; p. 536. [Google Scholar]
  48. Tassi, F.; Capecchiacci, F.; Vaselli, O. Migration Processes of Metal Elements from Carbon Steel Cylinders to Food Gases. Packag. Technol. Sci. 2014, 27, 787–797. [Google Scholar] [CrossRef]
  49. Capecchiacci, F.; Tassi, F.; Vaselli, O. Contamination test of metal and non-metal elements from copper gas pipe to food gases. Packag. Technol Sci. 2018, 31, 151–156. [Google Scholar] [CrossRef] [Green Version]
  50. Saniewska, D.; Beldowska, M. Mercury fractionation in soil and sediment samples using thermo-desorption method. Talanta 2017, 168, 152–161. [Google Scholar] [CrossRef]
  51. Minissale, A.; Magro, G.; Vaselli, O.; Verrucchi, C.; Perticone, I. Geochemistry of water and discharges from Mt. Amiata silicic complex and surrounding areas (central Italy). J. Volcanol. Geotherm. Res. 1997, 79, 223–251. [Google Scholar] [CrossRef]
  52. Frondini, F.; Caliro, S.; Cardellini, C.; Chiodini, G.; Morgantini, N. Carbon dioxide degassing and thermal energy release in the Monte Amiata volcanic-geothermal area (Italy). Appl. Geochem. 2009, 24, 860–875. [Google Scholar] [CrossRef]
  53. Chiodini, G.; Cardellini, C.; Caliro, S.; Avino, R.; Donnini, M.; Granieri, D.; Morgantini, N.; Sorrenti, N.; Frondini, F. The hydrothermal system of Bagni San Filippo (Italy): Fluids circulation and CO2 degassing. It. J. Geosci. 2020, 139, 383–397. [Google Scholar]
  54. Bardelli, F.; Benvenuti, M.; Costagliola, P.; Di Benedetto, F.; Lattanzi, P.; Meneghini, C.; Romanelli, M.; e Valenzano, L. Arsenic uptake by natural calcite: An XAS study. Geochim. Cosmochim. Acta 2011, 75, 3011–3023. [Google Scholar] [CrossRef]
  55. Giménez-Forcada, E.; Timón-Sánchez, S.; e Kohfahl, C. Hydrogeotoxicity from arsenic and uranium in the southern Duero Basin, Spain. J. Geochem. Expl. 2017, 183, 197–205. [Google Scholar] [CrossRef]
  56. Baldi, P.; Ferrara, G.C.; Masselli, L.; Pieretti, G. Hydrogeochemistry of the region between Monte Amiata and Rome. Geothermics 1972, 3–4, 124–128. [Google Scholar] [CrossRef]
  57. Lazzaroni, M.; Vaselli, O.; Nisi, B.; Cabassi, J.; Zuccolini, M.; Rappuoli, D. Mercury and Arsenic occurrence, mobility and transport in water and sediments from Galleria Italia mine drainage (Abbadia San Salvatore, central Italy). Int. J. Environ. Res. Pub. Health 2021, in press. [Google Scholar]
  58. Gray, J.E.; Theodorakos, P.M.; Bailey, E.A.; Turner, R.R. Distribution, speciation, and transport of mercury in stream-sediment, stream-water, and fish collected near abandoned mercury mines in southwestern Alaska, USA. Sci. Total Environ. 2000, 260, 21–33. [Google Scholar] [CrossRef]
Figure 1. Location of Abbadia San Salvatore: (a) Galleria Italia and (b) a detail of the water discharge where the reddish-whitish color can be observed.
Environments 08 00015 g001
Figure 2. Schematic geological cross-section of the mining tunnels in the former mining site of Abbadia San Salvatore. For the sake of clarity, the local geological terms, such as scisti policromi (shales), sotto- and sopra-nummilitico (alternated calcarenites with grayish-greenish clays and grayish-pinkish calcarenites with grayish clays) and bancone (massive calcarenites) have been maintained (modified after [44]).
Environments 08 00015 g002
Figure 3. Triangular diagrams of Cl-HCO3 + CO3-SO4 (up, diagrams a and b) and Na + K-Mg-Ca (down, diagrams c and d). For each diagram, an inset is included (respectively b and d) to better observe the distribution of the analyzed samples from Galleria Italia. The Identification Numbers (IDs) refer to refer to the different surveys (see Table 1).
Environments 08 00015 g003
Figure 4. Mg + Ca + SO4 (in mg/L−1) vs. TDS (in mg L−1) binary diagram. The IDs refer to the different surveys (see Table 1). The dotted line represents the (Mg + Ca + SO4)/TDS = 1.
Environments 08 00015 g004
Figure 5. Binary diagram of Fe vs. Al (a), Mn (b) and As (c) and Ni vs. Co. All values are in mg L−1. The numbers refer to the different sampling surveys (see Table 2). Statistical data for: (a) r = 0.5791, p = 0.0005; (b) r = 0.7328, p = 0.00001; (c) r = 0.7076, p = 0.00001; (d) r = 0.9326, p = 0.0001.
Environments 08 00015 g005
Figure 6. Temporal variations of the Ca/SO4 (a) and HCO3/SO4 (b) ratios (in meq L−1). The IDs refer to the different surveys (see Table 1).
Environments 08 00015 g006
Figure 7. Hg + As + Sb (in mg L−1 in log scale) vs. pH (after [58]) for the Galleria Italia waters.
Environments 08 00015 g007
Table 1. Temperature, pH and concentration of the Total Dissolved Solids (TDS), main and minor dissolved species in the Galleria Italia waters. The Identification Numbers (IDs) are those used in the diagrams to refer to the sampling date.
IDSamplingTpHTDSCa2+Mg2+Na+K+NH4+HCO3SO42−ClFNO3
Date°C mg L−1mg L−1mg L−1mg L−1mg L−1mg L−1mg L−1mg L−1mg L−1mg L−1mg L−1
130/01/200912.65.5410172123114114.81385959.91.20.5
212/02/2009 5.901567342482016n.d.1369968.7 0.5
318/02/200912.06.5711782223714378.213669726.00.50.4
423/03/2009 9922273515120.2216748.3
526/03/200916.05.4510342113313125.7217324.51.00.4
624/07/200917.55.969171962714123.6386186.20.90.9
730/10/200917.05.959141952713111.0855765.31.00.0
822/12/200915.55.978811922513113.51115176.50.61.4
911/01/2010 5.6210612352712100.61006705.70.40.7
1014/01/201012.05.8312172893510119.31557005.30.81.7
1106/04/201015.55.4810192133513111.5446946.10.60.4
1221/07/201015.55.5110022313015107.1356637.50.82.8
1321/11/201016.56.09952201241392.4886085.00.61.0
1414/01/201115.06.2110382342813103.41346096.10.70.1
1521/04/201116.05.8810372272912100.510763019.01.40.8
1629/06/201116.55.909462002512110.312056016.01.00.4
1714/10/201115.76.199492152513120.112754115.00.80.2
1817/11/201114.56.549382222615120.411053317.01.81.1
1928/12/201115.06.769482232613110.51395268.50.90.2
2008/03/201215.06.589382132513100.121344715.01.00.6
2128/04/201211.56.149532162514120.117549316.01.11.1
2217/07/201215.56.268971972212100.116647316.00.80.1
2312/10/201215.56.20915200231390.115649616.00.80.8
2403/01/201315.06.309592112913100.112055717.01.00.9
2521/05/201315.55.807881911711100.07447510.00.70.1
2612/02/201414.26.0610362383312120.215157416.00.70.1
2710/09/201415.06.188161941811100.09447711.80.80.1
2816/04/201514.56.2091120223980.111554210.70.60.2
2924/10/201515.06.19852206211191.211147813.70.40.2
3003/05/201615.05.989172202412100.412551213.00.50.4
3128/10/201612.65.838491982215100.21204758.00.50.1
3204/04/201714.96.378711922314110.219242810.01.10.2
3301/09/201715.06.20
3410/01/201813.76.99
3501/06/201817.56.478541802612130.07853013.02.00.1
3601/11/20187.66.54
3701/03/201914.56.589171922713111.314951112.40.80.1
3816/05/201914.86.60
3901/10/201917.06.60824180211190.19249812.00.10.1
4007/01/202013.06.41
4101/05/202015.46.52941206231283.510455825.11.20.1
4201/10/202016.06.2875718121850.511440422.31.20.2
Table 2. Trace element concentrations of the Galleria Italia waters. The progressive numbers are those used in the diagrams to identify the sampling date. The sampling 3, 4, 9 and 33 are not listed because no data were available for trace elements. The Identification Number (IDs) are those used in the diagrams to refer to the sampling date.
IDSamplingBAlCrMnFeCoNiZnAsSrSbHg
Dateμg/L−1μg/L−1μg/L−1μg/L−1μg/L−1μg/L−1μg/L−1μg/L−1μg/L−1μg/L−1μg/L−1μg/L−1
130/01/200982712<0.176826,079237022016792<0.17.1
218/02/200963166<0.174034,027247619516722<0.10.9
526/03/2009751498<0.168939,521258624423629<0.10.1
624/07/200959906<0.153023,003176517111522<0.1<0.1
730/10/200976651<0.168222,179226316110623<0.1<0.1
822/12/200949346<0.160120,926144412195800.40.5
1014/01/201042252<0.161621,930195910968370.1<0.1
1106/04/2010741110<0.168732,2602686217127470.10.2
1221/07/20106014031.473228,572257420914630<0.10.1
1321/11/201059331<0.552819,622165112610461<0.11.4
1414/01/2011503870.246815,65614521006468<0.10.2
1521/04/201161865<0.156720,063187318313519<0.1<0.1
1629/06/201168731<0.153616,476155114014541<0.1<0.1
1714/10/2011654210.349014,960124311514487<0.1<0.1
1817/11/201133930.446117,920439349176<0.10.4
1928/12/2011701100.147515,9201137837476<0.113.2
2008/03/2012821790.150217,3801037897496<0.13.5
2128/04/2012973200.243613,410933849459<0.10.2
2217/07/2012552830.245211,253929856453<0.125.6
2312/10/2012492750.145112,384828906455<0.19.0
2403/01/201343134<0.145413,24011441348524<0.17.0
2521/05/2013639260.248620,060166317713560<0.1<0.1
2612/02/2014526600.247018,130124713513 <0.15.7
2710/09/2014454090.135210,060144011611 <0.1<0.1
2816/04/2015211490.136413,560124310011 0.5<0.1
2924/10/2015441830.135212,05011301007 <0.1<0.1
3003/05/2016433460.142715,00011431249 <0.1<0.1
3128/10/201680413<0.142414,8619381068 <0.1<0.1
3204/04/2017333230.134520,2907309810 <0.1<0.1
3410/01/2018 8 0.6<0.1
3501/06/2018343460.241132,100114415812 0.2
3601/11/2018 9 <0.10.4
3701/03/2019422700.240418,27083711211 0.3<0.1
3816/05/2019 9 <0.1<0.1
3901/10/2019 11 <0.10.4
4007/01/2020403960.237758761139119 0.2
4101/05/2020 11 <0.12.2
4201/10/2020 8 <0.11.0
Table 3. Major (wt.%) and trace element (mg kg−1) in the sediment precipitating from the Galleria Italia waters.
ElementUnit of MeasurementConcentration
Na%0.02
Mg%0.07
Al%4.42
K%0.07
Ca%0.7
Fe%37.2
Crmg kg−112
Mnmg kg−1257
Nimg kg−116
Znmg kg−1191
Asmg kg−1192
Sbmg kg−113
Hgmg kg−11.2
Publisher’s Note: MDPI stays neutral with regard to jurisdictional claims in published maps and institutional affiliations.

