Article

Monitoring Radon Levels in Hospital Environments. Findings of a Preliminary Study in the University Hospital of Sassari, Italy

1
Department of Biomedical Sciences, University of Sassari, 07100 Sassari, Italy
2
Department of Medical, Surgical and Experimental Sciences, University of Sassari, 07100 Sassari, Italy
3
University Hospital of Sassari, 07100 Sassari, Italy
*
Author to whom correspondence should be addressed.
Submission received: 19 February 2021 / Revised: 2 April 2021 / Accepted: 6 April 2021 / Published: 7 April 2021
(This article belongs to the Special Issue Risk Assessment for Workplace Exposure to Natural Radioactivity)

Abstract

:
Background: The aim of this preliminary study was to measure radon concentrations in a hospital in order to verify to what extent these concentrations depend on various environmental variables taken into consideration, and consequently to determine the urgency to implement mitigation actions. Methods: The rooms where the concentration of the gas was potentially highest were monitored. Investigators adopted a Continuous Radon Monitor testing device. Qualitative and normally distributed quantitative variables were summarised with absolute (relative) frequencies and means (standard deviations, SD), respectively. As regards environmental variables, the difference in radon concentrations was determined using the rank-based nonparametric Kruskal–Wallis H test and the Mann–Whitney U test. Results: All measurements, excluding the radiotherapy bunkers that showed high values due to irradiation of radiotherapy instruments, showed low radon levels, although there is currently no known safe level of radon exposure. In addition, high variability in radon concentration was found linked to various environmental and behavioural characteristics. Conclusions: The results on the variability of radon levels in hospital buildings highlighted the key role of monitoring activities on indoor air quality and, consequently, on the occupants’ health.

1. Introduction

Radon (222Rn), a chemically inert gas produced by the decay of uranium (238U), is a naturally occurring radioactive element present in all rocks of the earth’s crust. Especially when cracks or fissures are present, it can spread into the confined spaces of a building, where it tends to concentrate, particularly in nonventilated basement floors due to its high density and weight. It is therefore considered to be a typically indoor pollutant, whose concentration, furthermore, can vary widely depending on both time and space [1].
Currently, radon represents a serious public health problem due to its accumulation inside homes and workplaces. Given that the vast majority of people live indoors, high levels of radon can significantly increase the risk of lung cancer [2,3]. In 1988, the International Agency for Research on Cancer classified radon and its decay products as carcinogenic to humans [4]. In 2009, the World Health Organization (WHO) recognised it as the second leading cause of lung cancer worldwide and the leading cause of lung cancer among people who have never smoked [1,5,6].
There is currently no known safe level of exposure to radon [2]. Radon may exceed acceptable levels in places with confined air due to specific climatic conditions, building materials, natural or artificial ventilation, and the amount of uranium in the underlying rocks and soils [7,8].
Indoor concentrations of radon can be assessed through long-term and short-term monitoring. While long-term monitoring can provide more reliable average levels, a short-term study is the most frequent and rapid approach [9].
Radon detection is the basic parameter for assessing the impact on the population of the main source of exposure to environmental radioactivity and for planning the responses to be adopted, also in relation to current legislation on exposure in the workplace. In this regard, WHO recommends a national reference level of 100 Bq/m3 and, where this is not possible, the threshold adopted should not exceed 300 Bq/m3 [1]. Furthermore, the European Commission (EC) issued Directive 2013/59/Euratom [10], in which the general reference value was set at 300 Bq/m3, and Recommendation 90/143/Euratom [11], which indicates the annual average of indoor radon concentrations for new and existing dwellings (200 Bq/m3 and 300 Bq/m3, respectively). In Italy, Legislative Decree 101/2020 and Legislative Decree 81/08 require employers to carry out monitoring and assessments to determine radon exposure in the workplace, setting a reference level of 300 Bq/m3, above which the employer must intervene with more in-depth assessments and possibly remediation actions [12,13].
On the basis of the above considerations, the aim of this preliminary study was to measure the radon concentrations in such a particular working environment as a hospital, in order to verify to what extent these concentrations depend on various environmental variables taken into consideration and consequently determine the urgency to implement mitigation actions.

2. Materials and Methods

The present study did not require ethical approval for its observational design according to the Italian law (Gazzetta Ufficiale n. 76 dated 31 March 2008).

2.1. Study Setting

The study was conducted in Sardinia, an Italian region with an average level of 60–80 Bq/m3. The island’s basement rocks consist of metamorphites and granitic plutonites, which are sedimentary and magmatic rocks containing radioactive elements [14,15].
In particular, the radon assessment was carried out in the University Hospital of Sassari, the main hospital in Sardinia for the number and heterogeneity of its technological and professional resources (861 beds and 2710 employees as of 1 December 2018). The hospital, which carries out multispecialist activities of care, teaching and research for all of northern Sardinia, comprises 7 pavilions in total.

2.2. Study Design

The survey was conducted, from July to August, using a specific survey protocol and a data collection form, structured so as to take into account a series of variables associated with indoor radon levels (i.e., construction date, dampness marks, restoration of the underground structural elements, and the materials used to build the foundation walls).
A total of 14 rooms were selected for assessment. These were rooms where the gas concentration was potentially highest (basement, semibasement or ground floor rooms) that were used not only as archives or storage areas (where health workers would spend little time), but also as waiting rooms or surgeries due to the lack of more suitable spaces.
The inspections, each lasting 72 h, were carried out twice in each room, for a total of 28 inspections, in order to assess any changes in the short-term.

2.3. Radon Concentration Measurement

Investigators adopted a Continuous Radon Monitor (CRM) testing device (Model 1027, Sun Nuclear Corporation, Melbourne, FL, USA). The detector is U.S. EPA quality-tested; National Environmental Health Association, National Radon Proficiency Program listed; and National Radon Safety Board-approved for use in real-estate transaction testing.
The device, which had been calibrated by the manufacturer prior to the study, performed measurements every 60 min (i.e., 24 detections daily). The radon detector was positioned in such a way that the measurements were representative of exposure to personnel (health workers) and service users (patients) in zones where they spent at least 4 h per day, thus excluding transitory areas such as corridors and service rooms. A supervisor was selected to oversee the device activity.

2.4. Statistical Analysis

An ad hoc electronic form was prepared to collect the main environmental variables using Excel (Microsoft Office, Microsoft Corporation, Redmond, WA, USA). Qualitative and normally distributed quantitative variables were summarised with absolute (relative) frequencies, means (standard deviations, SD) and median (interquartile range, IQR). The difference in radon concentrations, as regards polytomous and dichotomous environmental variables, was determined using the rank-based nonparametric Kruskal-Wallis H test and the Mann-Whitney U test, respectively. A two-tailed p-value less than 0.05 was considered statistically significant. The statistical computations were performed using STATA 16 (StatCorp., Austin, TX, USA), and PAST 4.05 (Paleontological Statistics, Oslo, Norway).

3. Results

3.1. Buildings Characteristics

The inspections were carried out in 7 hospital halls where 14 rooms with different characteristics were each examined twice for a total of 28 analyses, each of 72 detections (2016 total detections) (Table 1). From an operational point of view, these rooms housed from 2 to 35 persons per day for an average of 14.4 occupants.
In particular, most of the premises (n = 11, 78.6%) are located in fairly recent buildings, having been built after 1980. The remainder (n = 3, 21.4%) are located in buildings built from 1965 to 1979.
With regard to the prevailing type of structure, it can be seen that the majority (64.3%) have two underground walls, while three rooms are below ground level and the remaining two are partially underground.
Regarding the underground part, it can be seen that most of the rooms (57.1%) have a cement structure. In all cases, the flooring is in direct contact with the ground. Linoleum (special flooring made of very resistant natural materials, such as linseed oil, wood flour, cork powder) is present in two rooms, a postoperative room and a storage room.
In all cases, the underground walls are not entirely made of solid rock; in fact most are partially adjacent to an air shaft. Water infiltration is recorded in four rooms, which are the only ones in which there are also traces of dampness and condensation. In addition, most of the rooms (n = 12, 85.7%) have air-conditioning equipment (almost all cooling and heating), which is not controlled by the workers and therefore is never turned off. Only three rooms have direct access from the outside, unlike the other rooms.
The building’s exposure to wind is in most cases (57.1%) "nil" followed by "medium" (21.4%), "low" (14.3%) and "high" (7.1%) for the remaining premises. The premises’ exposure to the sun is frequently "nil" (n = 7, 50.0%) or "medium" (n = 6, 42.9%), and very rarely defined as "low" (7.1%).
In almost all cases (n=11) the pipes are exposed and, of these, they are in the ceiling in only one case, while in the others (n=10) they are in the side walls. In addition, half of the rooms have windows that are generally closed when the room is in use.
The average number of people, both workers and patients, who frequent the premises every day is just under 15 (14.4), varying from a minimum of 2 to a maximum of 35 (SD = ± 10.5). All the facilities are attended in the morning but frequently in the afternoon as well.

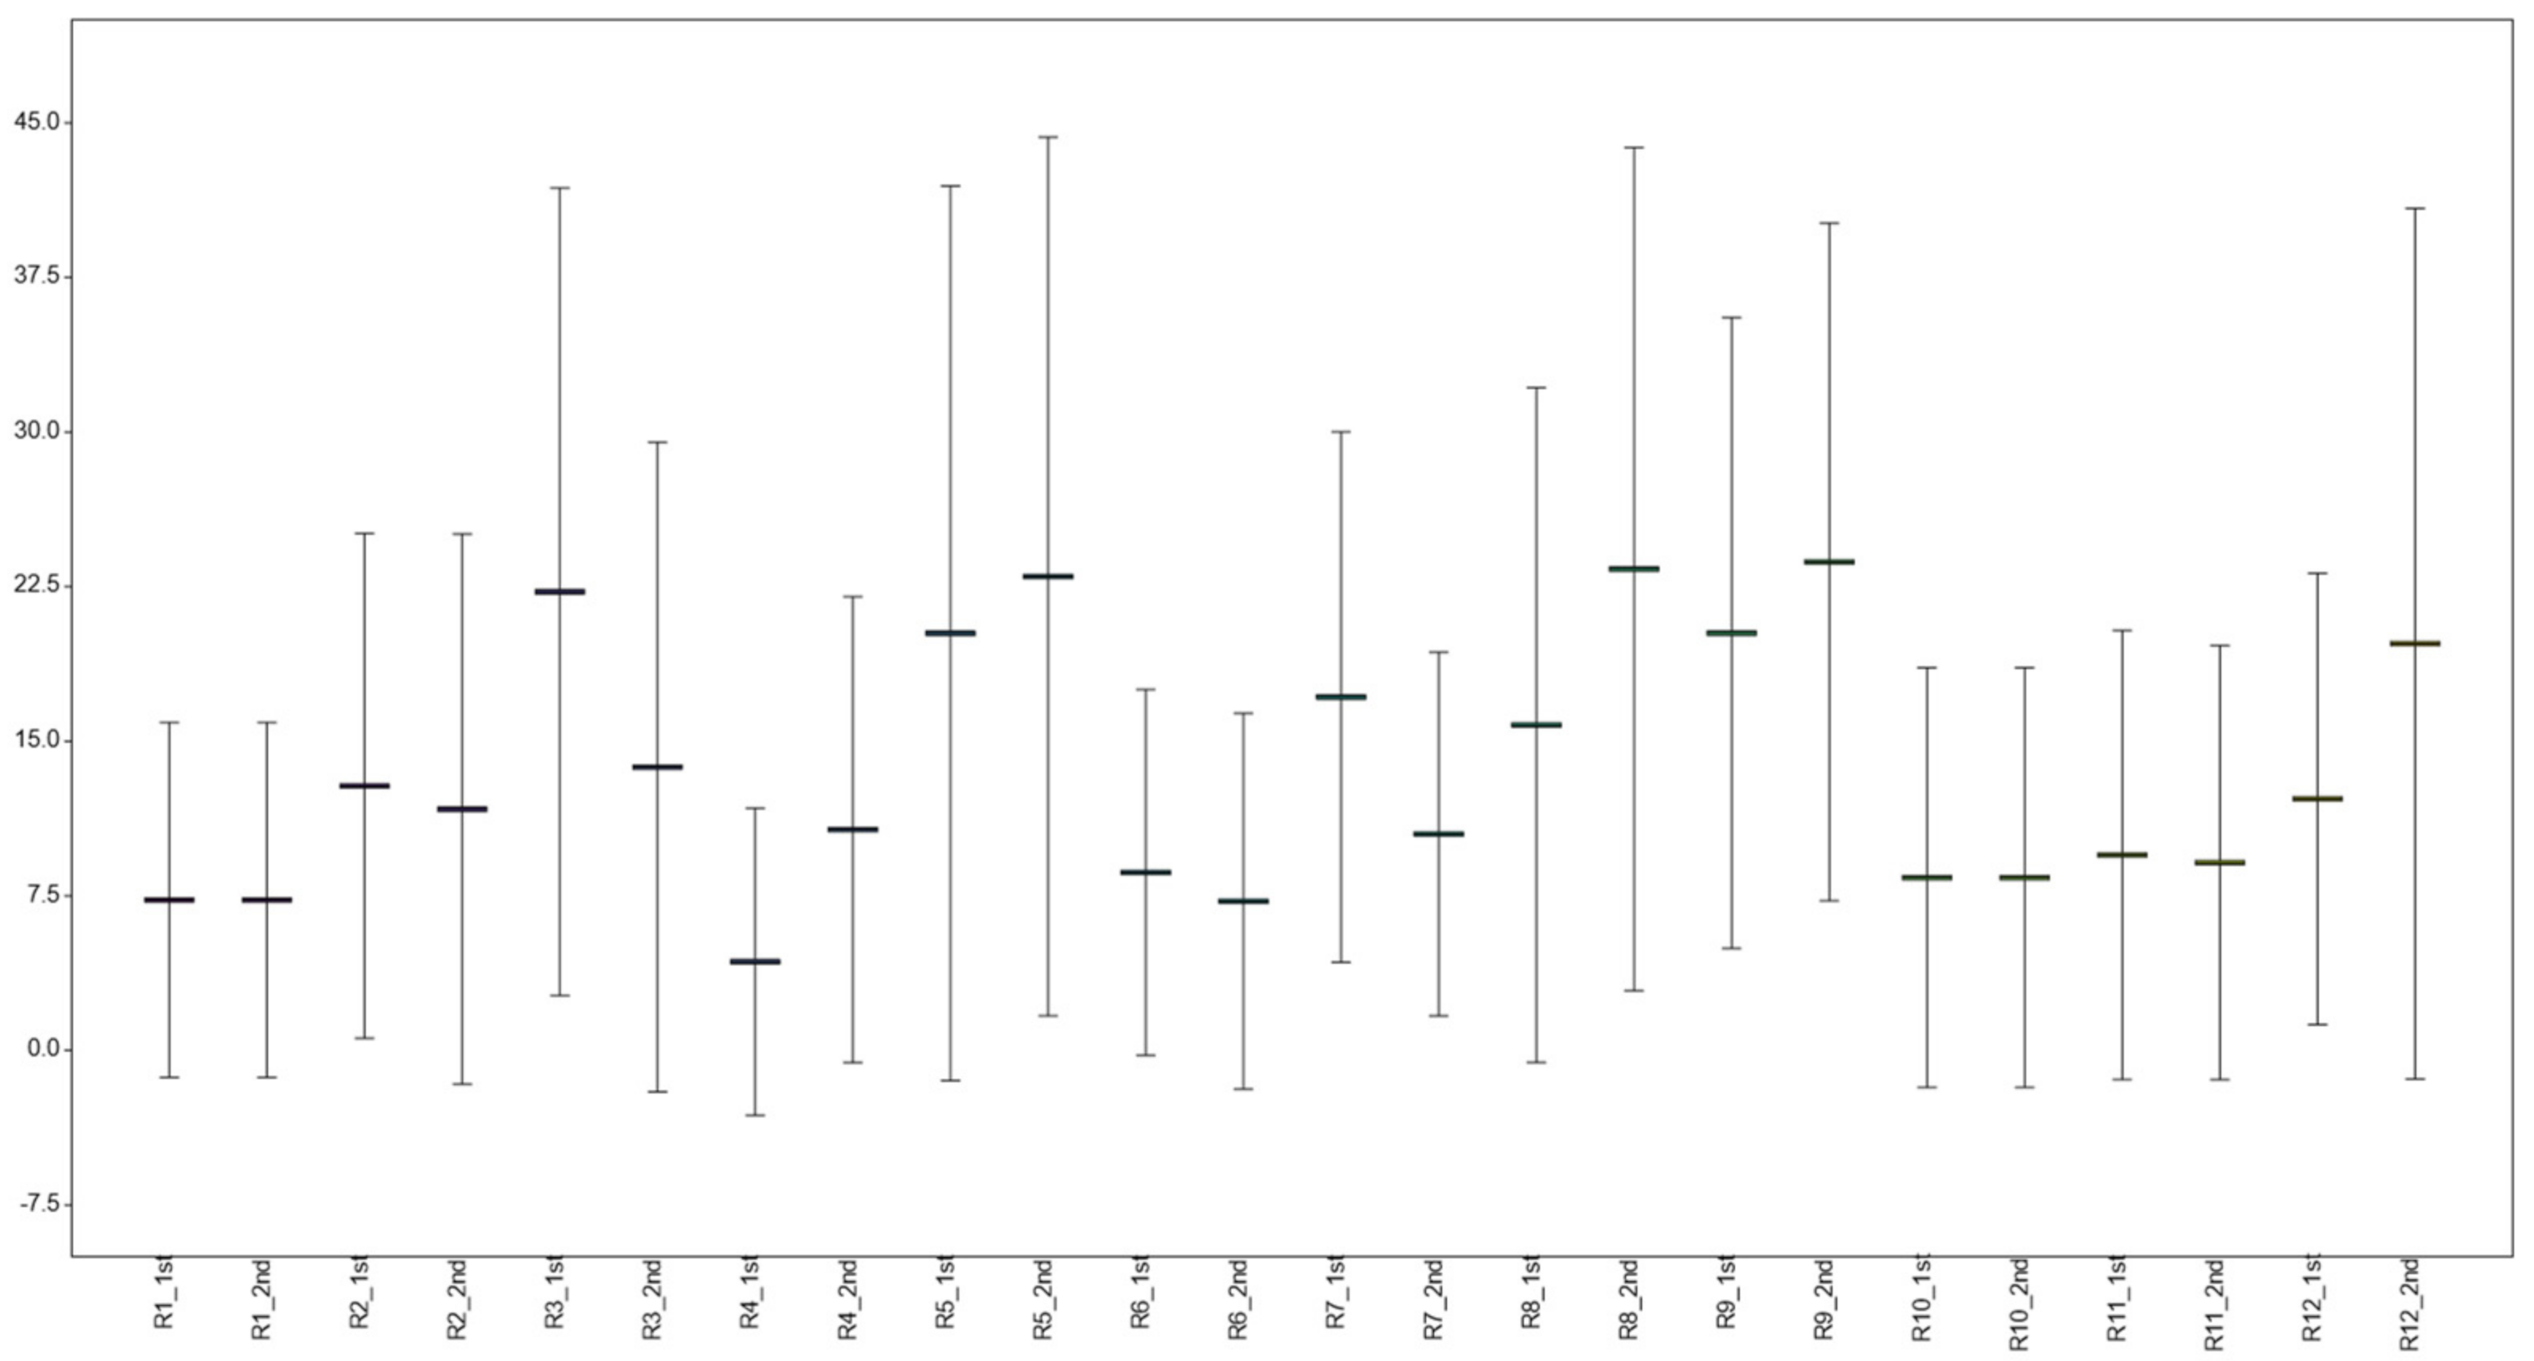
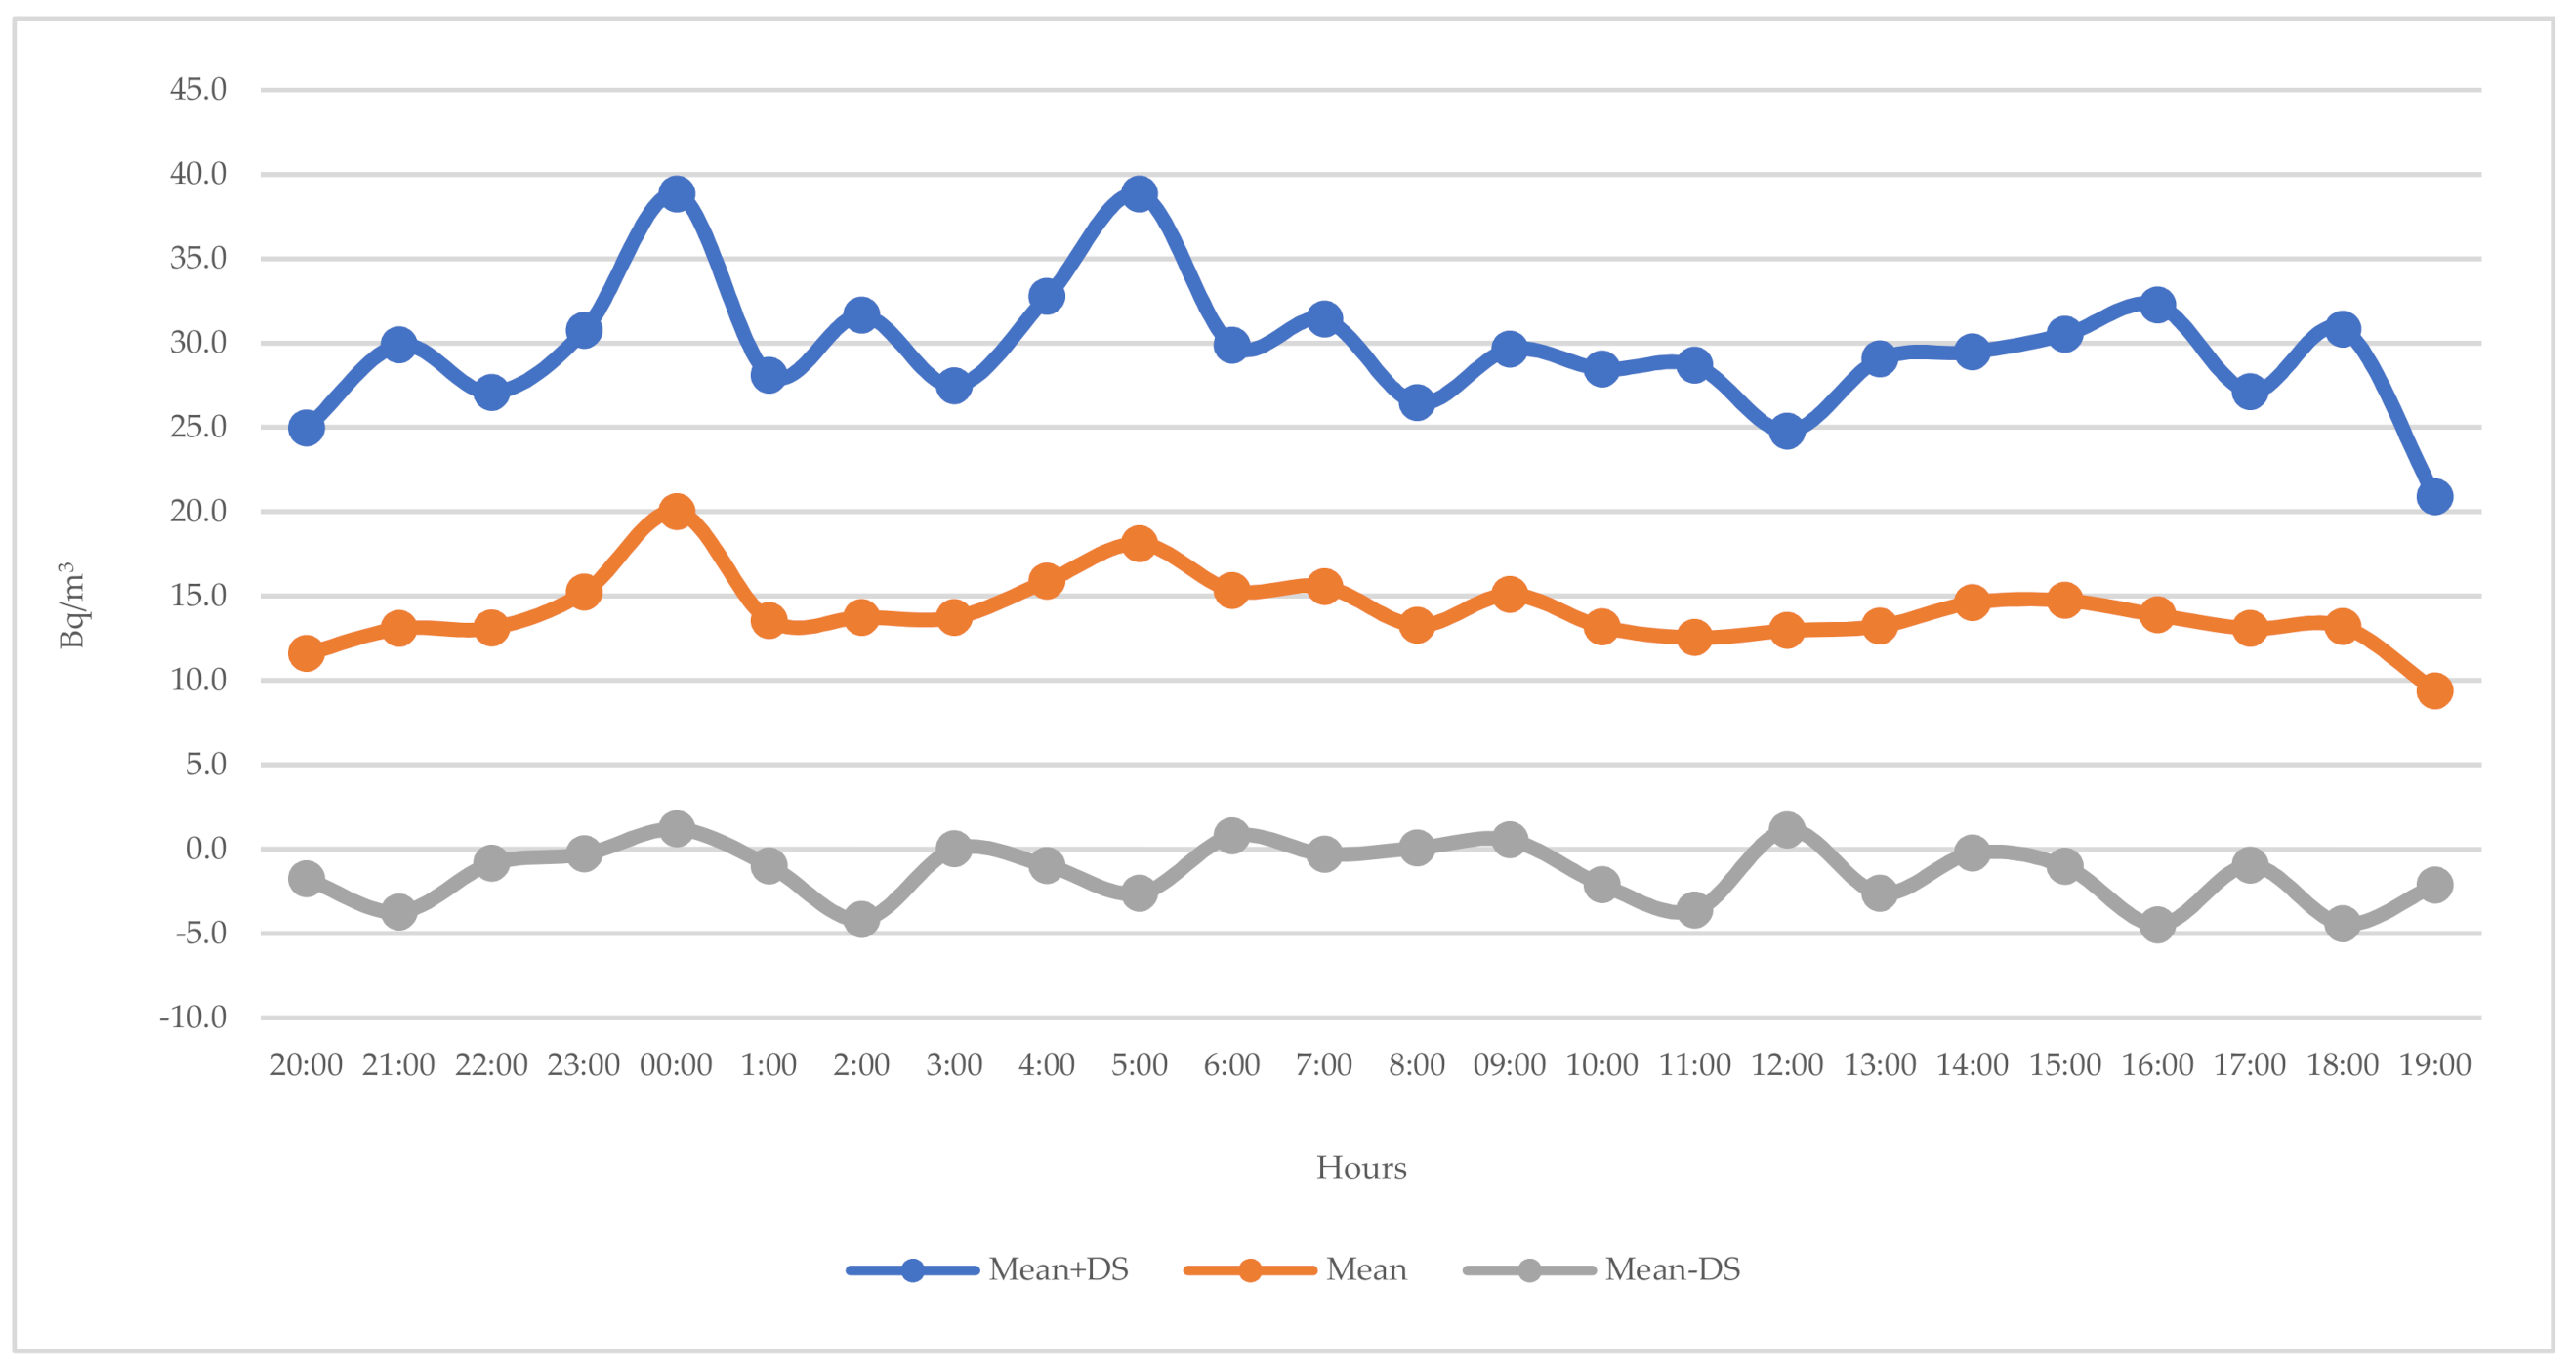
3.2. Radon Baseline Detection

The overall average values recorded in the 28 inspections (72 detections for each inspection) are as follows: mean (SD) = 145.5 (± 387.2) Bq/m3, median (IQR) = 14.9 Bq/m3 (8.6–21.1).
Among these inspections, the radiotherapy bunkers are of particular interest. The trend presents high peaks 9,916 Bq/m3 and 12,136 Bq/m3 for bunker 1 and 36,963 Bq/m3 and 35,816 Bq/m3 for bunker 2) in correspondence with their period of activity, while radon levels appear to decrease considerably when radiotherapy is not in use. Table 2 shows the average values of the first and the second inspection and the highest levels found in the radiotherapy bunkers.
Disregarding the results obtained during the inspections in the radiotherapy bunkers due to the interference of the functioning of radiotherapy facilities on the electronic signal, which gave rise to both particularly high and low values, mean (SD) and median (IQR) are considerably reduced, 13.6 (±5.7) Bq/m3 and 13 (8.3–18.4) Bq/m3, respectively.
Regarding the other 24 inspections, no significant differences were found between the average values of the first and the second inspection (T-test = 0.816; p > 0.05). Therefore, Table 3 shows the average values of the first and the second inspection and the highest levels found.
An effective representation of the data collected is given in Figure 1, which highlights the range of values of each inspection.
In relation to the high radon values, the highest (88.8 Bq/m3) was detected at 4 p.m., while the other peaks were always found during the night. Figure 2 shows the 24-h trend of the average values of radon detected in the 24 inspections (the rooms assessed excluding the radiotherapy bunkers).
Overall, radon concentration tends to increase during the nighttime, whereas it gradually decreases with the start of the working day and reaches the minimum concentration in the afternoon, and subsequently increases gradually again in the afternoon and evening.
A further example of this trend is represented, concentrating the data over 24 h, in the Disposal room, where the average highest concentrations are found during the night (from 4:30 to 6:30) with a peak of 63.8 Bq/m3 around 5:30 a.m.
The Disposal room, with all four walls below ground level made up entirely of cement, was built in 2010. Furthermore, its floor is in direct contact with the ground, there is no direct exit towards the exterior, although there are several windows, and it has its own heating/cooling system. It is constantly occupied by two workers and, as it is used also for teaching and educational activities, up to six people are often present, mainly in the morning.
Furthermore, the radon concentration detected in the various environments was evaluated, from a statistical point of view, with the variables found in the various buildings (Table 4).
In particular, statistically significant differences were observed between radon concentrations and the presence of windows and sun exposure.

4. Discussion

Radon levels can be critical in the pathogenesis of several medical conditions, particularly lung cancers [16,17,18]. Our study, therefore, aimed to evaluate the concentration of radon within the University Hospital of Sassari in order to verify to what extent these concentrations depend on various environmental variables taken into consideration, and consequently to determine the urgency to implement mitigation actions.
All the detections carried out, excluding those in the radiotherapy bunkers, which showed high values due to the irradiation of radiotherapy instruments, demonstrated low radon levels although, as is well-known, no safe level of exposure to radon is currently known [2]. The results, however, confirmed the variability of radon concentrations, which highly increase during the night and, in general, in times of lower attendance. Other studies have also described a high variability in radon concentration linked to various environmental and behavioural characteristics [19,20,21,22].
The higher concentrations of radon during the night could be linked to poor air renewal, while the lower daily concentrations may depend on a higher air exchange (opening of doors and windows and use of mechanical ventilation systems) due to the increased attendance of people on the premises. Only in one case was there a peak of radon detected during working hours in the Dentistry Department. This value must be kept under control in order to understand whether mitigation actions are necessary, as it could represent a relevant source of exposure for users.
In any case, it is important to point out that during the monitoring period there was a reduced presence of students and workers in the afternoon, with the consequent increase in radon, probably arising from a poor air exchange due to the room being less frequented and, it being summertime, cooling systems were frequently used and doors and windows were kept tightly closed.
In addition, in line with previous research, interesting considerations can be made regarding the statistically significant differences between radon concentrations and the main variables found in the premises examined—in particular, sun exposure and the presence of windows. In fact, the presence of windows, and the consequent exposure to the sun, can positively or negatively influence the concentration of radon based on whether these windows are opened regularly or not [23,24].
The levels found in this environmental monitoring are more contained than those found in other studies carried out in Sardinia: In some school gyms in the province of Sassari (45.8 Bq/m3) [25] and in some school classrooms in the province of Nuoro (between 83 and 95 Bq/m3) [26], and compared to the worldwide average concentration, which is 39 Bq/m3, the European average, which is 59 Bq/m3, and the Italian one, which is 70 Bq/m3 [27,28]. Thus, constant monitoring would enable timely identification of any deviations from the usual radon levels and prompt intervention to reduce concentrations.
From this viewpoint, although passive monitoring systems are used in most cases, continuous monitoring devices could provide long-term evaluation and, therefore, better diagnostic accuracy. As recommended by the U.S. EPA, short-term inspections are a more immediate means of monitoring radon concentrations, as they suggest when interventions should be implemented [29]. However, in cases where high variability in radon levels is detected, a different strategy based on long-term monitoring systems could provide more detailed and accurate information.
Nevertheless, certain limitations can affect the reliability of the results of the present study. First, the study was conducted within a limited period of the year, when there was a reduced presence of students and workers, and this does not enable a comparison between the results obtained and the limits set by the legislation. Despite this, the short-term monitoring allows for the implementation of mitigation interventions in the short term if high concentrations of radon are detected. Second, our findings might be influenced by the low number of measurements performed, and the limited number of inspections carried out, without estimating the inhalation dose rate of radon and its progeny received by the exposed users. Notwithstanding, the study was considered as a starting point to prepare a subsequent monitoring plan in order to understand if there is a risk of exposure to occupants.

5. Conclusions

The results regarding the variability of the radon level in hospital buildings highlight the key role of monitoring activities on indoor air quality and, consequently, on the health of the occupants. Based on the growing body of evidence on the link between radon levels and chronic diseases, radon concentrations should be monitored regularly in places where individuals live or work. In particular, as underlined by several studies [21,30], attention should be focused on hospitals which by their very nature are occupied by fragile patients with multiple pathologies. In general, apart from long-term exposure to high radon concentrations, several concerns should be raised about the potentially increased vulnerability of specific population groups.
A further monitoring program should include both a continuous increase in the number of inspections in the same premises and the identification of other potentially at-risk premises. This continuous increase would not only render the regularly made observations more significant but would also allow for a comparison between the data obtained with those pertaining to other work environments which, both for structural reasons and for the duration of frequentation of the environment itself, are to be considered at greater risk and, therefore, deserving of greater prevention activities.

Author Contributions

Conceptualization, G.D., M.D. and A.A. (Antonio Azara); data curation, G.D., M.D., M.D.M., A.P., A.A. (Antonella Arghittu), P.C. and A.A. (Antonio Azara); formal analysis, G.D., M.D., P.C. and A.A. (Antonio Azara); investigation, G.D., M.D., P.C. and A.A. (Antonio Azara); methodology, G.D., M.D., A.L.S., P.C. and A.A. (Antonio Azara); Software, M.D. and P.C.; supervision, A.A. (Antonio Azara); validation, A.L.S.; writing—original draft, G.D., M.D., M.D.M., A.L.S., A.P., A.A. (Antonella Arghittu), P.C. and A.A. (Antonio Azara); writing—review and editing, G.D., M.D., A.L.S., A.P., P.C. and A.A. (Antonio Azara). All authors have read and agreed to the published version of the manuscript.

Funding

This research was supported by “Fondo di Ateneo per la Ricerca 2020”, University of Sassari.

Data Availability Statement

The data presented in this study are available on reasonable request from the corresponding author.

Conflicts of Interest

The authors declare no conflict of interest.

References

  1. World Health Organisation. Handbook on Indoor Radon—A Public Health Perspective; World Health Organization: Geneva, Switzerland, 2009; Available online: http://apps.who.int/iris/bitstream/handle/10665/44149/9789241547673_eng.pdf (accessed on 5 March 2021).
  2. National Research Council (US). Committee on Health Risks of Exposure to Radon (BEIR VI); National Academies Press (US): Washington, DC, USA, 1999; ISBN 0-309-05645-4. [Google Scholar]
  3. National Cancer Institute Radon and Cancer. 2016. Available online: https://www.cancer.gov/about-cancer/causes-prevention/risk/substances/radon/radon-fact-sheet (accessed on 5 March 2021).
  4. International Agency for Research on Cancer. Man-Made Mineral Fibres and Radon. 1988. Available online: http://bases.bireme.br/cgi-bin/wxislind.exe/iah/online/?IsisScript=iah/iah.xis&src=google&base=WHOLIS&lang=p&nextAction=lnk&exprSearch=9283212436&indexSearch=ID (accessed on 5 March 2021).
  5. US Environmental Protection Agency Health Risk of Radon. 2016. Available online: https://www.epa.gov/radon/health-risk-radon (accessed on 5 March 2021).
  6. Oh, S.S.; Koh, S.; Kang, H.; Lee, J. Radon exposure and lung cancer: Risk in nonsmokers among cohort studies. Ann. Occup. Environ. Med. 2016, 28, 11. [Google Scholar] [CrossRef] [PubMed] [Green Version]
  7. Baeza, A.; García-Paniagua, J.; Guillén, J.; Montalbán, B. Influence of architectural style on indoor radon concentration in a radon prone area: A case study. Sci. Total Environ. 2018, 610–611, 258–266. [Google Scholar] [CrossRef] [PubMed]
  8. Darby, S.; Hill, D.; Auvinen, A.; Baros-Dios, J.M.; Baysson, H.; Bochicchio, F.; Deo, H.; Falk, R.; Forastiere, F.; Hakama, M.; et al. Radon in homes and risk of lung cancer: Collaborative analysis of individual data from 13 European case-control studies. BMJ 2005, 330, 223. [Google Scholar] [CrossRef] [Green Version]
  9. Franci, D.; Aureli, T. Long- and short-term indoor radon survey in the Ardea municipality, south Rome. Radiat. Prot. Dosim. 2014, 162, 625–629. [Google Scholar] [CrossRef]
  10. Council Directive 2013/59/Euratom of 5 December 2013. Laying down Basic Safety Standards for Protection against the Dangers Arising from Exposure to Ionising Radiation, and Repealing Directives 89/618/Euratom, 90/641/Euratom, 96/29/Euratom, 97/43/Euratom and 2003/122/Euratom. Available online: https://ec.europa.eu/energy/sites/ener/files/documents/CELEX-32013L0059-EN-TXT.pdf (accessed on 5 March 2021).
  11. Commission Recommendation 90/143/Euratom of 21 February 1990 on the Protection of the Public against Indoor Exposure to Radon. Available online: https://eur-lex.europa.eu/legal-content/EN/TXT/PDF/?uri=CELEX:31990H0143&from=SV (accessed on 5 March 2021).
  12. Decreto Legislativo del Governo n. 101 del 31/07/2020. D.Lgs. 241/2000. Attuazione della Direttiva 2013/59/Euratom, che Stabilisce Norme Fondamentali di Sicurezza Relative alla Protezione Contro i Pericoli Derivanti dall’esposizione alle Radiazioni Ionizzanti, e che Abroga le Direttive 89/618/Euratom, 90/641/Euratom, 96/29/Euratom, 97/43/Euratom e 2003/122/Euratom e Riordino della Normativa di Settore in Attuazione dell’articolo 20, Comma 1, Lettera a), della Legge 4 Ottobre 2019, n. 117. Available online: https://www.gazzettaufficiale.it/eli/id/2020/08/12/20G00121/sg (accessed on 9 February 2021).
  13. Decreto Legislativo del Governo n. 81 del 09/04/2008. D.Lgs. 81/2008. Attuazione dell’articolo 1 della Legge 3 Agosto 2007, n. 123, in Materia di Tutela della Salute e della Sicurezza nei Luoghi di Lavoro. Available online: http://www.parlamento.it/parlam/leggi/deleghe/08081dl.htm (accessed on 5 March 2021).
  14. Ministero della Salute. Piano Nazionale Radon. 2002. Available online: http://www.salute.gov.it/imgs/C_17_pubblicazioni_2436_allegato.pdf (accessed on 5 March 2021).
  15. Regione Autonoma della Sardegna. Classificazione del Territorio Regionale della Sardegna con Individuazione delle Aree a Rischio Radon. 2019. Available online: http://www.sardegnaambiente.it/documenti/21_393_20190417132602.pdf (accessed on 5 March 2021).
  16. Samet, J.M.; Avila-Tang, E.; Boffetta, P.; Hannan, L.M.; Olivo-Marston, S.; Thun, M.J.; Rudin, C.M. Lung cancer in never smokers: Clinical epidemiology and environmental risk factors. Clin. Cancer Res. 2009, 15, 5626–5645. [Google Scholar] [CrossRef] [PubMed] [Green Version]
  17. Grundy, A.; Brand, K.; Khandwala, F.; Poirier, A.; Tamminen, S.; Friedenreich, C.M.; Brenner, D.R. Lung cancer incidence attributable to residential radon exposure in Alberta in 2012. CMAJ Open. 2017, 5, E529–E534. [Google Scholar] [CrossRef] [PubMed] [Green Version]
  18. López-Abente, G.; Núñez, O.; Fernández-Navarro, P.; Barros-Dios, J.M.; Martín-Méndez, I.; Bel-Lan, A.; Locutura, J.; Quindós, L.; Sainz, C.; Ruano-Ravina, A. Residential radon and cancer mortality in Galicia, Spain. Sci. Total Environ. 2018, 610–611, 1125–1132. [Google Scholar] [CrossRef] [PubMed]
  19. Bochicchio, F.; Žunić, Z.S.; Carpentieri, C.; Antignani, S.; Venoso, G.; Carelli, V.; Cordedda, C.; Veselinovic, N.; Tollefsen, T.; Bossew, P. Radon in indoor air of primary schools: A systematic survey to evaluate factors affecting radon concentration levels and their variability. Indoor Air 2014, 24, 315–326. [Google Scholar] [CrossRef] [PubMed]
  20. Quarto, M.; Pugliese, M.; La Verde, G.; Loffredo, F.; Roca, V. Radon Exposure Assessment and Relative Effective Dose Estimation to Inhabitants of Puglia Region, South Italy. Int. J. Environ. Res. Public Health 2015, 12, 14948–14957. [Google Scholar] [CrossRef] [PubMed] [Green Version]
  21. Vimercati, L.; Fucilli, F.; Cavone, D.; Maria, L.D.; Birtolo, F.; Ferri, G.; Soleo, L.; Lovreglio, P. Radon Levels in Indoor Environments of the University Hospital in Bari-Apulia Region Southern Italy. Int. J. Environ. Res. Public Health 2018, 15, 694. [Google Scholar] [CrossRef] [PubMed] [Green Version]
  22. Branco, P.T.B.S.; Nunes, R.A.O.; Alvim-Ferraz, M.C.M.; Martins, F.G.; Sousa, S.I.V. Children’s Exposure to Radon in Nursery and Primary Schools. Int. J. Environ. Res. Public Health 2016, 13, 386. [Google Scholar] [CrossRef] [PubMed] [Green Version]
  23. Vukotic, P.; Stojanovska, Z.; Antovic, N. Developing a method for predicting radon concentrations above a reference level in new montenegrin buildings. J Environ. Radioact. 2021, 227, 106500. [Google Scholar] [CrossRef] [PubMed]
  24. Stanley, F.K.T.; Irvine, J.L.; Jacques, W.R.; Salgia, S.R.; Innes, D.G.; Winquist, B.D.; Torr, D.; Brenner, D.R.; Goodarzi, A.A. Radon exposure is rising steadily within the modern North American residential environment, and is increasingly uniform across seasons. Sci. Rep. 2019, 9, 18472. [Google Scholar] [CrossRef] [PubMed] [Green Version]
  25. Firenze, A.; Calamusa, G.; Amodio, E.; Morici, M.; Di Paquale, M.; Mazzucco, W.; Azara, A.; Muresu, E.; Dettori, M.; Maida, G.; et al. Evaluation of radon levels in indoor gymnasia of Palermo (Sicily) and Sassari (Sardinia). Ital. J. Public Health 2009, 6, 316–322. [Google Scholar]
  26. Azara, A.; Dettori, M.; Castiglia, P.; Piana, A.; Durando, P.; Parodi, V.; Salis, G.; Saderi, L.; Sotgiu, G. Indoor Radon Exposure in Italian Schools. Int. J. Environ. Res. Public Health 2018, 15, 749. [Google Scholar] [CrossRef] [PubMed] [Green Version]
  27. Istituto Superiore di Sanità (ISS). EpiCentro. Radon—Aspetti Epidemiologici. Available online: https://www.epicentro.iss.it/radon/epidemiologia (accessed on 5 March 2021).
  28. Istituto Superiore per la Prevenzione e la Sicurezza del Lavoro (ISPESL). Il Radon in Italia: Guida Per il Cittadino. 2007. Available online: http://www.salute.gov.it/imgs/C_17_opuscoliPoster_160_allegato.pdf (accessed on 5 March 2021).
  29. Barros, N.G.; Steck, D.J.; Field, R.W. A comparison of winter short-term and annual average radon measurements in basements of a radon-prone region and evaluation of further radon testing indicators. Health Phys. 2014, 106, 535–544. [Google Scholar] [CrossRef] [PubMed]
  30. Mnich, Z.; Karpińska, M.; Kapała, J.; Kozak, K.; Mazur, J.; Birula, A.; Antonowicz, A. Radon concentration in hospital buildings erected during the last 40 years in Białystok, Poland. J. Environ. Radioact. 2004, 75, 225–232. [Google Scholar] [CrossRef] [PubMed]
Figure 1. Range of values detected in the 24 inspections. Rx = room number. 1st = first inspection. 2nd = second inspection.
Environments 08 00028 g001
Figure 2. Average values and standard deviations of radon in the 24 inspections—a 24-h trend.
Environments 08 00028 g002
Table 1. Radon inspections in 14 rooms of 7 different hospital pavilions. Descriptive analysis.
Building CharacteristicsNumber (%)
Construction period<19000/14 (0.0)
1900–19503/14 (21.4)
1951–19640/14 (0.0)
1965–19796/14 (42.9)
≥19805/14 (35.7)
Underground renovation6/14 (42.9)
Type of structureFloor below ground level3/14 (21.4)
Partially underground2/14 (14.3)
2 basement walls9/14 (64.3)
Wall materialCement12/14 (85.7)
Stone1/14 (7.1)
Wood0/14 (0.0)
Coated metal1/14 (7.1)
Flooring materialCement8/14 (57.1)
Floor tiles4/14 (28.6)
Wood0/14 (0.0)
Earth0/14 (0.0)
Linoleum2/14 (14.3)
Floor in direct contact with ground14/14 (100.0)
External entrance doors3/14 (21.4)
Windows7/14 (50.0)
Underground walls adjacent to a cavity wallTotally3/14 (21.4)
Partially3/14 (21.4)
None7/14 (50.0)
Underground rocky walls0/14 (0.0)
Water infiltration/Damp4/14 (28.6)
Wind exposureLow2/14 (14.3)
Medium3/14 (21.4)
High1/14 (7.1)
Nil8/14 (57.1)
Sun exposureLow1/14 (7.1)
Medium6/14 (42.9)
High0/14 (0.0)
Nil7/14 (50.0)
Exposed PipingNone3/11 (21.4)
In side wall10/11 (90.9)
In ceiling1/11 (9.1)
Table 2. Average values, standard deviation and highest levels of radon detected in the radiotherapy bunkers.
RoomsAverage Values (Bq/m3)Standard Deviation (Bq/m3)Highest Levels (Bq/m3)
Bunker 1464.21843.812,136.0
Bunker 21670.56232.236,963.0
Table 3. Average values, standard deviation and highest levels of radon detected in the rooms inspected, excluding the radiotherapy bunkers.
RoomsAverage Values (Bq/m3)Standard Deviation (Bq/m3)Highest Levels (Bq/m3)
Post-operative room7.38.648.1
Storage room12.312.859.2
Outpatients cinic18.818.674.0
Pre-MRI scan room7.510.037.0
Dentistry department21.621.588.8
Laboratory 17.89.037.0
Laboratory 214.812.048.1
Laboratory 318.418.285.1
Archive 121.615.874.0
Archive 28.410.137.0
Glassware washing room9.310.737.0
Disposal room15.216.285.1
Table 4. Statistical significance in the differences between radon concentrations in relation to the absence/presence of certain variables within the premises examined.
Variablep-Value
Contruction period0.779
Underground renovation0.438
Type of structure0.856
Wall material0.584
Flooring material0.366
External entrance doors0.186
Presence of windows0.035
Underground walls0.406
Water infiltration/Damp0.066
Wind exposure0.196
Sun exposure0.035
Exposed piping0.051
Publisher’s Note: MDPI stays neutral with regard to jurisdictional claims in published maps and institutional affiliations.

