
COVID-19 and the Environment, Review and Analysis

1
Independent Researcher, 1500 Brecknock Rd., Greenport, NY 11944, USA
2
Independent Researcher, 360 Bonnie Bray, Bonny Doon, CA 95060, USA
*
Author to whom correspondence should be addressed.
Environments 2021, 8(5), 42; https://0-doi-org.brum.beds.ac.uk/10.3390/environments8050042
Submission received: 30 March 2021
/
Revised: 4 May 2021
/
Accepted: 4 May 2021
/
Published: 11 May 2021
(This article belongs to the Special Issue Environmental Implications of COVID-19 Pandemic)
Abstract
:We reviewed studies linking COVID-19 cases and deaths with the environment, focusing on relationships with air pollution. We found both short- and long-term observational relationships with a range of regulated pollutants, although only two studies considered both cases (i.e., infections) and deaths within a common analytical framework. Most of these studies were limited to a few months of the pandemic period. Statistically significant relationships were found more often for PM2.5 and NO2 than for other regulated pollutants, but no rationale was suggested for such short-term relationships; latency was seldom considered for long-term relationships. It was also unclear whether confounding had been adequately controlled in either type of study. Studies of air quality improvement following lockdowns found more robust relationships with local (CO, NO2) rather than regional (PM2.5, O3) pollutants, but meteorological confounding was seldom considered. Only one of seven studies of airborne virus transmission reported actual measurements. Overall, we found the existing body of literature to be more suggestive than definitive. Due to these various deficiencies, we assembled a new state-level database of cumulative COVID-19 cases and deaths through March 2021 with a range of potential predictor variables and performed linear regression analyses on various combinations. As single predictors, we found significant (p < 0.05) relationships between cumulative cases and household crowding (+), education (−), face-mask usage (−), or voting Republican (+). For cumulative deaths, we found significant relationships with education (−), black race (+), or previous levels of PM2.5 (+). NOx (+), and elemental carbon (EC, +). We found no relationships between long-term air quality and cumulative COVID-19 cases. Our associations linking air pollution with COVID-19 mortality were not statistically different from those for all-cause mortality in previous studies. In multiple mortality regressions combining air pollution, race, and education, NOx and EC remained significant but PM2.5 did not. We concluded that the current worldwide emphasis on PM2.5 is misplaced. We predicted air pollutant effects of a few percentage points, but individual differences between races, political identification, and post-graduate education were of the order of factors of 2 to 4. In general, the factors predicting infection were personal and related to COVID-19 exposure, while those predicting subsequent mortality tended to be more situational and related to geography. Overall, we concluded that how you live is more important than where you live.
1. Introduction
The medical literature now includes thousands of papers on COVID-19 and the coronavirus and includes environmental concerns, mainly with air pollution effects that cut both ways. Ambient air quality improves with reduced economic activity during lockdowns, i.e., virus effects on the ambient. There have been suspicions that susceptibility to the virus may have been enhanced by prior long-term exposures, i.e., ambient effects from the virus. Virus transmission by aerosol has also been hypothesized. While atmospheric changes can be readily monitored and modeled, human responses to the virus are not amenable to clinical study nor to cohort epidemiology. This leaves observational epidemiology as the only approach in understanding the substantial observed variations in COVID-19 related infections and deaths.
We reviewed this literature with regard to the following questions. How do lockdowns affect concentrations of specific pollutants and what are the implications for air pollution control strategies? Do studies of COVID-19 associations with ambient air quality comport with what has been learned from cohort and observational studies of other health endpoints? Is the virus transmission hypothesis consistent with existing knowledge of ambient particulate matter physics and chemistry? Although there may be additional issues with respect to solid and waste-water disposal, they are not considered here.
Our review of the extant COVID-19 air pollution epidemiology revealed some important shortcomings. There is little overlap between studies of rates of infections and of deaths. Pollutants have often been studied singly rather than in combination. Little attention has been given to the adequacy of confounder control. Associations with COVID-19 mortality have not been compared with those for other causes of death. To help fill these gaps, we present findings from a new study of air pollution of cases and deaths among US states.
2. Literature Review
The COVID-19 pandemic has spawned an enormous surfeit of new publications, over 120,000 at the time of writing, about 100,000 of which have open access. The earliest such paper [1] was published in January 2020 and warned of the dangers of “vaping and coronavirus”. Note that this type of PubMed search picks up any mention of the search term, regardless of context. Requiring the search terms to include “air pollution” reduced the count to about 700, of which 90 were classified as review papers. Results of further successive search restrictions led to the following citation counts:
| PM2.5 or PM10: | 230 |
| PM2.5 or PM10 + NO2: | 137 |
| PM2.5 or PM10 + NO2 + O3 | 77 |
| PM2.5 or PM10 + NO2 + traffic: | 23 |
| PM2.5 + carbon (not CO) | 5 |
| traffic + carbon (not CO) | 11 |
| Indoor | 81 |
| time-series | 20 |
Geographic distributions based on any mention were:
| China: | 213 |
| Global: | 160 |
| Europe | 110 |
| India: | 110 |
| United States: | 80 |
| Canada: | 35 |
| California: | 28 |
| New York | 25 |
| Japan: | 24 |
| Africa: | 19 |
| South America: | 14 |
| Israel: | 4 |
Air pollution has several contexts in this literature, the most common of which is concerned with air quality changes resulting from lockdowns or other travel restrictions. Next is associations with comorbidity that might affect vulnerability to the virus. The final category involves suspended particulates or aerosols as carriers for virus particles.
We selected 140 papers that seemed appropriate for detailed scrutiny. Of those, 5 were related to transmission, 30 to linkages with COVID-19 health effects, and 102 with the effect of lockdowns on ambient air quality. Geographic diversity was most evident in the last category. A more extensive bibliography is presented as Appendix A.
2.1. Short-Term Associations between COVID-19 and Ambient Air Quality
Short-term analyses test the hypothesis that days with high rates of infection or mortality follow days with worse air quality [2]. Such analyses are based on daily rates of new cases or deaths and must allow for the COVID-19 incubation period, generally thought to be about 5 days. They must also consider other time-related factors including weather, holidays, and days of the week. All of the studies we considered met these requirements. Other factors that could introduce bias into such studies include delays in case reporting and differences between indoor and outdoor air quality.
These COVID-19 studies differ substantially from time-series studies of all-cause mortality that frequently require data over several years to achieve statistical significance, while these studies of COVID-19 comprised only a fraction of the total pandemic, typically a few months. All-cause mortality risks are generally only a few percentage points while the COVID-19 relative risk estimates may be around 1.5 or more.
Table 1 summarizes findings from the five short-term studies that we found and are quite similar despite their geographic diversity. Table 1 indicates whether the risk estimates were positive or negative and statistically significant; we could not compare their numerical risk estimates because of differences in the reporting metrics used. These are single-pollutant estimates that could have been influenced by inter-pollutant correlations and thus could be over-estimates.
Short-term (daily) studies require precise timing of exposure and response that is limited by delays in case reporting and uncertainties in the virus incubation period. Most of the extant (non-COVID) studies of daily air pollution and mortality focused on the frail elderly, but this is not the case with COVID-19.
Table 1 comprises 45 risk estimates, of which only two would be statistically significant due to chance; here, we find 27 to be significant. PM2.5 and NO2 had the most consistently significant adverse short-term relationships.
There is substantial literature on the effects of daily perturbations in ambient air quality on daily mortality from all causes. For example, our analysis for Chicago [2] showed the importance of summing over the lag period and for adequate control of simultaneous temperature peaks. Effects of NO2 in Table 1 ranged up to 6%; it thus remains to be seen whether any short-term COVID-related effects might be truly “excess”. Our short-term studies of mortality and air pollution [2] also showed the importance of prior frailty and that only the frail elderly were at risk.
2.2. Long-Term Associations between COVID-19 and Ambient Air Quality
A long-term analysis, referred to as cross-sectional, tests the hypothesis that locations having high rates of infection are associated with places with worse long-term ambient air quality, typically based on cumulative cases or deaths. The underlying rationale is that such long-term exposures to polluted air would have resulted in co-morbidity that enhanced subsequent susceptibility to the virus. Such analyses must allow for comorbidity latency periods, often decades. In addition, they assume that the personal experiences of residents match the average properties of their residential locations, the so-called “ecological fallacy”. This study design inherently compounds this issue of selectivity and representativeness; comorbidity studies typically find that air pollution affects only a small fraction of the population at risk, say 10% of those who contracted a disease, who comprise about 10% of those aged 20 or above based on heart disease, for example. The current cumulative rate of COVID-19 infection in the United States is about 9%; the odds of both pollution-related heart disease comorbidity and COVID-19 infection would thus be about 0.9%. About 1% of COVID-19 cases die from COVID-19, so the odds of both pollution-related heart disease comorbidity and COVID-19 mortality would be about 0.009%. The studies reviewed here (see below) may find that 25% of those were also associated with long-term air pollution, so that the combined cumulative air-pollution COVID-19 death rate could be about 22 per million population or about 1.3% of the total pandemic deaths in the US.
In addition, cross-sectional studies must account for personal characteristics of the participants (age, race, gender, smoking habit, income, body-mass index, stature) and community (population density, fraction of green space, traffic density, climate, socioeconomic status, elevation above sea level). In addition to meeting these design requirements, cross-sectional analysis requires accurate long-term exposure data for each of the air pollutants in the area under consideration, including indoor exposures.
Cross-sectional studies follow either of two modalities: studies of specific persons comprising a defined cohort, or studies of populations defined by residential location in which personal characteristics must be inferred from area-wide averages, often referred to as ecological. We found one COVID cohort study in our search but none of the seven studies met all of the requirements discussed above.
Table 2 summarizes the results of these studies in terms of air pollution associations, mostly with mortality as the endpoint. Particulate matter was studied most often, followed by NO2 (or NOx), and was positive and statistically significantly in 13 of the 18 estimates. There were no clear distinctions among endpoints or the nationalities studied. These studies covered a wide range of time periods up through September 2020 and were based on cumulative events.
It is important to realize that none of these air pollution studies involved personal exposures and that studies of the entire US or UK involved modelled rather than measured concentrations. None of those studies considered latency periods and only Elliott et al. [10] considered truly long-term (10 y) exposure. The correct interpretation of these associations is thus that COVID-19 may be more severe in locations with higher particulate concentrations but it cannot be assumed that outdoor air quality was responsible for these outcomes.
3. Air Quality Considerations
3.1. Effects of Pandemic Restrictions
To limit virus transmission, most political jurisdictions restricted business and personal activities during the pandemic, often approaching lockdowns and characterized by deserted freeways and public spaces. The resulting reductions in emissions improved air quality and provided unparalleled opportunities to evaluate potential air pollution control strategies. The literature includes numerous examples of major cities around the world, especially in Asia, and often emphasizing fine particles (PM2.5). Here, we review papers that appear to be of general applicability. Most of them compared ambient concentrations before and during lockdown, several compared values before, during, and after lockdown, and Bekbulat et al. [17] also considered seasonal corrections. Most studies were based on routine monitoring data from regulatory networks. Chauhan and Singh [18] focused on PM2.5 and reported reductions ranging from 4% to 32% worldwide, corresponding to a median reduction of about 11%.
Hudda et al. [19] deployed research-grade instruments in a mixed residential–commercial neighborhood near Boston, MA, measuring black carbon (BC) mass concentrations and ultrafine particle (PNC) number concentrations. Truck and car traffic dropped by 46% and 71%, respectively and BC and PNC concentrations decreased by 34% and 64%, for an essentially linear response. BC concentrations were 50% lower and NO2 concentrations were about 40% lower at nearby routine air quality monitoring sites. However, changes in PM2.5 levels were inconsistent, −9% near the freeway and −52% at an urban background site.
Bekbulat et al. [17] used routine air quality monitoring data for the entire US for PM2.5, PM10, O3, NO2, and CO. They used models to estimate “expected” ambient concentrations during lockdown periods, thus adjusting for seasonal trends. They concluded that PM2.5 concentrations were not reduced below their normal range of variability and that PM10, O3, NO2, and CO level reductions were “modest and transient”.
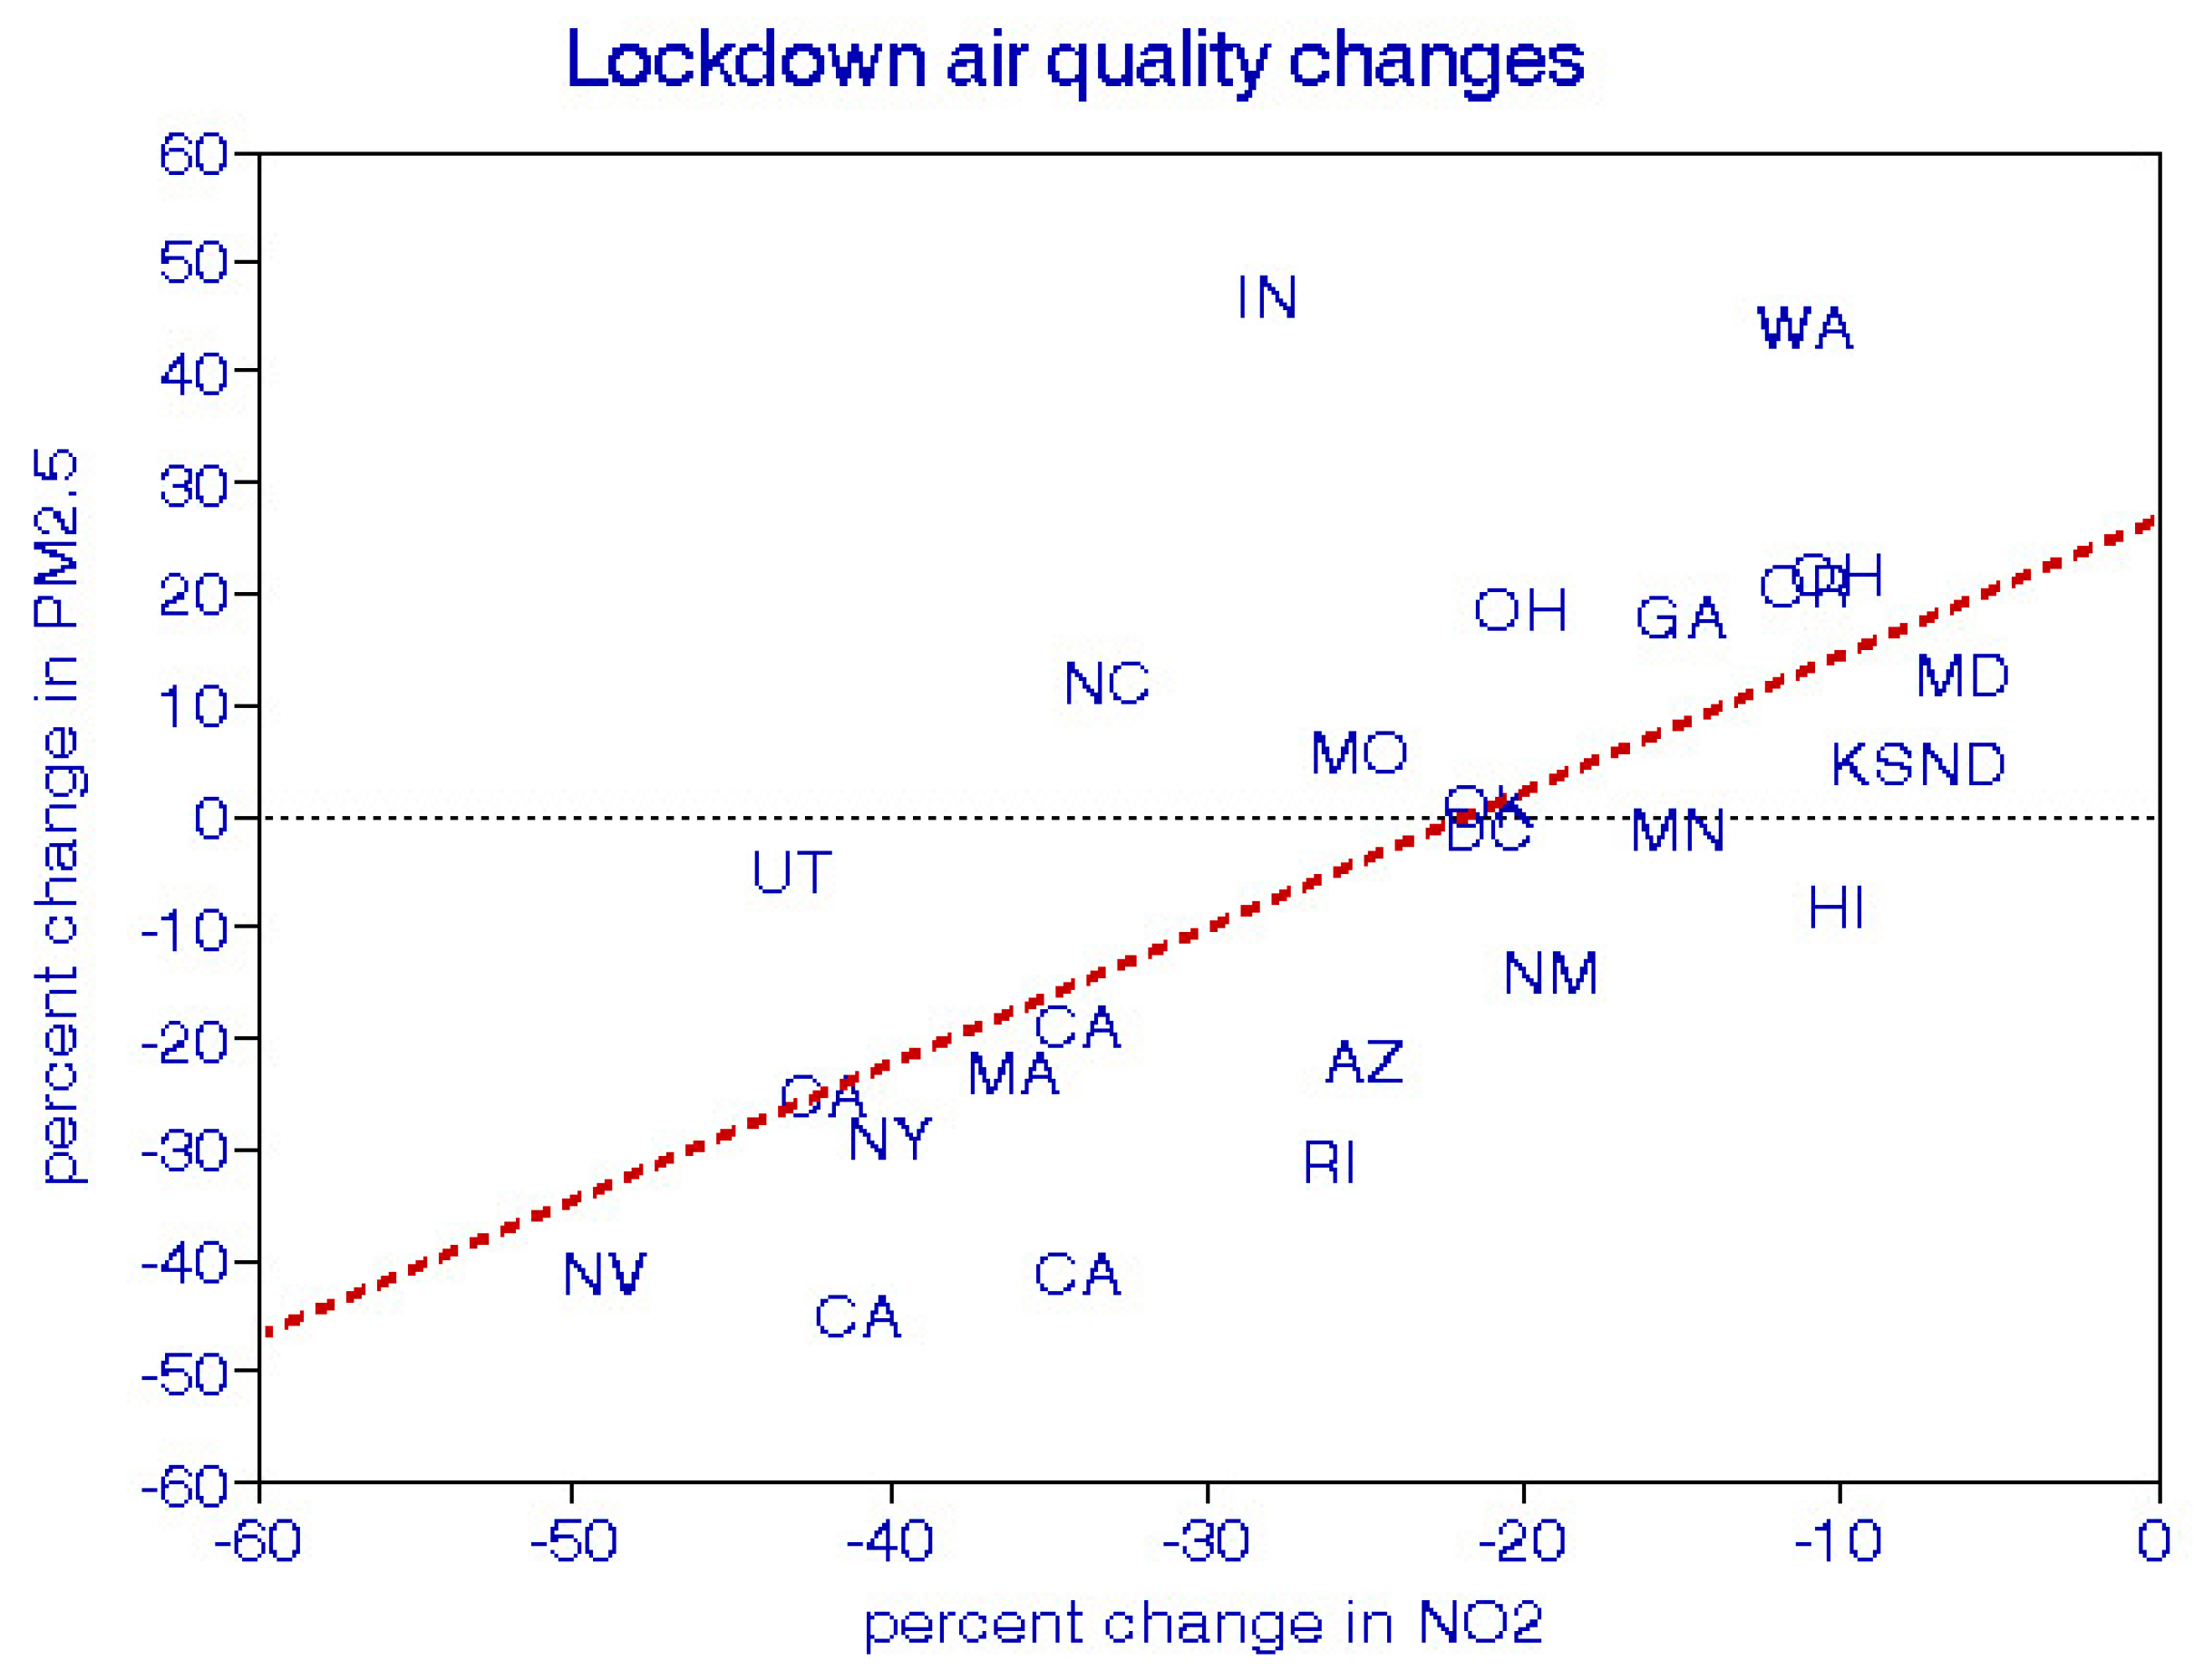
Chen et al. [20] compared routine monitoring data for 28 metropolitan areas in terms of percent changes rather than actual concentrations. We took their analysis a step further and used linear regressions to compare the lockdown changes by pollutant. The empirical equation for the reduction in PM2.5 by city shown in Figure 1 is
ΔPM2.5 = 26 + 1.22 (0.61 − 1.82)ΔNO2 (R = 0.63)
Note that the regression coefficient is not significantly different from unity, suggesting that lockdowns had equivalent effects on both pollutants that may be interpreted as the traffic-related contributions to PM2.5, but that the intercept (26 µg/m3) indicates the importance of non-traffic sources. In the absence of traffic, the lockdowns have apparently increased PM2.5 (the data points for IN (Indianapolis) and WA (Seattle) are both statistically significant). This suggests that sources of non-traffic PM2.5 were not affected by the lockdown and has implications with respect to air pollution control strategies.
We also developed regression equations for CO and O3:
ΔCO = −2.6 + 0.48 (0.09 − 0.90)ΔNO2 (R = 0.49)
ΔO3 = −6.4 − 0.20 (−0.55 − 0.15)ΔNO2 (R = −0.22)
Equation (2) shows that percentage reductions in CO are significantly associated with those for NO2 at about half of the value, and that there are no other sources (intercept = ~0). Equation (3) confirms that the lockdown had no discernable effect on O3.
Jephcote et al. [21] analyzed air quality data for the entire UK during lockdown periods and concluded that traffic was reduced by 69% overall, NO2 by 38%, and PM2.5 by 16%. Reductions were greatest at urban traffic sites and less at more residential locations. Xiang et al. [22] presented a more detailed analysis of a lockdown in Seattle and reported that adjusting for changes in meteorology can be important.
3.2. Indoor Air Quality
Coping with the pandemic raises various air quality issues [23]. People spend essentially all of their time indoors during lockdown, thus reducing effects of outdoor emissions and potentially improving ambient air quality. Effects on indoor air quality depend on infiltration from the outdoors, use of air conditioning or ventilation systems, use of sanitation solvents, increased physical activity and cooking, and use of fireplaces. Many of these factors are climate dependent. Long-term indoor air quality during the pandemic is likely to differ substantially from pre-pandemic levels. In any event, outdoor air quality during the pandemic has been an inadequate measure of actual exposures. Recent guidance from the Centers for Disease Control calls for substantially increased outdoor ventilation that would also complicate air pollution epidemiology in terms of increasing the diversity of personal exposures. Unfortunately, the literature on this topic is quite sparse.
The situation with short-term exposures as used in time-series analysis is quite different [2]. About 50% of outdoor air pollution penetrates indoors with essentially the same frequency distribution, while the contributions of indoor sources remain constant. Thus, any time-dependent associations with daily outdoor air quality will also relate to indoor environments. As a result, short-term air pollution associations are inherently more credible than long-term.
Dominguez et al. [24] reported that outdoor PM2.5 declined from 11 to 7 μg/m3 during lockdown in Madrid while indoor levels rose by 12%, presumably as a result of increased indoor activities. Much larger indoor increases were reported for volatile organic compounds (VOCs).
3.3. Air Pollution and Virus Transmission
In this section, we review what has been published on airborne particulate matter as a virus carrier thereby exerting direct effects on COVID-19 infections. Most of these papers discussed the “possibilities” of the hypothesis, based on biology and factors controlling lung penetration and deposition, which are highly dependent on particle size and composition. However, data on ultrafine particles that might be the most logical carriers are extremely sparse [21]. The paper by Chirizzi et al. [25] is a notable exception, based on actual PM10 measurements in Italy and determination of accompanying genetic material. They used a cascade impactor to separate the collected material into 12 size ranges and concluded that “Outdoor air in residential and urban areas was generally not infectious and safe for the general public in both northern and southern Italy, with the possible exclusion of very crowded sites”. Faridi et al. [26] collected particles sized from 0.25–32 μm near hospitalized COVID patients; they tested negative based on the Reverse Transcription PCR test.
4. Cross-Sectional Analysis of Air Quality and Cumulative COVID-19 Cases and Deaths by State
The preceding review of long-term COVID-19 relationships with ambient air quality, focused on mortality covered modest periods of the pandemic, used single-pollutant analyses without considering interactions with non-pollutant factors, and showed heterogeneous results. Here, we use state-level data [https://www.nytimes.com/interactive/2020/us/coronavirus-us-cases.html] through 20 March 2021, in conjunction with census data to estimate relationships with previous average levels of PM2.5, NOx, and elemental carbon (EC) [27,28]. The variables used are state-wide averages (Table 3). Cumulative COVID-19 cases and deaths are expressed in terms of one million persons and the analysis is limited to the contiguous United States and the District of Columbia.
4.1. Data and Methods
We present median values for variables having substantially skewed distributions. Note that the total US case and death counts would be 29 million and 480 thousand when based on the US population of 330 million, consistent with press reports at that time. Our analysis is not population-weighted; we consider each state to be an independent sample of the nation for statistical purposes. For example, Vermont and California data carry the same weight.
4.2. Results
We made 26 univariate significance tests in Table 3 of which we would expect one to be significant at the 95% confidence due to chance. However, we obtained nine, all of which had the expected signs, negative for education and mask use and positive for household crowding and air pollution. We expected many of these variables to be intercorrelated; multivariate regressions would thus be required to test for independence. As we are primarily interested in air pollution, we confined this part of the analysis to relationships with deaths and added the variables for Black residents and education level to the regressions for PM2.5, NOx, and EC Equations (4)–(7).
ln (deaths/million) = 7.22 + 0.0304 (0.024) PM2.5 − 0.0074 (0.0042) education − 0.0066 (0.0062)% Black
ln (deaths/million) = 7.78 + 0.0282 (0.0106) NOx − 0.0138 (0.0046) education + 0.00002 (0.0006)% Black
ln (deaths/million) = 7.72 + 0.652 (0.255) EC − 0.0142 (0.0048) education − 0.00002 (0.0007)% Black
ln (deaths/million) = 7.56 + 0.0252 (0.0095) NOx + 0.0163 (0.022) PM2.5 − 0.0127 (0.0042) education
These relationships indicate that NOx and EC (both of which relate to vehicular traffic) remain significant in multi-variable regressions by contrast with that for PM2.5, but NOx prevails when regressed jointly with PM2.5 Equation (7) and education prevails over skin color, as expected.
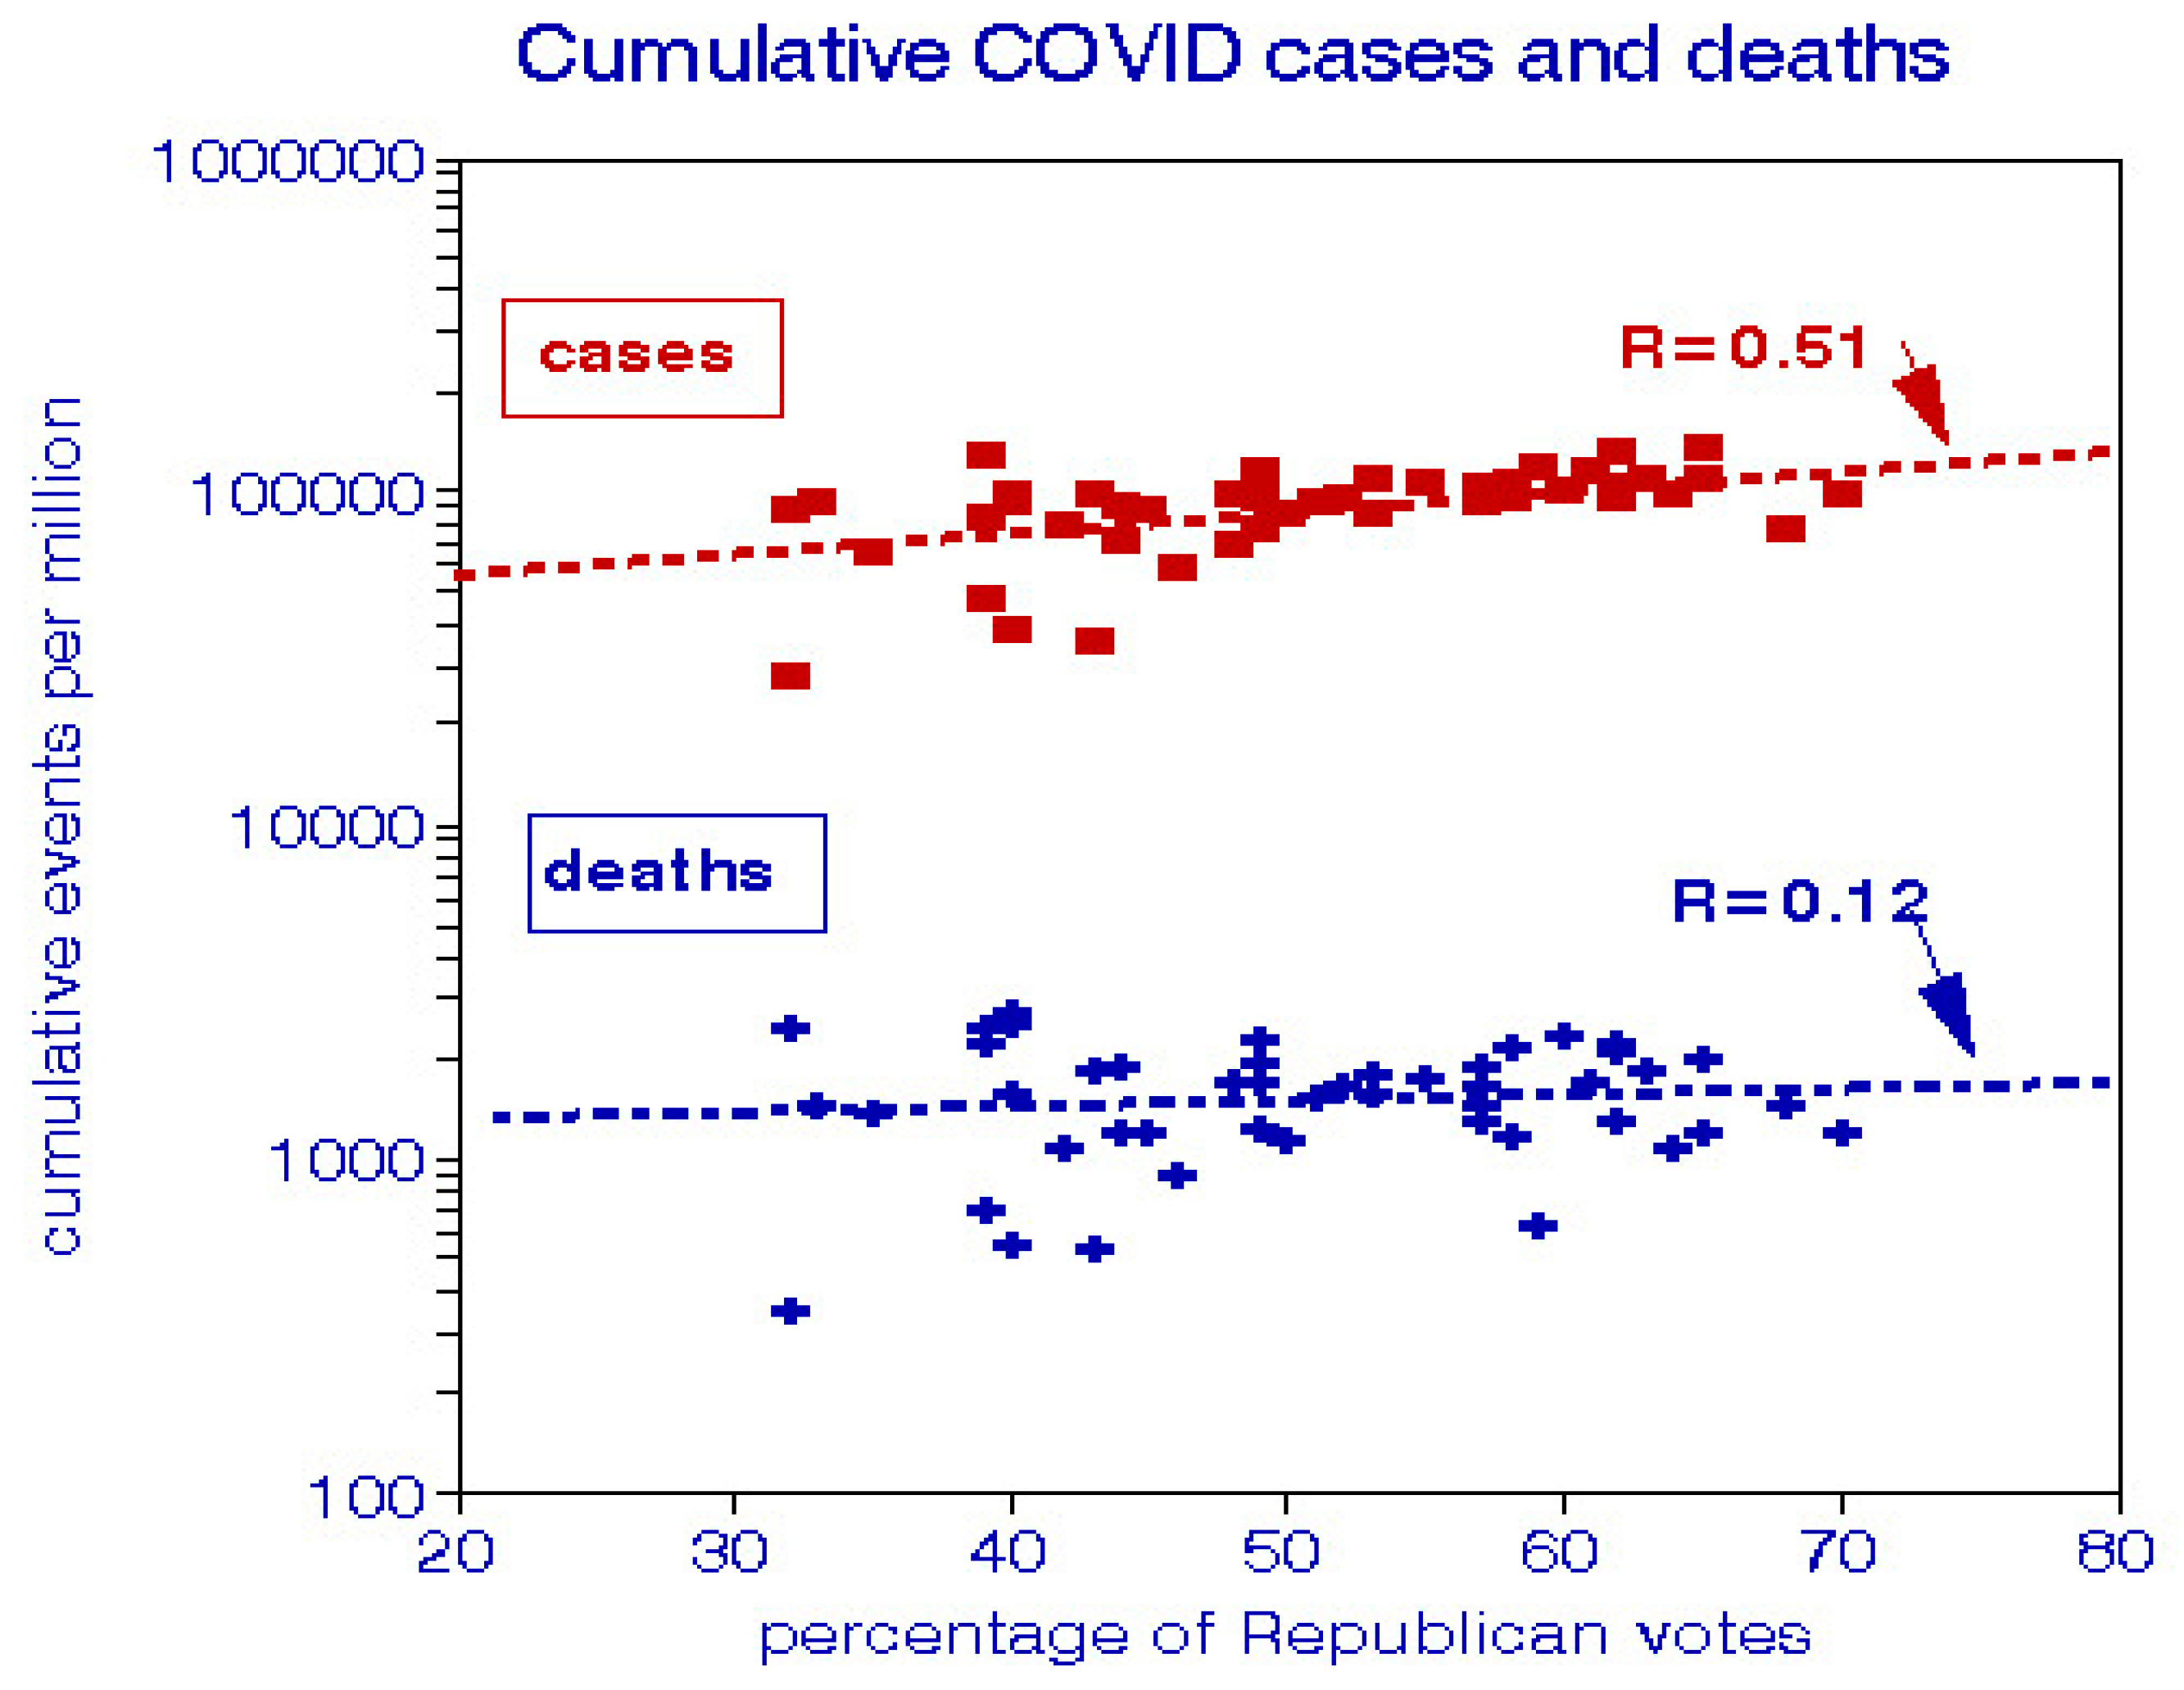
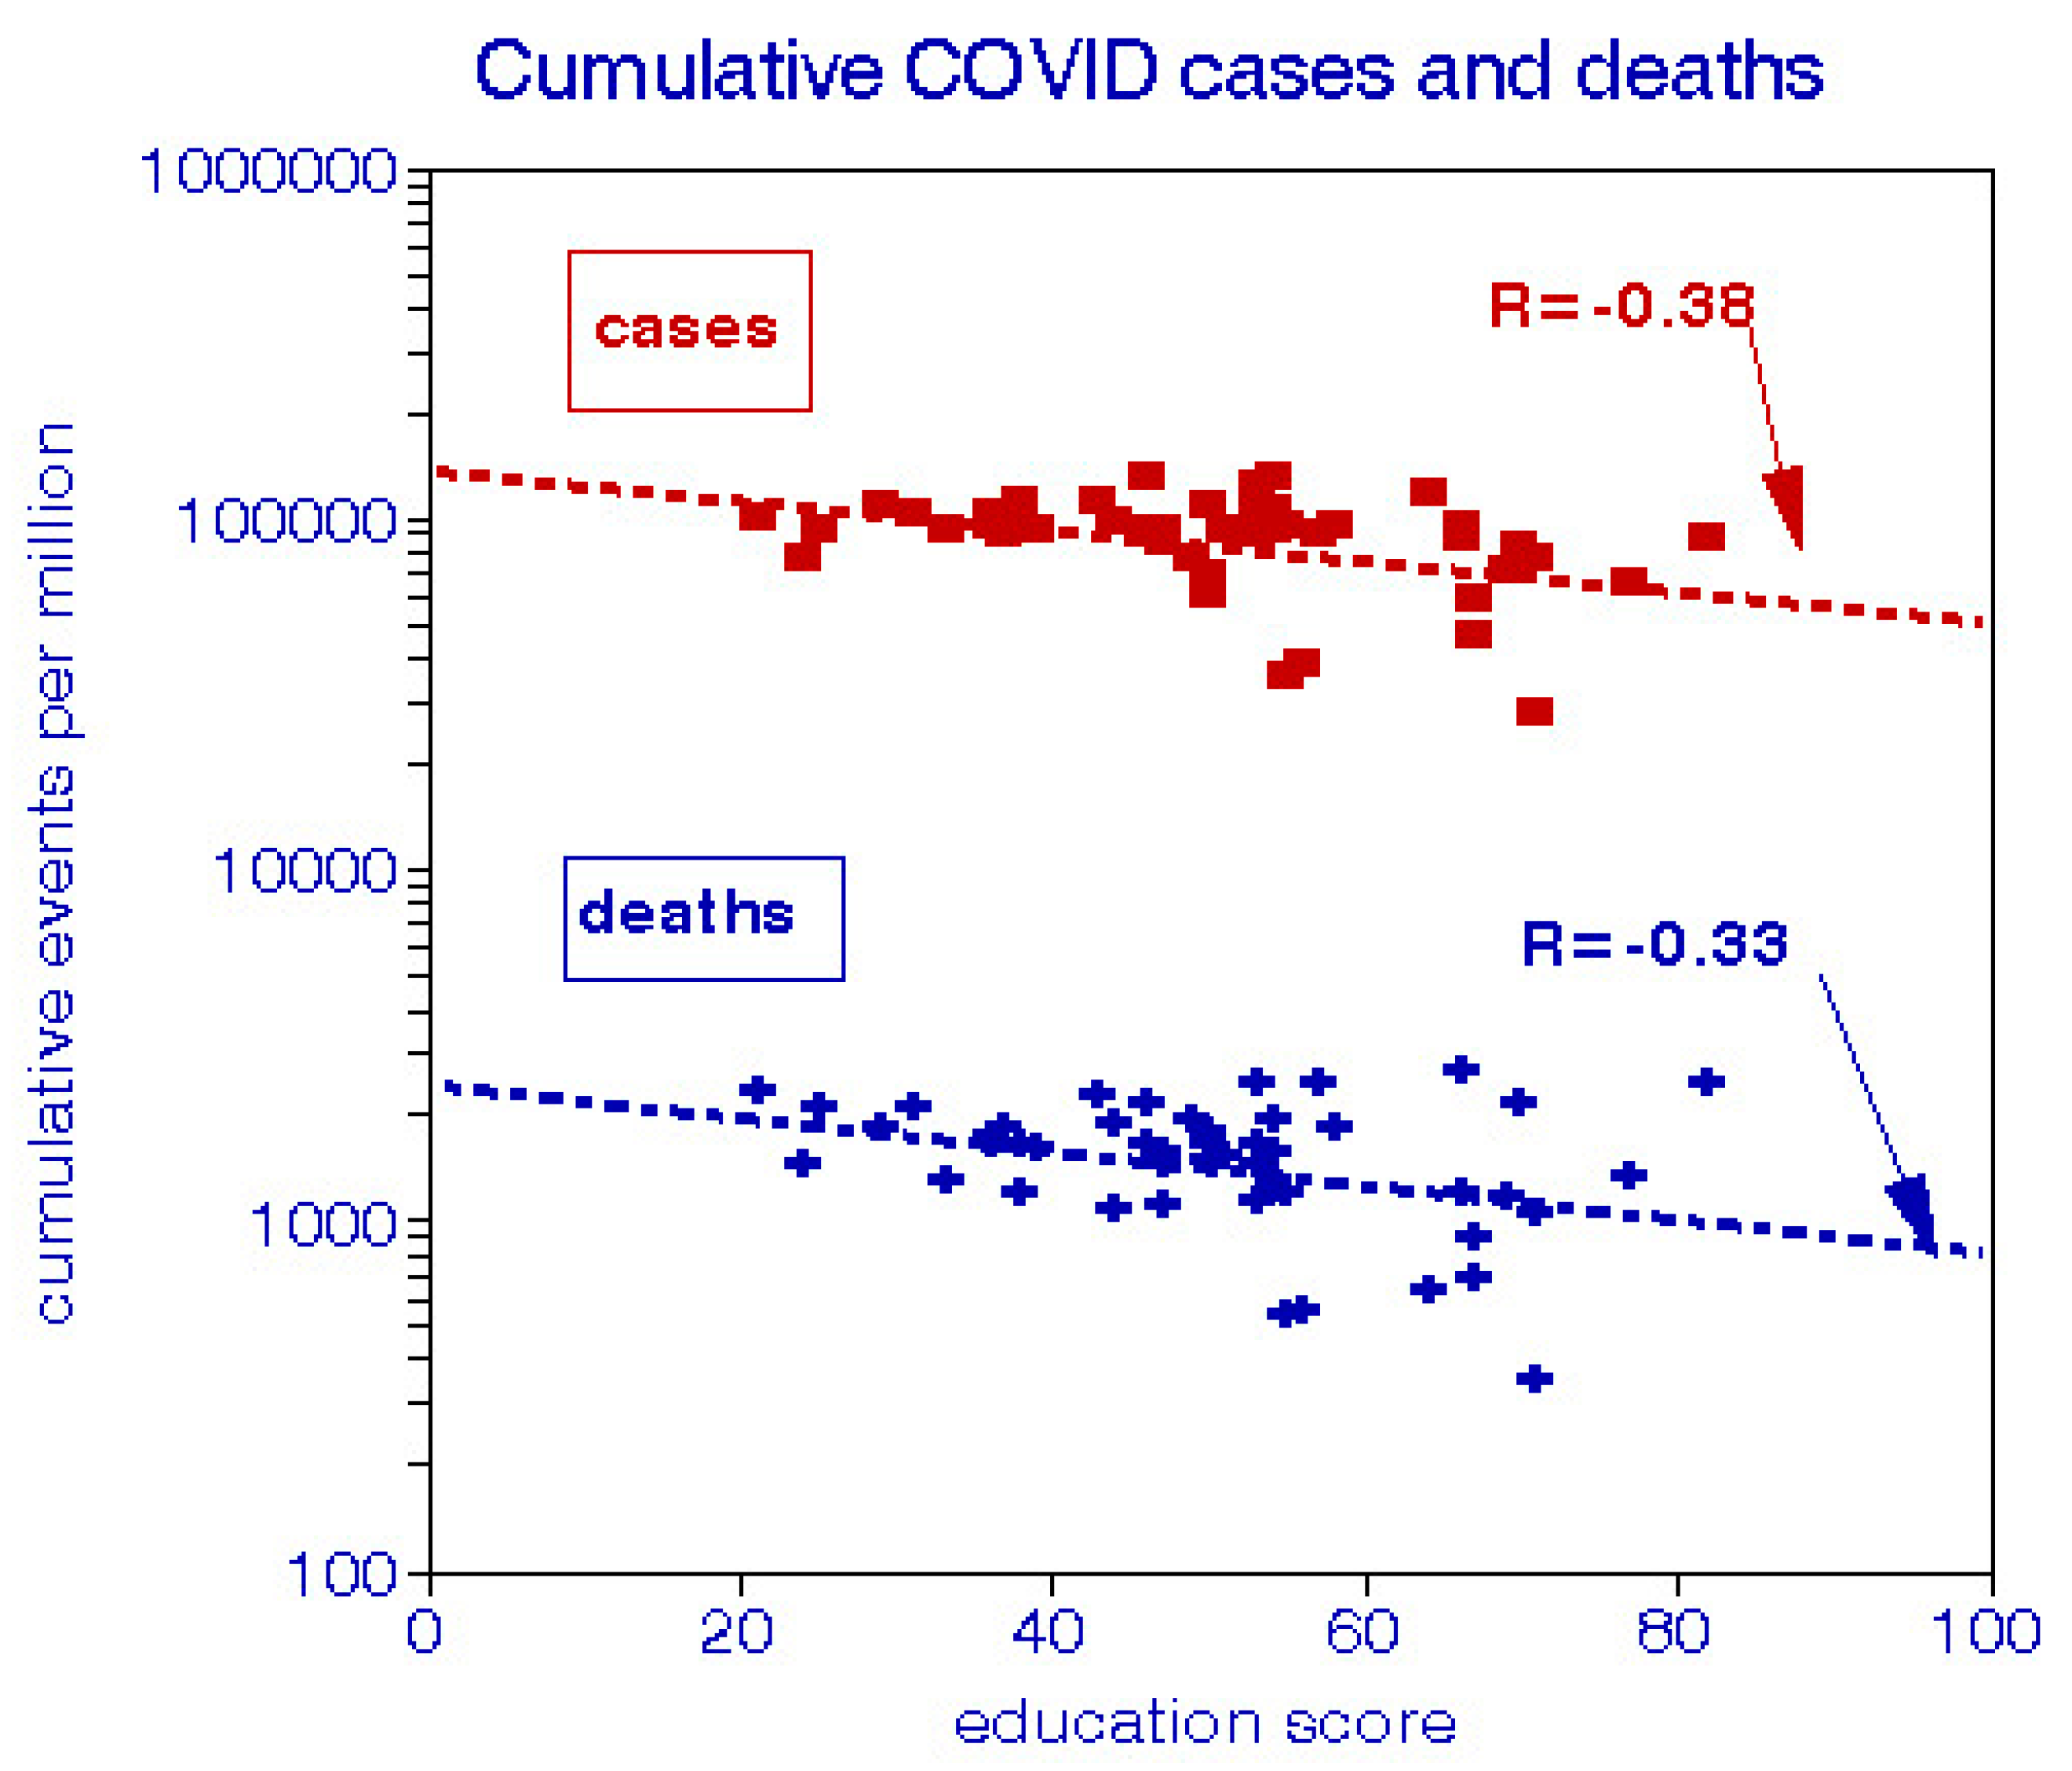
Figure 2, Figure 3 and Figure 4 display linear relationships with COVID-19 and personal characteristics. The patterns for cases and deaths are similar, indicating systematic effects. These graphs indicate that some low-COVID states (WA, OR, ME, VT) have low crowding, more education, and fewer Republicans, perhaps suggesting synergism. These low-COVID states would appear to be relatively more important if a linear y-axis had been used. Figure 5 and Figure 6 also show that these low-risk states also have better air quality.
4.3. Regression Analysis Discussion
The independent variables in Table 3 comprise two categories: personal (education, face mask use, political affiliation, income, education, persons per household) for which the individual has some control, and situational (population density, race, distance from New York City, air quality), for which the individual has little or no control. Our results indicate that COVID-19 cases tend to be associated with personal factors and deaths associated with situations.
We also note that the relative magnitudes of change are small and trivial with respect to the range of variations among states as seen in Figure 2, Figure 3, Figure 4, Figure 5 and Figure 6. Cases vary by about a factor of 5 among the states and deaths vary by about a factor of 8; Table 3 thus indicates that only small portion of the variance among states (maximum of 26% of the variance) can be explained by reasonable increments in these variables, statistical significance notwithstanding. However, classification variables like percentages of Black residents or Republican voters can also be compared on the basis of yes (100%) or no (zero), which yields factors of 2–4 for deaths or CFRs for Blacks and factors of 3–4 for Republicans. The range for mask usage is about a factor of 2 as is the maximum education effect. The latter is consistent with published data comparing high school with postgraduate education. Longitudinal studies show that the national COVID-19 case “waves” range over about a factor of 10, while a Black, poorly educated, Republican without a mask could experience a mortality risk level of about 3 × 3.5 × 2 × 2 = 40, assuming that all factors were independent, (however unlikely).
Most of our predictor variables serve as indicators and should not be taken literally. Voting Republican is not lethal and receiving a university diploma is not in itself life-saving. Rather, these parameters serve to indicate compliance with COVID-19 exposure guidelines or following healthy lifestyles. Higher education is associated with lower risks of both infection (less exposure) and subsequent mortality (less smoking, lower body-mass index, less comorbidity). Our significant air pollutants (EC, NOx) relate to vehicular traffic density as in city centers and encapsulate effects of noise, dust from tires and brake pads and lubrication oil combustion products. We interpret these relationships as pertaining to the locations and land-use patterns that have been stable over time, rather than to personal exposures that may have varied.
It is also pertinent to compare COVID-19 with all-cause mortality risks associated with air pollution, shown in Table 4 on the basis of mean concentrations. There are no significant differences, indicating that the air pollution effects shown in Table 3 may have occurred with or without the pandemic. Note that the pandemic risk estimates are controlled for Black race, while these all-cause cohort estimates were controlled for a number of personal and location-specific characteristics [27,28]. As cases and deaths share common temporal and spatial relationships, the case-fatality ratio (CFR) is somewhat less variable. We found that NOx and EC were significant predictors of CFRs but with smaller incremental effects.
4.4. Summary of the New Analysis
This analysis is based on state-to-state differences in COVID-19 cases and deaths accumulated over the entire pandemic through mid-March 2021. The predictor variables we used are assumed to have remained fixed during the pandemic, which is clearly not the case with face mask usage, for example. The predictor variables for cases relate to exposures, including crowding and face-mask usage, and they relate to susceptibility such as race or previous exposure to air pollution with respect to deaths. Above, we combined the probability of enhanced susceptibility from prior air pollution with the probability of a COVID-related death and estimated the combined air pollution risk of COVID death as a few percentage points, at most. This cross-sectional analysis (Table 3) is consistent with this estimate and shows that traffic-related pollutants are more likely to be involved than PM2.5. Our most important findings are those relating to preventing infection (cases). Those factors are individually actionable and supported by previous (non-COVID-19) estimates. By contrast, our estimates of air pollution—COVID mortality risks provide no evidence that they might exceed those associated with all-cause mortality during this period.
5. Overall Conclusions
Although a large body of literature exists on air pollution and COVID-19, much of it shares common shortcomings: limited coverage of the pandemic period, considering only one pollutant at a time, and inadequate consideration of confounding. We found no physiological rationale for the hypothesis that air pollution might increase daily rates of infection (cases). The extant COVID-19 epidemiology tests the hypothesis that a given pollutant, often PM2.5, is statistically significantly associated with either cases or deaths having “controlled” for selected confounders. No assurance is given that such controls were adequate or that other pollutants might be important or that the presumed exposures were appropriate. More research is needed on the viral content of airborne particles as a function of size and chemistry.
An important lesson from the air quality changes during lockdowns is the insensitivity of PM2.5 and O3 to drastic reductions in central city emissions in contrast with traffic-related pollutants, in this case NOx and EC. Possible explanations include dominance of other than combustion-related species, contributions from distal sources with elevated releases such as power plants, or changes in atmospheric chemistry. These unplanned intervention experiments should be analyzed in detail.
Our regression analysis of current cumulative COVID-19 cases and deaths fills some of these gaps, especially temporal. We show that air pollution relationships pertain to deaths and not cases and that their contributions are much smaller than those of personal factors like race and education. We show that each of the three pollutants we considered were significantly associated with cumulative COVID-19 deaths as a single predictor, but that only NOx and EC remained significant in multi-variate regressions. Since only prior exposures are relevant to COVID-19 mortality, the diminution of those pollutants during lockdowns are of no consequence (but might have conferred subsequent benefits). Our analysis also showed that adverse health effects may be associated with un-regulated pollutants such as EC.
All of the long-term COVID-19 air pollution epidemiology studies, including ours, share problems of exposure misclassification with regard to time and place. If the operational hypothesis is the importance of prior exposures, a cohort analysis must consider the total accumulated respiratory burden, similar to pack-years in smoking studies, that is given by all of the exposures of each individual, indoors and out. By contrast, a time-series analysis must consider all individuals at risk to exposures that occurred within a reasonable lag period. A long-term study must sum the exposures of each individual; a short-term study must sum responses of all individuals to a given day’s exposure. Unfortunately, few studies have respected these precepts.
We found no support for the hypothesis that PM2.5 might be an important factor in the COVID-19 pandemic. Further, we showed that the relationships between air pollution COVID-19 deaths are no different from those reported for deaths from all causes and that the COVID-19 deaths are thus not “excess”. Context is important in epidemiology.
Author Contributions
F.W.L. wrote the paper; R.E.W. reviewed it. Both authors have read and agreed to the published version of the manuscript.
Funding
This research received no external funding.
Institutional Review Board Statement
Not applicable.
Informed Consent Statement
Not applicable.
Data Availability Statement
Data are from public sources.
Conflicts of Interest
The authors declare no conflict of interest.
Appendix A
- Abu-Rayash A, Dincer I. Analysis of mobility trends during the COVID-19 coronavirus pandemic: Exploring the impacts on global aviation and travel in selected cities. Energy Res Soc Sci. 2020 Oct;68:101693, doi:10.1016/j.erss.2020.101693.
- Adhikari A, Yin J. Short-Term Effects of Ambient Ozone, PM2.5 and Meteorological Factors on COVID-19 Confirmed Cases and Deaths in Queens, New York. Int J Environ Res Public Health. 2020 Jun 5;17(11):4047, doi:10.3390/ijerph17114047.
- Ali N, Islam F. The Effects of Air Pollution on COVID-19 Infection and Mortality-A Review on Recent Evidence. Front Public Health. 2020 Nov 26;8:580057, doi:10.3389/fpubh.2020.580057.
- Aljahdali MO, Alhassan AB, Albeladi MN. Impact of novel coronavirus disease (COVID-19) lockdown on ambient air quality of Saudi Arabia. Saudi J Biol Sci. 2021 Feb;28(2):1356-1364, doi:10.1016/j.sjbs.2020.11.065.
- Altuwayjiri A, Soleimanian E, Moroni S et al., The impact of stay-home policies during Coronavirus-19pandemic on the chemical and toxicological characteristics of ambient PM<sub>2.5</sub> in the metropolitan area of Milan, Italy. Sci Total Environ. 2021 Mar 1;758:143582, doi:0.1016/j.scitotenv.2020.143582.
- Arora S, Bhaukhandi KD, Mishra PK. Coronavirus lockdown helped the environment to bounce back. Sci Total Environ. 2020 Nov 10;742:140573, doi:10.1016/j.scitotenv.2020.140573.
- Azuma K, Yanagi U, Kagi N et al., Environmental factors involved in SARS-CoV-2 transmission: effect and role of indoor environmental quality in the strategy for COVID-19 infection control. Environ Health Prev Med. 2020 Nov 3;25(1):66, doi:10.1186/s12199-020-00904-2.
- Baldasano JM. COVID-19 lockdown effects on air quality by NO2 in the cities of Barcelona and Madrid (Spain). Sci Total Environ. 2020 Nov 1;741:140353, doi:10.1016/j.scitotenv.2020.140353.
- Bashir MF, Ma BJ, Bilal, Komal B et al. Correlation between environmental pollution indicators and COVID-19 pandemic: A brief study in Californian context. Environ Res. 2020 Aug;187:109652, doi:10.1016/j.envres.2020.109652.
- Bekbulat B, Apte JS, Millet DB et al. Changes in criteria air pollution levels in the US before, during, and after Covid-19 stay-at-home orders: Evidence from regulatory monitors. Sci Total Environ. 2021 May 15;769:144693, doi:10.1016/j.scitotenv.2020.144693.
- Bilal, Bashir MF, Benghoul M et al. Environmental pollution and COVID-19 outbreak: insights from Germany. Air Qual Atmos Health. 2020 Aug 3:1-10, doi:10.1007/s11869-020-00893-9.
- Borisova T, Komisarenko S. Air pollution particulate matter as a potential carrier of SARS-CoV-2 to the nervous system and/or neurological symptom enhancer: arguments in favor. Environ Sci Pollut Res Int. 2020 Oct 13:1–7, doi:10.1007/s11356-020-11183-3.
- Boroujeni M, Saberian M, Li J. Environmental impacts of COVID-19 on Victoria, Australia, witnessed two waves of Coronavirus. Environ Sci Pollut Res Int. 2021 Jan 28:1–10, doi:10.1007/s11356-021-12556-y.
- Bourdrel T, Annesi-Maesano I, Alahmad B, Maesano CN, Bind MA. The impact of outdoor air pollution on COVID-19: a review of evidence from <i>in vitro</i>, animal, and human studies. Eur Respir Rev. 2021 Feb 9;30(159):200242, doi:10.1183/16000617.0242-2020.
- Brandt EB, Mersha TB. Environmental Determinants of Coronavirus Disease 2019 (COVID-19). Curr Allergy Asthma Rep. 2021 Mar 5;21(3):15, doi:10.1007/s11882-021-00993-1.
- Cao Y, Shao L, Jones T et al., Multiple relationships between aerosol and COVID-19: A framework for global studies. Gondwana Res. 2021 May;93:243-251, doi:10.1016/j.gr.2021.02.002.
- Cascetta E, Henke I, Di Francesco L. The Effects of Air Pollution, Sea Exposure and Altitude on COVID-19 Hospitalization Rates in Italy. Int J Environ Res Public Health. 2021 Jan 8;18(2):452, doi:10.3390/ijerph18020452.
- Chauhan A, Singh RP. Decline in PM2.5 concentrations over major cities around the world associated with COVID-19. Environ Res. 2020 Aug;187:109634, doi:10.1016/j.envres.2020.109634.
- Chen B, Jia P, Han J. Role of indoor aerosols for COVID-19 viral transmission: a review. Environ Chem Lett. 2021 Jan 13:1-18, doi:10.1007/s10311-020-01174-8.
- Chen LA, Chien LC, Li Y, Lin G. Nonuniform impacts of COVID-19 lockdown on air quality over the United States. Sci Total Environ. 2020 Nov 25;745:141105, doi:10.1016/j.scitotenv.2020.141105.
- Chirizzi D, Conte M, Feltracco M et al., SARS-CoV-2 concentrations and virus-laden aerosol size distributions in outdoor air in north and south of Italy. Environ Int. 2021 Jan;146:106255, doi:10.1016/j.envint.2020.106255.
- Cole MA, Ozgen C, Strobl E. Air Pollution Exposure and Covid-19 in Dutch Municipalities. Environ Resour Econ (Dordr). 2020 Aug 4:1-30, doi:10.1007/s10640-020-00491-4.
- Collivignarelli MC, Abbà A, Bertanza G et al., Lockdown for CoViD-2019 in Milan: What are the effects on air quality? Sci Total Environ. 2020 Aug 25;732:139280, doi:10.1016/j.scitotenv.2020.139280.
- Collivignarelli MC, Abbà A, Caccamo FM et al. Can particulate matter be identified as the primary cause of the rapid spread of CoViD-19 in some areas of Northern Italy? Environ Sci Pollut Res Int. 2021 Feb 26:1–13, doi:10.1007/s11356-021-12735-x.
- Comunian S, Dongo D, Milani C, Palestini P. Air Pollution and Covid-19: The Role of Particulate Matter in the Spread and Increase of Covid-19’s Morbidity and Mortality. Int J Environ Res Public Health. 2020 Jun 22;17(12):4487, doi:10.3390/ijerph17124487.
- Connerton P, Vicente de Assunção J et al., Air Quality during COVID-19 in Four Megacities: Lessons and Challenges for Public Health. Int J Environ Res Public Health. 2020 Jul 14;17(14):5067, doi:0.3390/ijerph17145067.
- Copat C, Cristaldi A, Fiore M et al. The role of air pollution (PM and NO2) in COVID-19 spread and lethality: A systematic review. Environ Res. 2020 Dec;191:110129, doi:10.1016/j.envres.2020.110129.
- Cox LA Jr, Popken DA. Should air pollution health effects assumptions be tested? Fine particulate matter and COVID-19 mortality as an example. Glob Epidemiol. 2020 Nov;2:100033, doi:0.1016/j.gloepi.2020.100033.
- Crane-Godreau MA, Clem KJ, Payne P, Fiering S. Vitamin D Deficiency and Air Pollution Exacerbate COVID-19 Through Suppression of Antiviral Peptide LL37. Front Public Health. 2020 May 28;8:232, doi:10.3389/fpubh.2020.00232.
- Dai Q, Ding J, Song C et al., Changes in source contributions to particle number concentrations after the COVID-19 outbreak: Insights from a dispersion normalized PMF. Sci Total Environ. 2021 Mar 10;759:143548, doi:10.1016/j.scitotenv.2020.143548.
- Dai Q, Liu B, Bi X et al., Dispersion Normalized PMF Provides Insights into the Significant Changes in Source Contributions to PM2.5 after the COVID-19 Outbreak. Environ Sci Technol. 2020 Aug 18;54(16):9917-9927, doi:10.1021/acs.est.0c02776.
- Datta A, Rahman MH, Suresh R. Did the COVID-19 lockdown in Delhi and Kolkata improve the ambient air quality of the two cities? J Environ Qual. 2021 Jan 7.doi:10.1002/jeq2.20192.
- Dettori M, Deiana G, Balletto G et al., Air pollutants and risk of death due to COVID-19 in Italy. Environ Res. 2021 Jan;192:110459, doi:10.1016/j.envres.2020.110459.
- Dhaka SK, Chetna, Kumar V et al., PM2.5 Diminution and haze events over Delhi during the COVID-19 lockdown period: an interplay between the baseline pollution and meteorology. Sci Rep. 2020 Aug 10;10(1):13442, doi:10.1038/s41598-020-70179-8.
- Dharmaraj S, Ashokkumar V, Hariharan S et al., The COVID-19 pandemic face mask waste: A blooming threat to the marine environment. Chemosphere. 2021 Jan 9;272:129601, doi:10.1016/j.chemosphere.2021.129601.
- Diamond MS, Wood R. Limited Regional Aerosol and Cloud Microphysical Changes Despite Unprecedented Decline in Nitrogen Oxide Pollution During the February 2020 COVID-19 Shutdown in China. Geophys Res Lett. 2020 Sep 16;47(17):e2020GL088913, doi:10.1029/2020GL088913.
- Dobson R, Semple S. Changes in outdoor air pollution due to COVID-19 lockdowns differ by pollutant: evidence from Scotland. Occup Environ Med. 2020 Nov;77(11):798-800, doi:10.1136/oemed-2020-106659.
- Domingo JL, Rovira J. Effects of air pollutants on the transmission and severity of respiratory viral infections. Environ Res. 2020 Aug;187:109650, doi:10.1016/j.envres.2020.109650.
- Domínguez-Amarillo S, Fernández-Agüera J, Cesteros-García S, González-Lezcano RA. Bad Air Can Also Kill: Residential Indoor Air Quality and Pollutant Exposure Risk during the COVID-19 Crisis. Int J Environ Res Public Health. 2020 Sep 30;17(19):7183, doi:10.3390/ijerph17197183.
- Donzelli G, Cioni L, Cancellieri M et al., Relations between Air Quality and Covid-19 Lockdown Measures in Valencia, Spain. Int J Environ Res Public Health. 2021 Feb 26;18(5):2296, doi:10.3390/ijerph18052296.
- Dragone R, Licciardi G, Grasso G, Del Gaudio C, Chanussot J. Analysis of the Chemical and Physical Environmental Aspects that Promoted the Spread of SARS-CoV-2 in the Lombard Area. Int J Environ Res Public Health. 2021 Jan 29;18(3):1226, doi:10.3390/ijerph18031226.
- El-Sheekh MM, Hassan IA. Lockdowns and reduction of economic activities during the COVID-19 pandemic improved air quality in Alexandria, Egypt. Environ Monit Assess. 2020 Dec 15;193(1):11, doi:10.1007/s10661-020-08780-7.
- Elliott J, Bodinier B, Whitaker M et al., COVID-19 mortality in the UK Biobank cohort: revisiting and evaluating risk factors. Eur J Epidemiol. 2021 Feb 15:1–11, doi:10.1007/s10654-021-00722-y.
- Fan Z, Zhan Q, Yang C, Liu H, Zhan M. How Did Distribution Patterns of Particulate Matter Air Pollution (PM2.5 and PM10) Change in China during the COVID-19 Outbreak: A Spatiotemporal Investigation at Chinese City-Level. Int J Environ Res Public Health. 2020 Aug 28;17(17):6274, doi:10.3390/ijerph17176274.
- Fiasca F, Minelli M, Maio D et al., Associations between COVID-19 Incidence Rates and the Exposure to PM2.5 and NO2: A Nationwide Observational Study in Italy. Int J Environ Res Public Health. 2020 Dec 13;17(24):9318, doi:10.3390/ijerph17249318.
- Gama C, Relvas H, Lopes M, Monteiro A. The impact of COVID-19 on air qualityls in Portugal: A way to assess traffic contribution. Environ Res. 2021 Feb;193:110515, doi:10.1016/j.envres.2020.110515.
- Gautam S. The Influence of COVID-19 on Air Quality in India: A Boon or Inutile. Bull Environ Contam Toxicol. 2020 Jun;104(6):724-726, doi:10.1007/s00128-020-02877-y.
- Gayen A, Haque SM, Mishra SV. COVID-19 induced lockdown and decreasing particulate matter (PM10): An empirical investigation of an Asian megacity. Urban Clim. 2021 Mar;36:100786, doi:10.1016/j.uclim.2021.100786.
- Girdhar A, Kapur H, Kumar V, Kaur M, Singh D, Damasevicius R. Effect of COVID-19 outbreak on urban health and environment. Air Qual Atmos Health. 2020 Oct 10:1-9, doi:10.1007/s11869-020-00944-1.
- Gualtieri G, Brilli L, Carotenuto F, Vagnoli C, Zaldei A, Gioli B. Quantifying road traffic impact on air quality in urban areas: A Covid19-induced lockdown analysis in Italy. Environ Pollut. 2020 Dec;267:115682, doi:10.1016/j.envpol.2020.115682.
- Hendryx M, Luo J. COVID-19 prevalence and fatality rates in association with air pollution emission concentrations and emission sources. Environ Pollut. 2020 Oct;265(Pt A):115126, doi:10.1016/j.envpol.2020.115126.
- Hudda N, Simon MC, Patton AP, Durant JL. Reductions in traffic-related black carbon and ultrafine particle number concentrations in an urban neighborhood during the COVID-19 pandemic. Sci Total Environ. 2020 Nov 10;742:140931, doi:10.1016/j.scitotenv.2020.140931.
- Jephcote C, Hansell AL, Adams K, Gulliver J. Changes in air quality during COVID-19 ’lockdown’ in the United Kingdom. Environ Pollut. 2021 Mar 1;272:116011, doi:10.1016/j.envpol.2020.116011.
- Ju MJ, Oh J, Choi YH. Changes in air pollution levels after COVID-19 outbreak in Korea. Sci Total Environ. 2021 Jan 1;750:141521, doi:10.1016/j.scitotenv.2020.141521.
- Han BS, Park K, Kwak KH et al. Air Quality Change in Seoul, South Korea under COVID-19 Social Distancing: Focusing on PM2.5. Int J Environ Res Public Health. 2020 Aug 27;17(17):6208, doi:10.3390/ijerph17176208.
- Hashim BM, Al-Naseri SK, Al-Maliki A, Al-Ansari N. Impact of COVID-19 lockdown on NO<sub>2</sub>, O3, PM2.5 and PM10 concentrations and assessing air quality changes in Baghdad, Iraq. Sci Total Environ. 2021 Feb 1;754:141978, doi:10.1016/j.scitotenv.2020.141978.
- He C, Hong S, Zhang L,et al. Global, continental, and national variation in PM2.5, O3, and NO2 concentrations during the early 2020 COVID-19 lockdown. Atmos Pollut Res. 2021 Mar;12(3):136-145, doi:10.1016/j.apr.2021.02.002.
- Hoang T, Nguyen TQ, Tran TTA. Short-term exposure to ambient air pollution in association with COVID-19 of two clusters in South Korea. Trop Med Int Health. 2020 Dec 15, doi:10.1111/tmi.13538.
- Hou CK, Qin YF, Wang G et al., Impact of a long-term air pollution exposure on the case fatality rate of COVID-19 patients-A multicity study. J Med Virol. 2021 Jan 20, doi:10.1002/jmv.26807.
- Hutter HP, Poteser M, Moshammer H et al., Air Pollution Is Associated with COVID-19 Incidence and Mortality in Vienna, Austria. Int J Environ Res Public Health. 2020 Dec 11;17(24):9275, doi:10.3390/ijerph17249275.
- Ikhlasse H, Benjamin D, Vincent C, Hicham M. Environmental impacts of pre/during and post-lockdown periods on prominent air pollutants in France. Environ Dev Sustain. 2021 Jan 23:1-22, doi:10.1007/s10668-021-01241-2.
- Jiang Y, Wu XJ, Guan YJ. Effect of ambient air pollutants and meteorological variables on COVID-19 incidence. Infect Control Hosp Epidemiol. 2020 Sep;41(9):1011-1015, doi:10.1017/ice.2020.222.
- Jiaxin C, Hui H, Feifei W,e al. Air quality characteristics in Wuhan (China) during the 2020 COVID-19 pandemic. Environ Res. 2021 Feb 16:110879, doi:10.1016/j.envres.2021.110879.
- Ju MJ, Oh J, Choi YH. Changes in air pollution levels after COVID-19 outbreak in Korea. Sci Total Environ. 2021 Jan 1;750:141521, doi:10.1016/j.scitotenv.2020.141521.
- Kerimray A, Baimatova N, Ibragimova OP et al., Changes in air quality related to the control of coronavirus in China: Implications for traffic and industrial emissions. Sci Total Environ. 2020 Aug 20;731:139133, doi:10.1016/j.scitotenv.2020.139133.
- Kerimray A, Baimatova N, Ibragimova OP et al. Assessing air quality changes in large cities during COVID-19 lockdowns: The impacts of traffic-free urban conditions in Almaty, Kazakhstan. Sci Total Environ. 2020 Aug 15;730:139179, doi:10.1016/j.scitotenv.2020.139179.
- Khan I, Shah D, Shah SS. COVID-19 pandemic and its positive impacts on environment: an updated review. Int J Environ Sci Technol (Tehran). 2020 Nov 16:1-10, doi:10.1007/s13762-020-03021-3.
- Kolluru SSR, Patra AK, Nazneen, Shiva Nagendra SM. Association of air pollution and meteorological variables with COVID-19 incidence: Evidence from five megacities in India. Environ Res. 2021 Feb 6;195:110854, doi:10.1016/j.envres.2021.110854.
- Konstantinoudis G, Padellini T, Bennett et al. Long-term exposure to air-pollution and COVID-19 mortality in England: a hierarchical spatial analysis. medRxiv [Preprint]. 2020 Aug 11:2020.08.10.20171421, doi:10.1101/2020.08.10.20171421. Update in: Environ Int. 2021 Jan;146:106316.
- Kumar H, Arora R, Kumar Arora P et al. Effect of nation-wide lock-down due to Covid-19 over industrial pollution in Delhi, India. Mater Today Proc. 2021 Jan 26, doi:10.1016/j.matpr.2021.01.264.
- Kumar P, Hama S, Omidvarborna H et al., Temporary reduction in fine particulate matter due to anthropogenic emissions switch-off’ during COVID-19 lockdown in Indian cities. Sustain Cities Soc. 2020 Nov;62:102382, doi:10.1016/j.scs.2020.102382.
- Kumar S, Sonkar SK, Atam I et al., Socio-economic impact of first 21 days nationwide lockdown- 1 on the spread of SARS-COV-2 in India in relation to health. J Family Med Prim Care. 2020 Sep 30;9(9):4557-4562, doi:10.4103/jfmpc.jfmpc_662_20.
- Kumari P, Toshniwal D. Impact of lockdown on air quality over major cities across the globe during COVID-19 pandemic. Urban Clim. 2020 Dec;34:100719, doi:10.1016/j.uclim.2020.100719.
- Kutralam-Muniasamy G, Pérez-Guevara F, Roy PD, Elizalde-Martínez I, Shruti VC. Impacts of the COVID-19 lockdown on air quality and its association with human mortality trends in megapolis Mexico City. Air Qual Atmos Health. 2020 Oct 28:1-10, doi:10.1007/s11869-020-00960-1.
- Landoni G, Lembo R, Cianfanelli L, Frontera A. Air pollutants and SARS-CoV-2 in 33 European countries. Acta Biomed. 2021 Feb 16;92(1):e2021166, doi:10.23750/abm.v92i1.11155.
- Latif MT, Dominick D, Hawari NSSL, Mohtar AAA, Othman M. The concentration of major air pollutants during the movement control order due to the COVID-19 pandemic in the Klang Valley, Malaysia. Sustain Cities Soc. 2021 Mar;66:102660, doi:10.1016/j.scs.2020.102660
- Le T, Wang Y, Liu L et al., Unexpected air pollution with marked emission reductions during the COVID-19 outbreak in China. Science. 2020 Aug 7;369(6504):702-706, doi:10.1126/science.abb7431.
- Li J, Wang Z, Yuan B, Liang H, Liang W. The Episode of National Lockdown in the Pandemic: Air Traffic Restriction as the Control Strategy and Its Impact on Existing Cases and Recovery Rate of Novel Coronavirus Disease in Megacities of China. Disaster Med Public Health Prep. 2020 Oct;14(5):e19-e23, doi:10.1017/dmp.2020.294.
- Li H, Xu XL, Dai DW et al. Air pollution and temperature are associated with increased COVID-19 incidence: A time series study. Int J Infect Dis. 2020 Aug;97:278-282, doi:10.1016/j.ijid.2020.05.076.
- Lian X, Huang J, Huang R et al., Impact of city lockdown on the air quality of COVID-19-hit of Wuhan city. Sci Total Environ. 2020 Nov 10;742:140556, doi:10.1016/j.scitotenv.2020.140556.
- Liang D, Shi L, Zhao J et al., Urban Air Pollution May Enhance COVID-19 Case-Fatality and Mortality Rates in the United States. Innovation (N Y). 2020 Nov 25;1(3):100047, doi:10.1016/j.xinn.2020.100047.
- Liang D, Shi L, Zhao J et al., Urban Air Pollution May Enhance COVID-19 Case-Fatality and Mortality Rates in the United States. medRxiv [Preprint]. 2020 May 7:2020.05.04.20090746, doi:0.1101/2020.05.04.20090746. Update in: Innovation (N Y). 2020 Sep 21;:100047.
- Liu F, Wang M, Zheng M. Effects of COVID-19 lockdown on global air quality and health. Sci Total Environ. 2021 Feb 10;755(Pt 1):142533, doi:10.1016/j.scitotenv.2020.142533.
- Lv Z, Wang X, Deng F, Ying Q et al., Source-Receptor Relationship Revealed by the Halted Traffic and Aggravated Haze in Beijing during the COVID-19 Lockdown. Environ Sci Technol. 2020 Dec 15;54(24):15660-15670, doi:10.1021/acs.est.0c04941.
- López-Feldman A, Heres D, Marquez-Padilla F. Air pollution exposure and COVID-19: A look at mortality in Mexico City using individual-level data. Sci Total Environ. 2021 Feb 20;756:143929, doi:10.1016/j.scitotenv.2020.143929.
- Magazzino C, Mele M, Sarkodie SA. The nexus between COVID-19 deaths, air pollution and economic growth in New York state: Evidence from Deep Machine Learning. J Environ Manage. 2021 Mar 2;286:112241, doi:10.1016/j.jenvman.2021.112241.
- Magazzino C, Mele M, Schneider N. The relationship between air pollution and COVID-19-related deaths: An application to three French cities. Appl Energy. 2020 Dec 1;279:115835, doi:10.1016/j.apenergy.2020.115835.
- Manoj MG, Satheesh Kumar MK et al., Potential link between compromised air quality and transmission of the novel corona virus (SARS-CoV-2) in affected areas. Environ Res. 2020 Nov;190:110001, doi:10.1016/j.envres.2020.110001.
- Markandeya, Verma PK, Mishra V et al. Spatio-temporal assessment of ambient air quality, their health effects and improvement during COVID-19 lockdown in one of the most polluted cities of India. Environ Sci Pollut Res Int. 2021 Mar;28(9):10536-10551, doi:10.1007/s11356-020-11248-3.
- Manigrasso M, Protano C, Guerriero E, Vitali M. May SARS-CoV-2 diffusion be favored by alkaline aerosols and ammonia emissions? Atmosphere 2020, 11(9), 995; doi:10.3390/atmos11090995.
- Megahed NA, Ghoneim EM. Indoor Air Quality: Rethinking rules of building design strategies in post-pandemic architecture. Environ Res. 2021 Feb;193:110471, doi:10.1016/j.envres.2020.110471.
- Mele M, Magazzino C, Schneider N, Strezov V. NO2 levels as a contributing factor to COVID-19 deaths: The first empirical estimate of threshold values. Environ Res. 2021 Mar;194:110663, doi:10.1016/j.envres.2020.110663.
- Mendez-Espinosa JF, Rojas NY, Vargas J, Pachón JE, Belalcazar LC, Ramírez O. Air quality variations in Northern South America during the COVID-19 lockdown. Sci Total Environ. 2020 Dec 20;749:141621, doi:10.1016/j.scitotenv.2020.141621.
- Mendy A, Wu X, Keller JL et al. Long-term exposure to fine particulate matter and hospitalization in COVID-19 patients. Respir Med. 2021 Mar;178:106313, doi:10.1016/j.rmed.2021.106313.
- Meng J, Li Z, Zhou R, Chen M et al., Enhanced photochemical formation of secondary organic aerosols during the COVID-19 lockdown in Northern China. Sci Total Environ. 2021 Mar 1;758:143709, doi:10.1016/j.scitotenv.2020.143709.
- Menut L, Bessagnet B, Siour G, e al. Impact of lockdown measures to combat Covid-19 on air quality over western Europe. Sci Total Environ. 2020 Nov 1;741:140426, doi:10.1016/j.scitotenv.2020.140426.
- Meo SA, Abukhalaf AA, Alomar AA et al. Effect of environmental pollutants PM2.5, carbon monoxide, and ozone on the incidence and mortality of SARS-COV-2 infection in ten wildfire affected counties in California. Sci Total Environ. 2021 Feb 25;757:143948, doi:10.1016/j.scitotenv.2020.143948.
- Meo SA, Abukhalaf AA, Alomar AA, Alessa OM. Wildfire and COVID-19 pandemic: effect of environmental pollution PM-2.5 and carbon monoxide on the dynamics of daily cases and deaths due to SARS-COV-2 infection in San-Francisco USA. Eur Rev Med Pharmacol Sci. 2020 Oct;24(19):10286-10292, doi:10.26355/eurrev_202010_23253.
- Miyazaki K, Bowman K, Sekiya T et al. Air Quality Response in China Linked to the 2019 Novel Coronavirus (COVID-19) Lockdown. Geophys Res Lett. 2020 Oct 16;47(19):e2020GL089252, doi:10.1029/2020GL089252.
- Mousazadeh M, Paital B, Naghdali Z et al., Positive environmental effects of the coronavirus 2020 episode: a review. Environ Dev Sustain. 2021 Feb 4:1-23, doi:10.1007/s10668-021-01240-3.
- Naethe P, Delaney M, Julitta T. Changes of NOx in urban air detected with monitoring VIS-NIR field spectrometer during the coronavirus pandemic: A case study in Germany. Sci Total Environ. 2020 Dec 15;748:141286, doi:10.1016/j.scitotenv.2020.141286.
- Nakada LYK, Urban RC. COVID-19 pandemic: Impacts on the air quality during the partial lockdown in São Paulo state, Brazil. Sci Total Environ. 2020 Aug 15;730:139087, doi:0.1016/j.scitotenv.2020.139087.
- Naqvi HR, Mutreja G, Shakeel A, Siddiqui MA. Spatio-temporal analysis of air quality and its relationship with major COVID-19 hotspot places in India. Remote Sens Appl. 2021 Apr;22:100473, doi:10.1016/j.rsase.2021.100473.
- Naqvi HR, Datta M, Mutreja G et al., Improved air quality and associated mortalities in India under COVID-19 lockdown. Environ Pollut. 2021 Jan 1;268(Pt A):115691, doi:10.1016/j.envpol.2020.115691.
- Neelon B, Mutiso F, Mueller NT, Pearce JL, Benjamin-Neelon SE. Spatial and temporal trends in social vulnerability and COVID-19 incidence and death rates in the United States. medRxiv [Preprint]. 2020 Sep 11:2020.09.09.20191643, doi:10.1101/2020.09.09.20191643.
- Nigam R, Pandya K, Luis AJ et al., Positive effects of COVID-19 lockdown on air quality of industrial cities (Ankleshwar and Vapi) of Western India. Sci Rep. 2021 Feb 19;11(1):4285, doi:10.1038/s41598-021-83393-9.
- Pant G, Alka, Garlapati D, Gaur A et al. Air quality assessment among populous sites of major metropolitan cities in India during COVID-19 pandemic confinement. Environ Sci Pollut Res Int. 2020 Dec;27(35):44629-44636, doi:10.1007/s11356-020-11061-y.
- Pata UK. How is COVID-19 affecting environmental pollution in US cities? Evidence from asymmetric Fourier causality test. Air Qual Atmos Health. 2020 Jul 15:1-7, doi:10.1007/s11869-020-00877-9.
- Patel H, Talbot N, Salmond J et al., Implications for air quality management of changes in air quality during lockdown in Auckland (New Zealand) in response to the 2020 SARS-CoV-2 epidemic. Sci Total Environ. 2020 Dec 1;746:141129, doi:10.1016/j.scitotenv.2020.141129.
- Pei L, Wang X, Guo B et al., Do air pollutants as well as meteorological factors impact Corona Virus Disease 2019 (COVID-19)? Evidence from China based on the geographical perspective. Environ Sci Pollut Res Int. 2021 Mar 5:1–13, doi:10.1007/s11356-021-12934-6.
- Pradillo BL, Rancan L, Ramiro ED,et al. Determination of SARS-CoV-2 RNA in different particulate matter size fractions of outdoor air samples in Madrid during the lockdown. Environ Res. 2021 Feb 17;195:110863, doi:10.1016/j.envres.2021.110863.
- Pata UK. How is COVID-19 affecting environmental pollution in US cities? Evidence from asymmetric Fourier causality test. Air Qual Atmos Health. 2020 Jul 15:1-7, doi:10.1007/s11869-020-00877-9.
- Pei L, Wang X, Guo B et al., Do air pollutants as well as meteorological factors impact Corona Virus Disease 2019 (COVID-19)? Evidence from China based on the geographical perspective. Environ Sci Pollut Res Int. 2021 Mar 5:1–13, doi:10.1007/s11356-021-12934-6.
- Pradillo BL, Rancan L, Ramiro ED,et al. Determination of SARS-CoV-2 RNA in different particulate matter size fractions of outdoor air samples in Madrid during the lockdown. Environ Res. 2021 Feb 17;195:110863, doi:10.1016/j.envres.2021.110863.
- Rojas JP, Urdanivia FR, Garay RA et al., Effects of COVID-19 pandemic control measures on air pollution in Lima metropolitan area, Peru in South America. Air Qual Atmos Health. 2021 Feb 4:1-9, doi:10.1007/s11869-021-00990-3.
- Ropkins K, Tate JE. Early observations on the impact of the COVID-19 lockdown on air quality trends across the UK. Sci Total Environ. 2021 Feb 1;754:142374, doi:10.1016/j.scitotenv.2020.142374.
- Roy S, Singha N. Reduction in concentration of PM<sub>2.5</sub> in India’s top most polluted cities: with special reference to post-lockdown period. Air Qual Atmos Health. 2021 Jan 8:1-9, doi:10.1007/s11869-020-00974-9.
- Rupani PF, Nilashi M, Abumalloh RA et al., Coronavirus pandemic (COVID-19) and its natural environmental impacts. Int J Environ Sci Technol (Tehran). 2020 Sep 1:1-12, doi:10.1007/s13762-020-02910-x.
- Saadat S, Rawtani D, Hussain CM. Environmental perspective of COVID-19. Sci Total Environ. 2020 Aug 1;728:138870, doi:10.1016/j.scitotenv.2020.138870.
- Saez M, Tobias A, Barceló MA. Effects of long-term exposure to air pollutants on the spatial spread of COVID-19 in Catalonia, Spain. Environ Res. 2020 Dec;191:110177, doi:10.1016/j.envres.2020.110177.
- Sahoo Mangla S, Pathak AK, Salãmao GN, Sarkar D. Pre-to-post lockdown impact on air quality and the role of environmental factors in spreading the COVID-19 cases - a study from a worst-hit state of India. Int J Biometeorol. 2021 Feb;65(2):205-222, doi:10.1007/s00484-020-02019-3.
- SanJuan-Reyes S, Gómez-Oliván LM, Islas-Flores H. COVID-19 in the environment. Chemosphere. 2021 Jan;263:127973, doi:10.1016/j.chemosphere.2020.127973.
- Sannigrahi S, Kumar P, Molter A et al. Examining the status of improved air quality in world cities due to COVID-19 led temporary reduction in anthropogenic emissions. Environ Res. 2021 Mar 3:110927, doi:10.1016/j.envres.2021.110927.
- Sbai SE, Mejjad N, Norelyaqine A, Bentayeb F. Air quality change during the COVID-19 pandemic lockdown over the Auvergne-Rhône-Alpes region, France. Air Qual Atmos Health. 2021 Jan 19:1-12, doi:10.1007/s11869-020-00965-w.
- Senatore V, Zarra T, Buonerba A et al., Indoor versus outdoor transmission of SARS-COV-2: environmental factors in virus spread and underestimated sources of risk. EuroMediterr J Environ Integr. 2021;6(1):30, doi:10.1007/s41207-021-00243-w.
- Shakoor A, Chen X, Farooq TH et al. Fluctuations in environmental pollutants and air quality during the lockdown in the USA and China: two sides of COVID-19 pandemic. Air Qual Atmos Health. 2020 Aug 9:1-8, doi:10.1007/s11869-020-00888-6.
- Shakil MH, Munim ZH, Tasnia M, Sarowar S. COVID-19 and the environment: A critical review and research agenda. Sci Total Environ. 2020 Nov 25;745:141022, doi:10.1016/j.scitotenv.2020.141022.
- Skalny AV, Lima TRR, Ke T et al. Toxic metal exposure as a possible risk factor for COVID-19 and other respiratory infectious diseases. Food Chem Toxicol. 2020 Dec;146:111809, doi:10.1016/j.fct.2020.111809. Erratum in: Food Chem Toxicol. 2021 Mar;149:111999.
- Sharma AK, Balyan P. Air pollution and COVID-19: Is the connect worth its weight? Indian J Public Health. 2020 Jun;64(Supplement):S132-S134, doi:10.4103/ijph.IJPH_466_20.
- Singh V, Singh S, Biswal A, Diurnal and temporal changes in air pollution during COVID-19 strict lockdown over different regions of India. Environ Pollut. 2020 Nov;266(Pt 3):115368, doi:10.1016/j.envpol.2020.115368.
- Son JY, Fong KC, Heo S, et l. Reductions in mortality resulting from reduced air pollution levels due to COVID-19 mitigation measures. Sci Total Environ. 2020 Nov 20;744:141012, doi:0.1016/j.scitotenv.2020.141012.
- Suwanwongse K, Shabarek N. Epidemiology, clinical features, and outcomes of hospitalized infants with COVID-19 in the Bronx, New York. Arch Pediatr. 2020 Oct;27(7):400-401, doi:10.1016/j.arcped.2020.07.009.
- Tanwar V, Adelstein JM, Wold LE. Double trouble: combined cardiovasculareffects of particulate matter exposure and coronavirus disease 2019. Cardiovasc Res. 2021 Jan 1;117(1):85-95, doi:10.1093/cvr/cvaa293.
- Toro A R, Catalán F, Urdanivia FR et al. Air pollution and COVID-19 lockdown in a large South American city: Santiago Metropolitan Area, Chile. Urban Clim. 2021 Mar;36:100803, doi:10.1016/j.uclim.2021.100803.
- Versaci F, Gaspardone A, Danesi A,et al. Interplay between COVID-19, pollution, and weather features on changes in the incidence of acute coronary syndromes in early 2020. Int J Cardiol. 2021 Apr 15;329:251-259, doi:10.1016/j.ijcard.2020.12.059.
- Villeneuve PJ, Goldberg MS. Methodological Considerations for Epidemiological Studies of Air Pollution and the SARS and COVID-19 Coronavirus Outbreaks. Environ Health Perspect. 2020 Sep;128(9):95001, doi:10.1289/EHP7411.
- Vultaggio M, Varrica D, Alaimo MG. Impact on Air Quality of the COVID-19 Lockdown in the Urban Area of Palermo (Italy). Int J Environ Res Public Health. 2020 Oct 9;17(20):7375, doi:10.3390/ijerph17207375.
- Wang H, Miao Q, Shen L et al. Characterization of the aerosol chemical composition during the COVID-19 lockdown period in Suzhou in the Yangtze River Delta, China. J Environ Sci (China). 2021 Apr;102:110-122, doi:10.1016/j.jes.2020.09.019.
- Wang B, Chen H, Chan YL, Oliver BG. Is there an association between the level of ambient air pollution and COVID-19? Am J Physiol Lung Cell Mol Physiol. 2020 Sep 1;319(3):L416-L421, doi:10.1152/ajplung.00244.2020. Epub 2020 Jul 22.
- Woodby B, Arnold MM, Valacchi G. SARS-CoV-2 infection, COVID-19 pathogenesis, and exposure to air pollution: What is the connection? Ann N Y Acad Sci. 2021 Feb;1486(1):15-38, doi:.1111/nyas.14512.
- Wu CL, Wang HW, Cai WJ et al., Impact of the COVID-19 lockdown on roadside traffic-related air pollution in Shanghai, China. Build Environ. 2021 May;194:107718, doi:10.1016/j.buildenv.2021.107718.
- Yao Y, Pan J, Wang W et al. Association of particulate matter pollution and case fatality rate of COVID-19 in 49 Chinese cities. Sci Total Environ. 2020 Nov 1;741:140396, doi:10.1016/j.scitotenv.2020.140396.
- Zhang X, Tang M, Guo F et al., Associations between air pollution and COVID-19 epidemic during quarantine period in China. Environ Pollut. 2021 Jan 1;268(Pt A):115897, doi:0.1016/j.envpol.2020.115897.
- Zheng P, Chen Z, Liu Y et al., Association between coronavirus disease 2019 (COVID-19) and long-term exposure to air pollution: Evidence from the first epidemic wave in China. Environ Pollut. 2021 Feb 8;276:116682, doi:10.1016/j.envpol.2021.116682.
- Zhu J, Chen L, Liao H et al., Enhanced PM2.5 Decreases and O3 Increases in China During COVID-19 Lockdown by Aerosol-Radiation Feedback. Geophys Res Lett. 2021 Jan 28;48(2):e2020GL090260.doi:10.1029/2020GL090260.
- Zhu Y, Xie J, Huang F, Cao L. Association between short-term exposure to air pollution and COVID-19 infection: Evidence from China. Sci Total Environ. 2020 Jul 20;727:138704, doi:10.1016/j.scitotenv.2020.138704.
- Zoran MA, Savastru RS, Savastru DM, Tautan MN. Assessing the relationship between surface levels of PM2.5 and PM10 particulate matter impact on COVID-19 in Milan, Italy. Sci Total Environ. 2020 Oct 10;738:139825, doi:10.1016/j.scitotenv.2020.139825.
References
- DiRenna, J. COVID-19: A Different Kind of Warfare. Mo Med. 2020, 117, 170. [Google Scholar]
- Murray, C.J.; Lipfert, F.W. Inferring frail life expectancies in Chicago from daily fluctuations in elderly mortality. Inhal. Toxicol. 2013, 25, 461–479. [Google Scholar] [CrossRef]
- Adhikari, A.; Yin, J. Short-Term Effects of Ambient Ozone, PM2.5 and Meteorological Factors on COVID-19 Confirmed Cases and Deaths in Queens, New York. Int. J. Environ. Res. Public Health 2020, 17, 4047. [Google Scholar] [CrossRef]
- Hoang, T.; Nguyen, T.Q.; Tran, T.T.A. Short-term exposure to ambient air pollution in association with COVID-19 of two clusters in South Korea. Trop. Med. Int. Health 2020, 15. [Google Scholar] [CrossRef]
- Jiang, Y.; Wu, X.J.; Guan, Y.J. Effect of ambient air pollutants and meteorological variables on COVID-19 incidence. Infect. Control Hosp. Epidemiol. 2020, 41, 1011–1015. [Google Scholar] [CrossRef] [PubMed]
- Li, H.; Xu, X.L.; Dai, D.W.; Huang, Z.Y.; Ma, Z.; Guan, Y.J. Air pollution and temperature are associated with increased COVID-19 incidence: A time series study. Int. J. Infect. Dis. 2020, 97, 278–282. [Google Scholar] [CrossRef]
- Zhu, Y.; Xie, J.; Huang, F.; Cao, L. Association between short-term exposure to air pollution and COVID-19 infection: Evidence from China. Sci. Total Environ. 2020, 727, 138704. [Google Scholar] [CrossRef] [PubMed]
- Bashir, M.F.; Ma, B.J.; Bilal Komal, B.; Bashir, M.A.; Farooq, T.H.; Iqbal, N.; Bashir, M. Correlation between environmental pollution indicators and COVID-19 pandemic: Abrief study in Californian context. Environ. Res. 2020, 187, 109652. [Google Scholar] [CrossRef] [PubMed]
- De Angelis, E.; Renzetti, S.; Volta, M.; Donato, F.; Calza, S.; Placidi, D.; Lucchini, R.G.; Rota, M. COVID-19 incidence and mortality in Lombardy, Italy: An ecological study on the role of air pollution, meteorological factors, demographic and socioeconomic variables. Environ. Res. 2021, 195, 110777. [Google Scholar] [CrossRef]
- Elliott, J.; Bodinier, B.; Whitaker, M.; Delpierre, C.; Vermeulen, R.; Tzoulaki, I.; Elliott, P.; Chadeau-Hyam, M. COVID-19 mortality in the UK Biobank cohort:revisiting and evaluating risk factors. Eur. J. Epidemiol. 2021, 36, 299–309. [Google Scholar] [CrossRef] [PubMed]
- Liang, D.; Shi, L.; Zhao, J.; Liu, P.; Sarnat, J.A.; Gao, S.; Schwartz, J.; Liu, Y.; Ebelt, S.T.; Scovronick, N.; et al. Urban Air Pollution May Enhance COVID-19 Case-Fatality and Mortality Rates in the United States. Innovation 2020, 1, 100047. [Google Scholar] [CrossRef] [PubMed]
- Magazzino, C.; Mele, M.; Sarkodie, S.A. The nexus between COVID-19 deaths, air pollution and economic growth in New York state: Evidence from Deep Machine Learning. J. Environ. Manag. 2021, 286, 112241. [Google Scholar] [CrossRef] [PubMed]
- Magazzino, C.; Mele, M.; Schneider, N. The relationship between air pollution and COVID-19-related deaths: An application to three French cities. Appl. Energy 2020, 279, 115835. [Google Scholar] [CrossRef] [PubMed]
- Mendy, A.; Wu, X.; Keller, J.L.; Fassler, C.S.; Apewokin, S.; Mersha, T.B.; Xie, C.; Pinney, S.M. Long-term exposure to fine particulate matter and hospitalization in COVID-19 patients. Respir. Med. 2021, 178, 106313. [Google Scholar] [CrossRef] [PubMed]
- Neelon, B.; Mutiso, F.; Mueller, N.T.; Pearce, J.L.; Benjamin-Neelon, S.E. Spatial and temporal trends in social vulnerability and COVID-19 incidence and death rates in the United States. medRxiv 2020. [Google Scholar] [CrossRef]
- Wu, X.; Nethery, R.C.; Sabath, B.M.; Braun, D.; Dominici, F. Exposure to air pollution and COVID-19 mortality in the United States: A nationwide cross-sectional study. medRxiv 2020. [Google Scholar] [CrossRef] [Green Version]
- Bekbulat, B.; Apte, J.S.; Millet, D.B.; Robinson, A.L.; Wells, K.C.; Presto, A.A.; Marshall, J.D. Changes in criteria air pollution levels in the US before, during, and after Covid-19 stay-at-home orders: Evidence from regulatory monitors. Sci. Total Environ. 2021, 769, 144693. [Google Scholar] [CrossRef]
- Chauhan, A.; Singh, R.P. Decline in PM2.5 concentrations over major cities around the world associated with COVID-19. Environ. Res. 2020, 187, 109634. [Google Scholar] [CrossRef]
- Hudda, N.; Simon, M.C.; Patton, A.P.; Durant, J.L. Reductions in traffic-related black carbon and ultrafine particle number concentrations in an urban neighborhood during the COVID-19 pandemic. Sci. Total Environ. 2020, 742, 140931. [Google Scholar] [CrossRef]
- Chen, L.A.; Chien, L.C.; Li, Y.; Lin, G. Nonuniform impacts of COVID-19 lockdown on air quality over the United States. Sci. Total Environ. 2020, 745, 141105. [Google Scholar] [CrossRef]
- Jephcote, C.; Hansell, A.L.; Adams, K.; Gulliver, J. Changes in air quality during COVID-19 ’lockdown’ in the United Kingdom. Environ. Pollut. 2021, 272, 116011. [Google Scholar] [CrossRef]
- Xiang, J.; Austin, E.; Gould, T.; Larson, T.; Shirai, J.; Liu, Y.; Marshall, J.; Seto, E. Impacts of the COVID-19 responses on traffic-related air pollution in a Northwestern US city. Sci. Total Environ. 2020, 747, 141325. [Google Scholar] [CrossRef]
- Lipfert, F.W. An assessment of air pollution exposure information for health studies. Atmosphere 2015, 6, 1736–1752. [Google Scholar] [CrossRef] [Green Version]
- Domínguez-Amarillo, S.; Fernández-Agüera, J.; Cesteros-García, S.; González-Lezcano, R.A. Bad Air Can Also Kill: Residential Indoor Air Quality and Pollutant Exposure Risk during the COVID-19 Crisis. Int. J. Environ. Res. Public Health 2020, 17, 7183. [Google Scholar] [CrossRef]
- Chirizzi, D.; Conte, M.; Feltracco, M.; Dinoi, A.; Gregoris, E.; Barbaro, E.; La Bella, G.; Ciccarese, G.; La Salandra, G.; Gambaro, A.; et al. SARS-CoV-2 concentrations and virus-laden aerosol size distributions in outdoor air in north and south of Italy. Environ. Int. 2021, 146, 106255. [Google Scholar] [CrossRef]
- Faridi, S.; Niazi, S.; Sadeghi, K. A field indoor air measurement of SARS-CoV-2 in the patient rooms of the largest hospital in Iran. Sci. Total Environ. 2020, 725, 138401. [Google Scholar] [CrossRef] [PubMed]
- Lipfert, F.W.; Wyzga, R.E.; Baty, J.D.; Miller, J.P. Air pollution and survival within the Washington University-EPRI Veterans Cohort: Risks based on modeled estimates of ambient levels of hazardous and criteria air pollutants. J. Air Waste Manag. Assoc. 2009, 59, 473–489. [Google Scholar] [CrossRef] [PubMed]
- Lipfert, F.W.; Baty, J.D.; Miller, J.P.; Wyzga, R.E. PM2.5 constituents and related air quality variables as predictors of survival in a cohort of U.S. military veterans. Inhal. Toxicol. 2006, 18, 645–657. [Google Scholar] [CrossRef] [PubMed]
Figure 1.
Change in ambient PM2.5 by change in NO2 during lockdown in 28 US cities based on data from Chen et al. (2020). Plotting symbols represent state abbreviations.
Figure 1.
Change in ambient PM2.5 by change in NO2 during lockdown in 28 US cities based on data from Chen et al. (2020). Plotting symbols represent state abbreviations.

Figure 2.
Relationships with household crowding.
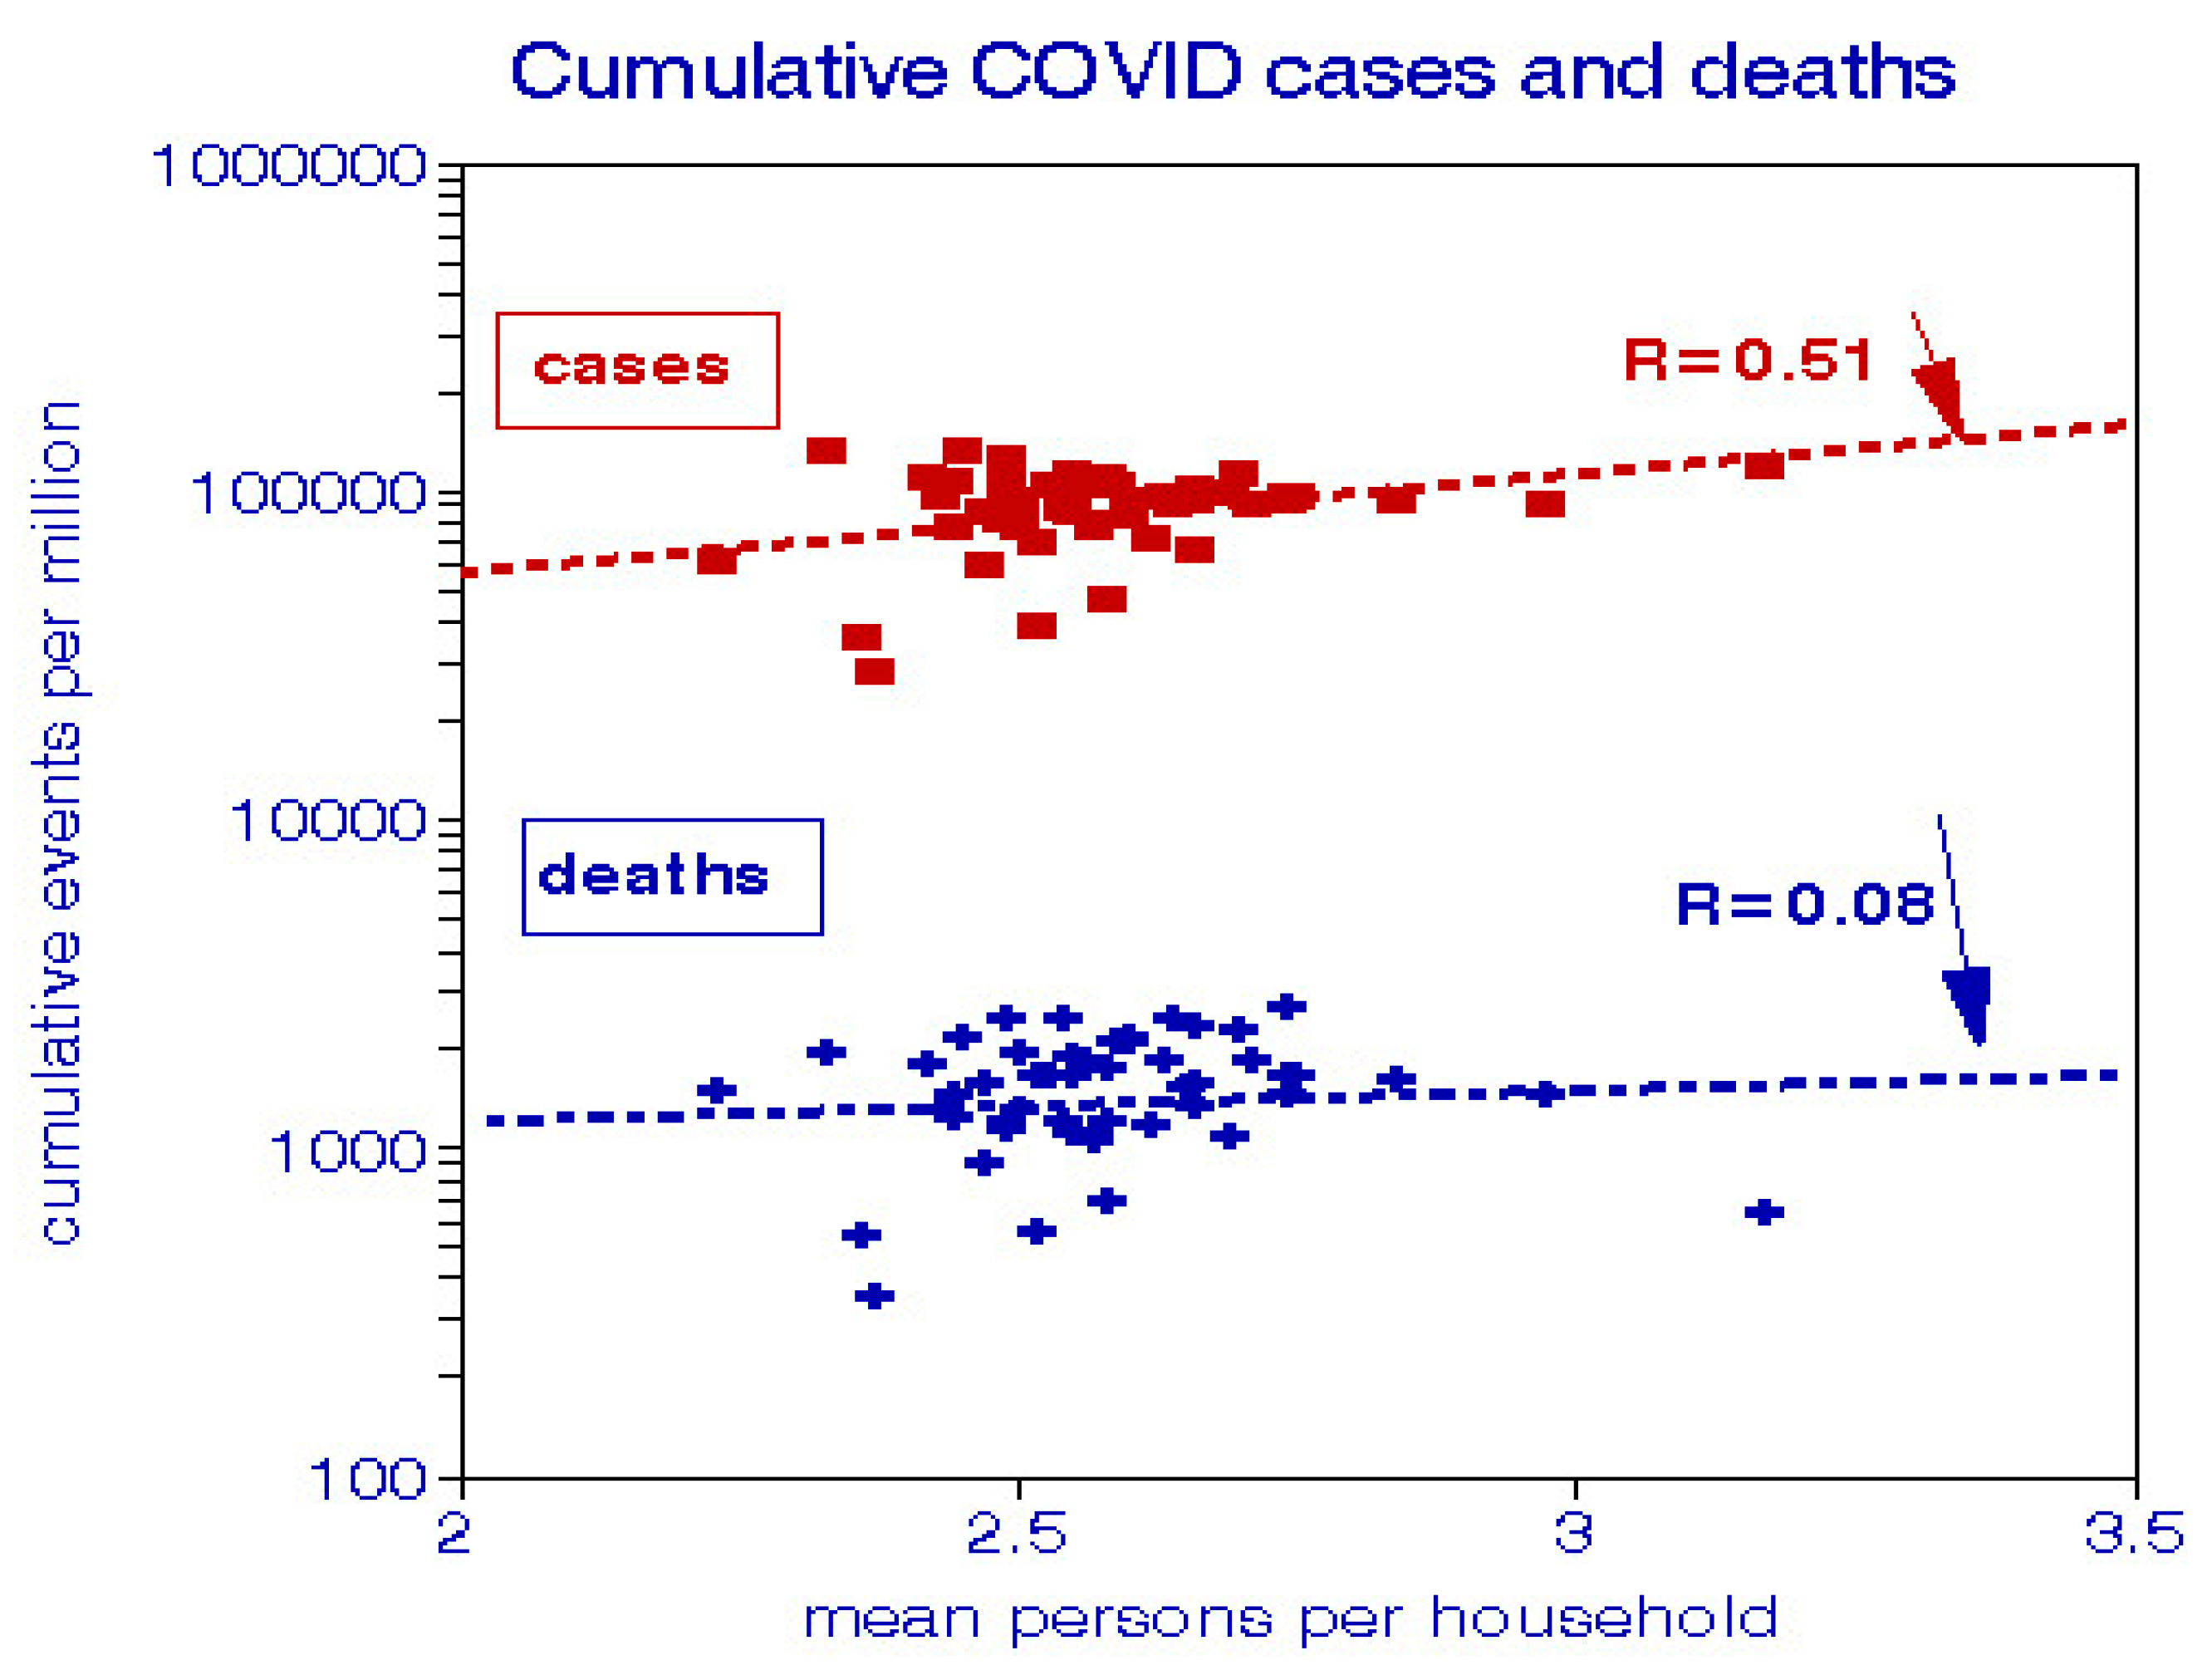
Figure 3.
Relationships with Republican voters in the national election.

Figure 4.
Relationships with education score.

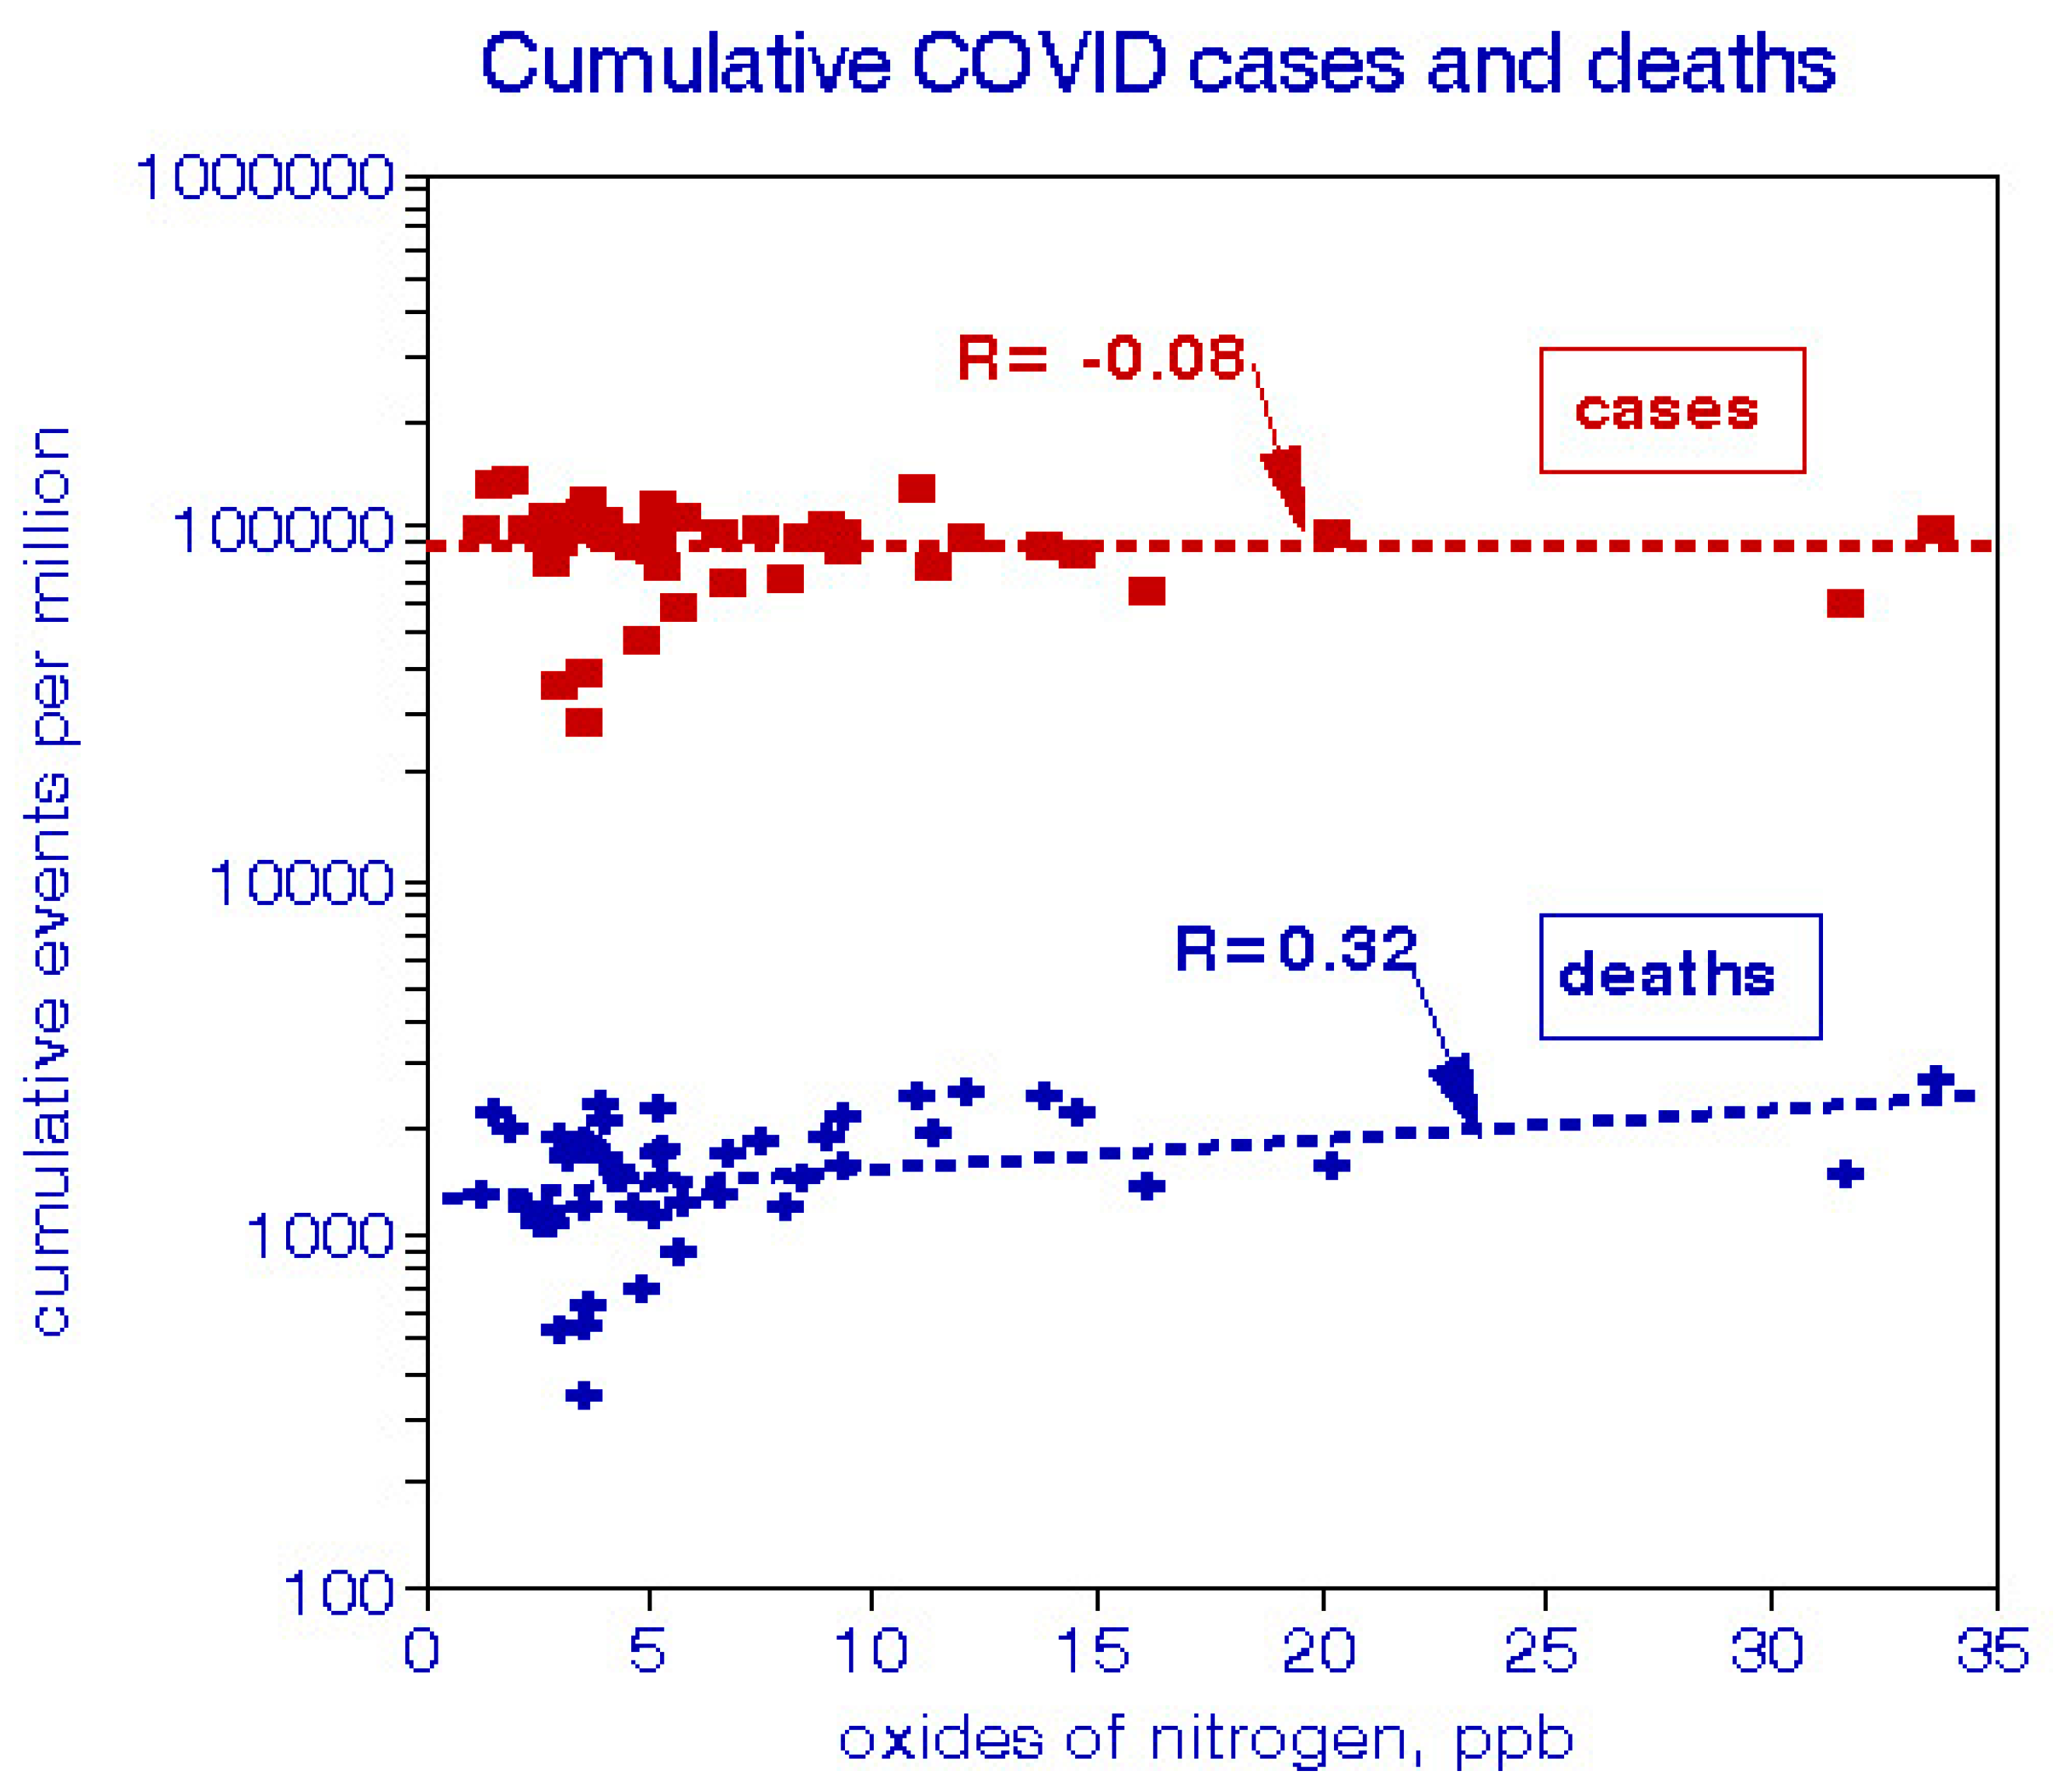
Figure 5.
Relationships with NOx.

Figure 6.
Relationships with EC.


Table 1.
Summary of Short-Term Associations between COVID-19 Cases and Ambient Air Quality.
| 1st Author | Location | Time Period | Lag | PM2.5 | O3 | NO2 | SO2 | CO | PM10 |
|---|---|---|---|---|---|---|---|---|---|
| Adhikari [3] | Queens, NY | March, April 2020 | 21 d | − | + | ||||
| Hoang [4] | South Korea (1) | February, September 2020 | 7 d | + | − | + | + | + | + |
| (2) | + | + | + | + | + | + | |||
| Jiang [5] | China (1) | February 2020 | 0 | + | − | + | + | + | − |
| (2) | + | − | + | + | + | − | |||
| (3) | + | + | + | + | − | − | |||
| Li [6] | China (1) | February 2020 | 4 d | + | + | + | + | ||
| (2) | + | + | − | + | |||||
| Zhu [7] | 120 Chinese cities | February 2020 | 21 d | + | + | + | − | + | + |
+ = adverse, − = beneficial, bold = p < −0.05.
Table 2.
Summary of Long-Term Associations between COVID-19 and Ambient Air Quality.
| 1st Author | Location | Time Period | Outcome | PM2.5 | O3 | NO2 | SO2 | CO | PM10 |
|---|---|---|---|---|---|---|---|---|---|
| Bashir [8] | California | March, April 2020 | cases | − | − | + | − | ||
| deaths | − | − | + | − | |||||
| De Angelis [9] | Italy | February–April 2020 | cases | + | − | + | |||
| death | + | − | + | ||||||
| Elliott [10] | UK | February, September 2020 | death | + | + | + | |||
| Liang [11] | US countries | February–July 2020 | death | + | − | + | |||
| case-fat rate | + | − | + | ||||||
| Magazzino [12] | NY state | March–June 2020 | death | + | + | ||||
| Magazzino [13] | France (1) | March–April 2020 | death | + | + | ||||
| (2) | death | + | + | ||||||
| (3) | death | + | + | ||||||
| Mendy [14] | Cincinnati, OH | March–July 2020 | hospitalization | + (only with prior asthma or COPD) | |||||
| Neelon [15] | US counties | March–August 2020 | death | + | |||||
| Wu [16] | US counties | February–April 2020 | death | + |
+ = adverse, − = beneficial, bold = p < −0.05.
Table 3.
Variables Used in Cross-Sectional Analysis and Univariate Correlations by State.
| Mean (Median) | Case Corr | Death Corr | Case Δ%/Unit | Death Δ%/Per Unit | |
|---|---|---|---|---|---|
| Cases per million | (87,601) | ||||
| Deaths per million | (1458) | ||||
| Case-fatality rate | 0.0173 | ||||
| Population density (sq mi) * | (524) | −0.08 | 0.22 | ||
| Persons per household * | 2.58 | 0.51 | 0.08 | 16 | |
| % Black residents * | 11.5 | 0.05 | 0.35 | 1.4 | |
| % Hispanic residents * | 11.2 | 0.13 | 0.19 | ||
| Household income * | $52,400 | −0.20 | −0.05 | ||
| Education level index * | 51 | −0.38 | −0.33 | −4.9 | −5.1 |
| % Republican voters ** | 50 | 0.51 | 0.12 | 1.4 | |
| Face mask usage score *** | 298 | −0.30 | 0.12 | −4.9 | |
| Distance from NYC **** | 688 | 0.14 | −0.26 | ||
| PM2.5 (2003) µg/m3 ***** | 11.8 | 0.07 | 0.34 | 5.2 | |
| PM2.5 (2016) µg/m3 ***** | 8.2 | 0.14 | 0.26 | ||
| NOx (2002), ppb [27] | 7.1 | −0.08 | 0.32 | 2.1 | |
| EC (2002) µg/m3 [27] | 0.29 | 0.11 | 0.30 | 4.5 |
(median), bold = p < 0.05 * U.S. Census data ** election results *** NY Times, 7/17/2020 **** road atlas ***** US EPA Air Data.
Table 4.
Relative mortality risks of air pollution by cause of death.
| Pollutant | COVID-19 Mortality * | All-Cause Mortality # |
|---|---|---|
| EC | 1.07 (0.94–1.23) | 1.07 (1.05–1.10) |
| NOx | 1.10 (0.95–1.26) | 1.08 (1.06–1.09) |
| PM2.5 | 1.48 (0.84–2.62) | 1.09 (0.90–1.33) |
* controlled for race. # from previous studies.
Publisher’s Note: MDPI stays neutral with regard to jurisdictional claims in published maps and institutional affiliations. |
© 2021 by the authors. Licensee MDPI, Basel, Switzerland. This article is an open access article distributed under the terms and conditions of the Creative Commons Attribution (CC BY) license (https://creativecommons.org/licenses/by/4.0/).
Share and Cite
MDPI and ACS Style
Lipfert, F.W.; Wyzga, R.E. COVID-19 and the Environment, Review and Analysis. Environments 2021, 8, 42. https://0-doi-org.brum.beds.ac.uk/10.3390/environments8050042
AMA Style
Lipfert FW, Wyzga RE. COVID-19 and the Environment, Review and Analysis. Environments. 2021; 8(5):42. https://0-doi-org.brum.beds.ac.uk/10.3390/environments8050042
Chicago/Turabian StyleLipfert, Frederick W., and Ronald E. Wyzga. 2021. "COVID-19 and the Environment, Review and Analysis" Environments 8, no. 5: 42. https://0-doi-org.brum.beds.ac.uk/10.3390/environments8050042
Note that from the first issue of 2016, this journal uses article numbers instead of page numbers. See further details here.