Article

A New Approach to Mapping Cultural Ecosystem Services

1
Department of Earth Sciences, Faculty of Sciences Ain Chock, University Hassan II, Casablanca 20000, Morocco
2
Institut de Géographie et d’Aménagement, Université de Nantes, LETG UMR, 6554 Nantes, France
3
Department of Geology and Mineralogy, Vilnius University, 01513 Vilnius, Lithuania
4
Department of Natural Sciences, Klaipėda University, 92294 Klaipėda, Lithuania
5
CERIS, Instituto Superior Técnico, Universidade de Lisboa, 1049-001 Lisbon, Portugal
6
Institute of Applied Technology, Thu Dau Mot University, Binh Duong Province 75000, Vietnam
*
Author to whom correspondence should be addressed.
Submission received: 6 April 2021 / Revised: 10 June 2021 / Accepted: 11 June 2021 / Published: 15 June 2021
(This article belongs to the Special Issue Feature Papers in Environments in 2020)

Abstract

:
According to various sources, Southern Morocco has stood out as an outstanding tourist destination in recent decades, with global appeal. Dakhla City, including Dakhla Bay, classified by the Convention on Wetlands in 2005 as a Wetland of International Importance, offers visitors various entertainment opportunities at many city sites. Therefore, human activity and social benefits should be considered in conjunction with the need to safeguard the ecosystems and maintain the Ecosystem Services (ES). This study aims to provide an overview of the tourism dynamics and hotspots related to cultural ecosystem services in Dakhla Bay. The landscape attributes are used along with an InVEST model to detect the distribution of preferences for the Cultural Ecosystem Services (CESs), map the hotspots, and identify the spatial correlations between features such as the landscape and visiting rate to understand which elements of nature attract people to the locations around the study area. Geotagged photos posted to the Flickr™ website between 2005 and 2017 were used to approximate the number of tourist visits. The results showed that tourism suffered several dips in 2005–2017 and that tourist visits are currently rising. Additionally, an estimated annual tourist visit rate shows that tourism in Dakhla Bay has been growing steadily by 2%.

1. Introduction

Marine and coastal areas provide various Ecosystem Services (ESs) essential for the well-being of all living things. These services can be material (e.g., water, food, and energy) and nonmaterial (e.g., religious interest, recreation, and entertainment) [1]. Cultural ESs (CESs) are provided jointly by humans and the ecosystem and result from conjunct interactions [2]. They are present in all the classifications [3]. They are defined as the nonmaterial advantages that combine to improve human well-being [4]. CESs are the most challenging type of ES to characterize [2]. According to older studies, CESs have been pointed to as the least-studied type of ES [5]. The indicators for evaluating them are less developed [6]. However, more recently, it has become clear that the CESs have experienced an increasing number of publications [7,8]. Milcu’s review [9] showed that CESs have been the subject of an increasing number of publications [10], resulting in the need to develop methods to identify and quantify them [6]. Assessing CESs can create links between landscape research, social science, and ecology [4], so it is essential to further direct developers and stakeholders in the interests of both sustainable development and knowing where action should be taken to inform their decisions [11].
The Millennium Ecosystem [12] Assessment considers the human dimension an integral and essential ecosystem component [13]. It encourages policymakers to use new scientific methods to include them alongside the other aspects. Assessing CESs is particularly challenging due to their intangible and subjective natures. Many authors have tried different techniques, most of them focusing on the assessment of financial valuation [1,11], appraisals, and sociocultural preferences through meetings [14,15] and discussion groups [11,16]. The development of spatial models to map and evaluate ecosystem services across the territory is becoming a more standard approach and has great potential for supporting environmental decision-making and landscape management [11,17,18]. Specific CES mapping approaches allow the spatial identification of CES hotspots on various scales. Referring to the authors’ methods, most of them are based on recreational models (e.g., InVEST [19]), combining biophysical spatial models and sociocultural variables (e.g., Maxent [6]) and crowd-sourced photographs [20]. Assessments of this kind require identifying cost-effective techniques to map and analyze the spatial distributions of cultural preferences. These efforts typically focus on providing and regulating services, with fewer options for assessing the CESs.
In recent years, much geographic information has been produced by the advent of social networks [18,21]. Social network users generate content providing volunteered geographic information in several application fields (Goodchild 2007). This offers new potential for mapping differently. Due to the increase in the number of images uploaded on photo-sharing platforms, geo-localized photographs can be used as a crowd-distributed sensor, which provides a new mapping method [6]. These photographs can also be considered as crowd-sourced geospatial data through “passive maps” [16]. Many tourism studies have used photographs retrieved from social media websites [19,22,23,24]. Visitors are generally attracted to the locations where they take photos, so an analysis of the photographs taken by a community can be used to assess their CES preferences instead of using interviews [6]. Social media photograph analytics help researchers and experts collect data and identify the travel methods and the geographical variability of human patterns. Many recent studies have used this type of method, analyzing the photographs posted on online platforms to determine the site preferences in a given location [10,11,20,25].
Different social media websites have been investigated and analyzed for tourism research, including consumer review networks (e.g., TripAdvisor and https://www.booking.com/ (accessed on 6 April 2021) and social networking websites (e.g., Facebook and Twitter). For example, many researchers have collected customer review data about hotels or restaurants from https://www.tripadvisor.com/ and Booking.com (accessed on 6 April 2021) [10,18]. Flickr is a good platform for estimating the visiting frequency; analyzing a series of photographs on the platform is a good way of assessing the various aspects that may attract visitors [7,26]. More recently, online photo libraries have been used to evaluate CESs [19,22,27,28,29]. Recent GIS studies in tourism combined with the InVEST model by using the Flicker website to analyze the geographic variability in CES and identify the landscape settings [28], explore the spatial patterns of tourist flows [25] and identify hotspots of tourists at a given location [25]. Patrizia Tenerelli [6] combined GIS and a Flicker analysis to explore the spatiotemporal patterns and tourist hotspots in mountain landscapes.
This study modeled and mapped the CESs on larger spatial scales and evaluated their social importance beyond the financial metrics by exploring the use of social media photographs to model a person’s spatial distribution preferences for CESs in Dakhla Bay. The density of the nature photographs of a particular spot can be considered a sign of public interest in the area related to the cultural and recreational ecosystem heritage. In this study, the InVEST recreation model was adopted as a unique approach. Finally, these assessment results provided new information on CESs that could lead to positive changes at the regional and national levels.

2. Materials and Methods
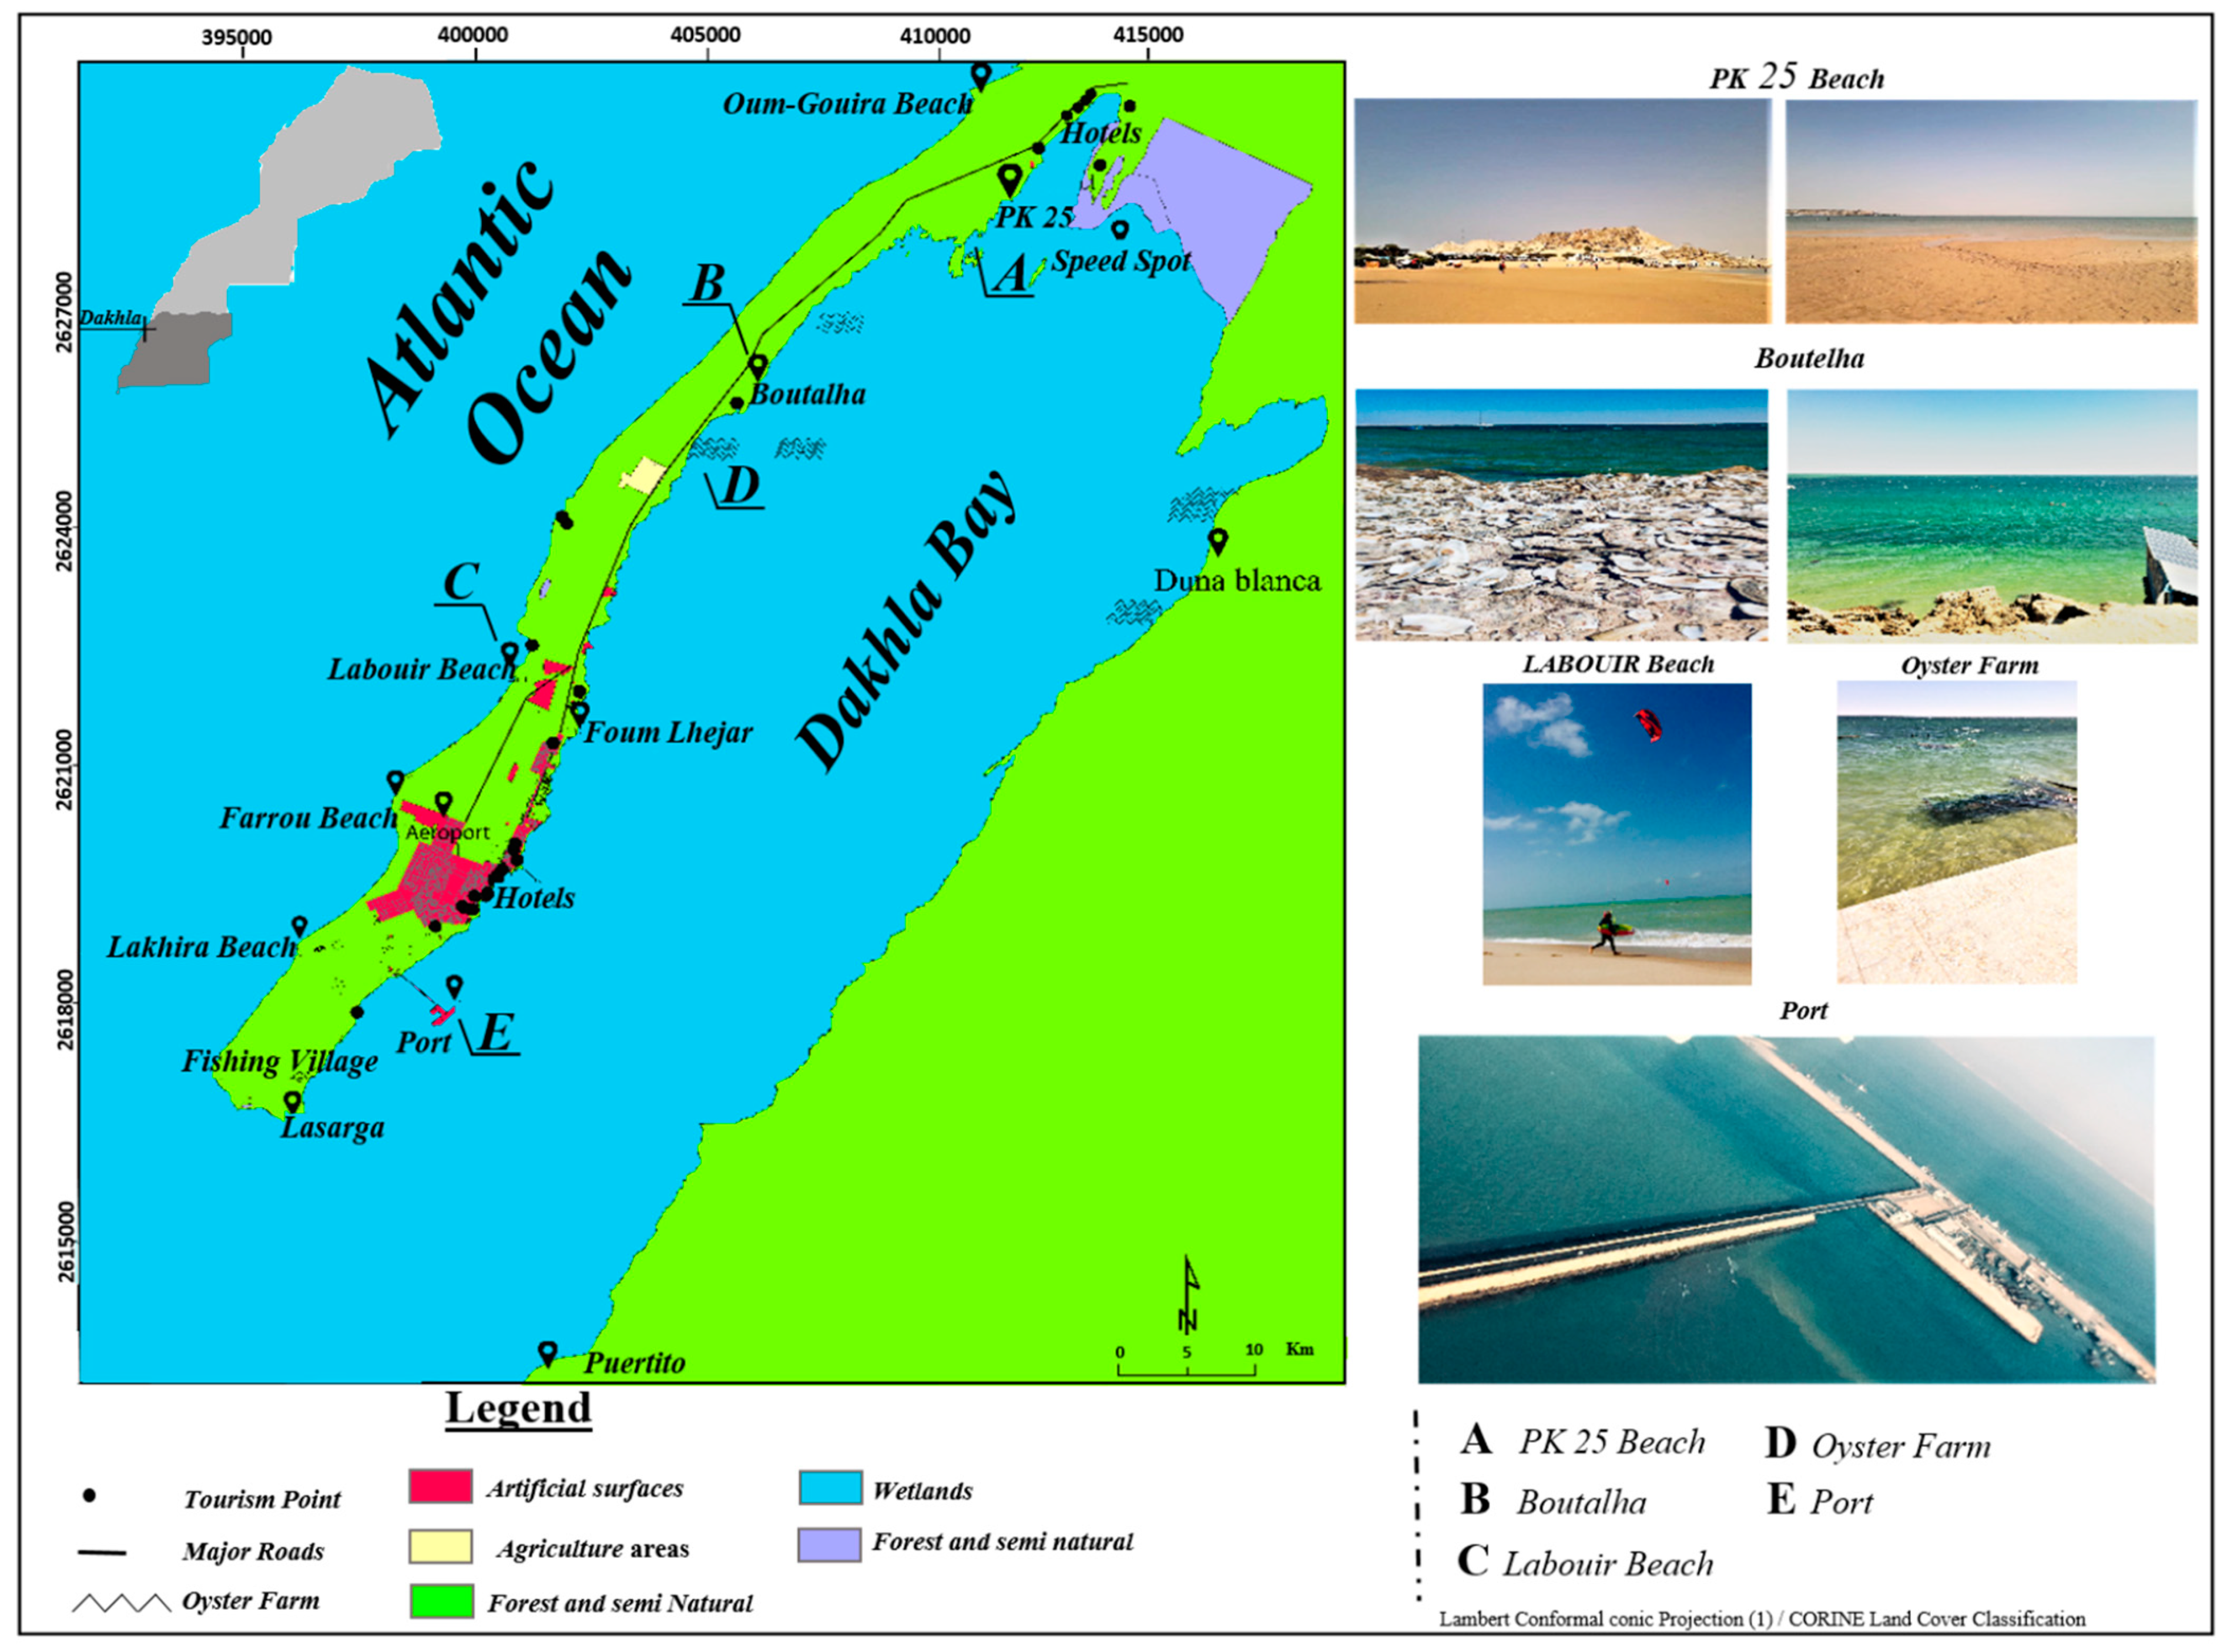
2.1. Study Area

Dakhla, the capital of the Dakhla-Oued Ed-Dahab region, is located on a narrow peninsula on the Atlantic Coast of Southern Morocco (Figure 1) (30°24′38.56″ N, 9°33′20.59″ W) and has witnessed a significant increase in tourism and recreation activity. Several factors combine to encourage tourism in this region. The region’s geographical location and the configuration of Dakhla Bay (37 km long and between 10 km and 12 km wide, with a depth ranging from 6 m to 20 m) make the region and its peninsula one of the most attractive places the world to visit. It is naturally divided into three parts: outer, central, and inner Dakhla Bay. The area also has protected zones and was classified by the International Convention on Wetlands in 2005 [30] as a Wetland of International Importance. The region has a desert climate. Water temperature in the bay ranges between 15 °C in the winter (December–February) and 26 °C in the summer (May–October), making it an important industrial and commercial center and a cultural focal point. Due to the interaction of cold currents, the Canary Current, and subtropical highs, the four main beaches (PK 25, PK 28, Labouir Beach, and Speed Spot) are the top destinations for water sports in the world. The prevailing wind direction is N–NE. It is a region where the desert, natural landscape, and sea form the perfect setting. It has two major ports, a military port and the more critical Dakhla Atlantic Port dedicated to trading and fishing. Airport infrastructure is linked to Dakhla’s international port, with direct daily flights to Casablanca, four flights per week to Agadir via Laayoune, and two to Las Palmas and Paris. The hotel infrastructure is also an added value in this region, with dedicated surf, windsurf, and kitesurf hotels overlooking Dakhla Lagoon.
The region also has rare and diverse fauna, including many marine invertebrates (i.e., polychaetas, green lobster, annelids, and cephalopods, among others) and flora; the bay is carpeted with a vast meadow of marine phanerogams and desert vegetation such as chenopodiaceous and zygote phylloclade. Many historically significant sites attract local and international archeologists and amateur and professional water sports and fishing enthusiasts. This exceptional abundance of cultural, human, and natural diversity attracts many tourists yearly.

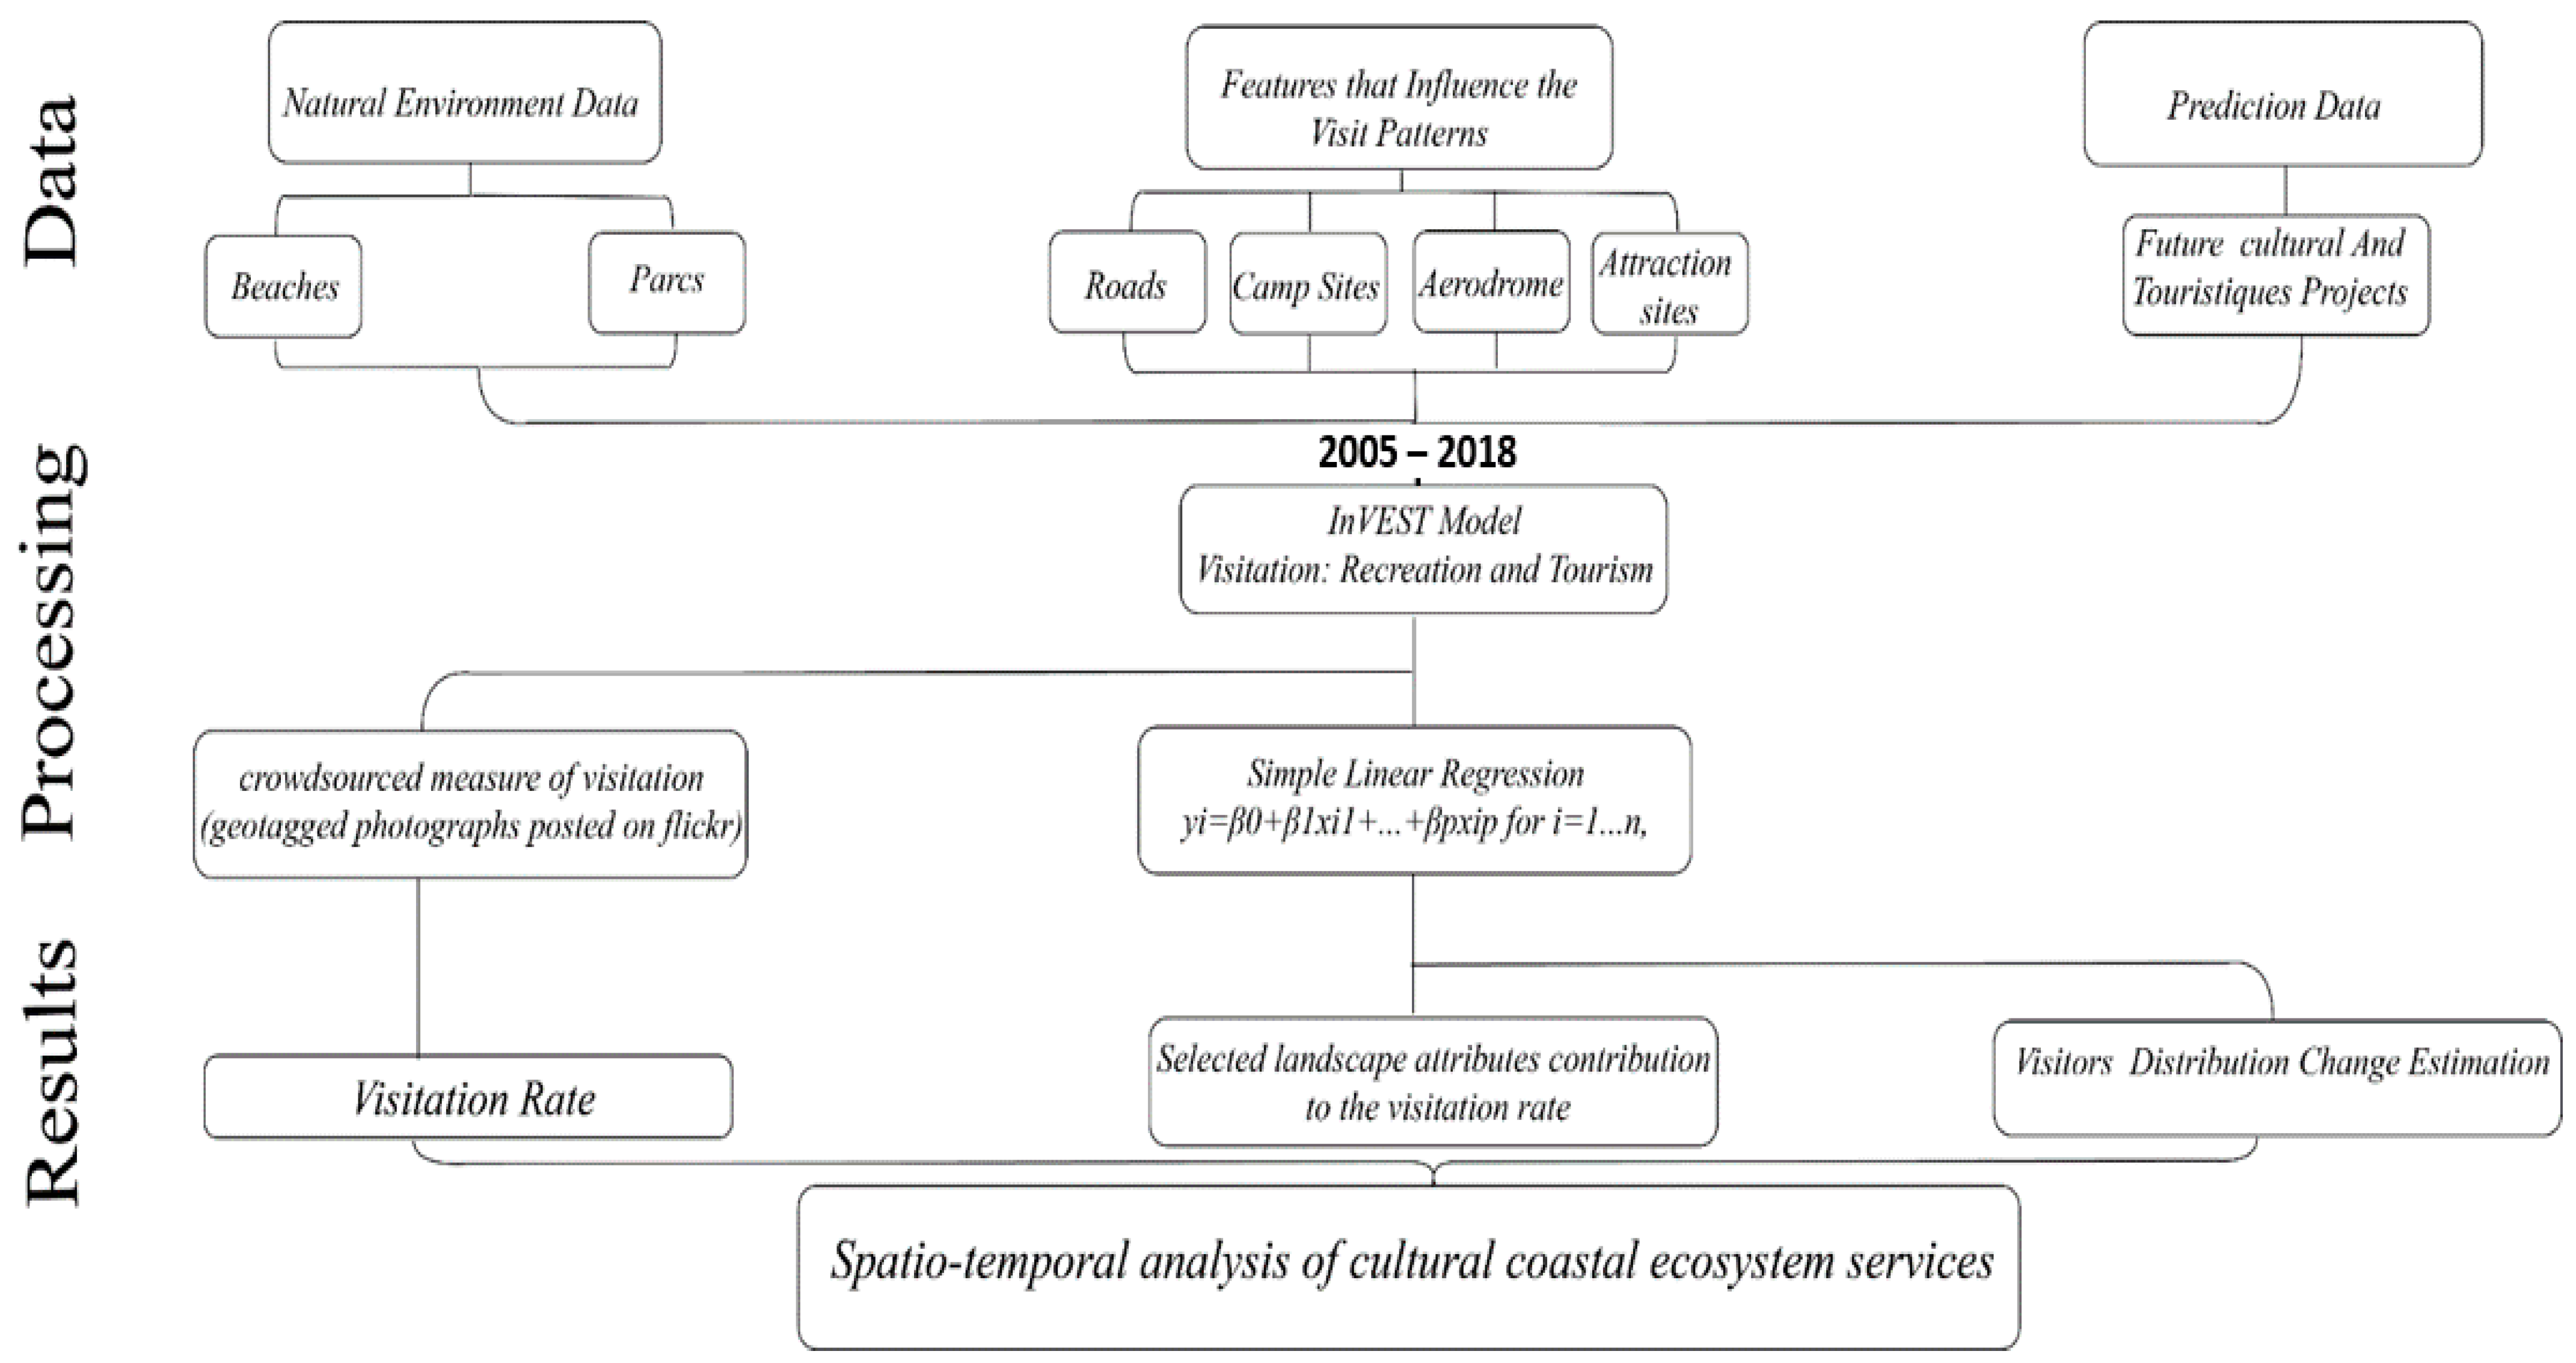
2.2. Tourism and Recreation Model

2.2.1. Data Used and Criteria

Complex methodological approaches such as the recreation model from Integrated Assessment of Ecosystem Services and Trade-offs (InVEST) [26] are among the adequate models used to evaluate tourism in relation to the coastal cultural ecosystem services in Dakhla Bay [19]. In this study, the InVEST recreation model methodology [26] was used to calculate the number of photographs published to the Flickr website per cell grid on Dakhla Bay, assess the number of visitors, and analyze the preferences of each one. We then used Dakhla tourism surveys to compare the visitor numbers in the study area produced by the model. Given the growing tourism trend and the number of recreational activities in Southern Morocco, we focused the study on the period 2005–2017. The InVEST linear regression included in the model was used to estimate the significance of the landscape features (e.g., natural landscapes and accessibility by road) that could account for the spatial differences in visitor distributions. This produced a simple linear regression to estimate the landscape attributes’ effects on visiting rates [26]. All the data used in this study were collected using existing land use and land cover maps and verified by field measurements. All local data of different types that could potentially be used as predictors in the model were collected, as much as possible (e.g., hotels; parks; Dakhla Bay beaches (PK 25, Labouira Beach, BouTelha Beach, and Lakhira Beach); and natural areas (orchards, meadows, white dunes, and speed spots)). The model predictors selected for the study (Table 1) were the features associated with natural coastal ecosystems (e.g., natural landscape), features extremely important for tourism in the study area (e.g., attraction sites), and were landscape settings whose spatial variations may affect the cultural service provision. We selected the nine most relevant explanatory predictive variables. The predictive variables were initially chosen based on the InVEST model’s predictive variable suggestions; the model considered at least one predictor variable from several primary categories (e.g., natural capital (habitats and lakes), built capital (e.g., roads and hotels), industrial activities, and access (e.g., roads and major airports)) to explain the majority of the variations in the photo-user days. The predictive variables were classified according to CES assessments in the literature and expert knowledge of the physical (natural landscape) and infrastructure (potential of landscape) characteristics, which were the main drivers of CES provision in the study area. The predictors’ spatial data are presented in the WGS84 coordinate system and divided into three categories: natural landscapes, the potential of landscape features, and forecast data.
Natural landscapes, nature, water bodies, and hydrology are among the most used variables in CES for recreational choice models.
Beaches: All Dakhla Bay beaches already included in the study area map (PK 25 Beach, Boutelha Beach, Farrou Beach, Lakhira Beach, Labouir Beach, Oum Gouira Beach, Foum Lahjar Beach, speed spot, and fishing villages).
Natural areas: White dune, orchards, meadows, and forests.
Potential of landscape features: The potential of the landscape variables were included in the model to consider the infrastructures and the potential demands related to the CES.
Attractions sites: Hotels, restaurants, ports, host houses, Lasarga, oyster farms, surf schools, and kitesurf schools.
Campsites.
Roads.
Aerodrome.
Parks and semi-natural areas (green urban areas).
Forecast data: The future projects collected in situ from the Tourism Delegation of Dakhla City.
The correlation between the visiting rate and predictors was assessed using a Pearson’s correlation coefficient to determine the extent to which recreation services affect visiting rates. Other statistical analyses were projected, such as the Variance Inflation Index (VIF) and linear regression for predictors. However, the estimated results provided by the model ruled out the use of such analyses, since they would provide insignificant results with little relevance. Natural areas were excluded from the correlation as a predictor, as they showed non-significant correlations. The study area was divided into grid cells of 0.0028 degrees.

2.2.2. InVEST Recreation Model

InVEST is an adaptable toolset that evaluates, maps, and quantifies the services provided by landscapes [31]. It is an open-source tool that uses computer-based models focusing on ecosystem services. It provides ‘monetary and nonmonetary results based on a scenario. It is designed to integrate stakeholder engagement processes https://naturalcapitalproject.stanford.edu/ (accessed on 6 April 2021). The suite of InVEST models developed by the Natural Capital Project provides quantified spatial outputs of ES. These models have been used in management, decision-making, and many ES studies [28,31]. Although the recreation model has not often been used in these fields, it was cited in one article: Linking modeling and empirical data to assess coastal habitats’ recreation services: The case of NW Portugal [28]. The InVEST recreation model [26] uses geotagged photos published on the Flickr website as a rough indicator of the annual visit rate at a given location [26]. It estimates the visits in a defined research area per grid cell, using photo–user–day (PUD) as a visit rate unit. One PUD at a given location indicates at least one picture taken by one photographer on a specific day (Figure 2). The influence of natural landscapes, which explains the spatial distribution of visitors, is estimated with a simple linear regression:
( y i = β 0 + β 1 x i 1 + + β p x i p   f o r   i =   1 ... n )
Xip represents each attribute’s coverage in each cell of the area of interest studied (AOI), which contains n cells [26]. Yi is the PUD variable, and all the X variables are the predictors. The first step is to log-transform all the Yi values using the natural log of the average photo user days per cell + 1 [26]. The simple linear regression is then applied to estimate each attribute’s effect on the previous log-transformed visit rate across the n grid cells in the study area. ßp is the estimated values. These are used in an additional scenario to predict how future changes to the landscape will alter the visit rate [26]. The study area was divided into 0.0028° grid cells, i.e., 0.0028 degrees’ latitude/longitude.

2.3. Model Limitations

The InVEST model does not guarantee any certainty that the predictor variables directly affect visits. However, it does estimate each predictor’s importance in the model based on its spatial correlation with the visit rate at a given location [26]. PUD values per cell grid are taken as visit rate measurements. They are regressed with the values for the predictor variables in each cell. The above-mentioned βp values in the linear regression are calculated for the prediction tables used for future prediction scenarios [26]. The results forecast by the model are based on the assumption that people will be attracted to or discouraged by the predictors in the future in the same way they are currently [26]. However, the estimated visit rates may be lower than the actual visit rates.
This could be due to the model’s possible limitation in using only Flickr uploads as a data source and not considering other social media platforms such as Instagram (2010) and Facebook (2004), which emerged more recently. However, it is noted that Flickr users and uploaded photographs do not necessarily represent the entire visitor population at a given location and are only an estimate. Despite the limitations, this approach provides an initial assessment and low-cost indicator for mapping the benefits for the cultural ecosystem [6].

2.4. GIS Statistical Analysis

The GIS tool supports the spatial analysis of coastal cultural ecosystem services to display hotspots in the most-visited areas. Generally, GIS has always been used as a tool to support tourism planning spatial decision constraints in tourism research, management, and policy [32,33]. It is a computer-based system of analyzing, gathering, and managing spatial data to support spatial decision-making [18,32,33,34]. As cited by Millar, Morice, Horne, and Aspinall, “GIS offers a powerful tool for providing information to support decision making in tourism planning and management to promote integrated management to resources based on sensitivity to their use and the needs of local communities and visitors” (p. 20 [18]).
ArcGIS software version 10.3 (ESRI) was used to visualize and map the results obtained from modeling the recreation services to detect the places most often visited. The results were given in a table of attributes, with different visiting rate values for each grid cell. These values were ranked from the most visited to the least visited. A geoprocessing tool was applied to each monthly visiting rate to calculate the density based on each point’s features and create density maps. The first step was to map the cultural ecosystem service modeling results by classifying the annual and monthly visit rates.

3. Results

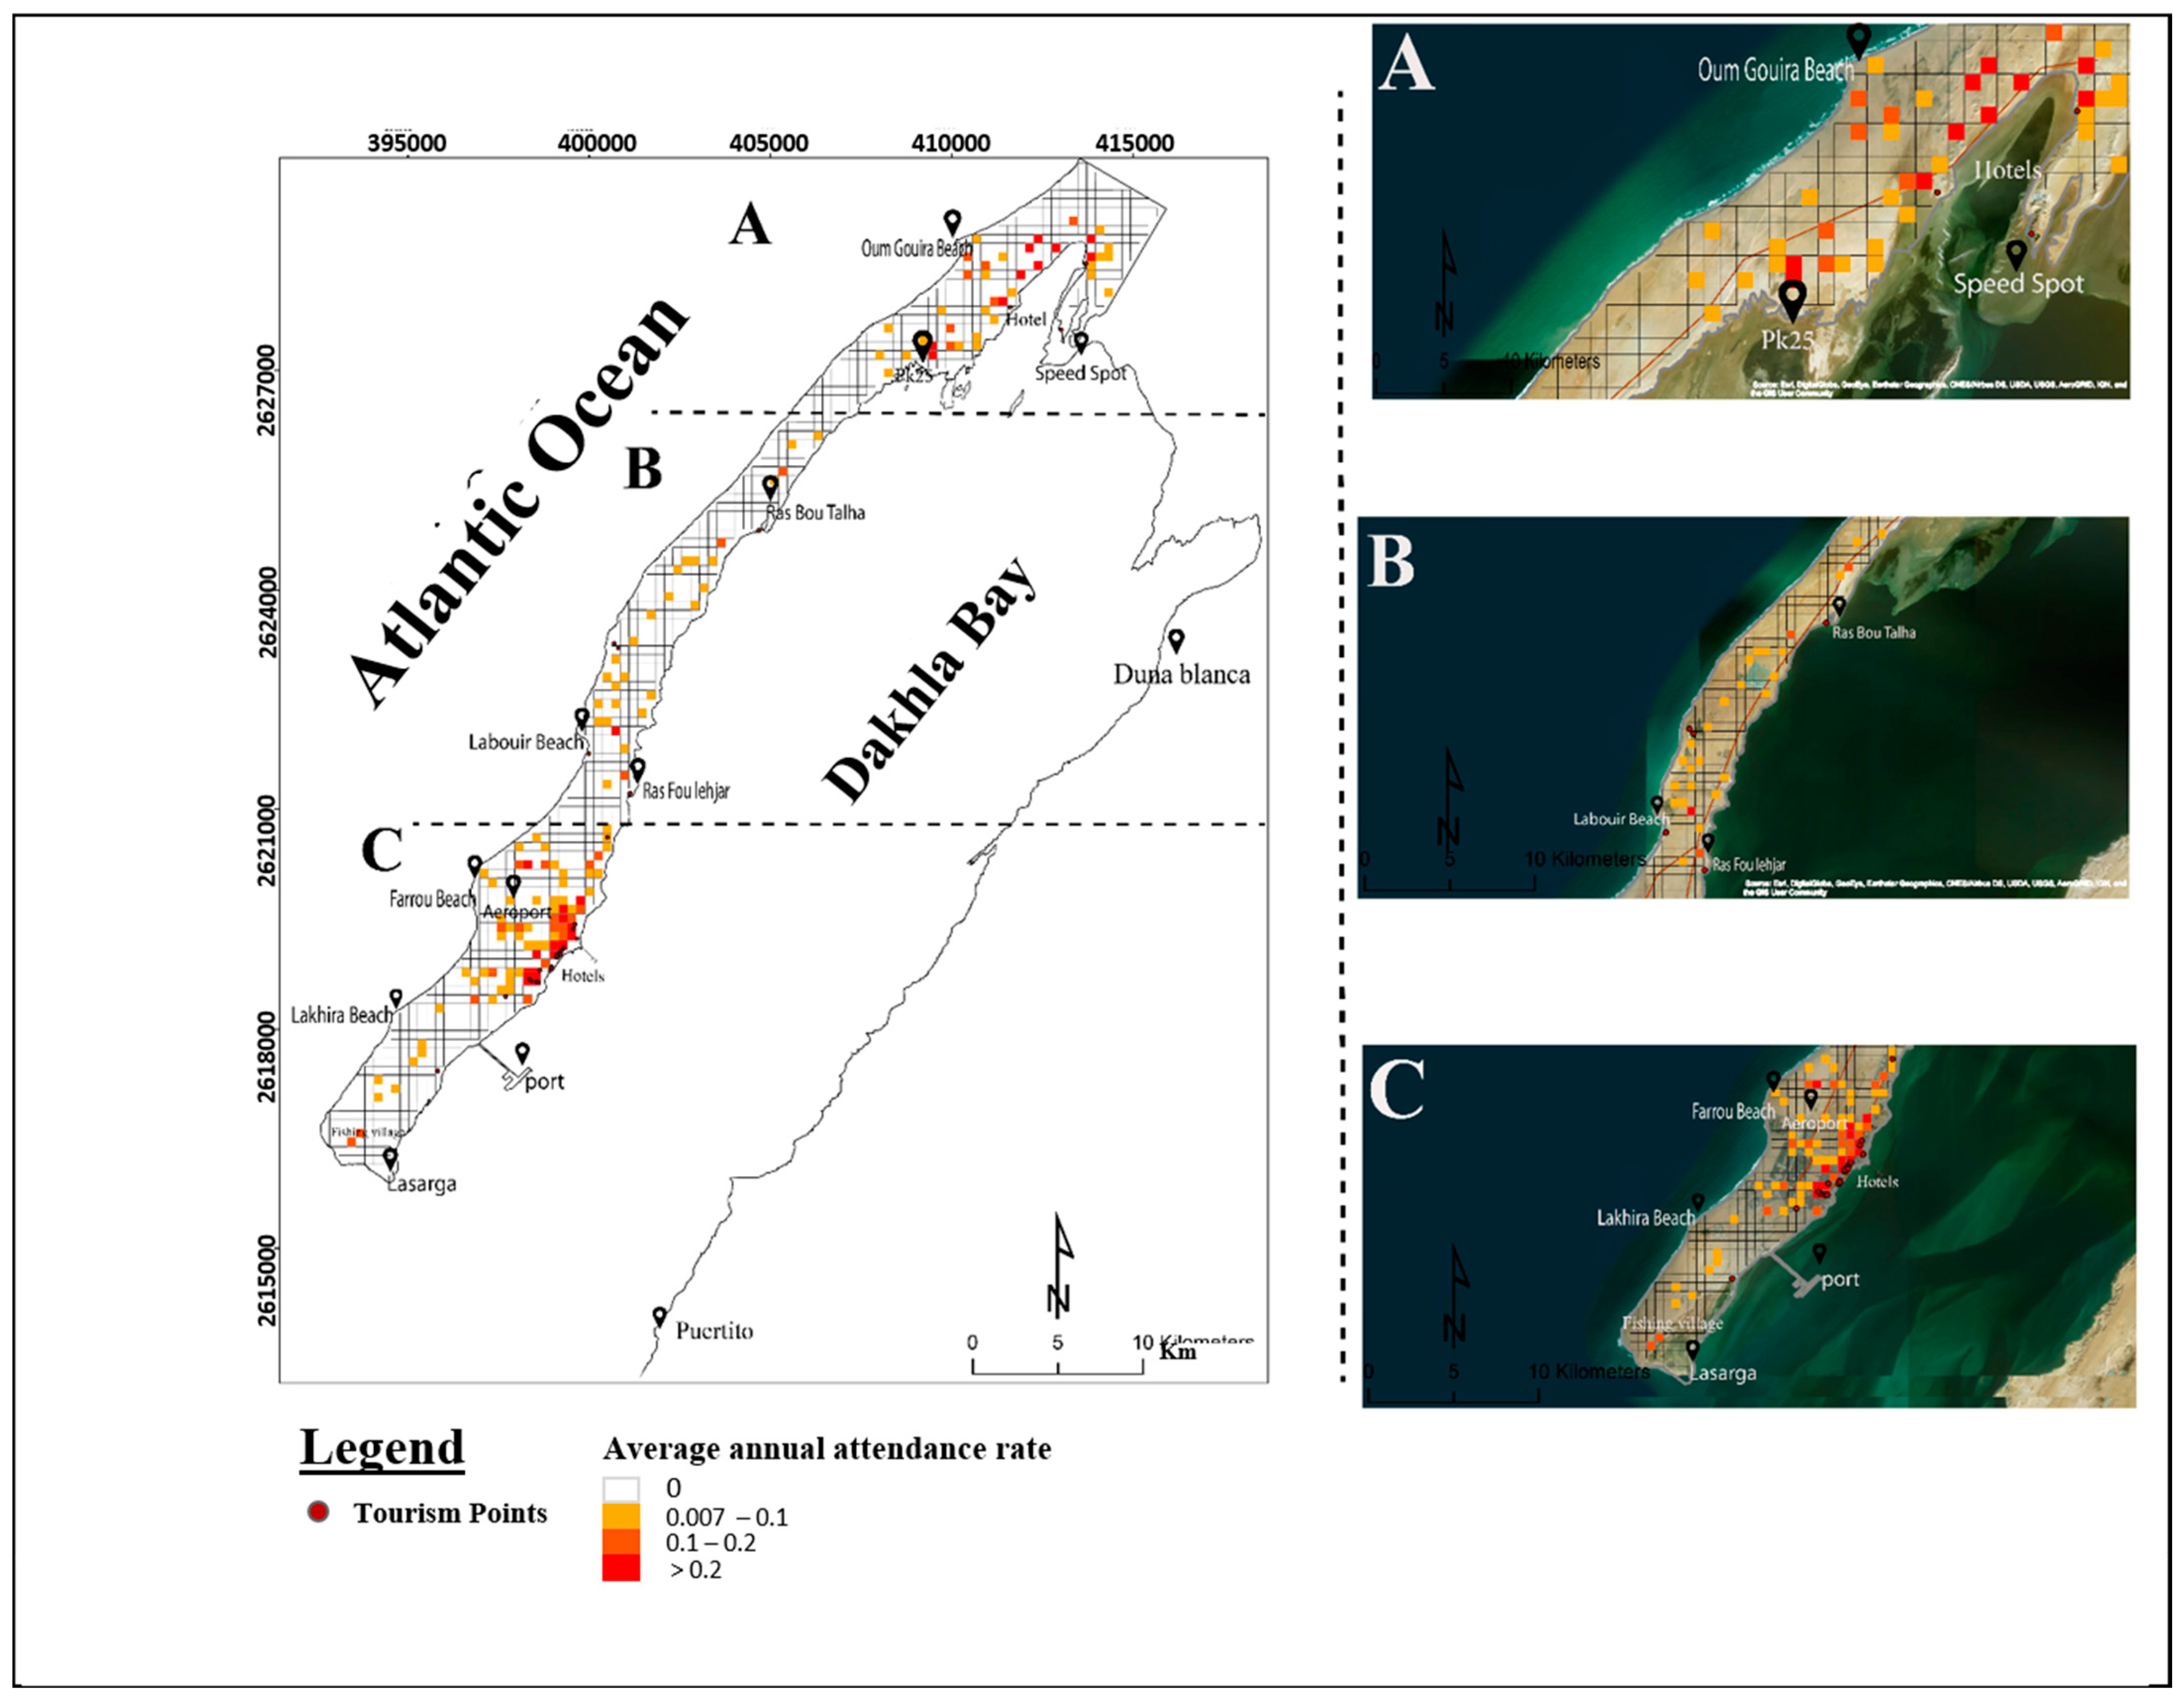
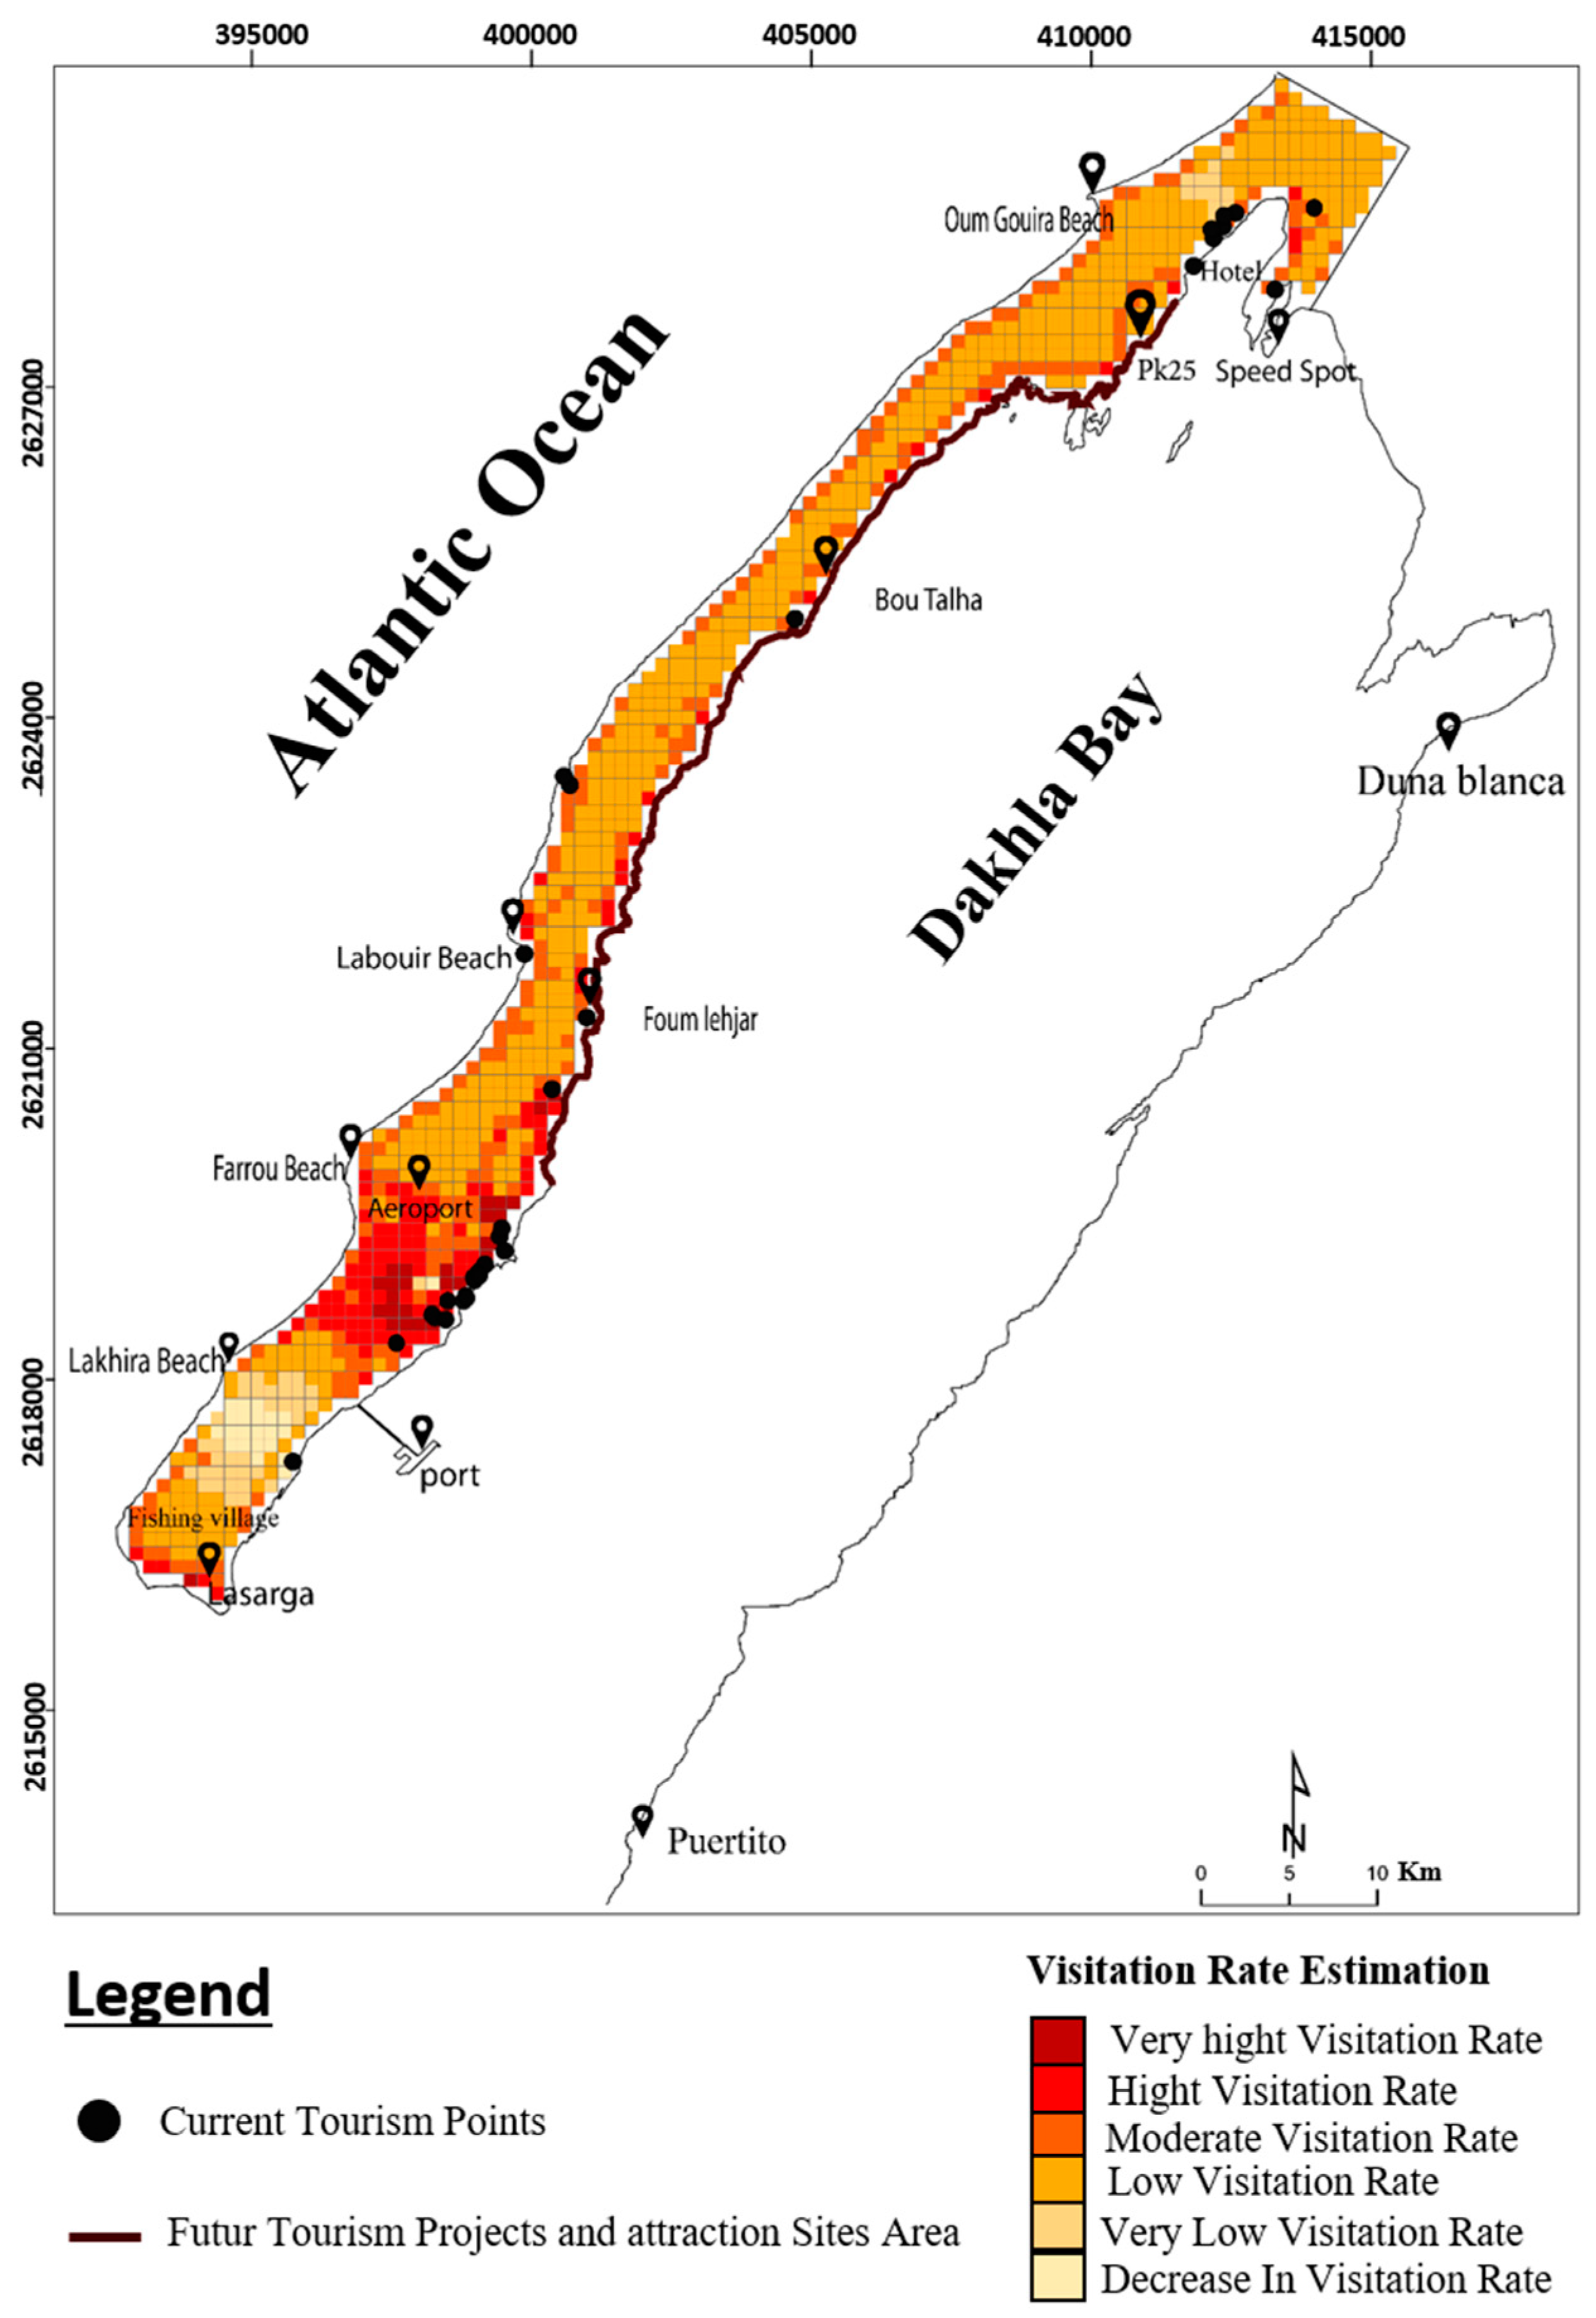
3.1. Average Annual Visit Rate Mapping

The average visit rate values (2005–2017) for each cell were estimated using the InVEST linear regression model. The average visit rates assessed in Dakhla (Figure 3) showed a strong imbalance across the study area, varying from 0.7 to 0.07 PUD per year. Two hotspots were identified with very high visit rates. The first one (Figure 3A) was located in the northeast of the study area (Outer Dakhla Bay) and had an average annual visit rate of 0.54 PUD per year. The second hotspot was located in the south of the area (Inner Dakhla Bay) (Figure 3C), where the cells showed very high visit rates (0.72 PUD per year). The area along the peninsula between these two hotspots (Figure 3B) showed significantly lower average visit rates.
The central part of Dakhla Bay represented 84% of the zero-rated PUD cells (no. of cells = 816) and some low and moderate visit rates for BouTalha Beach, Foum Lahjar Beach, and Labouira Beach, with annual visit rate values of 0.079 PUD per year, 0.1 PUD per year, and 0.076 PUD per year, respectively. According to the Pearson’s correlation (Table 2), all the landscape attributes were significantly correlated with the visit rates (p > 0.05) except for the aerodrome and roads. The campsites, attraction sites, and beaches were the main predictors accounting for the visit rates. The aerodrome and roads were negatively correlated with the visit rates. The temporal pattern of the visit rate results for Dakhla Bay showed that the annual visit rate suffered several dips over the twelve years (Figure 4). The first year, 2005, had the lowest average user photos per day (2 PUD). The annual visit rate increased gradually over the period 2005–2008. In 2009, the average visit rate fell by 37 PUD (2008 = 47 PUD and 2009 = 10 PUD), then started to recover in 2010, increasing to 51 PUD. The period 2011–2016 was marked by a variation of between 33 and 56 PUD, until the last period of decline in 2017 at 9 PUD.

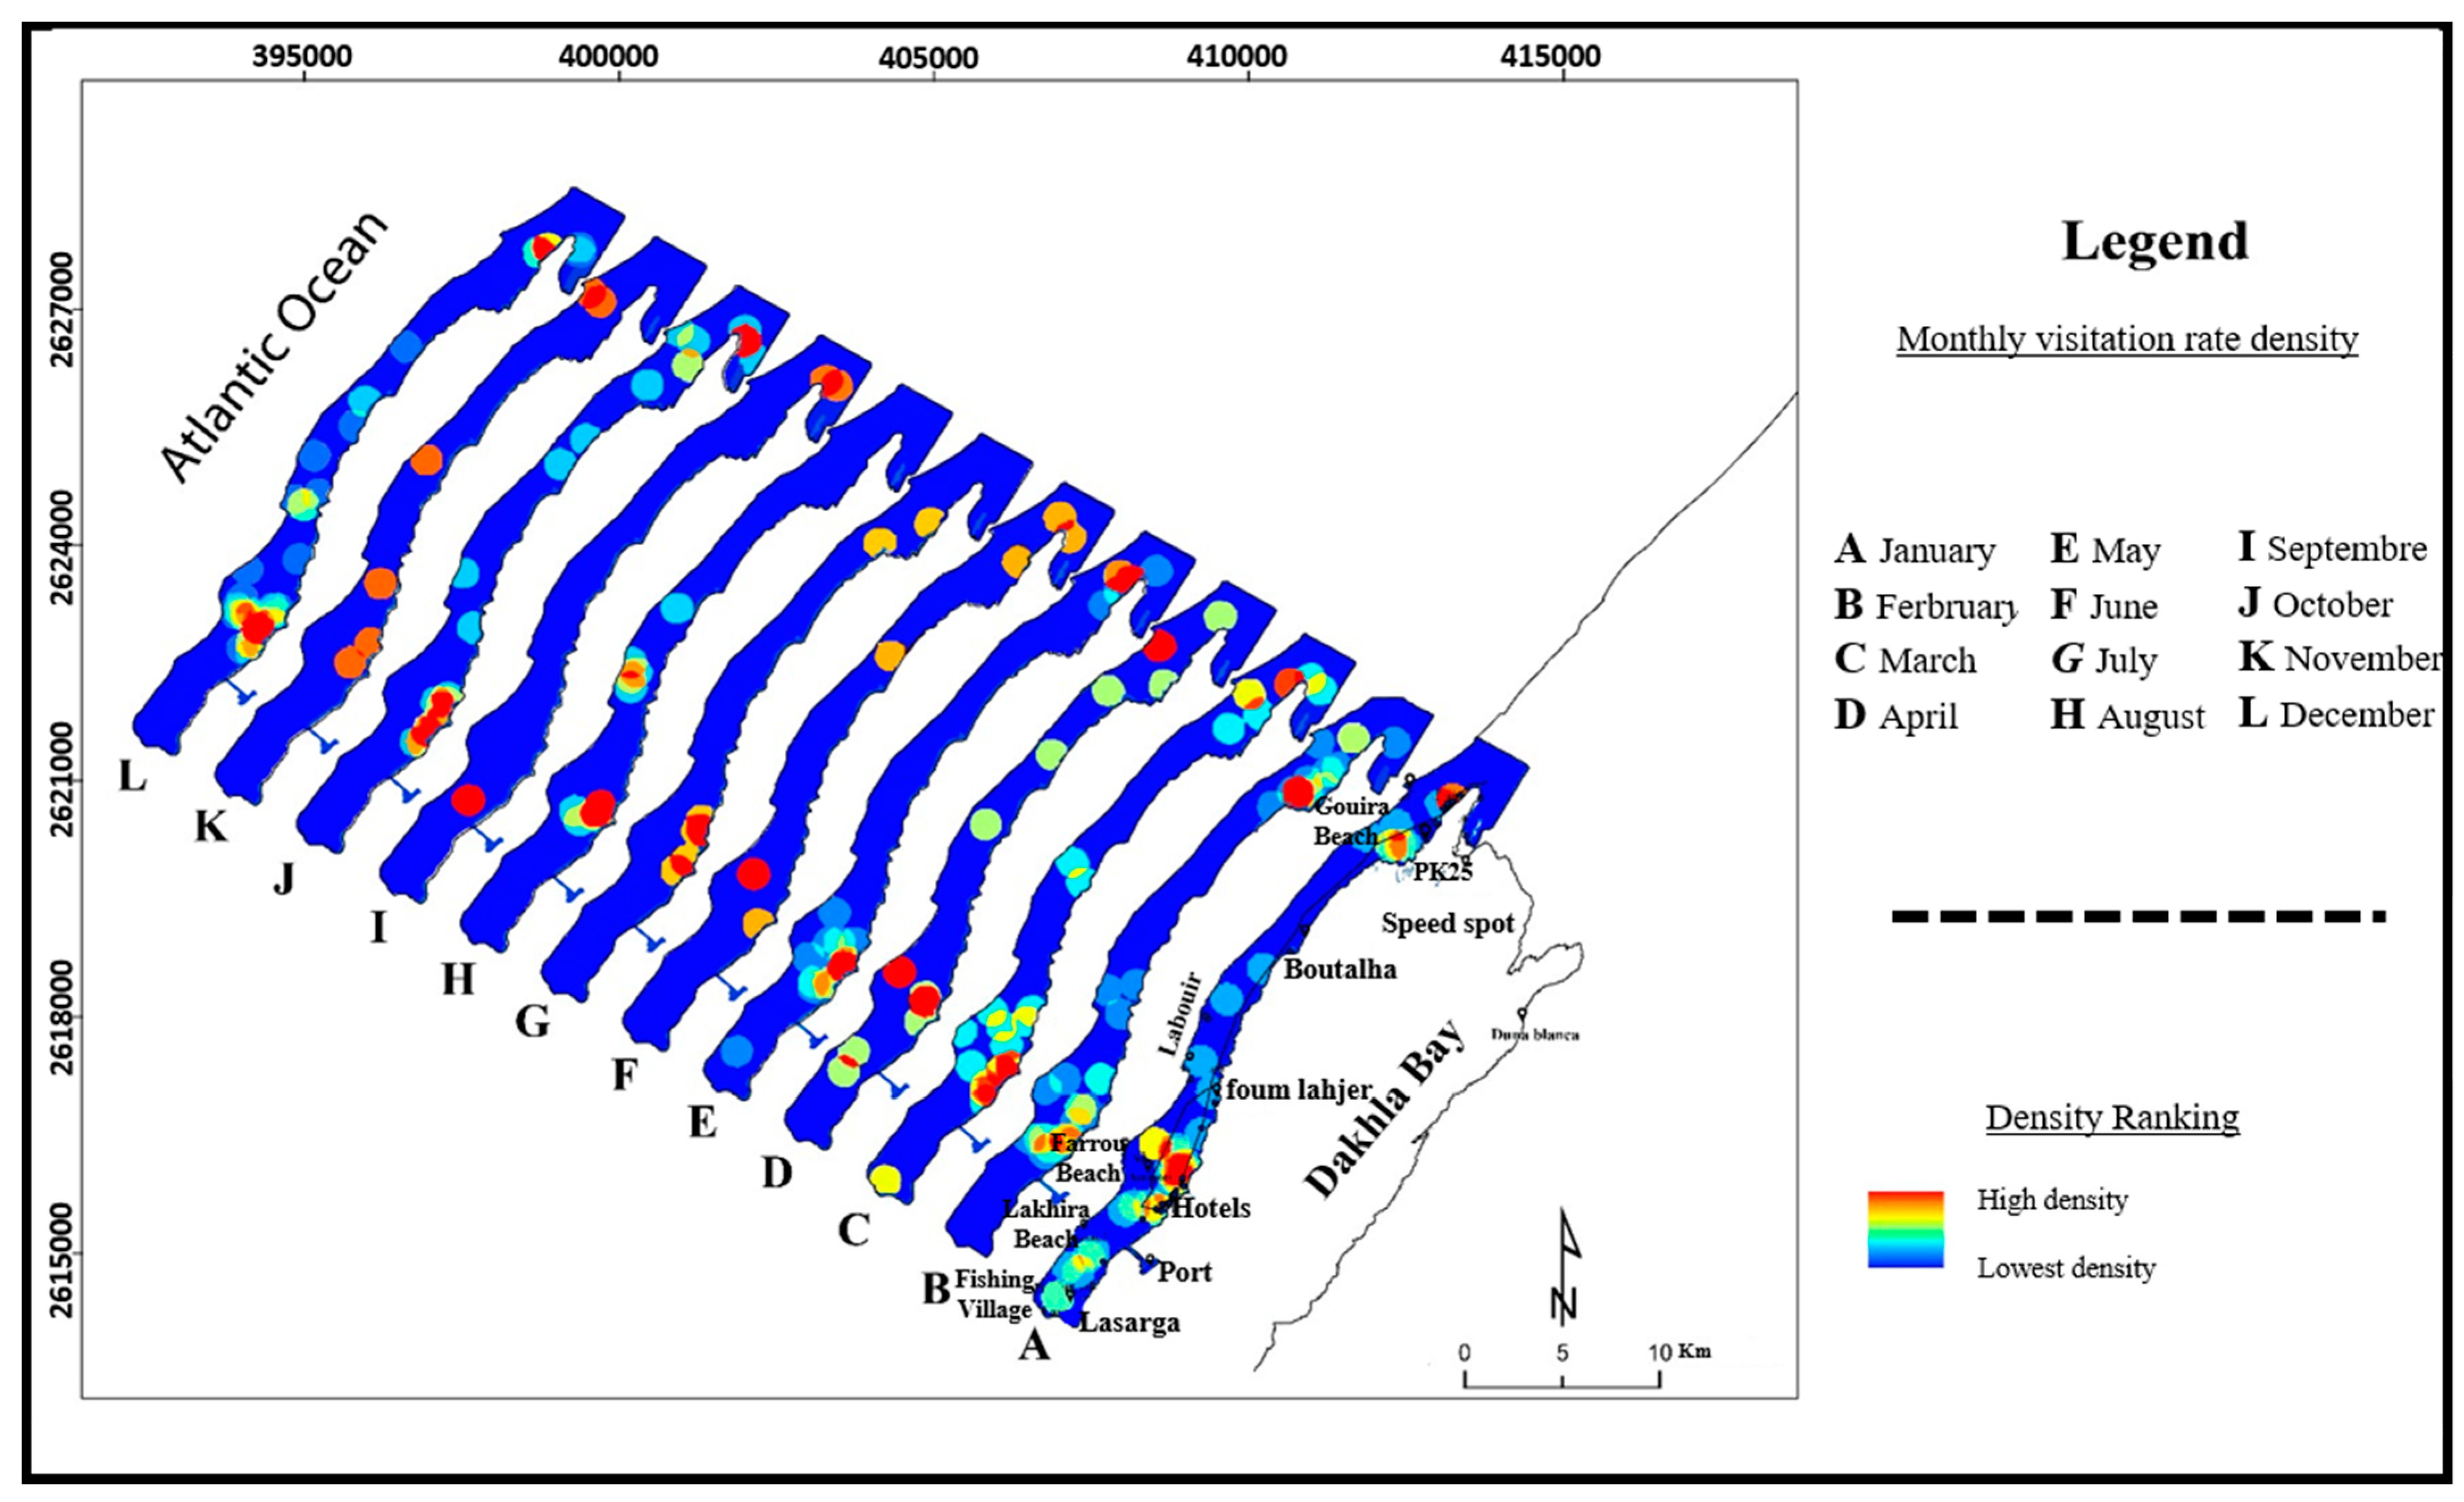
3.2. Monthly Visit Rate Mapping

A high concentration of visitors at a given location was illustrated by the average monthly visit rate density (Figure 5). The two hotspots already noted in the first annual visit rate maintained their importance over twelve months. Some medium- and low-visit densities were characterized the central part of the study area. A graphic representation of the monthly visit rates (Figure 6) showed the variations in the monthly values for each calendar month between 2005 and 2017. The monthly visit rate was exceptionally high in the winter season, ranging from 5.38 to 3.38 PUD per month. The highest values were recorded in December (5.38 PUD per month). From April to September, the visitor rates fluctuated, with the average values ranging from 3.54 to 1.54 PUD per month. October was the second-highest month, with visit rate values of 4 PUD per month, followed by a drop to 0.62 PUD per month in November.

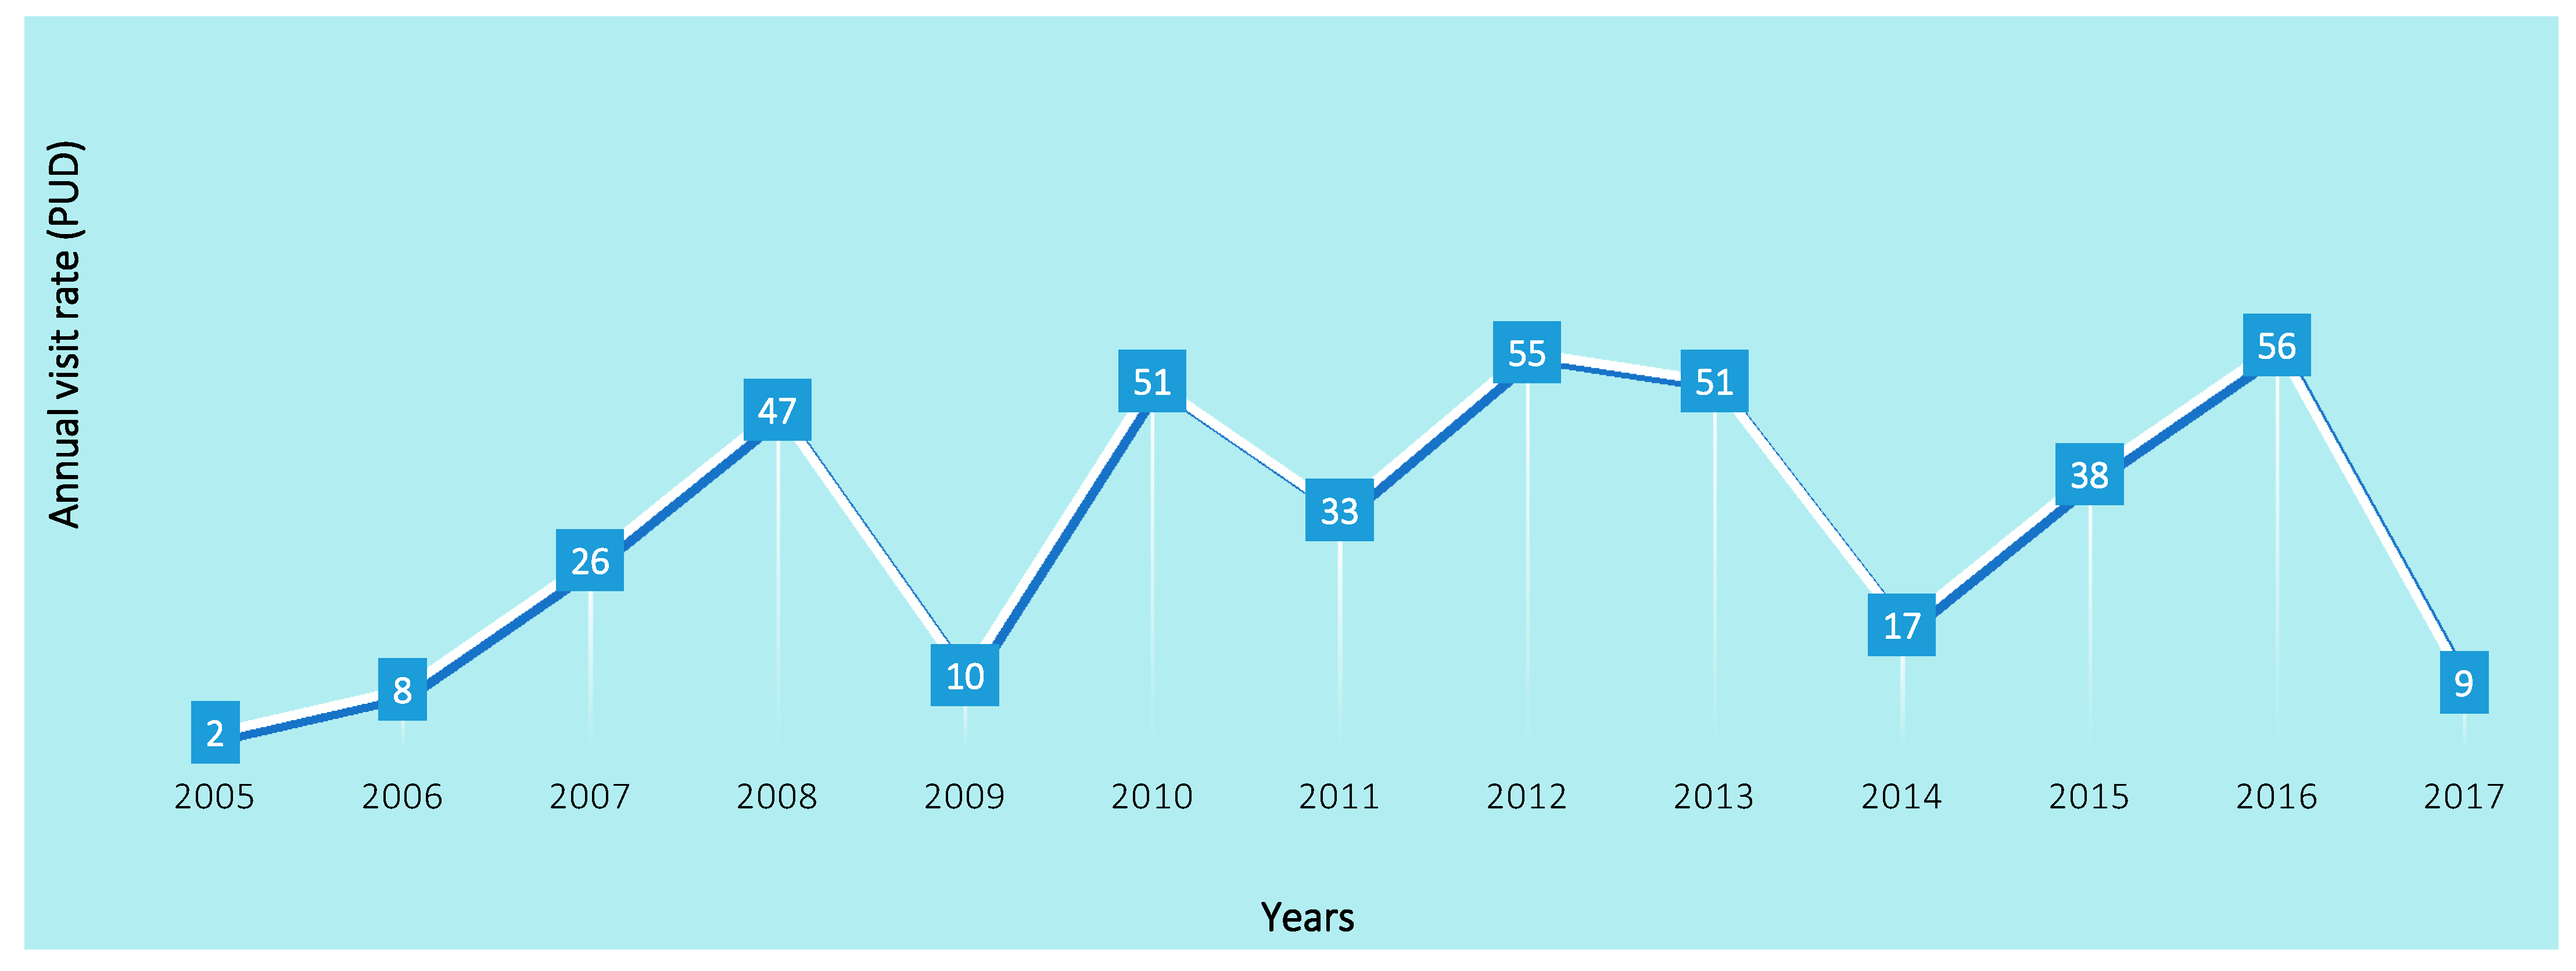
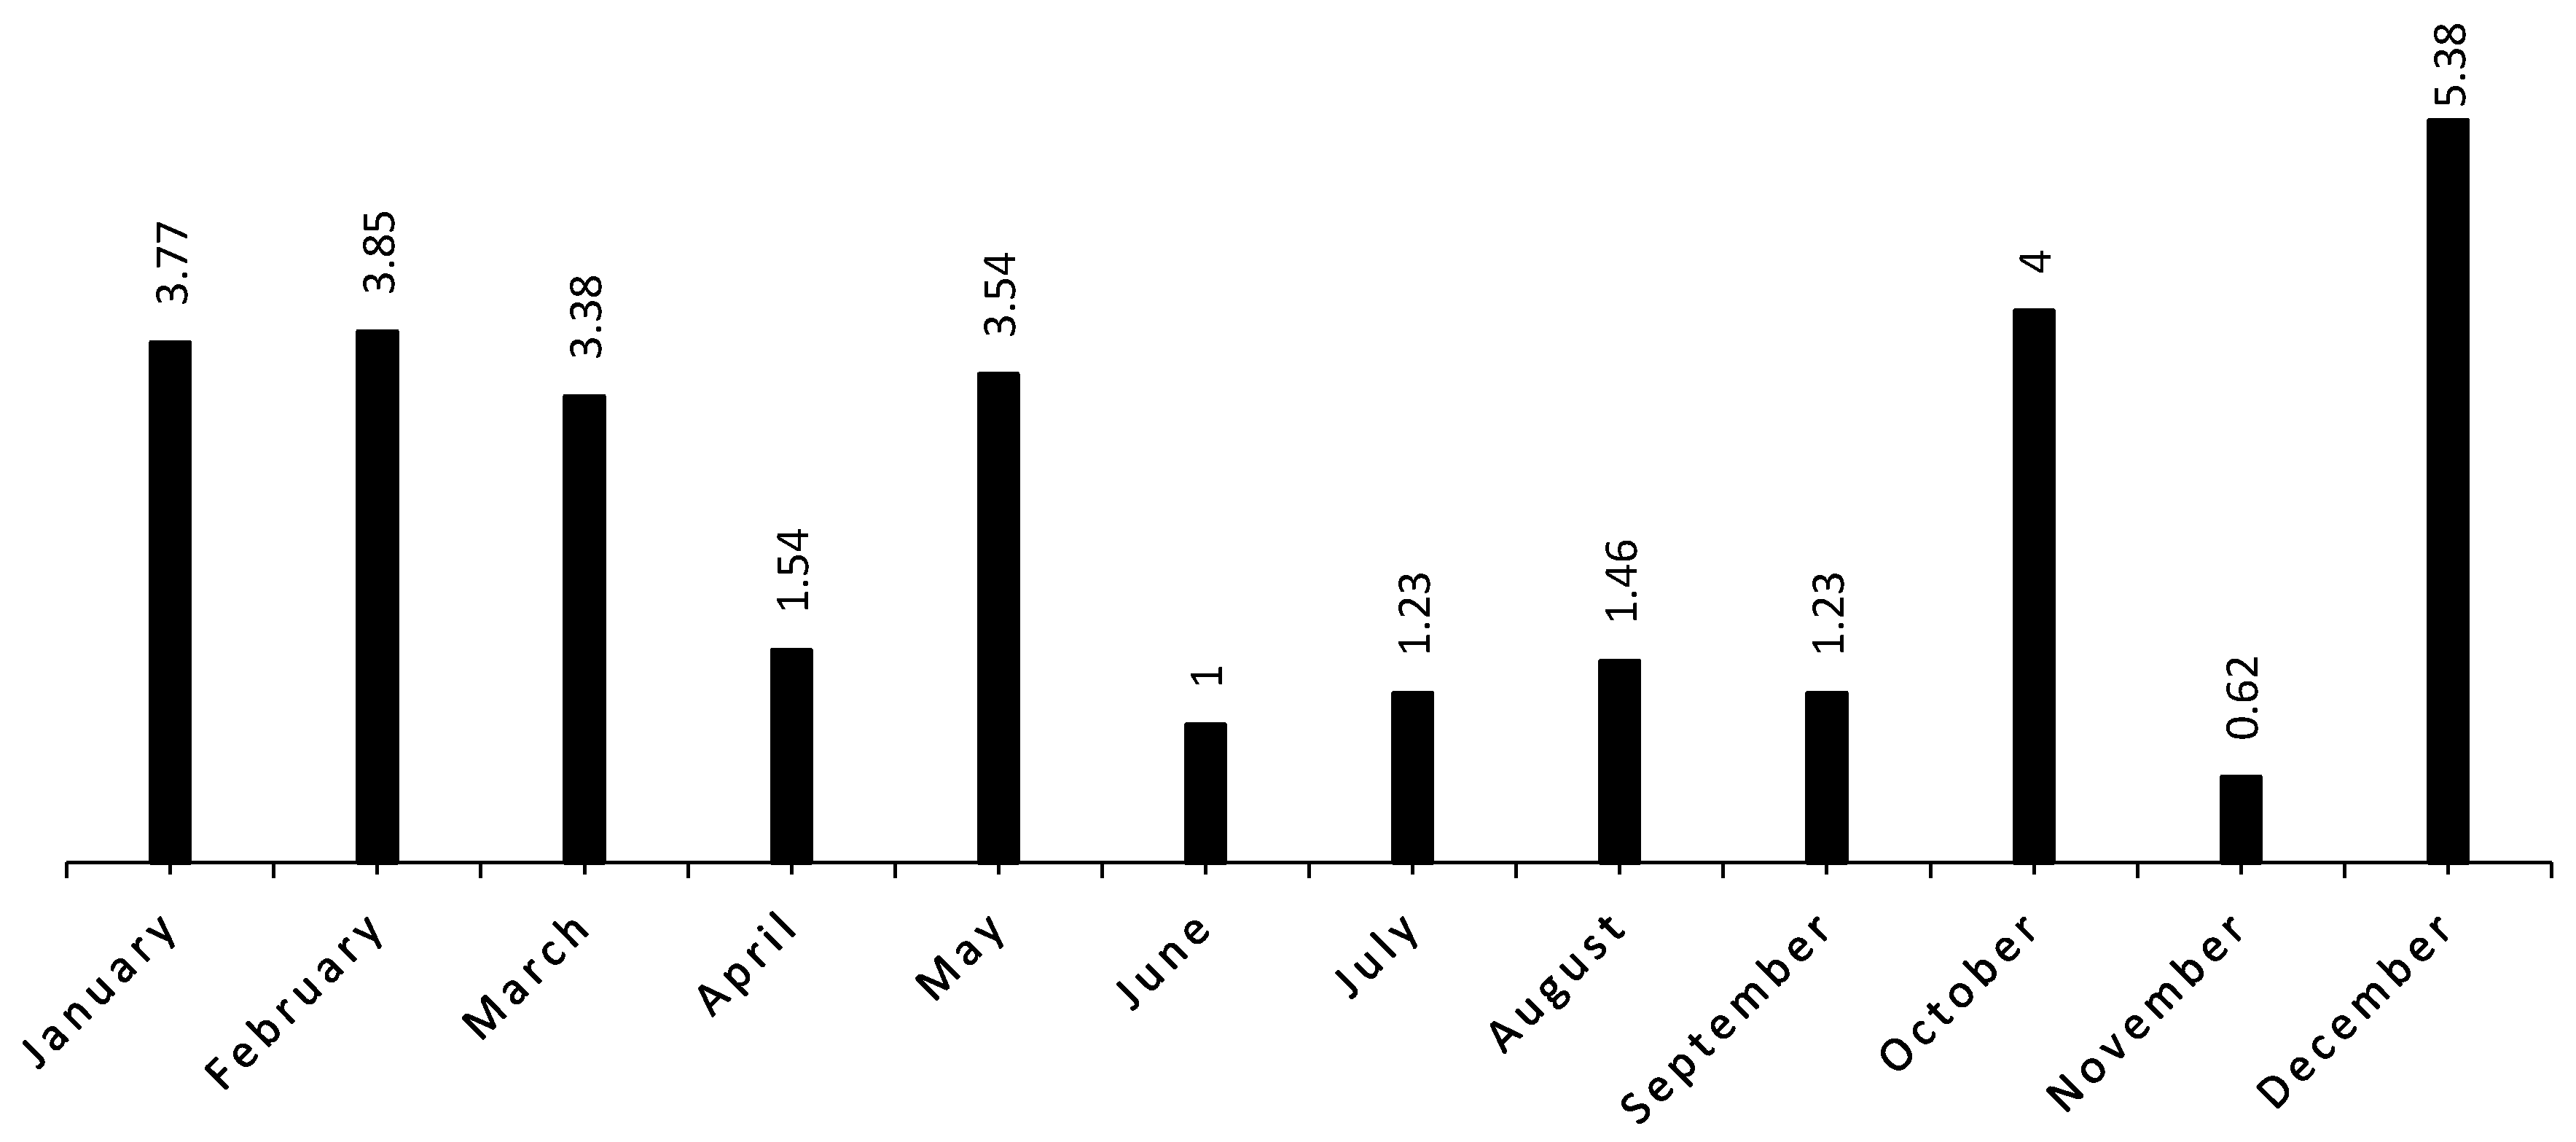
3.3. Annual Visit Rate Estimation

Dakhla continues to grow as a destination compared to the current estimated annual visit rate, with an increase of 2% (PUD YR AVG = 28, 84 PUD per year, and PUD EST = 30, 56 PUD per year). The spatial distribution for future visits, as estimated by InVEST, is spread evenly across Dakhla Bay. The estimated visit rate (PUD EST) varies from 0.48 to −0.01 (Figure 7), with one hotspot located in the coastal zone of Dakhla City (inner part), where the values range from 0.08 to 0.48 PUD per year. Additionally, a moderate visit rate extends throughout the two coastal extremities of the study area. In contrast, a low average visit rate marks the central and outer parts. However, the southern part near Lasarga will experience a drop in the average visit rate with negative values (−0.01 PUD per year). The estimate shows no grid cells with zero PUD values. The average number of photo-user days (PUD YR AVG) per year reflects the current visit rate estimate for a given place; the calculation of this parameter is based on the Predictor Table, a CSV table that contains the GIS layers (natural environment data and features that influence the visit patterns; see Methodology) to use as predictors for the xipxip values (see the regression equation). Therefore, the PUD EST parameter is calculated from the visit rate already estimated in conjunction with the Scenario Predictor Table; this is also a CSV table containing GIS layers (natural environment data and features that influence the visit patterns, plus future cultural and tourist projects); this means that the two parameters are comparable.

4. Discussion

In this study, the social preferences for the CESs were identified and mapped in Dakhla Bay, providing an essential assessment and an overview of the tourism dynamics and hotspots that are intangible and difficult to measure and often overlooked. CESs are among the most important values that people have always associated with nature [13], so they are critical. CES assessments usually focus on the recreational and aesthetic values that benefit the local population and create tourist opportunities, which is the case in the present study area. Since Dakhla is a coastal city, these values are strongly related to the ocean, the bay, and the beaches. These areas offer a wide choice of recreational opportunities in beautiful landscapes and beautiful beaches that attract residents and visitors. This increases the pressure along the city’s coastline and significantly increases the socioeconomic vulnerability. The results of this study confirm this essential factor of proximity to the bay and ocean in terms of CES preferences, since most areas with a high visit rate are located and concentrated around the shoreline of the bay, i.e., the two hotspots located in the outer and inner parts of Dakhla Bay, where their proximity to the sea is a significant factor. This can be explained by the bay’s cultural infrastructure linked to nautical and maritime activities, such as ports; lighthouses; and water sports (kite surfing, windsurfing, and kayaking, among others), and the strong cultural identity of fishing communities.

4.1. InVEST Results and Dakhla Tourism Surveys

Looking back over time, it appears that the bay has been subject to several changes since 2001, including PK 15 Beach, where there were concerns that it was being used as a campsite by European tourists. On 15 January 2005, the bay was classified as a biological and ecological interest (SIBE) by the International Convention on Wetlands [30]. A water sports site, Dakhla Attitude, was also established about thirty kilometers further down the lagoon in 2006; this was the primary catalyst for the rise in tourism. The Dakhla annual festival has also contributed to the region’s rise in popularity. Subsequently, several tourist infrastructures have been established, and the fourth annual half windsurfing marathon was held in Dakhla Bay in 2007.
However, the sustained dynamism that characterized the tourism activity in those years was interrupted in 2009. The global economic recession contributed to a substantial decrease of 5.1%, which affected the study area. Growth in the tourism sector resumed in 2010, a colorful year with activities that showcased the dynamism and development in the Dakhla region. Tourist activity increased steadily with some fluctuations until 2017, when the visitor rates were no longer consistent with reality. This was also the case in the northwest of Portugal [28]. For that region, the model has been underestimating the visitor rates since 2011. The cause could be a possible model constraint associated with only using Flickr uploads as the data source. Other social media platforms such as Instagram (2010) and Facebook (2004) were emerging.
Nevertheless, it is acknowledged that Flickr users and photo uploads do not necessarily represent the entire visitor population to a region. This may result in defects in this evaluation method. However, other more traditional methodologies, such as surveys, also have shortcomings [31,34,35]; for example, incomplete and unsatisfactory responses to survey questions can falsify survey results [35].

4.2. Analysis of Landscape Attributes

Coastlines and estuaries offer various opportunities for water sports and recreational activities [36]. Dakhla attracts visitors year-round due to its mild climate and natural landscapes that can be enjoyed during any season; this accounts for the instability in the monthly visit rates throughout the 12 months (Figure 7). However, a high concentration in the monthly visit rate stands out in the winter season. Thousands of camping cars arrive from all over Europe in December for the La Saharienne race in February and the Dakhla Kitesurf World Cup in March. The InVEST recreation model identified the coastal recreation services as significant contributors to recreation in Dakhla Bay, accounting for >70% of the total visits. The same result was reported for the northwest of Portugal [28]. Campsites are the primary landscape attributes in this study area. They influence society’s leisure choices; Dakhla campsites are generally used by European tourists, as long as they are located by the sea or Bayfront and are clean and quiet, ensuring complete security combined with cost-effectiveness. Campsites are the most crucial predictors of visit rates, followed by beaches and attraction sites such as the region’s recreational facilities, highlighting the importance of recreational activities in the area. Visitors generally choose recreation areas nearby [37,38,39], evidenced by the fact that artificial areas and parks are among the best predictors of visit rates. All the high-value PUD cells were located along the coast and campsites in or near Dakhla City, where the region’s coasts and campsites are located (Figure 3). The aerodrome and roads are negatively correlated with the visit rates. This is due to the Sahara, which requires the use of specialist transport. The same is true for Northwest Portugal [28]. The coastal landscape attributes such as beaches and estuaries are the most significant contributors to the visit rates.
The Pearson’s correlation produced non-significant statistics with less encouraging values; this was mainly due to the model’s results (low values ranging from 0 PUD to 0.72 PUD). The study area’s delimitation is a significant factor. The Dakhla Bay region is a much smaller space than other regions that were similarly studied [28] but had neither the spatial criterion nor the popularity with tourists. The culture of photo-sharing on social networks that differs from one region to another also plays a significant role. This generates a strong presence on photo-upload platforms. Further analyses are not possible without these primary criteria of space and photo-sharing cultures, so we were limited in the Pearson’s correlation, which provided an approximate idea of the predictors that contributed to the visit rates.

4.3. Decision-Making and Management Implications

This study revealed the importance of coastal cultural ecosystems and their role in providing nature-associated recreational opportunities [5,10,34]. Although tourism is one of the main activities contributing to the GDP, tourist activities are also one of the leading causes of land degradation [31], so a balance needs to be found between economic growth and cultural ecosystems’ health. The ES approach can be a valuable tool for coastal management planning, providing simple outputs and empirical data to assist decision-makers and engage stakeholders. With modeling and visualization tools such as InVEST, this type of approach to decision-making involves various types of expertise and effort and can facilitate and improve decision-making, which can also solve the sustainability problems. These methods have many advantages, such as providing a better view of the areas and hotspots and prioritizing actions to protect ecosystems. Our assessment of the recreational activity patterns in Dakhla Bay is an essential step towards better decision-making in terms of both ecosystem management and land use planning [6]. This study is one of few studies that have been carried out in this area. However, they are essential for cities such as Dakhla, a highly successful tourist industry, in the future. Other areas may adopt this new type of approach to collecting and analyzing the visiting data and enable tour operators to benefit from the results by diversifying their offers and investing in different, less well-known, or less-explored locations in the region.

5. Conclusions

This study demonstrated that coastal ecosystems are essential providers of recreation and tourism opportunities in Southern Morocco, particularly Dakhla Bay, positively correlated with the increase in tourism in the Dakhla region. It also demonstrated the importance of analyzing geospatial data as a low-cost method for informing the decision-making process. The InVEST results across Dakhla Bay showed a visit rate imbalance, with two hotspots located in the outer and inner parts of Dakhla Bay. An extended area was marked by the instability of low-value, moderate-value, and non-value visit rates, the highest value in December and the lowest in April. Although the InVEST visitor outputs underestimated the real visitor numbers experienced in 2017, as assessed by actual tourism investigations, the estimate for future visit rates showed that Dakhla will continue to grow, increasing by 2% (see the annual visit rate estimation section). A strong balance was also indicated with the presence of a single hotspot. This study demonstrated how ecosystems such as coastal areas contribute differently to recreation. It also highlighted the importance of local ES assessments rather than continental or global approaches, which are more commonly used in this type of study; the local approach also provides more up-to-date information and ES spatial awareness and takes into account the local society. For local or regional government agencies (e.g., the National Tourism Delegation), the use of publicly shared images remains a wise use of valuable resources. When photo data provide an accurate measure of visitations, these new techniques could provide the world’s tourism department and managers with valuable, finer-scale information in a fraction of the time, effort, and cost of the traditional methods, allowing the possibility of measuring and tracking the recreational values of different types of recreational lands. Having free and open-source software (InVest model) represents an optimal option for land managers, allowing them to extract public Flicker data and calculate the PUD for any place in the world, using accessible data (GIS shapefile) to define their areas of interest. Computation times depend on the size and extent of the study area but typically range from seconds to minutes. In addition, land managers could use crowd-sourced photographs data to track visitor use over time and, therefore, conclude the seasonal and temporal visitation patterns. Knowing where visitors travel from during specific periods of the year would allow land managers to provide relevant information about the transportation options and programs tailored to the visitor groups that arrive during that season.

Author Contributions

All authors contributed to the conceptualization. Data preparation and formal analysis: I.M., Y.K., I.B., H.R., and M.M. (Mehdi Maanan). Methodology, writing, and editing: I.B., Q.B.P., A.K., and M.M. (Mohamed Maanan). Review and editing: all authors. All authors have read and agreed to the published version of the manuscript.

Funding

This research received no external funding.

Institutional Review Board Statement

Not applicable.

Informed Consent Statement

Not applicable.

Acknowledgments

The authors gratefully acknowledge Katy Zhou (Environments, Assistant Editor) and two anonymous reviewers for their scientific suggestions and constructive comments. The authors wish to thank El Khattat Yanja, President of the Dakhla Oued Ed-Dahab Regional Council, and Taoufik El Balla for the logistical support during the field missions.

Conflicts of Interest

The authors declare no conflict of interest.

References

  1. Costanza, R.; d’Arge, R.; de Groot, R.; Farber, S.; Grasso, M.; Hannon, B.; Limburg, K.; Naeem, S.; O’Neill, R.V.; Paruelo, J.; et al. The value of the world’s ecosystem services and natural capital. Nature 1997, 387, 253–260. [Google Scholar] [CrossRef]
  2. Fish, R.; Church, A.; Winter, M. Conceptualising cultural ecosystem services: A novel framework for research and critical engagement. Ecosyst. Serv. 2016, 21, 208–217. [Google Scholar] [CrossRef] [Green Version]
  3. Mace, G.; Masundire, H.; Baillie, J. Biodiversity. In Ecosystems and Human Wellbeing: Current State and Trends; Island Press: Washington, DC, USA, 2005; Volume 1, pp. 77–122. [Google Scholar]
  4. Chan, K.M.A.; Guerry, A.D.; Balvanera, P.; Klain, S.; Satterfield, T.; Basurto, X.; Bostrom, A.; Chuenpagdee, R.; Gould, R.K.; Halpern, B.S.; et al. Where are Cultural and Social in Ecosystem Services? A Framework for Constructive Engagement. BioScience 2012, 62, 744–756. [Google Scholar] [CrossRef]
  5. Goodchild, M.F. Citizens as sensors: The world of volunteered geography. Geojournal 2007, 69, 211–221. [Google Scholar] [CrossRef] [Green Version]
  6. Maes, J.; Brat, L.; Jax, K.; Hutchins, M.; Furman, E.; Termansen, M.; Luque, S.; Williams, M.L.P.C.C.R.; Volk, M.; Lautenbach, S.; et al. A Spatial Assessment of Ecosystem Services in Europe: Methods, Case Studies and Policy Analysis—Phase 1; PEER Report No. 3; Partnership for European Environmental Research: Copenhagen, Denmark, 2011. [Google Scholar]
  7. Santarém, F.; Saarinen, J.; Brito, J.C. Assessment and prioritization of cultural ecosystem services in the Sahara-Sahelian region. Sci. Total Environ. 2021, 777, 146053. [Google Scholar] [CrossRef]
  8. Lee, J.-H.; Park, H.-J.; Kim, I.; Kwon, H.-S. Analysis of cultural ecosystem services using text mining of residents’ opinions. Ecol. Indic. 2020, 115, 106368. [Google Scholar] [CrossRef]
  9. Milcu, A.I.; Hanspach, J.; Abson, D.; Fischer, J. Cultural Ecosystem Services: A Literature Review and Prospects for Future Research. Ecol. Soc. 2013, 18. [Google Scholar] [CrossRef] [Green Version]
  10. Guo, Z.; Zhang, L.; Li, Y. Increased Dependence of Humans on Ecosystem Services and Biodiversity. PLoS ONE 2010, 5, e13113. [Google Scholar] [CrossRef]
  11. Tenerelli, P.; Demšar, U.; Luque, S. Crowdsourcing indicators for cultural ecosystem services: A geographically weighted approach for mountain landscapes. Ecol. Indic. 2016, 64, 237–248. [Google Scholar] [CrossRef] [Green Version]
  12. Liquete, C.; Piroddi, C.; Macías, D.; Druon, J.-N.; Zulian, G. Ecosystem services sustainability in the Mediterranean Sea: Assessment of status and trends using multiple modelling approaches. Sci. Rep. 2016, 6, 34162. [Google Scholar] [CrossRef] [Green Version]
  13. Langemeyer, J.; Calcagni, F.; Baró, F. Mapping the intangible: Using geolocated social media data to examine landscape aesthetics. Land Use Policy 2018, 77, 542–552. [Google Scholar] [CrossRef]
  14. Clemente, P.; Calvache, M.; Antunes, P.; Santos, R.; Cerdeira, J.O.; Martins, M.J. Combining social media photographs and species distribution models to map cultural ecosystem services: The case of a Natural Park in Portugal. Ecol. Indic. 2019, 96, 59–68. [Google Scholar] [CrossRef]
  15. Klain, S.C.; Satterfield, T.A.; Chan, K.M.A. What matters and why? Ecosystem services and their bundled qualities. Ecol. Econ. 2014, 107, 310–320. [Google Scholar] [CrossRef]
  16. Iniesta-Arandia, I.; García-Llorente, M.; Aguilera, P.A.; Montes, C.; Martín-López, B. Socio-cultural valuation of ecosystem services: Uncovering the links between values, drivers of change, and human well-being. Ecol. Econ. 2014, 108, 36–48. [Google Scholar] [CrossRef]
  17. Oteros-Rozas, E.; Martin-Lopez, B.; González, J.A.; Plieninger, T.; López, C.A.; Montes, C. Socio-cultural valuation of ecosystem services in a transhumance social-ecological network. Reg. Environ. Chang. 2013, 14, 1269–1289. [Google Scholar] [CrossRef]
  18. Norton, L.; Inwood, H.; Crowe, A.; Baker, A. Trialling a method to quantify the ‘cultural services’ of the English landscape using Countryside Survey data. Land Use Policy 2012, 29, 449–455. [Google Scholar] [CrossRef] [Green Version]
  19. Martínez-Harms, M.J.; Balvanera, P. Methods for mapping ecosystem service supply: A review. Int. J. Biodivers. Sci. Ecosyst. Serv. Manag. 2012, 8, 17–25. [Google Scholar] [CrossRef]
  20. Burkhard, B.; Kroll, F.; Nedkov, S.; Müller, F. Mapping ecosystem service supply, demand and budgets. Ecol. Indic. 2012, 21, 17–29. [Google Scholar] [CrossRef]
  21. Heipke, C. Crowdsourcing geospatial data. ISPRS J. Photogramm. Remote. Sens. 2010, 65, 550–557. [Google Scholar] [CrossRef]
  22. Sonter, L.J.; Watson, K.B.; Wood, S.A.; Ricketts, T.H. Spatial and Temporal Dynamics and Value of Nature-Based Recreation, Estimated via Social Media. PLoS ONE 2016, 11, e0162372. [Google Scholar] [CrossRef] [Green Version]
  23. Hamstead, Z.A.; Fisher, D.; Ilieva, R.T.; Wood, S.A.; McPhearson, T.; Kremer, P. Geolocated social media as a rapid indicator of park visitation and equitable park access. Comput. Environ. Urban Syst. 2018, 72, 38–50. [Google Scholar] [CrossRef]
  24. Richards, D.R.; Tuncer, B. Using image recognition to automate assessment of cultural ecosystem services from social media photographs. Ecosyst. Serv. 2018, 31, 318–325. [Google Scholar] [CrossRef]
  25. Park, S.B.; Kim, J.; Lee, Y.K.; Ok, C.M. Visualizing theme park visitors’ emotions using social media analytics and geospatial analytics. Tour. Manag. 2020, 80, 104127. [Google Scholar] [CrossRef]
  26. Xu, X.; Li, Y. The antecedents of customer satisfaction and dissatisfaction toward various types of hotels: A text mining approach. Int. J. Hosp. Manag. 2016, 55, 57–69. [Google Scholar] [CrossRef]
  27. Wood, S.A.; Guerry, A.D.; Silver, J.M.; Lacayo, M. Using social media to quantify nature-based tourism and recreation. Sci. Rep. 2013, 3, 02976. [Google Scholar] [CrossRef]
  28. Keeler, B.L.; Wood, S.A.; Polasky, S.; Kling, C.L.; Filstrup, C.T.; Downing, J.A. Recreational demand for clean water: Evidence from geotagged photographs by visitors to lakes. Front. Ecol. Environ. 2015, 13, 76–81. [Google Scholar] [CrossRef] [Green Version]
  29. Cunha, J.; Elliott, M.; Ramos, S. Linking modelling and empirical data to assess recreation services provided by coastal habitats: The case of NW Portugal. Ocean Coast. Manag. 2018, 162, 60–70. [Google Scholar] [CrossRef]
  30. Salas-Olmedo, M.H.; Moya-Gómez, B.; García-Palomares, J.C.; Gutiérrez, J. Tourists’ digital footprint in cities: Comparing Big Data sources. Tour. Manag. 2018, 66, 13–25. [Google Scholar] [CrossRef] [Green Version]
  31. Purves, R.; Hollenstein, L. Exploring place through user-generated content: Using Flickr to describe city cores. J. Spat. Inf. Sci. 2010, 1, 21–48. [Google Scholar] [CrossRef]
  32. RAMSAR. Convention on Wetland RAMSAR; RAMSAR: Gland, Switzerland, 2005; p. 323. [Google Scholar]
  33. Sharp, E.R.; Tallis, H.T.; Ricketts, T.; Guerry, A.D.; Wood, S.A.; Chaplin-Kramer, R.; Nelson, E.; Ennaanay, D.; Wolny, S.; Olwero, N.; et al. InVEST Guide Natural Capital Project; The Natural Capital Project, Stanford Unviersity: Stanford, CA, USA, 2018. [Google Scholar]
  34. Guerry, A.D.; Ruckelshaus, M.H.; Arkema, K.K.; Bernhardt, J.R.; Guannel, G.; Kim, C.-K.; Marsik, M.; Papenfus, M.; Toft, J.E.; Verutes, G.; et al. Modeling benefits from nature: Using ecosystem services to inform coastal and marine spatial planning. Int. J. Biodivers. Sci. Ecosyst. Serv. Manag. 2012, 8, 107–121. [Google Scholar] [CrossRef] [Green Version]
  35. Clark, R.N.; Stankey, G.H. The Recreation Opportunity Spectrum: A Framework for Planning, Management, and Research; Technical Report No. PNW-98; U.S. Department of Agriculture: Washington, DC, USA, 1979.
  36. Chung, M.G.; Kang, H.; Choi, S.-U. Assessment of Coastal Ecosystem Services for Conservation Strategies in South Korea. PLoS ONE 2015, 10, e0133856. [Google Scholar] [CrossRef] [Green Version]
  37. Mou, N.; Zheng, Y.; Makkonen, T.; Yang, T.; Tang, J.J.; Song, Y. Tourists’ digital footprint: The spatial patterns of tourist flows in Qingdao, China. Tour. Manag. 2020, 81, 104151. [Google Scholar] [CrossRef]
  38. Lee, Y.; Pennington-Gray, L.; Kim, J. Does location matter? Exploring the spatial patterns of food safety in a tourism destination. Tour. Manag. 2019, 71, 18–33. [Google Scholar] [CrossRef]
  39. Kling, C.L.; Phaneuf, D.J.; Zhao, J. From Exxon to BP: Has Some Number Become Better than No Number? J. Econ. Perspect. 2012, 26, 3–26. [Google Scholar] [CrossRef] [Green Version]
Figure 1. Land cover and tourist areas.
Environments 08 00056 g001
Figure 2. Methodological approach.
Environments 08 00056 g002
Figure 3. Average annual visit rate per cell grid across Dakhla Bay (Sub figures (AC) are close ups of sections A,B,C in the main map).
Environments 08 00056 g003
Figure 4. Annual visit rate evolution in the period 2005–2017.
Environments 08 00056 g004
Figure 5. Monthly visit rate density.
Environments 08 00056 g005
Figure 6. Monthly average visit rate per photo-user days per month.
Environments 08 00056 g006
Figure 7. Annual visit rate estimation across Dakhla Bay.
Environments 08 00056 g007
Table 1. List of landscape features and respective data sources in the InVEST model.
PredictorsDescriptionSource
Land CoverCorrine Land Cover 2018, using the categories: Artificial, Agricultural, Forest and Semi-Natural, Wetlands, and Water Bodies Copernicus Open Access Hub (https://land.copernicus.eu/) (accessed on 6 April 2021)
BeachesBeaches, digitizedField measurement (mapping and data collection) 2018
Natural areasNatural areas (e.g., white dune)Field measurement (mapping and data collection) 2018
Attraction sitesAttraction, digitized (e.g., hotels, oyster farms, and wind-surf sports)Field measurement (mapping and data collection) 2018
Camp SitesCampsites, digitizedField measurement (mapping and data collection) 2018
ParksSemi-natural areas (e.g., green urban areas)Field measurement (mapping and data collection) 2018
AerodromeAerodrome addressesField measurement (mapping and data collection) 2018 https://www.openstreetmap.org (accessed on 6 April 2021)
Accessibility (Roads Network)Network of primary, secondary, and highwaysField measurement (mapping and data collection) 2018 https://www.openstreetmap.org (accessed on 6 April 2021)
Future Tourism PointsFuture tourism and cultural projects that will be realizedhttp://www.sahara-developpement.com/ (accessed on 6 April 2021) Tourism delegation of Dakhla city
Table 2. Pearson’s correlation quantifying the relationship between the visit rates and landscape features (* p < 0.05 and ** p < 0.01). Gray shading indicates strong positive correlations (p ≥ 0.15).
Visit RateAttraction SiteCampsiteBeachesAerodromeRoadsParks
Visit rate1 Environments 08 00056 i001 Environments 08 00056 i002 Environments 08 00056 i003−0.0420.102 Environments 08 00056 i004
Attraction sites 10.5760.557−0.031 *−0.010 *0.018 *
Campsites 10.567−0.031 **−0.010 *0.018 *
Beaches 1−0.044 **0.1200.345
Aerodrome 1−0.082 **−0.013 *
Roads 10.245
Parks 1
Publisher’s Note: MDPI stays neutral with regard to jurisdictional claims in published maps and institutional affiliations.

