Article

Organic Wastes Amended with Sorbents Reduce N2O Emissions from Sugarcane Cropping

1
School of Agriculture and Food Science, The University of Queensland, St. Lucia, QLD 4072, Australia
2
Department of Agriculture and Fisheries, 203 Tor St, Toowoomba, QLD 4350, Australia
3
Australian Institute for Bioengineering and Nanotechnology, The University of Queensland, St. Lucia, QLD 4072, Australia
4
Department of Soil Science, Luiz de Queiroz College of Agriculture, University of São Paulo, Av. Padua Dias, 11, Piracicaba, São Paulo CEP 13418-900, Brazil
5
Department of Environment and Science, The University of Queensland, Brisbane, QLD 4102, Australia
6
School of Environment and Science/Australian Rivers Institute, Griffith University, Nathan, QLD 4111, Australia
7
Department of Natural Science, International Christian University, 3-10-2 Osawa, Mitaka, Tokyo 181-8585, Japan
*
Author to whom correspondence should be addressed.
Submission received: 11 June 2021 / Revised: 30 July 2021 / Accepted: 3 August 2021 / Published: 10 August 2021
(This article belongs to the Special Issue Restorative Agriculture)

Abstract

:
Nutrient-rich organic wastes and soil ameliorants can benefit crop performance and soil health but can also prevent crop nutrient sufficiency or increase greenhouse gas emissions. We hypothesised that nitrogen (N)-rich agricultural waste (poultry litter) amended with sorbents (bentonite clay or biochar) or compost (high C/N ratio) attenuates the concentration of inorganic nitrogen (N) in soil and reduces emissions of nitrous oxide (N2O). We tested this hypothesis with a field experiment conducted on a commercial sugarcane farm, using in vitro incubations. Treatments received 160 kg N ha−1, either from mineral fertiliser or poultry litter, with additional N (2–60 kg N ha−1) supplied by the sorbents and compost. Crop yield was similar in all N treatments, indicating N sufficiency, with the poultry litter + biochar treatment statistically matching the yield of the no-N control. Confirming our hypothesis, mineral N fertiliser resulted in the highest concentrations of soil inorganic N, followed by poultry litter and the amended poultry formulations. Reflecting the soil inorganic N concentrations, the average N2O emission factors ranked as per the following: mineral fertiliser 8.02% > poultry litter 6.77% > poultry litter + compost 6.75% > poultry litter + bentonite 5.5% > poultry litter + biochar 3.4%. All emission factors exceeded the IPCC Tier 1 default for managed soils (1%) and the Australian Government default for sugarcane soil (1.25%). Our findings reinforce concerns that current default emissions factors underestimate N2O emissions. The laboratory incubations broadly matched the field N2O emissions, indicating that in vitro testing is a cost-effective first step to guide the blending of organic wastes in a way that ensures N sufficiency for crops but minimises N losses. We conclude that suitable sorbent-waste formulations that attenuate N release will advance N efficiency and the circular nutrient economy.

1. Introduction

Sugarcane, a giant perennial C4 grass, is one of the fastest growing terrestrial plants and a major global commodity [1]. Sugarcane plays a key role in the tropical bioeconomy, supplying fuel and biomaterials. However, a limitation to sustainable sugarcane production is its N footprint. Globally, only 50% of N fertiliser is used by sugarcane crops, with as little as 10–30% in main producer countries [2]. Nitrogen losses from sugarcane soils occur via leaching and run-off [3,4], ammonia volatilisation [5] and nitrous oxide (N2O) emissions [6,7,8,9,10,11].
Nitrous oxide losses from agricultural soils are in the global spotlight, as they dominate the estimated 7.3 Tg N2O-N of annual anthropogenic emissions [12]. It is estimated that 40% of human induced N2O emissions originate from manures, mineral fertilisers and crop residues [13]. Emissions of N2O accelerated significantly between 1998 and 2016, demonstrating that the current IPCC Tier 1 Emissions Factor underestimates N2O emissions, with recent evidence that exponential increases of N2O emissions occurs with increased N fertiliser use [14,15].
A second limitation to sustainable sugarcane production is soil deterioration, with a loss of physical, chemical and biological integrity. In mechanised high production systems, such as Australian sugarcane production, yields are stagnant or declining [16]. The need to improve soil health motivates some sugarcane growers to apply carbon-rich agricultural wastes, including crop residues, compost, and livestock manures [17]. However, there has been limited evaluation of the carbon (C) and N dynamics of these practices and the effects on N2O emissions remain uncertain.
The anticipated benefits of N-rich wastes include reducing fertiliser costs, lowering the environmental footprint inherent in mineral fertiliser production [18], recycling agricultural wastes [19,20], and boosting soil organic C [21]. While manures are considered as valuable nutrient sources [22], their substitution for mineral fertilisers does not necessarily entail environmental benefits when N losses are taken into consideration. Manure application can result in substantial N2O emissions that are driven by accelerated microbial transformations [23,24,25,26,27]. We hypothesise that N losses can be improved by blending or co-applying manures with sorbents (e.g., clays, biochar) or with less nutrient dense materials (e.g., high C/N composts) because adsorption and immobilisation of inorganic N (ammonium, nitrate) is fostered by an increased cation exchange capacity (CEC), the presence of labile carbon and the permeability of these materials [28,29]. Laboratory experimentation shows that blending manures (cattle, pig, poultry) and sorbents (vermiculite, bentonite) decreases N2O emissions by two-thirds compared to unamended manure [30] and reduces the fluxes of free ammonium as sorbents enable the exchangeable binding of this N cation [31]. A meta-analysis confirmed that biochar added to organic or mineral fertiliser reduced the N2O emissions on average by 54%, although the mechanisms remain unclear [32]. Blending municipal green waste compost with a high C/N ratio and feedlot manure decreased the N2O emissions by 64%, likely due to N immobilisation and a slowed decomposition rate [33]. Overall, these studies confirm that formulating N-rich materials with sorbents and/or low nutrient compost can improve N efficiency and reduce the N2O footprint.
While the knowledge base for N2O emissions from soils treated with mineral fertiliser is growing, the limited research on alternative N supplies prevents rigorous comparisons. We performed both a field experiment at a commercial sugarcane farm and in vitro incubations to advance the mechanistic understanding of N relations. Poultry litter was chosen for its high N content and availability in Australian sugarcane regions. Hypothesising that smaller extractable N pools translate to improved nitrogen use efficiency (NUE) through reduced gaseous losses, we amended poultry litter with sorbents (bentonite, biochar) or compost to (i) quantify N2O emissions from soil receiving different N sources and amendments, and (ii) compare emissions in a field setting and in vitro incubation.

2. Materials and Methods

2.1. Field Experiment

The field experiment was conducted on a commercial sugarcane farm at Maroochy River, south-east Queensland, Australia (26°34′ S, 153°00′ E). The field has been cultivated with sugarcane for ~80 years. The soil is a sandy light clay classified as Oxyaquic Hydrosol (Australian soil classification, [34]) and Gleysol (World Reference Base for Soil Resources, [35]). The subtropical climate has a mean daily maximum to minimum temperature of 31.1 to 19.8 °C in summer and 27.3 to 12.9 °C in winter, and a mean annual rainfall of 1467 mm (Bureau of Meteorology; Site 040861).

2.2. Poultry Litter and Amendments

Spent poultry litter consisting of faeces, feathers and eucalypt sawdust was obtained from a production shed that holds 60,000 broilers (located near Gatton, south-east Queensland). Poultry litter was collected soon after the birds were removed from the shed and was stored for eight weeks in light-impermeable containers which were kept at a temperature of 4 °C in order to maintain chemical properties [36]. Sodium bentonite was sourced from a mine near Miles, Australia (AMCOL Australia, North Geelong, Australia). Biochar was produced from greenwaste residues comprising shredded wood, sugarcane harvest and cardboard at heating temperatures between 400 and 600 °C and was stored in light-impermeable containers at room temperature until use. Compost was derived from public local green waste bins and stored exposed outdoors for 18 months.

2.3. Soil Analyses

Soil texture was analysed using a hydrometer [37]: ASTM 152H (John Morris Scientific, Willoughby, NSW, Australia). Soil bulk density was determined separately for rows and inter-rows at a depth of 10 cm using the core method [38]. Soil pH (H2O) and EC were quantified using Australian standard methods 4A1 and 3A1, respectively [39] using a commercially-available probe (TPS WP-81, Brendale, QLD, Australia).
CEC was quantified with unbuffered salt extraction [40]. Soil carbon (C) and N contents were determined by combustion [39], phosphorus (P) and potassium (K) contents with inductively coupled plasma optical emission spectrometry (ICP-OES) using a Perkin-Elmer instrument (DV4300, OH, USA. Concentrations of ammonium (NH4+) and nitrate (NO3) were quantified using 1 M KCl extraction (1:2 soil:solution ratio) and colorimetric analyses [41,42] using a spectrophotometer (Powerwave XS, Bio-Tek, Winooski, VT, USA). Microbial biomass N was determined via chloroform fumigation-extraction [43]. Physical and chemical properties of soil, manure and amendments are presented in Supplementary Tables S1 and S2.

2.4. Experimental Design

The experiment was conducted over 280 days, from 17 December 2014 to 23 September 2015, during a 6th ratoon sugarcane cycle. The row spacing was 1.65 m and the soil surface was covered by a sugarcane trash blanket obtained from the previous harvest, with a dry weight equivalent to 14 t ha−1. Six treatments, replicated three times, were placed using a randomised block design in sections of the field that had received no fertiliser or other nutrient inputs in the year preceding the experiment. Treatments were C = control no N (no N input), UA (urea); PL (poultry litter); PL + BE (poultry litter + bentonite), PL + BC (poultry litter + biochar), PL + CO (poultry litter + compost).
Each experimental plot was 6.6 m wide and covered four sugarcane rows. All the plots were 5 m long, except for those plots receiving urea which were 10 m long. Buffer strips between treatment plots were 5 m long in order to minimise contamination between the treatments. Application rates of mineral N fertiliser and poultry litter were equivalent to 160 kg N ha−1 following fertiliser guidelines for the region [44]. The biochar and compost treatments received an additional 37 and 60 kg N ha−1, because both materials contain N that is often in a less plant-available form.
The application rate of amendments was equivalent to 5 tons ha−1 on a dry weight basis. Amendments were thoroughly mixed with the manure before being applied to soil. In previous research, manure-sorbent blends were incubated for over a week to maximise the contact of N ions and sorbent [45,46]. Here, treatments were applied within 1 h of mixing so that we could determine if rapidly assembled treatments are effective at the field-scale. Urea, poultry litter and poultry litter blends were applied in 10 × 10 cm deep trenches dug into one side of the shoulder of sugarcane rows and covered first with soil and then with sugarcane trash. Where treatments supplied insufficient P and K, the nutrients were added as a mineral fertiliser to meet the recommended application rates of 40 kg P and 100 kg K ha−1 [44]. Air temperature and humidity were logged every 30 min by a weather station situated in the experimental field (ICT International, Armidale, Australia) and daily rainfall data were obtained from a nearby public weather station (Dunethin Rock, within 400 m of the field).

2.5. Sampling and Analysis of Greenhouse Gases

Fluxes of N2O, carbon dioxide (CO2) and methane (CH4) were quantified manually using static chambers over 275 days from the start of the experiment. The collection system consisted of square metallic chamber bases covering an area of 0.25 m2 and cubic chamber tops holding a total volume of 140 L. Two chamber bases were installed in each plot close to the centre, one in the shoulder of the cane row on the site that received the treatment, and one in the inter-rows. The bases were inserted into the soil at a depth of about 5 cm. Junctures between the chamber bases and tops were sealed with air-tight door seals. The chamber tops were equipped with vent tubes which were connected to valves. Twenty-eight mL of gas were collected by connecting a syringe to the valve and transferring the gas samples into pre-evacuated Exetainer vials (Labco Limited, Lampeter, UK). Gas sampling was performed between 9:00 a.m. and 12:00 p.m. to obtain the best representation of daily mean fluxes as recommended by previous research in sugarcane fields [7,47]. Initial quantification of greenhouse gas accumulation in the chambers revealed a linear increase for at least two hours. The duration of the chamber closure ranged between 60 and 90 min. Sampling frequency followed rainfall events and gradually decreased from twice a week in the first eight weeks to once every three weeks in the last two months of the experiment. Gas samples were analysed using a gas chromatograph equipped with a flame ionization detector and an electron capture detector (GC-2010, Shimadzu, Kyoto, Japan). Daily greenhouse gas fluxes were estimated by multiplying hourly fluxes with 24. Cumulative emissions were calculated using trapezoidal integration between sampling events, as described by Allen et al. [7]. Emission factors (EF) were calculated using the IPCC [48] Tier 1 method with the cumulative N2O emissions from the fertilised plots as treatments and the cumulative N2O emissions from unfertilised plots as a control with Equation (1):
EF = (N2O-Ntreatment − N2O-Ncontrol)/total N application × 100
where N2O-N treatment refers to the cumulative N2O emissions from fertilised plots, and N2O-N control refers to the cumulative N2O emissions from unfertilised control plots.

2.6. Soil Sampling and Analysis

At each of the 34 sampling events, two separate soil samples of 10 cm depth were taken from each plot, from the side of the row shoulder that was subjected to treatment and from the inter-row. Within 48 h of collection, a sub-sample of each soil sample was extracted with 1 M KCl and extracts were frozen at −80 °C until analysis of extractable ammonium and nitrate (NH4+, NO3), and microbial biomass N (see methods above) could be undertaken. Another set of sub-samples was used to determine the gravimetric soil moisture by drying the samples at 60 °C for four days.

2.7. Sugarcane Biomass

The two inner rows of the experimental plots were harvested by hand at the end of the experiment on 23 September 2015. A total of 10 m of sugarcane (2 × 5 m) were cut close to the ground at each plot. Immediately after cutting, the total fresh biomass of the harvested plants was weighed in batches using a tripod balance in the field.

2.8. Laboratory Experiment

To evaluate if laboratory incubation can provide an indication of the N2O emissions in the field, we used the same materials and soil in a 2-week incubation experiment with continuous automated greenhouse gas analysis. Fresh soil was collected from the top 10 cm of an unfertilised area in the sugarcane field. A urea treatment was omitted in order to allow four replicates per organic source and amendments. Fresh spent poultry litter was collected from the same poultry business that supplied litter for the field experiment, and the same amendments were used as for the field experiment.
Each experimental unit included a 668 g mass of field moist soil (508 g dry soil) with added poultry litter or pre-mixed poultry litter + amendment. The treatments were mixed for 1 h prior to commencing the experiment to match the field procedure. Soil in the no-N control was also mixed to match the disturbance of the other treatments. Manure and amendments were applied at the same rates as in the field experiment, with corresponding application rates of 0.25 g N per kg dry soil for poultry litter and 7.73 g per kg dry soil for the amendments. The treated soils were placed into cylindrical glass vessels (surface area 78.5 cm2, height 25 cm) and were compacted by hand in order to reproduce the soil bulk density of sugarcane rows (1.00 g cm−3). The filling height of the soil was 10 cm to match the incorporation depth of the field experiment. Vessels were sealed to be air-tight with a rubber ring and a fitted plastic lid. The water-filled pore space (WFPS) of soil was adjusted to 60% (gravimetric soil moisture: 0.31 g water g−1 soil) and maintained throughout the experiment by compensating for evaporation with regular additions of deionised water shortly after gas sampling events. However, water loss was minimal (around 0.5% of the total soil water in each experimental unit) as the experimental system was sealed. This moisture content was aimed to match the field conditions as closely as possible, which averaged 56% WFPS for the duration of the experiment. The ambient temperature was kept constant at 25 °C throughout the experiment.
N2O fluxes and other greenhouse gases were quantified using an automated system [45]. Briefly, a mass flow controller creates a vacuum by which ambient air is moved first into a mixing drum to correct for potential deviations from mean gas background concentrations, and then moves through the vessels that are connected to the drum. After passing through the vessels, the gas is drawn to an N2O analyser (N2O1A-23e-EP, Los Gatos, San Jose, CA, USA) and CO2/CH4 analyser (GGA-30r-EP, Los Gatos, San Jose, CA, USA). Both instruments logged gas concentrations continually at 20 s intervals. One sweep cycle lasted for 10 min with a flow rate of 3 L min−1. After each gas sampling event, the system was cleaned by sweeping ambient air through an empty vessel for 10 min. The headspace gas of each vessel was sampled every 10.5 h. Between sampling events, the vessels were sealed by closing the inlet and outlet valves. After two weeks of experimentation, N2O emissions returned to background levels and the experiment was terminated.

2.9. Data Analyses

Statistical analyses were performed using ‘R’ version 3.3.1 [49]. Differences between treatments were analysed using one-way ANOVA and Fisher’s LSD post-hoc test at p < 0.05. Data were log-transformed with the natural logarithm where residuals were not normally distributed.

3. Results

3.1. Field Experiment

3.1.1. Sugarcane Yield

Harvested sugarcane biomass (fresh weight from 10 m row length per replicate) was significantly (p < 0.05) lower in the no-N control (79.5 ± 4.4 kg) and similar to the poultry litter + biochar treatment (101.5 ± 22 kg). All N receiving treatments had a statistically similar yield (129.3 ± 13.8 kg (urea), 125.6 ± 15.4 kg (poultry litter), 120.4 ± 17.5 kg (poultry litter + bentonite), 107.5 ± 9.3 kg (poultry litter + compost) and (see above) the poultry litter + biochar treatment (Figure 1).

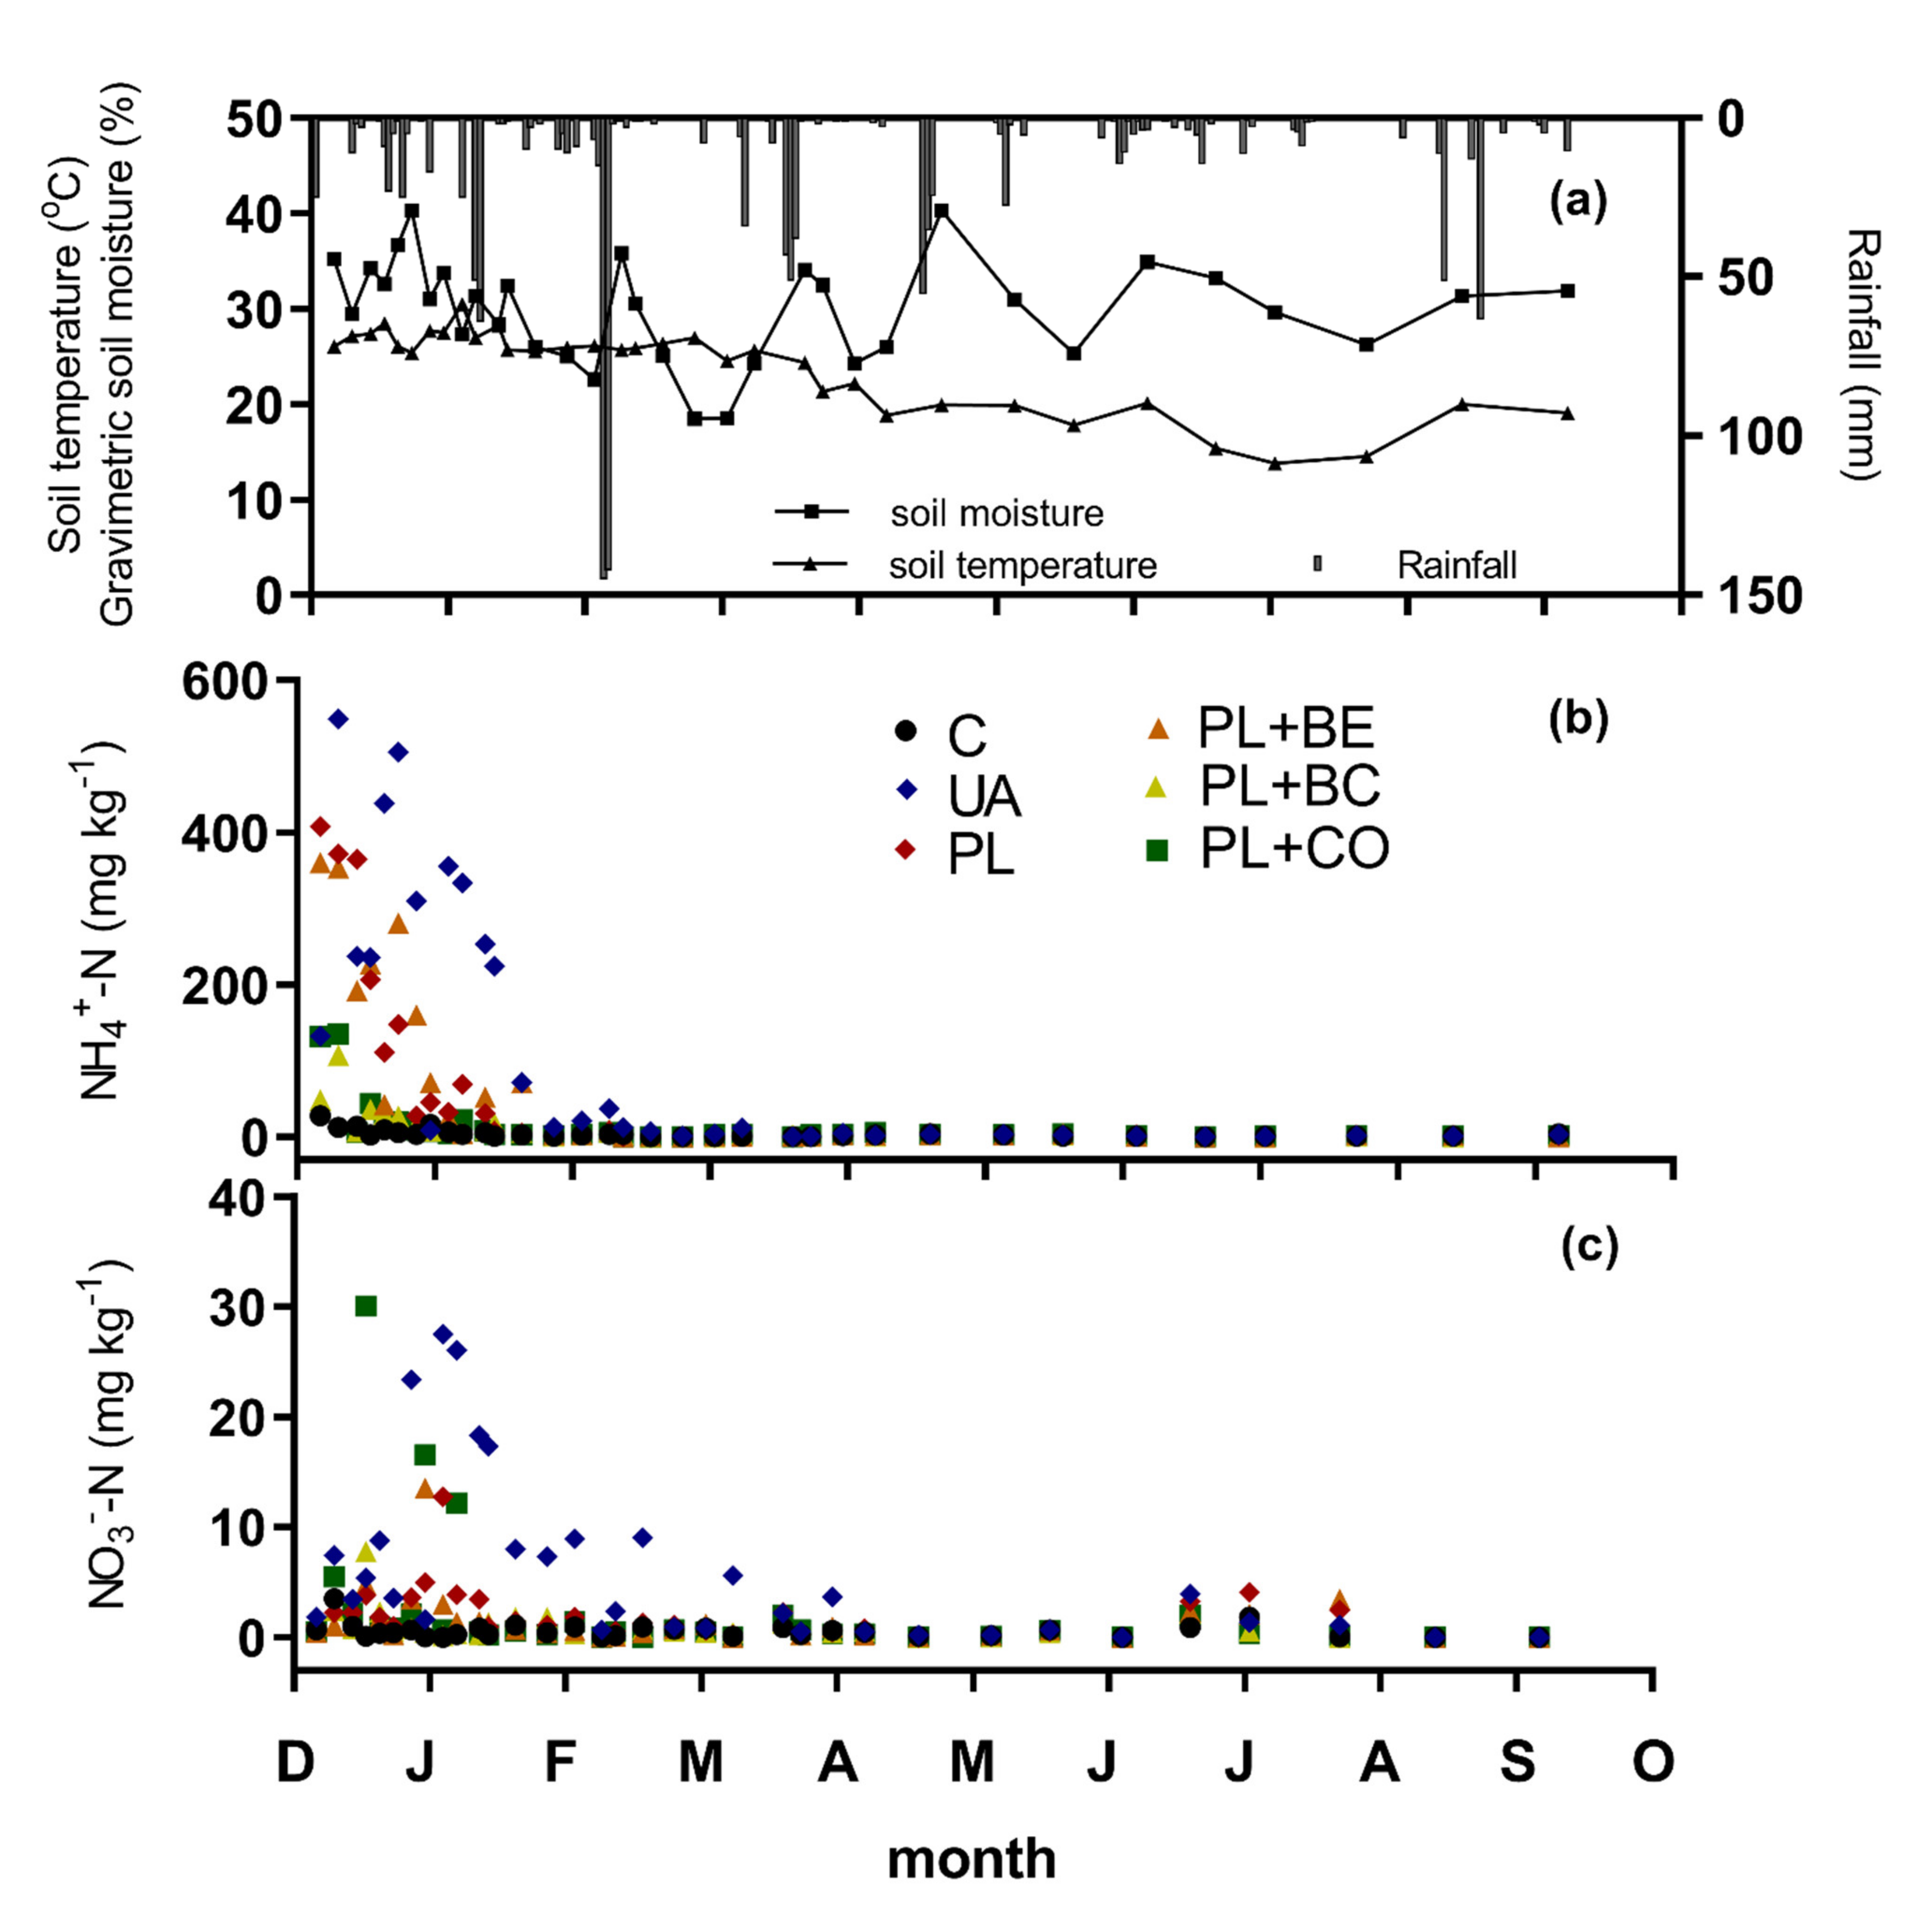
3.1.2. Environmental Variables and Mineral Soil Nitrogen

During the period of the experiment, the total precipitation was 1292 mm and soil moisture generally increased to between 35% and 40% after rainfall events (Figure 2a). Soil temperature peaked during the summer months at 30 °C, declining to a minimum of 14.5 °C in winter.
The concentrations of mineral (i.e., inorganic) N in the inter-row soil were negligible compared to row soil (Figure 2b). The highest single NH4+ concentration (809 mg N kg−1 soil) was detected in the poultry litter treatment 5 days after commencing the experiment. In all treatments, NH4+ concentrations peaked during the first month and declined by the end of the second month (Figure 2b). The highest single NO3 concentration (47 mg N kg−1 soil) was detected in the urea treatment after 33 days (Figure 2c). Nitrate concentrations peaked after 21–28 days in all treatments and decreased within 45 days for PL treatments and within 130 days for the urea treatment.
In the first 130 days of the field experiment, NH4+ concentrations were significantly (p < 0.05) higher in the urea treatment than in all other treatments (Table 1). The average soil NH4+ concentrations over the first 130 days in soils of poultry litter (PL) and PL + bentonite treatments were significantly (p < 0.05) higher than in PL + biochar and PL + compost treatments. The average soil NO3 concentrations were the highest in the urea treatment, followed by the PL treatment (Table 1). The addition of amendments bentonite and biochar significantly (p < 0.05) reduced soil NO3 concentrations in the PL addition (Table 1).

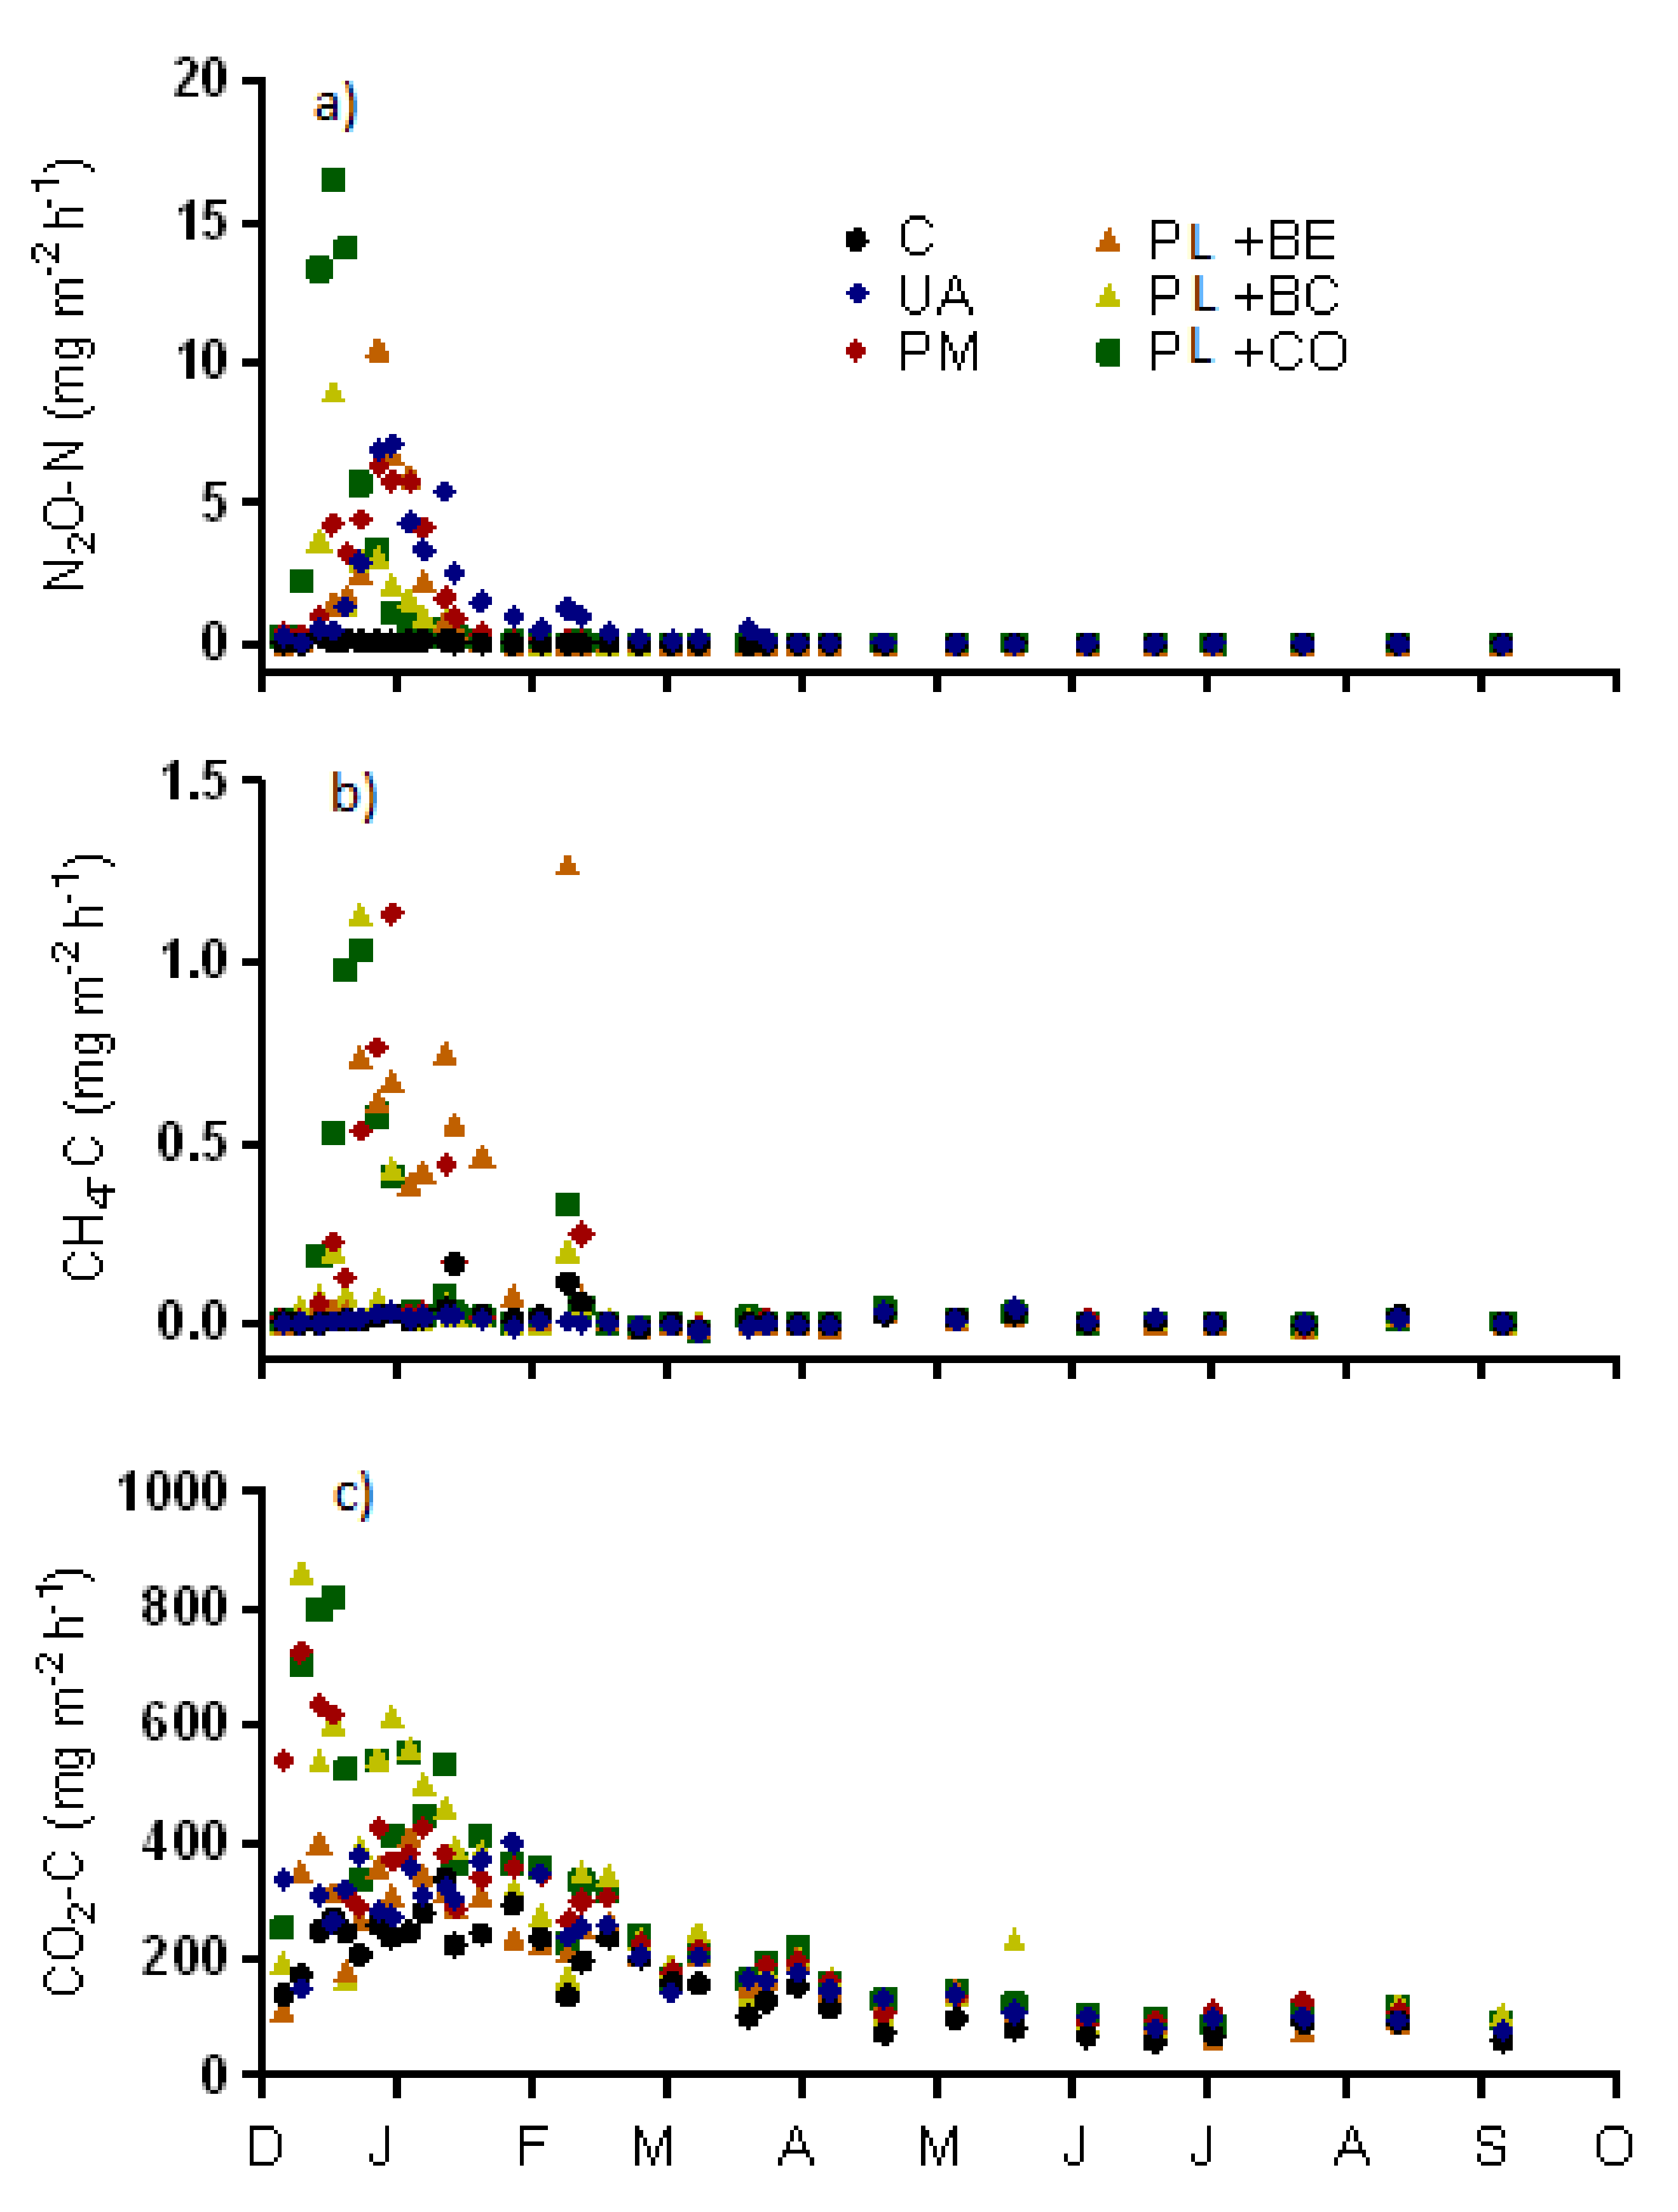
3.1.3. Greenhouse Gas Emissions

Nitrous oxide (N2O) fluxes ranged from −0.01 to 0.23 mg N2O-N m−2 h−1 in inter-rows (data not shown), and −0.02 to 17.05 mg N2O-N m−2 h−1 in rows (Figure 3a). Emissions of N2O peaked during weeks 2 to 5 and returned to the background level within two months for PL treatments and within four months for the urea treatment (Figure 3a).
Methane (CH4) fluxes were neutral (~0 mg CH4-C m−2 h−1) in rows and inter-rows, with slightly elevated emissions in the first three months from the rows of all treatments receiving PL (Figure 3b). CH4 fluxes from inter-rows ranged from −0.03 mg to 0.63 CH4-C m−2 h−1 in PL + compost and PL, respectively (data not shown). CH4 fluxes from rows ranged from −0.04 to 1.29 mg CH4-C m−2 h−1 in the no-N control and PL + bentonite, respectively.
Carbon dioxide (CO2) row emissions ranged from 27 to 832 mg CO2-C m−2 h−1 in the no-N control and PL + compost, respectively. The highest CO2 fluxes occurred in the first two months of the experiment (Figure 3c). CO2 fluxes in inter-rows ranged from 1.28 to 425 mg CO2-C m−2 h−1 without treatment-specific differences (data not shown).

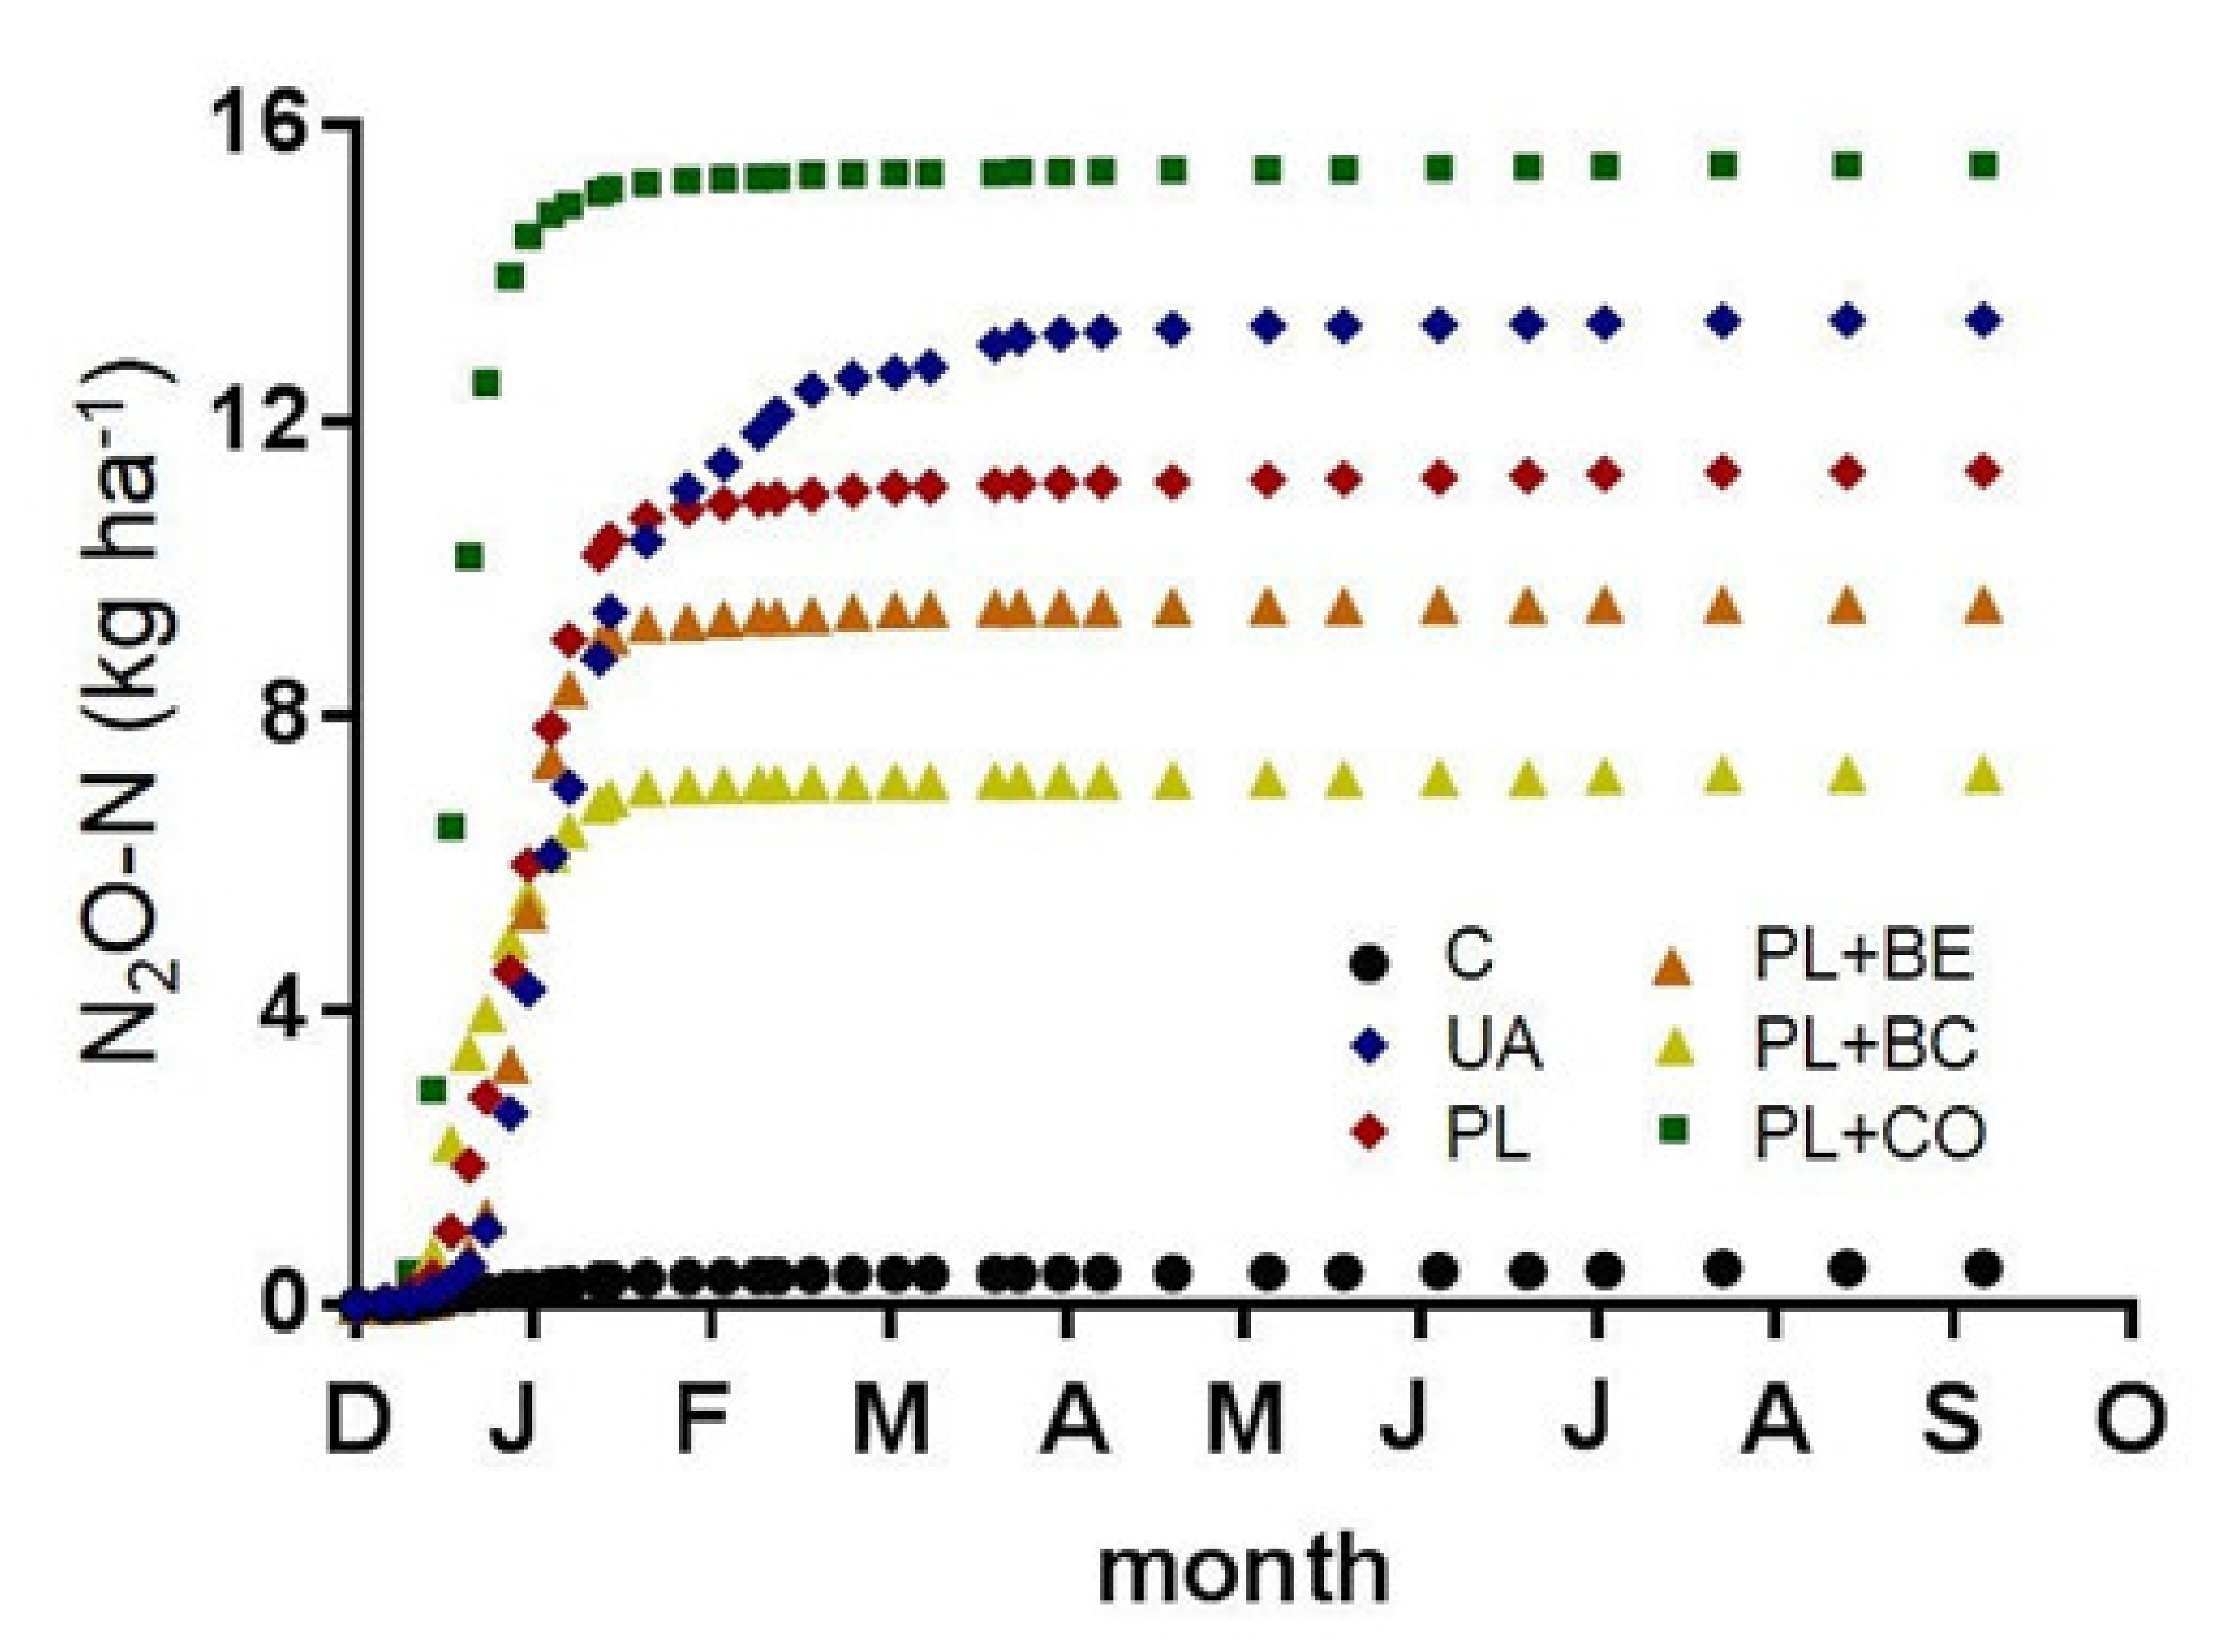
3.1.4. Cumulative N2O Emissions and Emission Factors

Cumulative N2O emissions (kg N2O-N ha−1) over the 10-month crop cycle ranked 0.84 (no-N control), 7.48 (PL + biochar), 9.74 (PL + bentonite), 11.67 (PL), 13.67 (urea) and 15.65 (PL + compost) (Figure 4, Table 2). Emissions were calculated using both row and inter-row data, factoring-in a 66% row/33% inter-row weighting ratio based on the geometric relationships observed in the field. Cumulative N2O emissions from the no-N control were significantly lower than all N treatments, which were statistically similar.
Emission factors expressed N2O emissions relative to the N application to soil (% of applied N emitted as N2O). Treatments ranked urea (8.02%), PL (6.77%), PL + compost (6.75%). PL + bentonite (5.50%) and PL + biochar (3.36%) (Table 2).

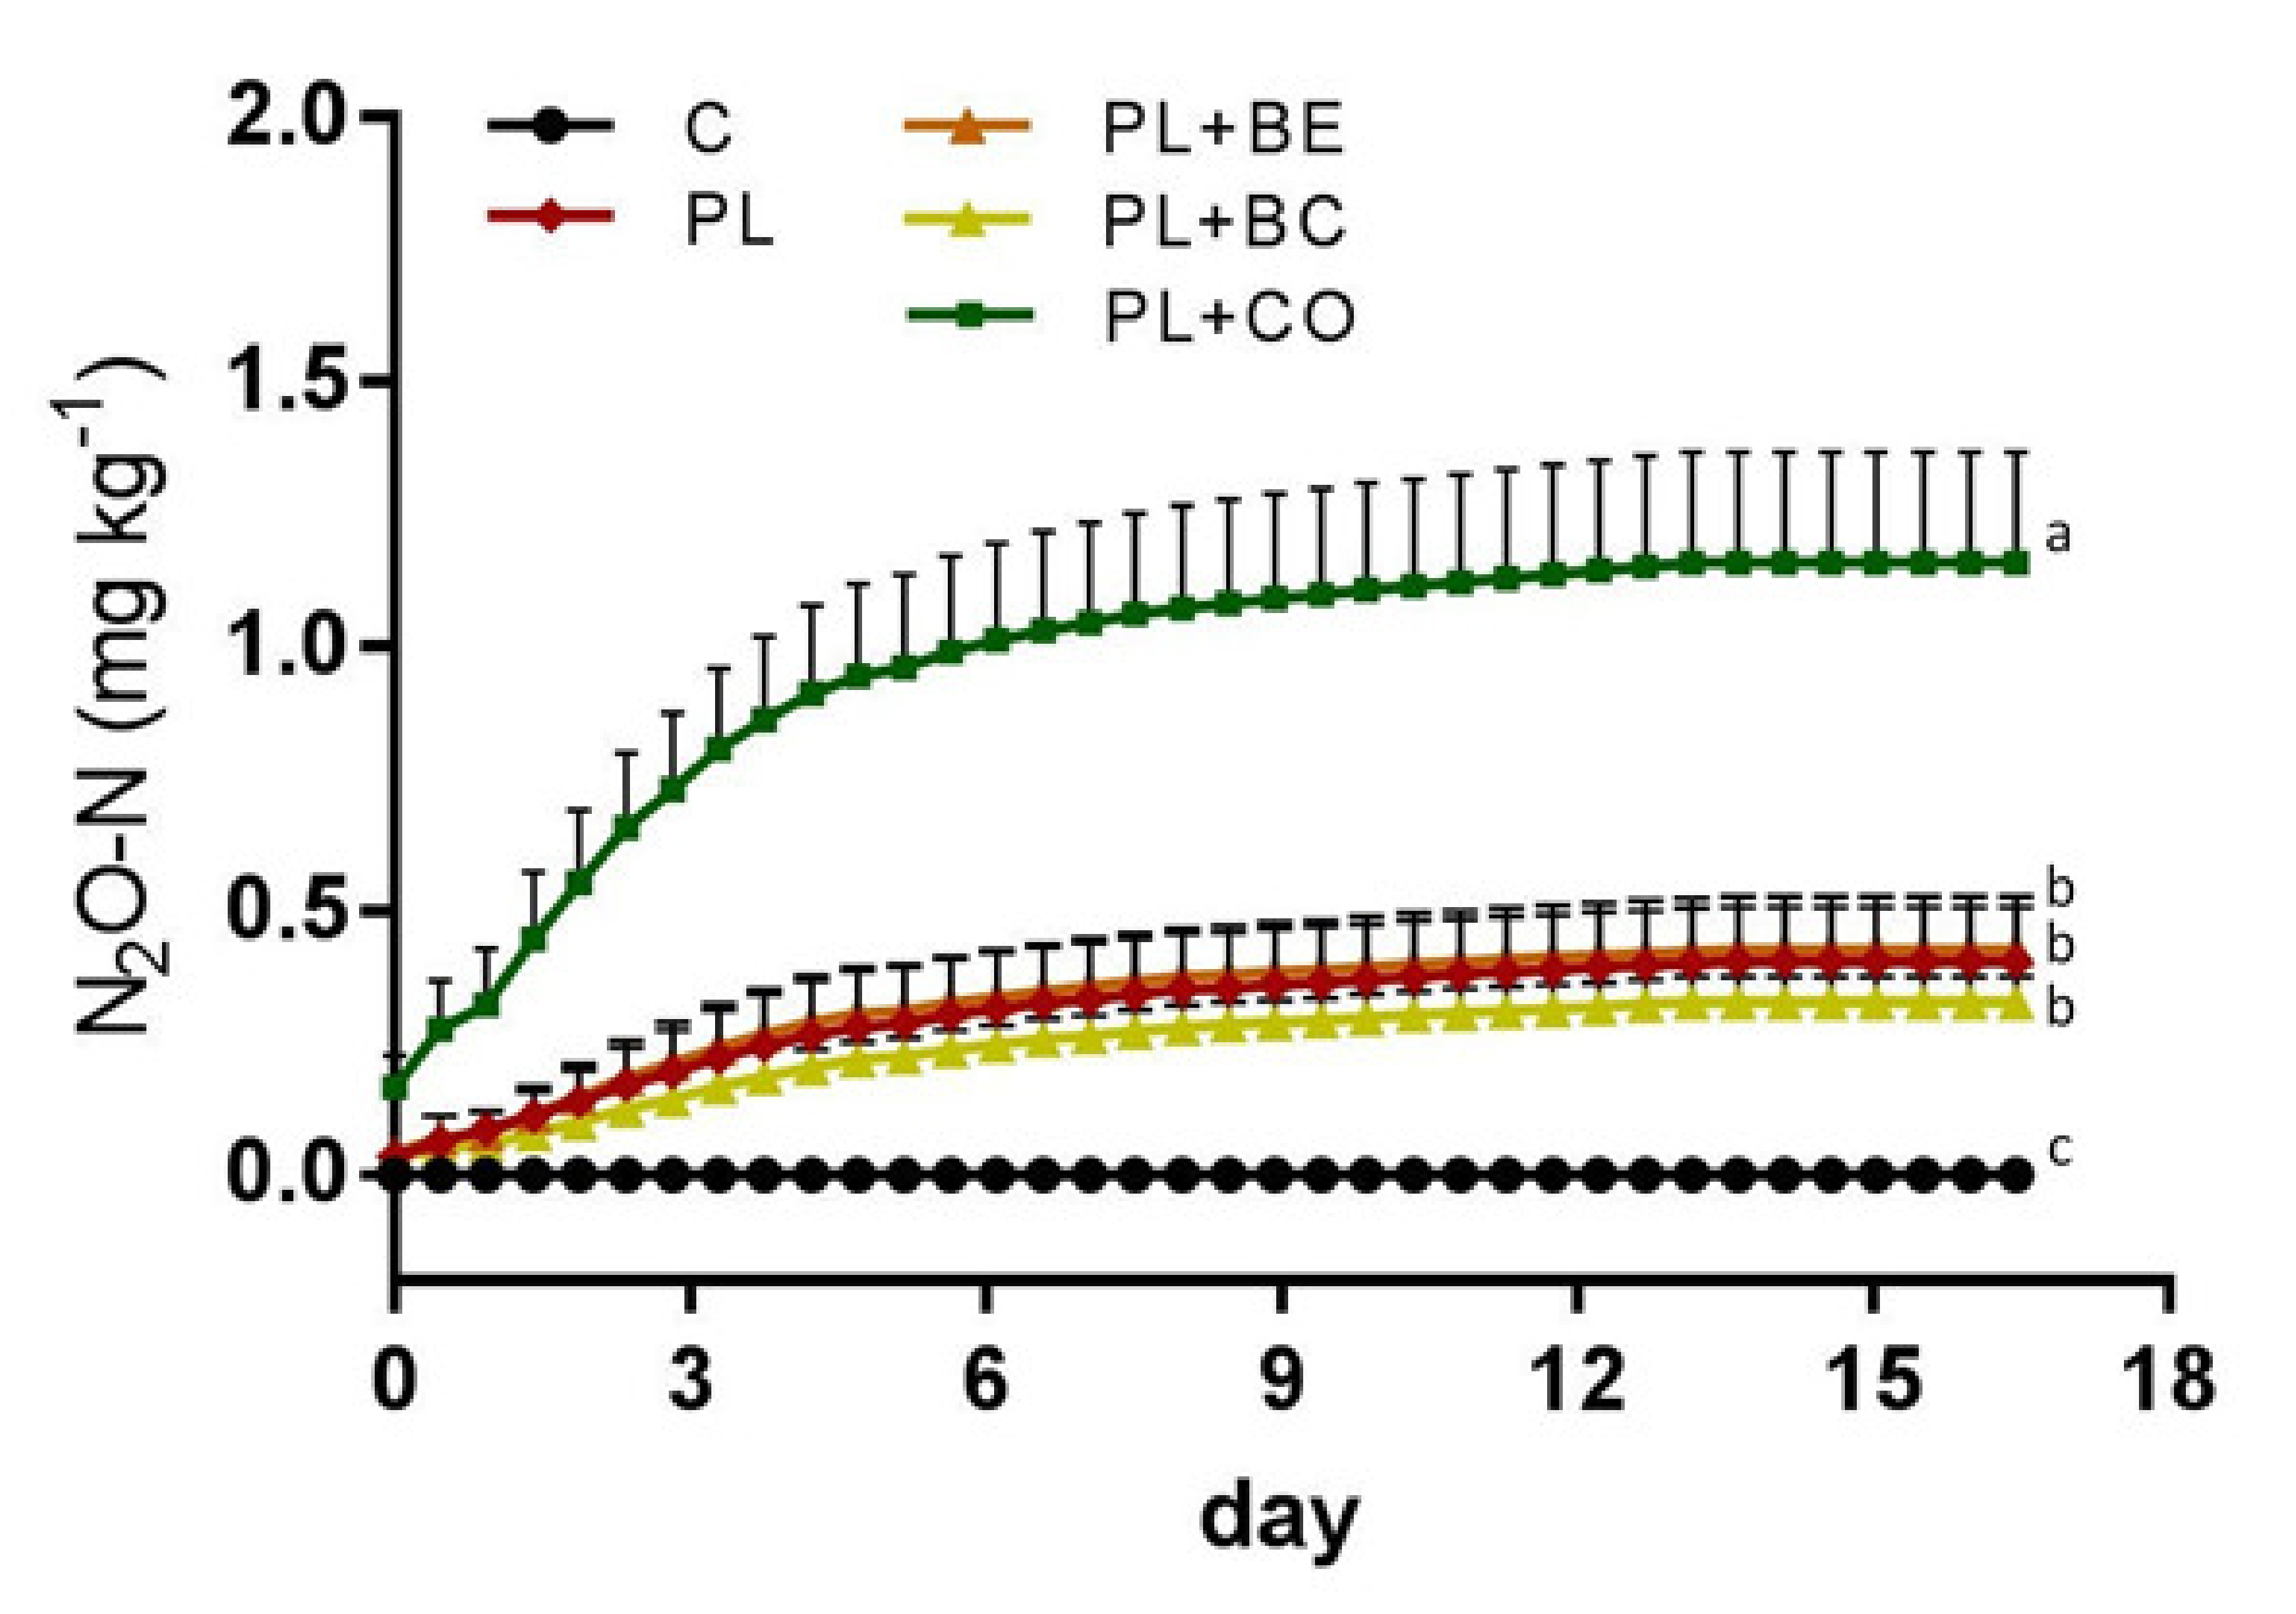
3.2. Laboratory Experiment

The incubation experiment aimed to test if the emissions potential for N2O could be estimated by mixing the field soil with poultry litter and amendments for a cost-effective pre-screening analysis of blends of wastes and amendments prior to field testing. In vitro testing of poultry litter treatments over 17 days exhibited a broadly similar trend in terms of cumulative N2O emissions as the field experiment (Figure 5). In line with the field experiment, the total N2O emissions from laboratory incubation were significantly lower in the no-N control (<0.01 mg N2O-N kg−1). The treatments that received poultry litter as a fertiliser had similar emissions, except for the PL + compost treatment which had significantly higher N2O emissions (PL 0.40 mg N2O-N kg-1; PL + bentonite 0.43 mg N2O-N kg−1; PL + biochar 0.33 mg N2O-N kg−1; PL + compost 1.16 mg N2O-N kg−1; Figure 5, Table 3). Emission trends for each treatment in the laboratory experiment correlated well with those from the field study (Figure 6). Carbon dioxide and methane were quantified in the field and in vitro incubations. Cumulative CO2 and CH4 data are reported in Table 4.

4. Discussion

4.1. Emissions of N2O and Other Greenhouse Gases from the Field Experiment

The detected emission factors (EF) for N2O exceeded the default EF of 1% for fertilised soils [48], and 1.25% for sugarcane soils in Australia (Department of Environment, 2014). EFs of 3.4 to 8.0 in our study mostly exceeded the average EF of 3.87 ± 1.16% calculated for sugarcane soils globally [6]. They were also in the upper range, or higher, than EF of 0.04% to 6.7% from sugarcane fields fertilised with mineral N and managed with green cane harvesting [7,10,11,50,51,52], but were below the EF of 21% from Australian acid sulphate soil [8]. Taken together, our study corroborates the risk of N2O emissions from current sugarcane production systems. It supports calls for a revision of default EF from sugarcane soil and the need for ongoing efforts to improve N efficiency of sugarcane production.
While cumulative emissions and EF from soil fertilised with urea or poultry litter (with or without amendments) were statistically similar due to considerable plot level variation, we observed a trend of lower inorganic N concentrations and accompanying lower N2O emissions with sorbent-amended poultry litter. Biochar and bentonite most strongly reduced the soil concentration of extractable inorganic N. Testing these sorbents in the laboratory, we confirmed that both effectively sorb NH4+ [30,31]. In the present study, sorbents were mixed with the N source immediately prior to application to the soil, which may explain why our findings differ from previous studies where pre-incubation resulted in over ~50% greater NH4+ sorption (e.g., [46,53]). Because water and solutes diffuse slowly in bentonite [54], and possibly biochar, pre-incubating sorbents with N-rich materials could attenuate the early release of inorganic N. For the development of next-generation fertilisers based on organic wastes and sorbents, pre-incubation should therefore be considered. The precise mechanisms underlying any observed N2O emission reductions are not clear-cut. It is possible that they are linked to NH4+ sorption and subsequent suppression of gaseous species production. Both biochar and bentonite exhibit permanent net negative charges (CEC). While their relatively alkaline pH (Supplementary Table S2) could partially limit their capacity for NH4+ sorption as more NH3 is volatilised at a high pH, previous work has shown these materials to be effective NH4+ sorbers [30]. Yet, why increased NH4+ sorption necessitates decreased N2O emission has not been conclusively established. In previous work, Venterea et al. [55] provided compelling evidence for a twinned chemical/microbiological-mediated mechanism driving lower N2O production in high CEC materials as sorbed NH4+ facilitated efficient microbial transformation of nitrite to nitrate. More detailed surface investigations and genomic analysis are needed to verify this process.
Adding compost to poultry litter increased N2O emissions, likely due to the additional C and N supplied with the compost stimulating soil microbial activity [56]. The concentrations of soil inorganic N were significantly higher in the urea treatment than in poultry litter treatments, and nitrate concentrations remained elevated for longer with urea. Nitrate is a precursor for N2O in the denitrification pathway, but our study did not examine the precise mechanisms of N2O production. Both nitrification and denitrification pathways produce N2O, and we found significant correlations between N2O emission and the levels of both ammonium and nitrate. Indeed, previous reports indicate that nitrification and denitrification pathways generate N2O from poultry manures applied to soil [25,57,58,59].
Optimising future crop systems will require not only the minimisation of N2O emissions, but also methane and carbon dioxide to create a low greenhouse gas footprint while maximising C sequestration into soil. We detected methane emissions of <20 kg ha−1 y−1, which are comparable with previous reports from Australian sugarcane soils [8,60]. Poultry litter treatments had higher methane emissions than that of the urea treatment, similar to findings by Sistani et al. [61]. In the context of global warming potential, these CH4 emissions represent ~0.5% of the mean N2O emissions on a CO2-e basis. Such comparatively low CH4 production is expected for free-draining soils that receive carbon inputs [62], as anaerobic conditions are unlikely to develop.
Carbon dioxide emissions from all treatments were higher in our study than at comparable sites [8,50], likely due to the addition of sugarcane trash to the soil. However, CO2 emissions are not included in the GHG footprint because manures are considered biogenic materials and as such form part of the short-term carbon cycle under IPCC reporting [48]. Nonetheless, CO2 emissions are a useful indicator of biological activity. The comparatively high CO2 emissions observed in our study are likely due to the combined application of N and C at the start of the wet summer season. Warm temperatures and high rainfall during the initial two months enable high microbial activity which also stimulates the breakdown of organic matter that in turn releases nutrients for crop growth [63].

4.2. Can Field Level Emissions Be Predicted with Laboratory Incubations?

The laboratory experiment showed overall similar trends in cumulative N2O emissions as the field experiment with lowest to highest emissions spanning the no-N control to poultry litter + compost, but with varying relative emissions indicative of different environmental conditions of the two systems. While biochar and compost showed the same trend in cumulative N2O emissions in both the field and laboratory experiments as the lowest and highest emitters, respectively, bentonite resulted in an 8% increase in N2O emissions in the laboratory but a 16% decrease in emissions in the field. This difference between the two experimental systems in response to bentonite addition may be explained by the high swelling capacity of bentonite. In the laboratory, constant swelling of bentonite led to decreased gas exchange and oxygen deficiency in soil microsites, as soil moisture was held constant at 60% WFPS and conducive to denitrification [64]. The difference in N2O emissions may also be attributed to the somewhat stronger homogenization of the material in the laboratory experiment, which could have accelerated the migration of diffusing ammonium ions.
A noticeable difference between the field and in vitro experiments was that poultry litter + compost had highest N2O emissions in both, with field emissions being one third higher than unamended poultry litter while in vitro emissions exceeded the unamended poultry litter nearly 3-fold. An explanation could be that poultry litter contained substantial amounts of ammonium and compost contained nitrate, and with a constant water content of 60% WFPS in the in vitro incubation, simultaneous nitrification and denitrification could have occurred, generating N2O from both pathways. In contrast, more variable water relations in field soils would have limited N2O emissions. A further explanation is that, in the field, microbes consumed N2O diffusing across the soil layer that covered the poultry litter + compost. Such microbial N2O consumption on the route from the source of production at depth to the soil surface was demonstrated at a fine-scale resolution with microelectrodes in marine sediment [65]. In line with Felber et al. [66], we found that absolute N2O emissions from in vitro incubation did not fully match those quantified in the field, but that they gauge the relative effects of blended nutrient-rich organic materials (Figure 6).

4.3. Implications and Recommendations

Results from the field experiment confirmed our hypothesis that mineral fertiliser results in higher concentrations of extractable soil inorganic N and a higher N2O emission factor compared with N-rich manure. Blending manure and sorbents decreased inorganic soil N concentrations and N2O EFs, while achieving a similar yield to a mineral fertiliser. However, the potential for sorbents or compost to immobilise N strongly, and thereby compromise crop yield, has to be considered. Field experiments over several years and across different soil types are needed to expand the knowledge base. Moving forward, research should fine-tune in vitro testing by further identifying where such systems are accurately representing N2O emissions from field experimentation and possible adjustments to optimise alignment (e.g., implementing wetting-drying cycles). In vitro testing could enable rigorous pre-screening of blends prior to field experimentation and commercial use. Once a sufficient empirical knowledge base has been established, process-based models can be added as a predictive tool [67]. Taken together, our study confirms that formulating organic waste-sorbent or compost blends has to strike the right balance between the release of adequate amounts of N in synchrony with crop needs, while preventing the N loss-inducing accumulation of inorganic N. This is illustrated here by biochar which caused the lowest inorganic N concentrations in the field but also resulted in a trend towards lower sugarcane yield.
Previous research emphasised that there remains uncertainty around how N2O emissions are affected by different N-containing materials. Laboratory, glasshouse, and field research showed that sorbents effectively suppress N2O emissions from organic and inorganic fertilisers in systems involving rice [68], grass [30], pasture and alfalfa [55], and sorghum [30]. Importantly, different mechanisms are likely to drive the observed responses. Clays, such as bentonite, suppress N2O emission via NH4+ cation exchange [30,55], whereas biochar-enabled mechanisms likely include electrostatic sorption, pore space retention and immobilisation due to high C:N ratios [28,32].
There is evidence that the effectiveness of sorbents to mitigate N2O emissions improves with an increased sorbent:N ratio and by storing the blends prior to field application to enable maximum immobilization [46,53]. While this may entail higher input costs when implemented at full-scale, it would nonetheless be a useful technology to consider. The inclusion of other sorbents could also be worthwhile. We used bentonite as a widely available, low-cost, and high-CEC sorbent. However, bentonite has shrink-swell properties that may limit its effectiveness in field settings, as evidenced by similar soil ammonium levels occurring in unamended poultry litter. Other high CEC clays, such as vermiculite and zeolites, do not exhibit such responses to soil moisture and might be better choices for decreasing N2O emissions. Indeed, chabazite and clinoptilolite bound ammonium more strongly than biochar and bentonite with sorption capacity of the tested materials ranging from 5.7 to 24.3 mg NH4+ g−1 sorbent [31]. To customise organic waste blends with optimal plant-available N and minimal N losses, the crop’s N preferences and uptake capacity should be considered. In the case of sugarcane, avoiding the accumulation of nitrate but enabling ammonium fluxes to match crop uptake capacity [31] aligns with the crop’s N physiology, while other crops use nitrate more competently [2,69]. Climate and soil conditions, together with the microbial N conversions, have to be considered.
Compost addition to poultry litter did not reduce nitrification in our study. It also did not decrease N2O emissions, as documented by an incubation study where soil amended with blended cattle feedlot manure (C/N 12) and green waste compost (C/N 38) emitted ~3–4 times less N2O than soil receiving only manure [70]. The low C/N ratio of the green waste compost of our study (14.9) is in a range that promotes N mineralisation [33,71], and extractable N levels could have been exacerbated by the additional 60 kg N ha−1 provided by the compost. Future research must consider appropriate compost properties to ensure a reduction of N2O emissions and strategise N inputs, with higher C/N compost a key element in achieving this goal. For example, ammonium levels in poultry litter compost declined from 1.5% of total N in raw compost (C/N 6.3) to 0.02% in 15-month-old mature compost (C/N 18.7) [72].
Overall, how nutrient treatments drive sugarcane yield is an important economic consideration. Yield, in combination with the observed inorganic N dynamics in soil, suggest that organic inputs, compared to mineral N fertiliser, result in a more prolonged N supply. The suppression of high levels of inorganic N, especially nitrate, with sorbent-amended organic materials could conceivably offer an ongoing N supply to future crops. Experimentation over multiple season cycles is needed to test this hypothesis, along with monitoring of N loss pathways to confirm that prolonged N release does not lead to a greater risk of N loss or other undesirable effects.

Supplementary Materials

The following are available online at https://0-www-mdpi-com.brum.beds.ac.uk/article/10.3390/environments8080078/s1, Table S1: Soil properties (mean ± SD) of the top 10 cm of the study plots at the commercial sugarcane farm at Maroochy River prior to the start of the field experiment. Table S2: Physical and chemical properties of the poultry litter and amendments used in the field trial. Data are means of 3 replicates ± SD; <d.l. below detection limit.

Author Contributions

Conceptualization, M.W., S.S., R.B., N.R., M.R., W.W. and R.F.; methodology, M.W., N.R., R.B., S.S., M.R. and R.F.; formal analysis, M.W., M.S.C. and R.B.; field work, M.W., M.S.C., S.G., J.C.M.F.J., T.B. and S.B.; laboratory incubations, M.W., M.R., J.H. and C.P.; resources, J.K. (biochar); writing—original draft preparation, M.W., writing—review and editing, R.B., J.K., R.F., W.W., M.R., C.P., N.R. and S.S.; project administration, N.R. and R.B.; funding acquisition, M.W. and S.S. All authors have read and agreed to the published version of the manuscript.

Funding

This research received funding from Sugar Research Australia in support of M. Westermann’s PhD project.

Institutional Review Board Statement

Not applicable.

Informed Consent Statement

Not applicable.

Data Availability Statement

Data is available on request.

Acknowledgments

We thank Troy Apps for allowing the research on his farm. We wish to also thank Guy Holcroft (Darwalla Milling Group) for providing poultry litter, Dougal Scott (AMCOL, Australia) for bentonite, and Johannes Biala for supplying green waste compost. We are grateful to Sugar Research Australia for providing operating funds for Maren Westermann’s PhD project.

Conflicts of Interest

The authors declare no conflict of interest.

References

  1. FAOSTAT. Food and Agriculture Organization of the United Nations, Rome, Italy. 2017. Available online: http://www.fao.org/faostat/ (accessed on 1 January 2020).
  2. Robinson, N.; Brackin, R.; Vinall, K.; Soper, F.; Holst, J.; Gamage, H.; Paungfoo-Lonhienne, C.; Rennenberg, H.; Lakshmanan, P.; Schmidt, S. Nitrate Paradigm Does Not Hold Up for Sugarcane. PLoS ONE 2011, 6, e19045. [Google Scholar] [CrossRef] [Green Version]
  3. Prasertsak, P.; Freney, J.R.; Denmead, O.T.; Saffigna, P.G.; Prove, B.G.; Reghenzani, J.R. Effect of fertilizer placement on nitrogen loss from sugarcane in tropical Queensland. Nutr. Cycl. Agroecosyst. 2002, 62, 229–239. [Google Scholar] [CrossRef]
  4. Rasiah, V.; Armour, J.D.; Nelson, P.N. Nitrate in shallow fluctuating groundwater under sugarcane: Quantifying the lateral export quantities to surface waters. Agric. Ecosyst. Environ. 2013, 180, 103–110. [Google Scholar] [CrossRef]
  5. Freney, J.R.; Denmead, T. Factors Controlling Ammonia and Nitrous Oxide Emissions from Flooded Rice Fields. Ecol. Bull. 1992, 42, 188–194. [Google Scholar]
  6. Lisboa, C.C.; Butterbach-Bahl, K.; Mauder, M.; Kiese, R. Bioethanol production from sugarcane and emissions of greenhouse gases—Known and unknowns. GCB Bioenergy 2011, 3, 277–292. [Google Scholar] [CrossRef]
  7. Allen, D.E.; Kingston, G.; Rennenberg, H.; Dalal, R.C.; Schmidt, S. Effect of nitrogen fertilizer management and waterlogging on nitrous oxide emission from subtropical sugarcane soils. Agric. Ecosyst. Environ. 2010, 136, 209–217. [Google Scholar] [CrossRef]
  8. Denmead, O.T.; Macdonald, B.C.T.; Bryant, G.; Naylor, T.; Wilson, S.; Griffith, D.W.T.; Wang, W.J.; Salter, B.; White, I.; Moody, P.W. Emissions of methane and nitrous oxide from Australian sugarcane soils. Agric. For. Meteorol. 2010, 150, 748–756. [Google Scholar] [CrossRef]
  9. Takeda, N.; Friedl, J.; Rowlings, D.; De Rosa, D.; Scheer, C.; Grace, P. Exponential response of nitrous oxide (N2O) emissions to increasing nitrogen fertiliser rates in a tropical sugarcane cropping system. Agric. Ecosyst. Environ. 2021, 313, 107376. [Google Scholar] [CrossRef]
  10. Wang, W.J.; Salter, B.; Reeves, S.H.; Brieffies, T.C.; Perna, J. Nitrous oxide emissions from a sugarcane soil under different fallow and nitrogen fertiliser management regimes. Proc. Aust. Soc. Sugar Cane Technol. 2012, 34, 1–8. [Google Scholar]
  11. Wang, W.; Park, G.; Reeves, S.; Zahmel, M.; Heenan, M.; Salter, B. Nitrous oxide emission and fertiliser nitrogen efficiency in a tropical sugarcane cropping system applied with different formulations of urea. Soil Res. 2016, 54, 572–584. [Google Scholar] [CrossRef] [Green Version]
  12. Tian, H.; Xu, R.; Canadell, J.G.; Thompson, R.L.; Winiwarter, W.; Suntharalingam, P.; Davidson, E.A.; Ciais, P.; Jackson, R.B.; Janssens-Maenhout, G.; et al. A comprehensive quantification of global nitrous oxide sources and sinks. Nature 2020, 586, 248–271. [Google Scholar] [CrossRef]
  13. Maraseni, T.N.; Qu, J. An international comparison of agricultural nitrous oxide emissions. J. Clean. Prod. 2016, 135, 1256–1266. [Google Scholar] [CrossRef]
  14. Thompson, R.L.; Lassaletta, L.; Patra, P.K.; Wilson, C.; Wells, K.C.; Gressent, A.; Koffi, E.N.; Chipperfield, M.P.; Winiwarter, W.; Davidson, E.A.; et al. Acceleration of global N2O emissions seen from two decades of atmospheric inversion. Nat. Clim. Chang. 2019, 9, 993–998. [Google Scholar] [CrossRef]
  15. Yang, L.; Deng, Y.; Wang, X.; Zhang, W.; Shi, X.; Chen, X.; Lakshmanan, P.; Zhang, F. Global direct nitrous oxide emissions from the bioenergy crop sugarcane (Saccharum spp. inter-specific hybrids). Sci. Total Environ. 2021, 752, 141795. [Google Scholar] [CrossRef] [PubMed]
  16. Garside, A.L.; Bell, M.J. Growth and yield responses to amendments to the sugarcane monoculture: Effects of crop, pasture and bare fallow breaks and soil fumigation on plant and ratoon crops. Crop Pasture Sci. 2011, 62, 396–412. [Google Scholar] [CrossRef]
  17. Singh, K.; Suman, A.; Singh, P.; Srivastav, T. Improving quality of sugarcane-growing soils by organic amendments under subtropical climatic conditions of India. Biol. Fertil. Soils 2007, 44, 367–376. [Google Scholar] [CrossRef]
  18. Brock, C.; Hoyer, U.; Leithold, G.; Hülsbergen, K.-J. The humus balance model (HU-MOD): A simple tool for the assessment of management change impact on soil organic matter levels in arable soils. Nutr. Cycl. Agroecosyst. 2012, 92, 239–254. [Google Scholar] [CrossRef]
  19. Wiedemann, S.; McGahan, E.; Murphy, C. Environmental impacts and resource use from Australian pork production assessed using life-cycle assessment. 1. Greenhouse gas emissions. Anim. Prod. Sci. 2016, 56, 1418–1431. [Google Scholar] [CrossRef] [Green Version]
  20. Wiedemann, S.; McGahan, E.; Murphy, C. Resource use and environmental impacts from Australian chicken meat production. J. Clean. Prod. 2017, 140, 675–684. [Google Scholar] [CrossRef] [Green Version]
  21. Maillard, E.; Angers, D. Animal manure application and soil organic carbon stocks: A meta-analysis. Glob. Chang. Biol. 2014, 20, 666–679. [Google Scholar] [CrossRef] [PubMed]
  22. Jensen, L.S. Animal Manure Fertiliser Value, Crop Utilisation and Soil Quality Impacts. In Animal Manure Recycling; Sommer, S.G., Christensen, M.L., Schmidt, T., Jensen, L.S., Eds.; Wiley: Hoboken, NJ, USA, 2013; pp. 295–328. [Google Scholar]
  23. Akiyama, H.; Tsuruta, H. Nitrous Oxide, Nitric Oxide, and Nitrogen Dioxide Fluxes from Soils after Manure and Urea Application. J. Environ. Qual. 2003, 32, 423–431. [Google Scholar] [CrossRef] [PubMed]
  24. Rochette, P.; Angers, D.A.; Chantigny, M.H.; Gagnon, B.; Bertrand, N. N2O fluxes in soils of contrasting textures fertilized with liquid and solid dairy cattle manures. Can. J. Soil Sci. 2008, 88, 175–187. [Google Scholar] [CrossRef] [Green Version]
  25. Velthof, G.L.; Kuikman, P.J.; Oenema, O. Nitrous oxide emission from animal manures applied to soil under controlled conditions. Biol. Fertil. Soils 2003, 37, 221–230. [Google Scholar] [CrossRef]
  26. Xia, F.; Mei, K.; Xu, Y.; Zhang, C.; Dahlgren, R.A.; Zhang, M. Response of N2O emission to manure application in field trials of agricultural soils across the globe. Sci. Total Environ. 2020, 733, 139390. [Google Scholar] [CrossRef]
  27. Zhou, M.; Zhu, B.; Wang, S.; Zhu, X.; Vereecken, H.; Brüggemann, N. Stimulation of N2O emission by manure application to agricultural soils may largely offset carbon benefits: A global meta-analysis. Glob. Chang. Biol. 2017, 23, 4068–4083. [Google Scholar] [CrossRef]
  28. Clough, T.J.; Condron, L.M.; Kammann, C.; Müller, C. A Review of Biochar and Soil Nitrogen Dynamics. Agronomy 2013, 3, 275–293. [Google Scholar] [CrossRef] [Green Version]
  29. Zaman, M.; Zaman, S.; Nguyen, M.L.; Smith, T.J.; Nawaz, S. The effect of urease and nitrification inhibitors on ammonia and nitrous oxide emissions from simulated urine patches in pastoral system: A two-year study. Sci. Total Environ. 2013, 465, 97–106. [Google Scholar] [CrossRef] [PubMed]
  30. Pratt, C.; Redding, M.; Hill, J.; Brown, G.; Westermann, M. Clays Can Decrease Gaseous Nutrient Losses from Soil-Applied Livestock Manures. J. Environ. Qual. 2016, 45, 638–645. [Google Scholar] [CrossRef]
  31. Chin, A.; Schmidt, S.; Buckley, S.; Pirie, R.; Redding, M.; Laycock, B.; Luckman, P.; Batstone, D.J.; Robinson, N.; Brackin, R. Sorbents can tailor nitrogen release from organic wastes to match the uptake capacity of crops. Sci. Total Environ. 2018, 645, 1474–1483. [Google Scholar] [CrossRef]
  32. Cayuela, M.L.; van Zwieten, L.; Singh, B.P.; Jeffery, S.; Roig, A.; Sánchez-Monedero, M.A. Biochar’s role in mitigating soil nitrous oxide emissions: A review and meta-analysis. Agric. Ecosyst. Environ. 2014, 191, 5–16. [Google Scholar] [CrossRef]
  33. Dalal, R.C.; Gibson, I.; Allen, D.E.; Menzies, N.W. Green waste compost reduces nitrous oxide emissions from feedlot manure applied to soil. Agric. Ecosyst. Environ. 2010, 136, 273–281. [Google Scholar] [CrossRef]
  34. Isbell, R.F. The Australian Soil Classification, Australian Soil and Land Survey Handbook; CSIRO Publishing: Collingwood, VIC, Australia, 2002. [Google Scholar]
  35. WRB. World reference base for soil resources, 2014. In International Soil Classification System for Naming Soils and Creating Legends for Soil Maps; Update, 2015; FAO: Rome, Italy, 2015. [Google Scholar]
  36. Pratt, C.; Redding, M.; Hill, J.; Mudge, S.R.; Westermann, M.; Paungfoo-Lonhienne, C.; Schmidt, S. Assessing refrigerating and freezing effects on the biological/chemical composition of two livestock manures. Agric. Ecosyst. Environ. 2014, 197, 288–292. [Google Scholar] [CrossRef]
  37. Gee, G.W.; Or, D. Particle-Size Analysis. In Methods of Soil Analysis Part 4—Physical Methods; Dane, J.H., Topp, G.C., Eds.; Soil Science Society of America, Inc.: Madison, WI, USA, 2002; pp. 255–293. [Google Scholar]
  38. Wilke, B.M. Determination of Chemical and Physical Soil Properties. In Manual of Soil Analysis. Monitoring and Assessing Soil Bioremediation; Margesin, R., Schinner, F., Eds.; Springer: Berlin/Heidelberg, Germany, 2005; pp. 47–95. [Google Scholar]
  39. Rayment, G.E.; Lyons, D.J. Soil Chemical Methods: Australasia; CSIRO Publishing: Collingwood, VIC, Australia, 2011. [Google Scholar]
  40. Sumner, M.E.; Miller, W.P. Cation exchange capacity and exchange coefficients. In Methods of Soil Analysis. Part 3. Chemical Methods; Sparks, D.L., Page, A.L., Helmke, P.A., Loeppert, R.H., Eds.; ASA and SSSA: Madison, WI, USA, 1996; pp. 1221–1229. [Google Scholar]
  41. Kandeler, E.; Gerber, H. Short-term assay of soil urease activity using colorimetric determination of ammonium. Biol. Fertil. Soils 1988, 6, 68–72. [Google Scholar] [CrossRef]
  42. Miranda, K.M.; Espey, M.G.; Wink, D.A. A rapid, simple spectrophotometric method for simultaneous detection of nitrate and nitrite. Nitric Oxide 2001, 5, 62–71. [Google Scholar] [CrossRef]
  43. Joergensen, R.G.; Brookes, P.C. Quantification of Soil Microbial Biomass by Fumigation-Extraction. In Monitoring and Assessing Soil Bioremediation; Springer: Berlin/Heidelberg, Germany, 2005; pp. 281–295. [Google Scholar]
  44. Sugar Research Australia. Nutrient Management Guidelines for Sugarcane in the Bundaberg, Isis and Maryborough Districts. 2013. Available online: http://www.sugarresearch.com.au/icms_docs/194343_SIX_EASY_STEPS_Nutrient_Guidelines_for_SOUTHERN_DISTRICTS.pdf (accessed on 1 January 2020).
  45. Redding, M.R.; Shorten, P.R.; Lewis, R.; Pratt, C.; Paungfoo-Lonhienne, C.; Hill, J. Soil N availability, rather than N deposition, controls indirect N2O emissions. Soil Biol. Biochem. 2016, 95, 288–298. [Google Scholar] [CrossRef] [Green Version]
  46. Hill, J.; Redding, M.; Pratt, C. A novel and effective technology for mitigating nitrous oxide emissions from land-applied manures. Anim. Prod. Sci. 2016, 56, 362–369. [Google Scholar] [CrossRef] [Green Version]
  47. Reeves, S.; Wang, W.; Salter, B.; Halpin, N. Quantifying nitrous oxide emissions from sugarcane cropping systems: Optimum sampling time and frequency. Atmos. Environ. 2016, 136, 123–133. [Google Scholar] [CrossRef] [Green Version]
  48. IPCC. IPCC Guidelines for National Greenhouse Gas Inventories. Volume 4: Agriculture, Forestry and Other Land Uses; Report, Intergovernmental Panel on Climate Change; IPCC National Greenhouse Gas Inventories Programme; IPCC: Kanagawa, Japan, 2006. [Google Scholar]
  49. R Core Team. R: A Language and Environment for Statistical Computing; R Foundation for Statistical Computing: Vienna, Austria, 2016; Available online: https://www.R-project.org/ (accessed on 1 January 2020).
  50. Carmo, J.B.; Filoso, S.; Zotelli, L.C.; de Sousa Neto, E.R.; Pitombo, L.M.; Duarte-Neto, P.J.; Vargas, V.P.; Andrade, C.A.; Gava, G.J.C.; Rossetto, R.; et al. Infield greenhouse gas emissions from sugarcane soils in Brazil: Effects from synthetic and organic fertilizer application and crop trash accumulation. GCB Bioenergy 2012, 5, 267–280. [Google Scholar] [CrossRef]
  51. Soares, J.R.; Cantarella, H.; Vargas, V.P.; Carmo, J.B.; Martins, A.A.; Sousa, R.M.; Andrade, C.A. Enhanced-efficiency fertilizers in nitrous oxide emissions from urea applied to sugarcane. J. Environ. Qual. 2014, 44, 423–430. [Google Scholar] [CrossRef] [Green Version]
  52. Soares, J.R.; Cassman, N.A.; Kielak, A.M.; Pijl, A.; Carmo, J.B.; Lourenco, K.S.; Laanbroek, H.J.; Cantarella, H.; Kuramae, E.E. Nitrous oxide emission related to ammonia-oxidizing bacteria and mitigation options from N fertilization in a tropical soil. Sci. Rep. 2016, 6, 30349. [Google Scholar] [CrossRef] [Green Version]
  53. Redding, M.R.; Lewis, R.; Kearton, T.; Smith, O. Manure and sorbent fertilisers increase on-going nutrient availability relative to conventional fertilisers. Sci. Total Environ. 2016, 569–570, 927–936. [Google Scholar] [CrossRef] [Green Version]
  54. Bourg, I.C.; Sposito, G.; Bourg, A.C.M. Tracer diffusion in compacted, water-saturated bentonite. Clays Clay Miner. 2006, 54, 363–374. [Google Scholar] [CrossRef]
  55. Venterea, R.T.; Clough, T.J.; Coulter, J.A.; Breuillin-Sessoms, F.; Wang, R.; Sadowsky, M.J. Corrigendum: Ammonium sorption and ammonia inhibition of nitrite-oxidizing bacteria explain contrasting soil N2O production. Sci. Rep. 2016, 6, 20720. [Google Scholar] [CrossRef] [PubMed] [Green Version]
  56. Ros, M.; Teresa, M.; Carlos Garcia, H. Soil microbial activity after restoration of a semiarid soil by organic amendments. Soil Biol. Biochem. 2003, 35, 463–469. [Google Scholar] [CrossRef]
  57. Akiyama, K.; McTaggart, I.P.; Ball, B.C.; Scott, A. N2O, NO, and NH3 emissions from soil after the application of organic fertilizers, urea and water. Water Air Soil Pollut. 2004, 156, 112–129. [Google Scholar] [CrossRef]
  58. Khalil, M.I.; Rosenani, A.B.; Van Cleemput, O.; Fauziah, C.I.; Shamshuddin, J. Nitrous Oxide Emissions from an Ultisol of the Humid Tropics under Maize—Groundnut Rotation. J. Environ. Qual. 2002, 31, 1071–1078. [Google Scholar] [CrossRef]
  59. Khalil, M.; Rosenani, A.; Van Cleemput, O.; Boeckx, P.; Shamshuddin, J.; Fauziah, C. Nitrous oxide production from an Ultisol of the humid tropics treated with different nitrogen sources and moisture regimes. Biol. Fertil. Soils 2002, 36, 59–65. [Google Scholar]
  60. Wang, L.; Pan, Z.; Xu, H.; Wang, C.; Gao, L.; Zhao, P.; Dong, Z.; Zhang, J.; Cui, G.; Wang, S.; et al. The influence of nitrogen fertiliser rate and crop rotation on soil methane flux in rain-fed potato fields in Wuchuan County, China. Sci. Total Environ. 2015, 537, 93–99. [Google Scholar] [CrossRef]
  61. Sistani, K.R.; Jn-Baptiste, M.; Lovanh, N.; Cook, K.L. Atmospheric Emissions of Nitrous Oxide, Methane, and Carbon Dioxide from Different Nitrogen Fertilizers. J. Environ. Qual. 2011, 40, 1797–1805. [Google Scholar] [CrossRef] [Green Version]
  62. Pratt, C.; Redding, M.; Hill, J.; Shilton, A.; Chung, M.; Guieysse, B. Good science for improving policy: Greenhouse gas emissions from agricultural manures. Anim. Prod. Sci. 2015, 55, 691–701. [Google Scholar] [CrossRef] [Green Version]
  63. Jiao, S.; Chen, W.; Wang, J.; Du, N.; Li, Q.; Wei, G. Soil microbiomes with distinct assemblies through vertical soil profiles drive the cycling of multiple nutrients in reforested ecosystems. Microbiome 2018, 6, 146. [Google Scholar] [CrossRef] [Green Version]
  64. Firestone, M.K.; Davidson, E.A. Microbiological Basis of NO and N2O Production and Consumption in Soil. In Exchange of Trace Gases between Terrestrial Ecosystems and the Atmosphere; Andreae, M.O., Schimel, D.S., Eds.; John Wiley & Sons Ltd.: New York, NY, USA, 1989; pp. 7–21. [Google Scholar]
  65. Meyer, R.; Risgaard-Petersen, N.; Allen, D. Correlation between anammox activity and microscale distribution of nitrite in a subtropical mangrove sediment. Appl. Environ. Microbiol. 2005, 71, 6142–6149. [Google Scholar] [CrossRef] [Green Version]
  66. Felber, R.; Leifeld, J.; Horák, J.; Neftel, A. Nitrous oxide emission reduction with greenwaste biochar: Comparison of laboratory and field experiments. Eur. J. Soil Sci. 2013, 65, 128–138. [Google Scholar] [CrossRef]
  67. Fuchs, K.; Merbold, L.; Buchmann, N.; Bellocchi, G.; Bindi, M.; Brilli, L.; Conant, R.; Dorich, C.; Ehrhardt, F.; Fitton, N.; et al. Evaluating the potential of legumes to mitigate N2O emissions from permanent grassland using process-based models. Glob. Biogeochem. Cycles 2020, 34, e2020GB006561. [Google Scholar] [CrossRef]
  68. Zhang, A. Effect of biochar amendment on yield and methane and nitrous oxide emissions from a rice paddy from Tai Lake plain, China. Agric. Ecosyst. Environ. 2010, 139, 469–475. [Google Scholar] [CrossRef]
  69. Brackin, R.; Näsholm, T.; Robinson, N.; Guillou, S.; Vinall, K.; Lakshmanan, P.; Schmidt, S.; Inselsbacher, E. Nitrogen fluxes at the root-soil interface show a mismatch of nitrogen fertilizer supply and sugarcane root uptake capacity. Sci. Rep. 2015, 5, 15727. [Google Scholar] [CrossRef] [Green Version]
  70. Dalal, R.C.; Gibson, I.; Menzies, N.W. Nitrous oxide emission from feedlot manure and green waste compost applied to Vertisols. Biol. Fertil Soils 2009, 45, 809–819. [Google Scholar] [CrossRef]
  71. Janssen, B.H. Nitrogen mineralization in relation to C:N ratio and decomposability of organic materials. Plant Soil 1996, 181, 39–45. [Google Scholar] [CrossRef]
  72. Cooperband, L.; Bollero, G.; Coale, F. Effect of poultry litter and composts on soil nitrogen and phosphorus availability and corn production. Nutr. Cycl. Agroecosyst. 2002, 62, 185–194. [Google Scholar] [CrossRef]
Figure 1. Sugarcane biomass per treatment (n = 3) recorded on the final day of the field experiment on 23 September 2015. C no-N control, UA urea (mineral fertiliser), PL poultry litter, PL + BE poultry litter + bentonite, PL + BC poultry litter + biochar, PL + CO poultry litter + compost. Statistical analyses: one-way ANOVA plus Fisher’s LSD post-hoc test. Different letters indicate treatment differences at p < 0.05 level.
Environments 08 00078 g001
Figure 2. Environmental variables of the sugarcane field experiment over a 10-month crop cycle (December 2014 to September 2015, i.e., summer to spring). (a) Daily mean air temperatures (°C) and daily rainfall (mm), (b) mean soil NH4+-N concentrations (mg kg−1; n = 3) in sugarcane rows, (c) mean soil NO3-N concentrations (mg kg−1; n = 3) in sugarcane rows. C control (no-N), UA urea (mineral fertiliser), PL poultry litter, PL + BE poultry litter +bentonite, PL + BC poultry litter + biochar, PL + CO poultry litter + compost. Error bars in (b,c) were omitted for legibility with high variability within treatments.
Environments 08 00078 g002
Figure 3. Greenhouse gas fluxes from sugarcane rows at the experimental field site from December 2014 to September 2015. (a) Mean N2O-N fluxes (mg m−2 h−1; n = 3), (b) mean CH4-C fluxes (mg m−2 h−1; n = 3), (c) mean CO2-C fluxes (mg m−2 h−1; n = 3). C no-N control, UA urea (mineral fertiliser), PL poultry litter, PL + BE poultry litter + bentonite, PL + BC poultry litter + biochar, PL + CO poultry litter + compost.
Environments 08 00078 g003
Figure 4. Mean cumulative N2O fluxes (kg ha kg−1; n = 3) at the experimental field site from December 2014 to September 2015. C control (no N added), UA urea mineral fertiliser, PL poultry litter, PL + BE poultry litter + bentonite, PL + BC poultry litter + biochar, PL + CO poultry litter + compost. LSD at p < 0.05 is 59.5.
Environments 08 00078 g004
Figure 5. Mean cumulative N2O fluxes (± SD; n = 4) with in vitro laboratory incubation (N2O-N kg−1 dry soil). C control (no N added), PL poultry litter, PL + BE poultry litter + bentonite, PL + BC poultry litter + biochar, PL + CO poultry litter + compost. Differences between treatments at p < 0.05 significance are marked by different letters.
Environments 08 00078 g005
Figure 6. Comparison between cumulative field N2O emission estimates and in vitro laboratory incubations. Top pane relates to the entire field trial (y axis), while bottom pane compares results from the first 17 days of field and laboratory experimentation.
Environments 08 00078 g006
Table 1. Mean concentrations (±SD; n = 75) of soil ammonium (NH4+) and nitrate (NO3, mg N kg−1) of sugarcane rows of the first 130 days of the field experiment. Statistical analysis was a ‘repeated measures one-way ANOVA with Fisher’s LSD post-hoc test’ after log-transformation of the data. Significant differences between treatments (p < 0.05) are indicated with different letters within columns.
TreatmentNH4+-N (mg kg−1 Soil)NO3-N (mg kg−1 Soil)
no-N control4.98 ± 7.78 d0.62 ± 0.83 c
Mineral (urea) fertiliser151 ± 216 a7.80 ± 10.10 a
Poultry litter74.0 ± 153 b2.15 ± 3.71 b
Poultry litter + bentonite75.2 ± 152 b1.63 ± 4.92 c
Poultry litter + biochar14.1 ± 26.9 c1.07 ± 2.59 c
Poultry litter + compost17.4 ± 52.8 c3.18 ± 8.86 b
Table 2. Nitrogen application rates, total N2O emissions, and N2O emission factors from the N treatments tested at a commercial sugarcane farm. N2O emissions are mean ± SD of three replicates. Statistical analysis (one-way ANOVA with Fisher’s LSD post-hoc test) was carried out after log-transformation. Differences between treatments at p < 0.05 significance are indicated with different letters.
N Applied as N Applied with
TreatmentFertiliser or
Poultry Litter
(kg ha−1)
Sorbent or Compost
(kg ha−1)
Total N
Applied
(kg ha−1)
Total N2O-N Emissions
(kg ha−1)
Emission
Factor
(% of Applied N)
no-N control un/an/a00.84 ± 0.30 bn/a
Urea (UA)160n/a16013.67 ± 6.82 a8.02 ± 4.26
Poultry litter (PL)160n/a16011.67 ± 6.75 a6.77 ± 4.22
PL + bentonite (BE)1601.831629.74 ± 5.97 a5.50 ± 3.69
PL + biochar (BC)16037.61977.48 ± 3.73 a3.36 ± 1.89
PL + compost (CO)16059.622015.65 ± 10.21 a6.75 ± 4.65
Table 3. Cumulative N2O fluxes (mean ± SD; n = 4) of the in vitro experiment in the laboratory (per kg of dry soil-poultry litter blend). Statistical analyses: one-way ANOVA with Fisher’s LSD post-hoc test. Differences between treatments at p < 0.05 significance are marked by different letters.
TreatmentCumulative N2O-N Emissions (mg kg−1)
Control<0.01 ± 0.00 a
Poultry litter0.40 ± 0.10 b
Poultry litter + bentonite0.43 ± 0.10 b
Poultry litter + biochar0.33 ± 0.05 b
Poultry litter + compost1.16 ± 0.21 c
Table 4. Cumulative CO2-C and CH4-C fluxes (mean ± SD; n = 4) of the in vitro experiment in the laboratory (per kg dry soil-poultry litter blend), with cumulative field emissions shown for comparison. Statistical analyses: one-way ANOVA with Fisher’s LSD post-hoc test. Differences between treatments at p < 0.05 significance are marked by different letters.
Laboratory IncubationField Experiment
Treatment Cumulative CO2-C Emissions
(mg kg−1)
Cumulative CH4-C Emissions
(mg kg−1)
Cumulative CO2-C Emissions
(kg ha−1)
Cumulative CH4-C Emissions
(kg ha−1)
Control64.4 ± 35.2 b353.1 ± 37.4 b5321 ± 154 b0.61 ± 0.11 ab
Poultry litter563.1 ± 87.6 a853.1 ± 87.9 a7554 ± 743 a2.06 ± 0.96 a
Poultry litter + bentonite572.9 ± 67.6 a862.7 ± 65.3 a6664 ± 554 ab2.75 ± 3.12 a
Poultry litter + biochar601.9 ± 63.4 a881.6 ± 60.6 a7040 ± 1360 a1.19 ± 1.12 ab
Poultry litter + compost646.2 ± 52.3 a921.2 ± 51.6 a7176 ± 1011 a1.56 ± 1.66 ab
Publisher’s Note: MDPI stays neutral with regard to jurisdictional claims in published maps and institutional affiliations.

