Article

Long-Term Eutrophication and Dynamics of Bloom-Forming Microbial Communities during Summer HAB in Large Arctic Lake

by
Nikolay Kashulin
1,
Tatiana Kashulina
2 and
Alexander Bekkelund
2,*
1
INEP, RAS, 184209 Apatity, Russia
2
Creek-Bio, 0151 Oslo, Norway
*
Author to whom correspondence should be addressed.
Submission received: 17 May 2021 / Revised: 11 August 2021 / Accepted: 13 August 2021 / Published: 17 August 2021

Abstract

:
Harmful algal blooms (HABs) in arctic lakes are recent phenomena. In our study, we performed a long-term analysis (1990–2017) of the eutrophication of Lake Imandra, a large subarctic lake, and explored the biodiversity of bloom-forming microorganisms of a 2017 summer HAB. We performed a 16Sr rRNA metabarcoding study of microbial communities, analysed the associations between N, P, C, and chlorophyll concentrations in the lake water, and developed models for the prediction of HABs based on total P concentration. We have demonstrated that blooms in Lake Imandra occur outside of optimal Redfield ratios and have a nonlinear association with P concentrations. We found that recent summer HABs in a lake occur as simultaneous blooms of a diatom Aulacoseira sp. and cyanobacteria Dolichospermum sp. We have studied the temporal dynamics of microbial communities during the bloom and performed an analysis of the publicly available Dolichospermum genomes to outline potential genetic mechanisms beneath simultaneous blooming. We found genetic traits requisite for diatom-diazotroph associations, which may lay beneath the simultaneous blooming of Aulacoseira sp. and Dolichospermum sp. in Lake Imandra. Both groups of organisms have the ability to store nutrients and form a dormant stage. All of these factors will ensure the further development of the HABs in Lake Imandra and the dispersal of these bloom-forming species to neighboring lakes.

1. Introduction

Lake Imandra is the largest freshwater lake located in the southwestern part of the Kola Peninsula, Russia. The lake has a complex natural shape and is subdivided into three major parts connected by narrow straits with strong currents (Figure 1). The lake has a surface area of 876 km2, an average depth of 16 m, and a maximum depth of 67 m and is used for hydropower generation. The lake catchment area (12,342 km2) is crowded, with various mining sites dumping their wastewater into the lake and storing tailings nearby. The area is populated by approximately 80,000 people, and along with industrial effluents, the lake receives treated municipal wastewater from three settlements [1]. The apatite processing industry is a major source of phosphorous for Lake Imandra, while the mining industry (MI) and municipal wastewater (MWs) are sources of nitrogen. The average mineralization of the lake water has increased 2.3 times from 27.7 mg/L in 1950 to 64.2 mg/L in 2017 due to the excessive input of various soluble organic compounds as well as soluble inorganic compounds, including mineral macronutrients. The load distribution is not equivalent among the major parts of the lake [2]. According to our estimations, the most eutrophic part of the lake, Bolshaya Imandra (average mineralisation: 73.2 mg/L), receives 1233 tonnes of anthropogenic nitrogen (N) and 300 tonnes of phosphorous (P) annually. The two remaining parts of the lake, Jokostrovskaya Imandra (average mineralisation: 68.1 mg/L) and the least eutrophic part, Babinskaya Imandra (average mineralisation: 40.9 mg/L), receive anthropogenic loads as part of the water currents from Bolshaya Imandra and are not directly connected to any point sources of anthropogenic pollution [2,3]. Historical data has indicated an 11 m Secchi disk depth (transparency) for Lake Imandra at the beginning of the 20th century. In 1978, the Secchi disk depth (transparency) was reduced to 1.9 m [4], and this parameter is no longer used, as the transparency of the water in Lake Imandra is reduced even more due to the proliferation of microalgae during the ice-free period [2,3]. The lake is ice covered for at least 6 month during the year, and active primary production primarily takes place in June, July, and August [5].
The seasonal dynamics of the planktonic communities vary between different parts of the lake and correlate in general with the concentrations of macronutrients. For the least eutrophic areas (southern part of Jokostrovskaya Imandra and Babinskaya Imandra), the biomass of the phytoplankton reaches the summer maximum in July and is normally dominated by diatoms and/or Chlorophyta spp. [3]. Heavily eutrophic Bolshaya Imandra and the northern part of Jokostrovskaya Imandra have multiple planktonic biomass peaks formed by blooming diatoms, dinoflagellates, and Chrysophyta, Chlorophyta, and Cyanobacteria species. Summer blooms in Bolshaya Imandra and the northern part of Jokostrovskaya Imandra start with the succession of diatoms and is usually dominated by Aulacoseira islandica [1,2,3]. The proliferation of diatoms may be accompanied by an increase in the biomass of mixotrophic Dinobryon spp. (Chrysophyta), described as early spring bloom formers in oligo- and mesotrophic aquatic ecosystems [6,7,8]. Planktonic biomass during diatom blooms exceeds 20 g/m3 and gradually decreases during the summer. Based on the results of manual taxonomic analysis, the earlier described blooms occurring at the end of July and the beginning of August are formed by dinoflagellates (Ceratium hirundinella, Peridinium aciculiferum, and Peridinium goslaviense), Chlorophyta (Mucidosphaerium spp., Micractinium spp., Paulschulzia spp., Eudorina spp., Hindakia spp., and Pseudopediastrum spp.), or cyanobacteria species (Dolichospermum spp., Anabaena spp., and Coelosphaerium spp.) [1,2,3,9].
Cyanobacteria in Lake Imandra demonstrate typical generalist species characteristics, as their blooming may suddenly occur in any part of the lake. Various cyanobacterial species are recorded in planktonic samples from May to October and normally yield between 0.25 and 4.3 g/m3 planktonic biomass. The most intensive blooming was observed in Bolshaya Imandra and the northern part of Jokostrovskaya Imandra, with cyanobacterial biomass reaching 25–31 g/m3 at the peak of blooming [3]. According to our earlier published manual taxonomic identifications, the most intensive blooms are formed by Dolichospermum lemmermannii, creating thick green films on the surface of the lake, and are accompanied by high fish mortality (Figure 2). D. lemmermannii blooms may develop as soon as the water temperature exceeds 16 °C and predominantly begin in semi-closed bays with little or no current [1,3,9]. Blooming over large open areas occurs during wind-free periods and is relatively rare. September blooms take place at water temperatures of approximately 7–8 °C and may be formed by Anabaena contorta, Anabaena ellipsoides, Anabaena subcylindrica, Dolichospermum circinale, Dolichospermum planctonicum, and Dolichospermum spiroides, as identified by manual taxonomic analysis [1,9].
All prior studies of the phytoplankton in Lake Imandra were performed using traditional manual taxonomic identification techniques and thus provided limited data on the entire biodiversity and co-occurrence of the bloom-forming species. In this paper, we present the results of a long-term analysis of the eutrophication of the lake, associations of the planktonic biomass with environmental parameters and metabarcoding analysis of the typical recent summer bloom in Lake Imandra. The sampling station was placed in the vicinity of Jokostrov Island, which is located at the intersection of the two most eutrophic parts of the lake (Figure 1). We also report nonlinear regression models allowing the prediction of the HABs for Lake Imandra based on the P concentrations in surface water samples. Our study is the first 16S rRNA metabarcoding study of a summer HAB conducted for a heavily eutrophic subarctic lake in Fennoscandia, and for the first time, we suggest nonlinear regression models as tools for the prediction of the HABs based in arctic lakes based on P concentrations in surface water samples.

2. Materials and Methods

2.1. Hydrochemical Analysis

Water samples were collected between 1990 and 2017. The sampling was performed according to the standardised national and international guidelines for the collection of water samples for environmental monitoring. Analysis of the hydrochemical parameters was performed at the ISO17025:2009 compliant laboratory certified by the Russian Federal Agency on Technical Regulation and Metrology (Certificate РОСС RU.0001.517126). The methods used in the current study are described in detail in respective ISO standards. The concentration of total organic carbon [10] was determined as described in ISO 8467:1993 (2019) by heating a sample in a boiling water bath with a known amount of potassium permanganate and sulfuric acid. The amount of consumed permanganate was determined by the addition of oxalate solution followed by titration with potassium permanganate. Concentrations of total phosphorus [11] and PO43− ions were measured by the ammonium molybdate spectrometric method after potassium persulfate decomposition [11] and digestion with sulfuric acid (PO43−) as described in ISO 6878:2004(2019). The concentration of total nitrogen [12] was measured spectrometrically in the presence of Griess reagent after treatment of the samples with peroxodisulfate and subsequent cadmium reduction to NO2 (ISO 11905-1:1997(2019)). The concentration of NO3 was measured with a conductivity detector after ion exchange chromatography separation (ISO 10304-1:2007 (2016)). The concentration of NH4+ was determined as described in ISO 7150-1:1984 (2017). The concentration of chlorophyll-a (Chl-a) was determined spectrometrically after acetone extraction (ISO 10260:1992 (2017)).
Calculation of the lake critical phosphorus loading (CLP) level was performed according to the method suggested by Vollenweider [13]. The actual annual phosphorous loads (LP) were calculated according to the method proposed by Kirchner and Dillon [14] by using the average annual concentration of P in water for the respective year.

2.2. Prediction of Chlorophyll-a Concentrations and Visualization of TC/TN/TP/Chl-a Ratios

LOESS regressions [15] were built based on chlorophyll-a concentrations measured for sets of lake water samples collected in 2012. Modelling was performed in the R environment [16], and results were visualized using the ggplot2 package [17]. The LOESS (LR) models were used to predict Chl-a levels based on total P concentrations observed in 1990–2011 and 2013–2017. Both the predicted and measured Chl-a concentrations were used for the visualization of TC/TN/TP/Chl-a ratios in the ternary graphical system suggested by Smith et al. [18]. Linear regression analysis and PCA as well as visualization of the TC/TN/TP/Chl were performed in R [16] using integrated functions/ggplot2 visualization [17] and the ggtern package, respectively [19].

2.3. DNA Preparation and Processing

The surface water samples were collected from a boat using sterile one litre bottles (67.595249 N; 33.003494 E). The bottles were sealed and were transported to the shore, where in the laboratory, the 1 L water samples were filtered through standard line bottle top filters (VWR) with 0.22 µm membranes. Membranes were used for DNA extraction with a DNeasy PowerWater Kit (QIAGEN). The blooming intensity and the respective time points for sample collection were determined based on the total chlorophyll-a concentrations. The extracted DNA was quantified, accessed for purity, and used to generate 16S amplicons with primers specific to the V1-V3 hypervariable region (27F-AGAGTTTGATCCTGGCTCAG and 534R-ATTACCGCGGCTGCTGG). The library was prepared using the Nextera XT DNA Library Prep Kit (Illumina). The amplicons were analysed using an Illumina MiSeq sequencer in 2 × 300 bp paired-end read sequencing mode and a 600-cycle v3 MiSeq Reagent Kit. The raw sequencing reads are available from the NCBI through BioProject accession number PRJNA526000.

2.4. Analysis of Bacterial Communities

Analysis of microbial communities was performed using the Quantitative Insights into Microbial Ecology pipeline [20]. The raw sequence reads were trimmed and filtered by quality score to retain sequences with a base call > Q20. The taxonomic analysis was performed using the Greengenes 13.8 16S rRNA database [21]. The naive Bayes classifier [22] was trained using the V1-V3 primer pair 27F (AGAGTTTGATCCTGGCTCAG) and 534R (ATTACCGCGGCTGCTGG), and the same primers were used for the generation of amplicons. For general differential abundance analysis, an operational taxonomic unit (OTU) table was created using the DADA2 pipeline [23]. Differential abundance analysis of the filtered table was performed in QIIME2 using the Gneiss algorithm [10]. The analysis of correlations between the groups of microorganisms and environmental factors was performed in R [16], and the results were visualized with ggplot2 [17].

2.5. Analysis of the Publically Available Dolichospermum Genomes

Analysis of the NCBI available Dolichospermum genomes (NZ_AP018316.1 and NZ_CP043056.1) was performed locally using the BLAST+ algorithm and a key procaryotic B1 and B12 vitamins biosynthesis enzyme sequence as a query. Statistically significant matches were curated manually and were verified against the UniProt database to confirm the predicted biosynthetic functions.

3. Results

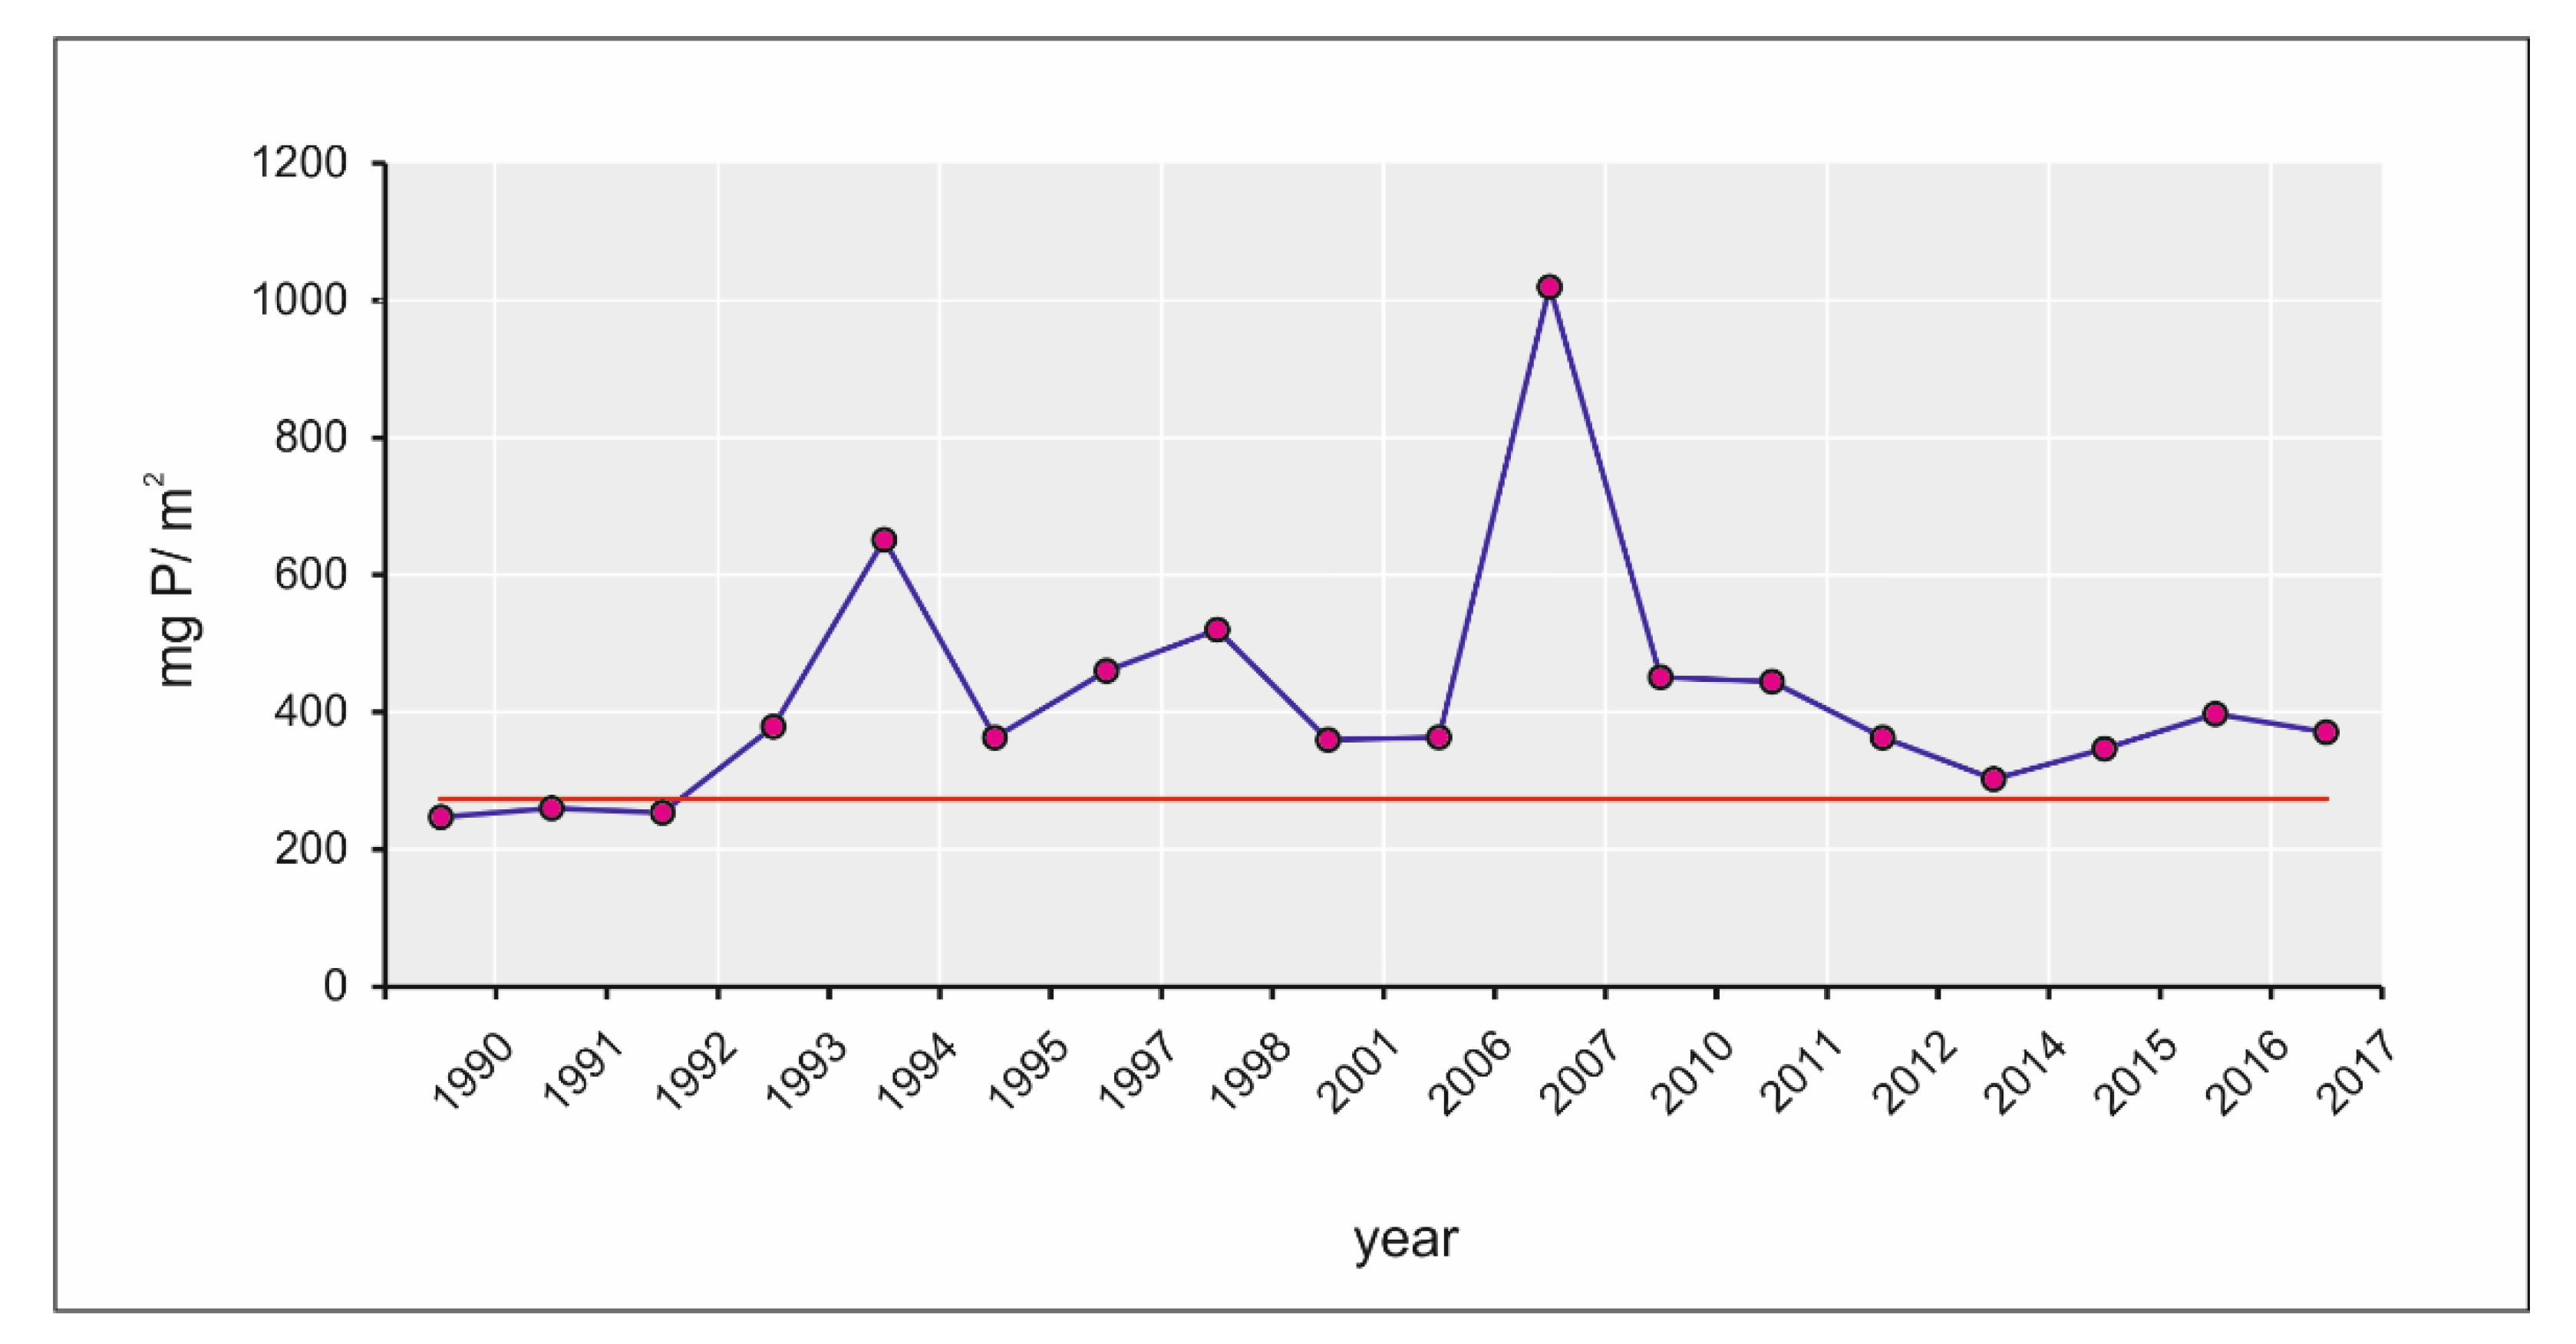
3.1. Eutrophication Dynamics

Lake Imandra has a complex snow/groundwater/river water feeding regime. The contribution of each factor greatly depends on the season. In the winter, the lake is mainly fed by groundwater and rivers, while in spring, snowmelt has a greater impact on its hydrological regime. The only outlet from the lake is used for hydropower generation, and as a result, the lake has a relatively slow water exchange rate (Table 1). It takes 2.38 years to completely exchange the water in the lake, which, in turn, makes the lake highly sensitive to the excessive input of macronutrients.
The general decline in industrial activities in 1986–1993 had positive effects on the eutrophication of the lake. The study site used for metabarcoding analysis was located at the intersection of the two most eutrophic parts of the lake. Between 1990 and 2017, the annual critical load of anthropogenic P was not exceeded in 1990–1991. In 1992–2017, the annual critical phosphorous load exceeded the critical load by 1.1–3.7 times (Figure 3). The annual average concentrations of the main macronutrients in the lake water in 1990–2017 exceeded the initial parameters of the lake water recorded in 1930, as it contained 0–35 µg/L NO3 and 0–8 µg/L PO43− [5]. The main physicochemical parameters of the surface water vary in different areas of Lake Imandra and correlate with the localisation of the eutrophication sources, river inlets, and the directions of the currents. The NH4/NO3 balance is typically shifted towards NH4 ions in Jokostrovskaya Imandra and reflects the decomposition of the organic matter in the sediment. NO3 ions are dominant in water samples collected from Bolshaya Imandra, which receives the mining wastewater enriched with both NO3 and P. N and P concentrations both have seasonal and annual variations and depend on the intensity of the mining and enrichment activities of API. In the summer months, the concentrations of the main macronutrients are greatly affected by proliferation of the photosynthetic microorganisms actively consuming excessive N and P from the lake water. The average physicochemical parameters of the surface water of different parts of the Lake (Table 2) remained relatively stable over the years, as no new API processing plants or mines were opened in the area in 1990–2017.

3.2. Nutrient Stoichiometry and Chlorophyll-a

The training datasets for the generation of the LR regression models were based on total phosphorous concentrations and concentrations of chlorophyll-a (Figure 4) measured for the same sampling points during July 2012. The LR curves describing the relationships between the TP and Chl-a concentrations have dual Chl-a concentration peaks that are specific to each part of the lake and represent the blooming events that took place in July 2012 (Figure 5a). The sampling site was placed at the intersection of the two most eutrophic parts of the lake to cover the entire range of chlorophyll and TP concentrations. The PCA (Figure 5b) also demonstrated three distinct TP and Chl-a concentration distribution patterns for different parts of the lake, thus supporting the results of the LOESS regression modelling.
Regular cyanobacterial blooming in Lake Imandra started in 2000, while irregular blooming had been observed prior to 2000, since 1993. Plotting TOC, TP, and TN alongside Chl-a concentrations for the period between 1993 and 2017 demonstrated that the Chl-a concentrations followed the TP and NT concentrations (Figure 6b). Correlation analysis of associations between the two hydrochemical parameters and Chl-a concentrations supported this observation, as TP/Chl-a had a strong positive correlation (r = 0.86, p < 0.05), and TN/Chl-a had a medium positive correlation (r = 0.66, p < 0.05). The associations between TOC and Chl-a were not significant.
In the ternary diagram, the parameters of all of the studied samples are located away from the optimal Redfield value, and thus, a balanced C/N/P ratio is not needed for the development of cyanobacterial blooms in Lake Imandra. All points are clustered in the same area of the ternary diagram and to a great extent only differ in chlorophyll concentrations. The blooming in 1993–2017 occurred under N- and P-limited conditions for plankton if judged based on the Redfield optimal ratio (Figure 6b).

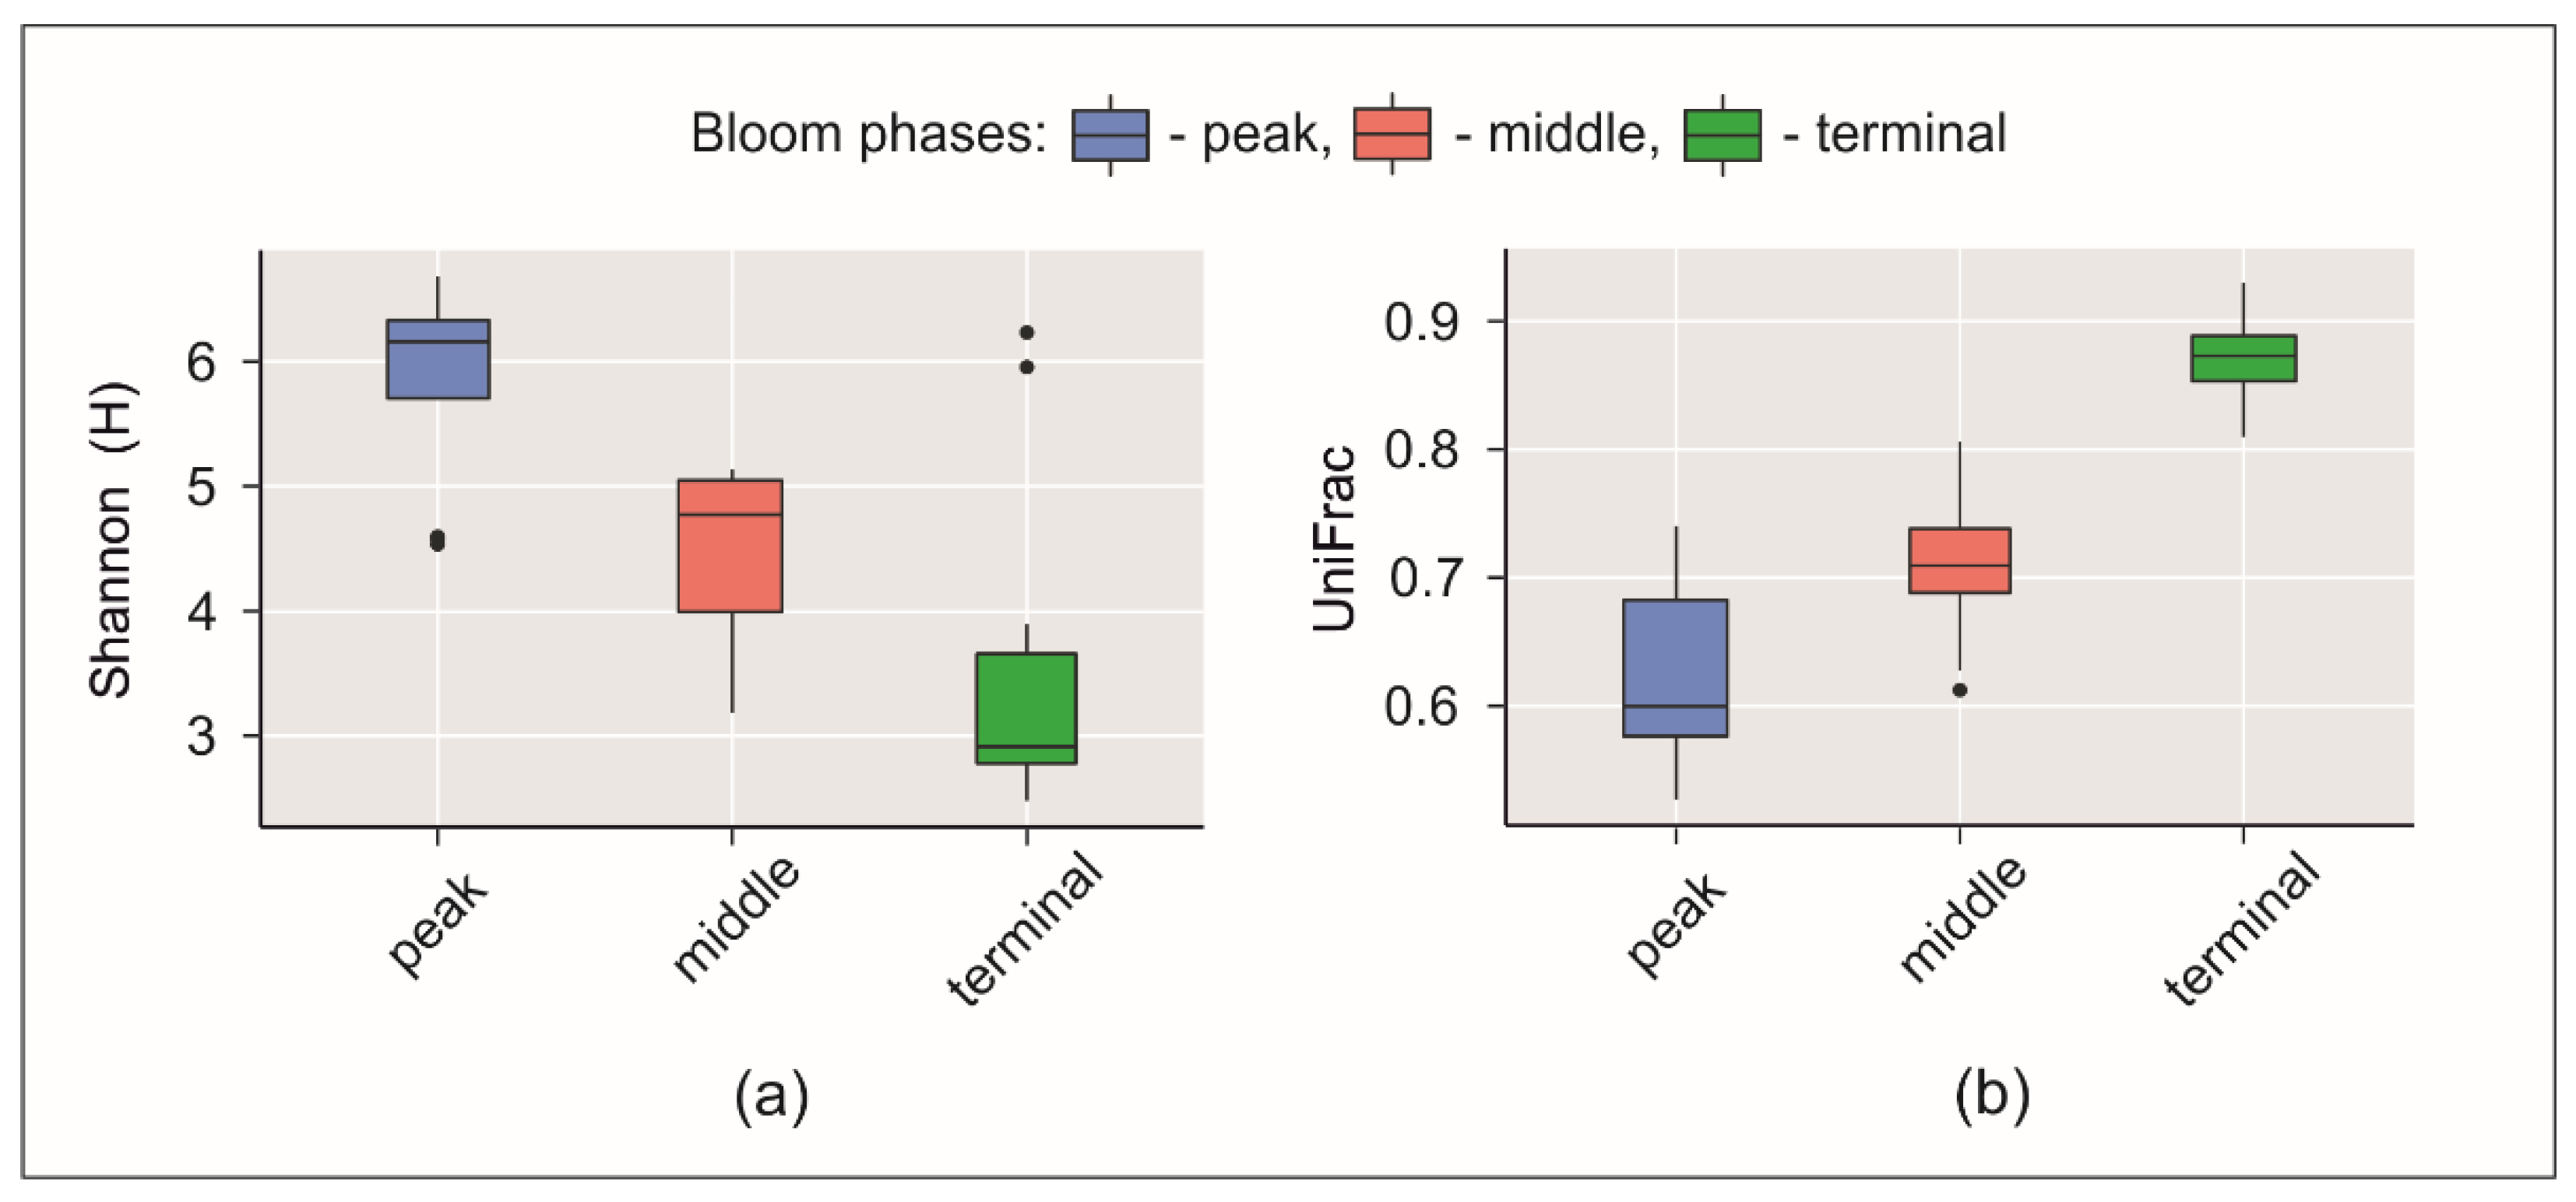
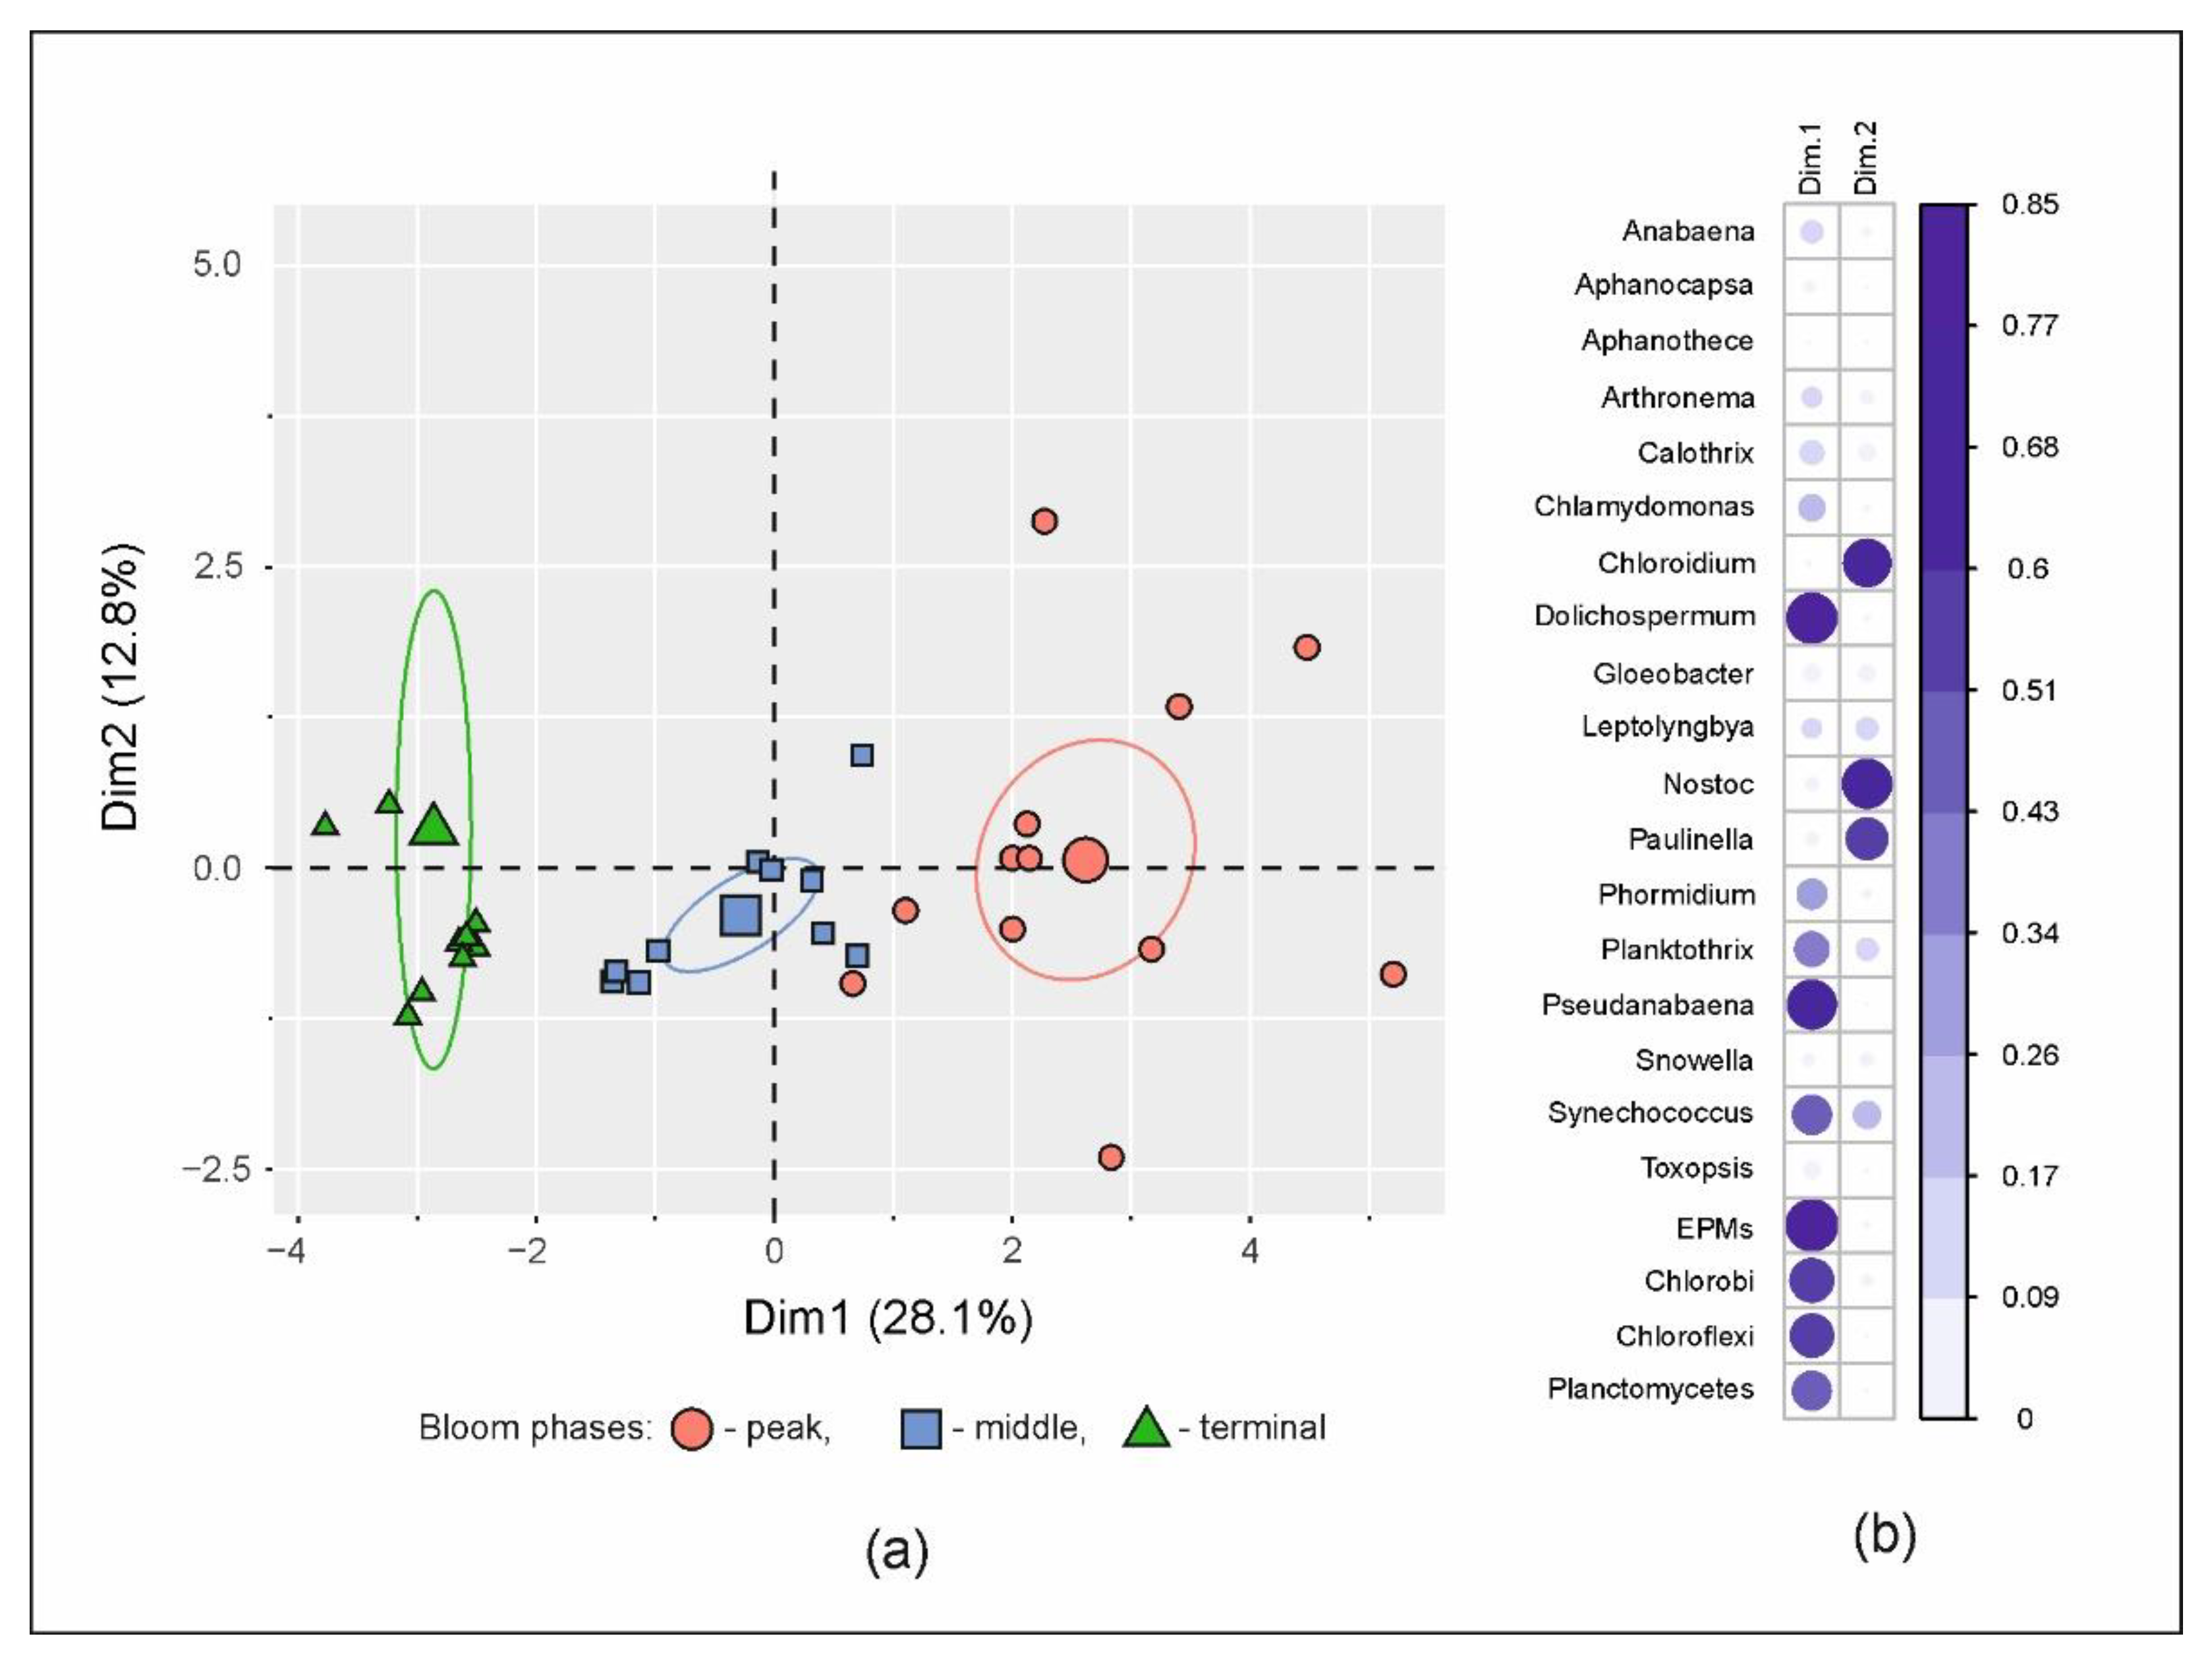
3.3. Microbial Communities

In the current study, we used primers in the V1-V3 16S rRNA region, allowing for the amplification of bacterial and chloroplast 16S rRNA sequences. The amplicons obtained from eukaryotic photosynthetic microorganisms (EPMs) were included in the analysis, and the relative abundances of the OTUs were calculated considering the relative abundances of the OTUs derived from both the prokaryotes and chloroplasts of EPMs.
We identified 37 bacterial phyla among the whole set of the studied samples. The prokaryotic communities were dominated by Proteobacteria, Bacteroidetes, Actinobacteria, Verrucomicrobia, Planctomycetes, and Cyanobacteria followed by members of other less abundant taxa. A total of 18 of 37 prokaryotic phyla comprised unclassified microorganisms having no significant 16S rRNA similarities with the cultured and characterised bacterial species. An analysis of the alpha and beta diversity performed for both prokaryotes and EPMs showed statistically significant changes (p < 0.05) in the biodiversity and relative abundances of the species at the peak, middle, and terminal blooming phases identified based on the total chlorophyll-a concentrations. Shannon’s H index dropped three times between the peak and the end of blooming (Figure 7a) through a dramatic decrease in the relative abundances of the EPM species.
Amplicons derived from photosynthetic microorganisms on average comprised 34.0% of the total microbial population during the blooming peak, 18.6% during the middle of the blooming period, and only 1.69% at the end of the blooming period. The photosynthetic communities at the peak and middle phases of the blooming period were dominated by EPMs that made up 24.92% and 16.98% of the total number of amplicons, respectively. At the end of the blooming period, the EPMs were found in only 3 of 10 studied samples on average, comprising 0.15% of the total number of amplicons. The death of the EPMs was accompanied by 18.62%, 0.76%, 0.12%, and 25.56% increases in the mean relative abundances of Proteobacteria, Firmicutes, Fusobacteria, and unclassified prokaryotic organisms, respectively, leading to significant changes in beta-diversity metrics (Figure 7b). Chlorobi, Chloroflexi, and Planctomycetes detected in our samples had statistically significant associations with several cyanobacterial genera and EPMs (Figure 8). Their mean relative abundances at the peak of blooming, however, ranged between 0.07% and 0.8% of the total microbial population.
PCA showed that changes in the relative abundances of EPMs and eight Cyanobacterial genera (Dolichospermum, Pseudanabaena, Nostoc, Chloroidium, Paulinella, Synechococcus, Planktothrix, and Phormidium) made the largest contribution to the distribution of the data in two-dimensional coordinates (Figure 9). The pool of EPM amplicons comprised OTUs assigned to Bacillariophyta, Chlorophyta, Euglenozoa, Haptophyceae, Stramenopiles, and Streptophyta. EPM OTUs at the peak of blooming were dominated (24.1%) by a single amplicon derived from a diatom Aulacoseira sp. (Bacillariophyta). All of the remaining OTUs thus comprised 0.82% of all of the amplified sequences and therefore likely had no major impact on the environmental consequences of the bloom. In the middle of the bloom, the mean relative abundance of the dominant OTU dropped to 16.34%, and at the end of the bloom, this amplicon was not detected in any of the studied samples (Figure 10).

3.4. Putative Genetic Triats Beneath Simultaneous Blooming

At present, the NCBI nucleic acid archive contains two fully sequenced genomes of Dolichospermum sp., both containing genes essential for the synthesis of B1 and B12 vitamins. The prokaryotic B1 biosynthesis pathway requires at least four enzymes. Searches of the genomes of Dolichospermum compactum (NZ_AP018316.1) and Dolichospermum sp. (NZ_CP043056.1) showed that both species contain all four genes required for thiamine biosynthesis (ThiC > ThiD > ThiN > ThiL). The thiamine phosphate synthase ThiC is a key enzyme that is responsible for the biosynthesis of the aminopyrimidine ring of the thiamine molecule, and ThiL is responsible for the final stage of the biosynthetic process or formation of thiamine diphosphate from thiamine monophosphate. De novo biosynthesis of vitamin B12 or cobalamin requires approximately 30 biosynthetic genes and may occur through the aerobic or anaerobic pathway. Several cobalamin biosynthesis genes are shared by two pathways, but both have enzymes specific to each pathway. Our analysis has shown the presence of homologs of at least five key cobalamin biosynthesis enzymes in both available genomes. The CobE protein participates in the conversion of cobalt-precorrin 5 into cobalt-precorrin 6; CobD is involved in cobalamin biosynthesis and is likely responsible for conversion of adenosylcobyric acid to adenosylcobinamide or adenosylcobinamide phosphate; CobW is involved in the storage of cobalt ions prior to their use in cobalamin biosynthesis; the CobQ protein catalase amidations at positions B, D, E, and G in adenosylcobyrinic A,C-diamide intermediates; and the CbiM protein is a part of the transporter complex CbiMNOQ, which is involved in cobalt import.

4. Discussion

4.1. Selection of the Primers

The current version of Illumina dye sequencing technology allows the amplification of 2 × 300–350 bp DNA fragments; thus, the precision of microbiome analysis greatly relies on the selected primers. The microbial 16S rRNA gene has approximately 1600 base pairs and consists of nine hypervariable regions. Amplification of conserved regions the allows reliable identification of higher taxa, while analysis based on quickly evolving areas may provide better discriminating power at the genus or even species level. A number of studies have shown that the selection of the area for amplification influences the outcome of taxonomic identification [24,25]. At the same time, the selection of primer pairs did not affect the ecological interpretation of the results for planktonic communities, as the identified taxa had similar correlation patterns for all primer pairs [26]. A study by Parulekar et al. comparing the performance of the V1-V3 and V3-V4 primer pairs for eutrophic lakes in southern Norway showed that the two primer pairs equally identified Cyanobacteria, Proteobacteria, Actinobacteria, Acidobacteria, and Parcubacteria, while Bacteroidetes, Verrucomicrobia, Armatimonadetes, Firmicutes, and Planctomycetes were better represented in the samples amplified with the V3-V4 pairs [27]. Chloroplasts are of cyanobacterial origin, and thus, prokaryotic primers adequately amplifying cyanobacterial 16S rRNA sequences provide good insight into the biodiversity of eukaryotic species containing chloroplasts [28]. Due to the variations of the chloroplast copy numbers [11] the approaches based on 16S rRNA are not suitable for the absolute quantification of the OTUs; at the same time, the use of relative abundances of the OTUs allow the reliable and statistically significant comparison of the various phases of the blooming events. Our study was focused on the blooming dynamics of photosynthetic organisms in general (both pro- and eukaryotic), and thus, we selected V1-V3 primer pairs for the generation of amplicons.

4.2. Concentrations of Macronutrients and Chlorophyll-a

The results of hydrochemical and chlorophyll-a concentration analysis demonstrate that these parameters greatly vary among the parts of the lake. In both Bolshaya Imandra and Babinskaya Imandra, the NH4+/NO3 balance was shifted towards NO3 ions, while in Jokostrovskaya Imandra, the NO3 ions were depleted. This can be explained by ongoing diatom blooms. Comparative studies of the uptake of NH4+/NO3 have shown that diatoms prefer NO3 uptake over NH4+ assimilation and have developed efficient mechanisms for the storage and reduction of NO3 ions [29,30]. The reduction of the stored NO3 ions to ammonium is used by diatoms to survive dark and anoxic conditions in the bottom sediment and may occur through two groups of metabolic pathways. The first group comprises the so-called dissimilatory pathways that reduce nitrate to ammonium, and the second group consists of several pathways that reduce nitrate to NO2, N2O, or N2. NO3 uptake by diatoms occurs strictly in the presence of oxygen and thus takes place in oxygenated subsurface layers. This correlates with the depleted NO3- concentrations in the surface water layers and with the increased concentrations near the bottom. The sinking of the diatoms may thus contribute to the vertical transport of accumulated NO3- ions to bottom sediment [31]. The increase of chlorophyll-a concentrations in the water samples normally begins in early June and correlates with the proliferation of various Diatom or Dinobryon species. The contribution of cyanobacteria to a total planktonic biomass is insignificant at the beginning of the summer, as their biomass rarely exceeds 0.1 g/m3. The extensive proliferation of the cyanobacteria begins at the end of July and may reach 31 g/m3 during the August or September blooms if the conditions are favourable [2,3]. In the current study, we demonstrated for the first time that Diatoms and cyanobacteria may form a combined bloom in an arctic lake.

4.3. HABs in Arctic Waters

The algal blooming in arctic lakes is a recent phenomenon. In temperate climates, the blooming may be accompanied by the release of the toxins or may be formed by a non-toxin producing species. The blooms in Lake Imandra are formed by both pro- and eukaryotic microalgae or their simultaneous proliferation. All blooming events recorded by our group in Lake Imandra in 1990–2017 coincided with fish death of various intensities. The magnitude of the mortality was the highest during cyanobacterial blooms, while blooming of EPMs had a less noticeable impact on the fish population in general. The majority of cyanobacterial communities in pristine arctic waters exist in the form of algal mats attached to abiotic substances or moss filaments. Suspended native cyanobacterial species predominantly belong to Picocyanobacteria, whose surface-to-volume ratio allows them to form up to 30–60% of the planktonic biomass in oligotrophic arctic waters [32]. Bloom-forming species such as Anabaena, Microcystis, and Aphanizomenon are considered invasive species in arctic and are only present in eutrophic water basins [32]. The stoichiometric combination 106C:16N:1P, referred to as the Redfield ratio, is considered to be optimal for algal proliferation [18]. We have demonstrated that blooming in Lake Imandra occurs outside of the optimal Redfield ratio and takes place under conditions that are defined as N- and P-depleted for plankton. Imandra Lake undergoes the complex blooming, as the proliferation of diatom Aulacoseira sp. is accompanied by the intensive increase of biomass of the diazotrophic cyanobacterium Dolichospermum sp. This correlates with the findings of other authors also showing that cyanobacterial HABs may occur under both N- and P-limited conditions. In this case, the blooming species rely on N2-fixation and P-scavenging pathways [33]. The availability of easily accessible nutrients has a significant impact on the environmental consequences of the cyanobacterial blooms. Experiments conducted on microcystin-producing Planktothrix species have shown higher levels of toxin production in response to the addition of dissolved N and the highest levels have occurred in response to NH4+/urea + PO4 combinations [34]. Increasing levels of N and P in the water of Lake Imandra will thus further promote HAB development, and increased fish mortalities should be expected in future. Individual cyanobacterial genera and strains respond differently to various N/P combinations; thus, the selective management of these macronutrients [35,36] combined with the management of blooming communities are required to control cyanobacterial blooms in Lake Imandra and other artic lakes. Controlling of the N/P concentrations alone will likely have a minor impact on the blooming, as cyanobacteria have developed nutrient scavenging mechanisms as well as mechanisms for the accumulation of storage lipids and carbohydrates [37,38]. Peculiarities in metabolism in combination with a simple genetic apparatus lead to high mutation rates, which, in turn, constantly create new genetic forms of these microorganisms [39,40]. In addition to ordinary binary fission, some species of photosynthetic bacteria are able to form baeocytes [41,42], which are often motile and are used for dispersion into new niches [41]. Some cyanobacteria form dormant akinetes, allowing them to survive for decades while experiencing starvation in lake sediment or to travel long distances following airflows or various carriers [43]. The measures for controlling baeocytes and the germination of dormant akinetes from lake sediment should also be considered for the efficient restoration of the ecosystem of the Lake Imandra.

4.4. Putative Genetic Triats and Adaptations Beneath Simultaneous Blooming

Dolichospermum is adapted to growth at low temperatures, has a low demand for nutrients and is able to accumulate phosphates [44]. Trichomes of Dolichospermum can migrate within the euphotic zone in search of optimal photosynthesis and nutrient gradients, and thus, these species will likely develop blooms if present in the environment [45]. Dolichospermum spp. form two types of nonvegetative akinetes [46] surrounded by an additional cell envelope and contain storage glycogen [47] and cyanophycin granules [48]. The early summer akinetes are formed soon after the extensive bloom and may cause subsequent blooms within the same season if the conditions are favourable [46].
Repeated summer blooming was observed in Lake Imandra starting in 2000, indicating that the formation mechanisms of summer akinetes are active and are used by Dolichospermum sp. under arctic conditions. The formation of late-summer akinetes [43,49] is triggered by light intensity and is used for the long-term survival and formation of next year blooms in Imandra Lake. The late summer akinetes of Dolichospermum are able to survive in sediment for decades. Salmaso et al. successfully germinated akinetes of Dolichospermum from 1989 sediment cores and determined that the establishment of the species coincided with the beginning of a rapid increase in total phosphorus concentration in the studied lake [45]. The germination of dormant akinetes does not require external N and P, as these elements are initially supplied by stored cyanophycin and glycogen. Studies conducted on the akinetes of two Dolichospermum species blooming in warmer climates have shown that the optimal temperature for their germination is approximately 20–25 °C. Incubation in this temperature interval synchronized the germination of akinetes and directly resulted in blooming [50]. Temperatures of 20–25 °C are rarely observed, even in the surface water layers of Lake Imandra, and have never been recorded for the bottom layers. We have not found any studies describing the low-temperature germination of Dolichospermum sp. to date, but cyanobacteria with low germination temperature optima indeed exist. Anabaena flos-aquae flourishes at water temperatures from 10 to 29 °C, with the most active akinetes germinating between 8 and 12 °C [51]. Light intensity is the second factor that triggers germination. The abundance of akinetes in the uppermost centimetre of the sediments of profundal sites is approximately 20 times higher than in the littoral zone, thus indicating that germination occurs in the shore areas. The akinetes formed over deep areas or that drift to profundal sediments are excluded from the seed bank [52]. Under normal conditions, the deep sediment layers in Lake Imandra are never exposed to sufficient light and temperature, but the reduction of the water level due to hydropower generation returns deposited akinetes into the active pool and promotes blooms in the lake.
Diatoms are surrounded by extracellular silicon dioxide shells [53]. Plastids of autotrophic diatoms lack thylakoid subdomains and have a random distribution of photosystems I and II, providing direct energy transfer between the photosynthetic complexes. The photosynthesis efficiency is thus higher in diatoms than in the chloroplasts of plants [54]. Diatoms quickly absorb nitrogen in NO2, NH4+, NO3, and organic forms though various transporters but have no N2-fixing apparatus and thus rely on intracellular N recycling or symbiotic relations under N-limited conditions [30]. The phenomenon of diatom diazotroph associations (DDAs) has been widely described for marine diatoms, as nitrogen starvation is more prevalent in marine environments [55]. N2-fixing bacteria may occur as ectosymbionts, partial symbionts or endosymbionts, and their location is regulated by the host [56]. The benefits of symbiosis with prokaryotes are not limited to the supply of N-rich substrates, as diatoms are dependent on external vitamin sources [57,58]. It has been shown that Daphnia actively grazing on Aulacoseira spp. [59] and thus simultaneous blooming with toxin producing Dolichospermum species might provide additional advantages protecting Aulacoseira spp. from potential grazers [12,60]. The lifecycle of Aulacoseira spp. does not include the formation of dormant spores, but instead, the cells enter the altered resting state with reduced chloroplasts. The resting state as well as revitalisation into a fully active state is triggered by the light conditions and may take as little as 8 h in Aulacoseira subarctica. The turbidity of the water and the thickness of the water level over the sediment containing the resting cells are thus important for the revitalisation of the Aulacoseira spp. into the active state [61].
We have studied repeated summer HABs in Lake imandra since their beginning in 2000 using manual taxonomic techniques. While both species were detected in water samples in different time points, we were not able to depict fine interplay between the diatom Aulacoseira sp. and cyanobacteria Dolichospermum sp. during the earlier HABs due to the limitations of the manual methods. Advances in the development of molecular tools not only allowed the discovery of the interplay between two species, but also allowed us to examine their genomes. The discovery of the presence of the key vitamin B1 and B12 biosynthetic genes in the genomes of Dolichospermum sp. reported in our study as well as the availability of experimental evidence on the symbiotic relations between diatoms and prokaryotes published by other authors allow us to suggest that the simultaneous succession of Aulacoseira sp. and Dolichospermum sp. during summer HABs in lake Imandra is not incidental and relies on symbiotic relationships between the two species.

5. Conclusions

In the current study, we performed a long-term analysis of the eutrophication dynamics of Lake Imandra, a large subarctic lake, and performed metabarcoding analysis of a typical summer HAB accompanied by high fish mortality. Our data demonstrate that the lake is enriched with nutrients and that the annual input of macronutrients from the API and municipal wastewater exceeds the theoretical permissible nutrient load. We also found that summer HABs in the lake are formed by the simultaneous blooming of diatom Aulacoseira sp. and a microcystin-producing Dolichospermum sp. Both blooming species have mechanisms for the accumulation of nutrients and entry into dormant stages, allowing long-term survival as well as dispersion into neighbouring bodies of water. Both organisms are able to form symbiotic relationships, likely laying beneath their coordinated succession. Simultaneous blooming of various groups of photosynthetic microorganisms capable of forming dormant stages in an initially oligotrophic arctic lake indicate that its ecosystem has dramatically transformed, and in the future, we should expect an increase in HAB magnitude in Lake Imandra.

Author Contributions

Conceptualization, N.K., T.K. and A.B.; methodology, N.K., T.K. and A.B.; software, A.B.; validation, T.K.; formal analysis, A.B.; investigation, N.K. and A.B.; resources, N.K., T.K. and A.B.; data curation, A.B.; writing—original draft preparation, N.K.; writing—review and editing, A.B.; visualization, A.B. and T.K.; supervision, A.B.; project administration, N.K.; funding acquisition, N.K. All authors have read and agreed to the published version of the manuscript.

Funding

This work was supported by the RFBR project № 18-05-60125—Large arctic lakes under the global and regional environmental and climatic changes.

Institutional Review Board Statement

Not applicable.

Informed Consent Statement

Not applicable.

Data Availability Statement

The raw sequencing reads are available from the NCBI through BioProject accession number PRJNA526000.

Conflicts of Interest

The authors declare no conflict of interest. The funders had no role in the design of the study; in the collection, analyses, or interpretation of data; in the writing of the manuscript, or in the decision to publish the results.

References

  1. Denisov, D.; Kashulin, N. Cyanoprokaryota of the Imandra Lake (Kola Peninsula). Annu. Reporst Kola Sci. Cent. Russ. Acad. 2016, 7, 40–57. [Google Scholar]
  2. Kashulin, N.; Bekkelund, A.; Dauvalter, V.; Petrova, O. Apatite mining and processing production and eutrophication of the Arctic Lake Imandra. Arkt. Ekol. Ekon. 2019, 3, 16–34. [Google Scholar] [CrossRef]
  3. Kashulin, N.; Bekkelund, A.; Dauvalter, V. Characteristics of summertime spatial distribution of phosphorus, nitrogen and chlorophyll-a in a major eutrophic Arctic lake Imandra (Murmansk Region, Russia) as associated with harmful algal blooms. Biosfera 2020, 12, 63–92. [Google Scholar]
  4. Kravtsova, V. Lake Imandra water contamination dynamics from space images. IAHS Publ. Ser. Proc. Rep. Intern Assoc Hydrol. Sci. 1995, 230, 67–72. [Google Scholar]
  5. Dauvalter, V.; Kashulin, N. Geoecology of the lakes of Murmansk region. In MGTU; Murmansk State Technical University: Murmansk, Russia, 2014. [Google Scholar]
  6. Flynn, K.J.; Stoecker, D.K.; Mitra, A.; Raven, J.A.; Glibert, P.M.; Hansen, P.J.; Granéli, E.; Burkholder, J.M. Misuse of the phytoplankton–zooplankton dichotomy: The need to assign organisms as mixotrophs within plankton functional types. J. Plankton Res. 2013, 35, 3–11. [Google Scholar] [CrossRef] [Green Version]
  7. Voloshko, L. Spiniferomonas species (Chrysophyceae, Paraphysomonadaceae) in waterbodies of the Northern Russia. Bot. Zhurnal 2013, 98, 848–858. [Google Scholar]
  8. Voloshko, L. Chrysophycean algae in waterbodies of the Northern Russia. Genus Chrysosphaerella Bot. Zhurnal 2016, 101, 753–776. [Google Scholar]
  9. Denisov, D.; Kashulin, N. The phytoplankton communities in the vicinities of еру Kola nuclear power Plant (the Imandra Lake). Annu. Reporst Kola Sci. Cent. Russ. Acad. Sci. 2013, 3, 71–95. [Google Scholar]
  10. Morton, J.T.; Sanders, J.; Quinn, R.; McDonald, D.; Gonzalez, A.; Vázquez-Baeza, Y.; Navas-Molina, J.A.; Song, S.J.; Metcalf, J.L.; Hyde, E.R.; et al. Balance trees reveal microbial niche differentiation. MSystems 2017, 2, e00162-16. [Google Scholar] [CrossRef] [Green Version]
  11. Bedoshvili, Y.D.; Popkova, T.; Likhoshway, Y.V. Chloroplast structure of diatoms of different classes. Cell Tissue Biol. 2009, 3, 297–310. [Google Scholar] [CrossRef]
  12. Smutná, M.; Babica, P.; Jarque, S.; Hilscherová, K.; Maršálek, B.; Haeba, M.; Bláha, L. Acute, chronic and reproductive toxicity of complex cyanobacterial blooms in Daphnia magna and the role of microcystins. Toxicon 2014, 79, 11–18. [Google Scholar] [CrossRef]
  13. Vollenweider, R.A. Advances in defining critical loading levels for phosphorus in lake eutrophication. Memorie dell’Istituto Italiano di Idrobiologia Dott Marco de Marchi Verbania Pallanza 1976, 33, 53–83. [Google Scholar]
  14. Kirchner, W.; Dillon, P. An empirical method of estimating the retention of phosphorus in lakes. Water Resour. Res. 1975, 11, 182–183. [Google Scholar] [CrossRef]
  15. Cleveland, W.S.; Devlin, S.J. Locally weighted regression: An approach to regression analysis by local fitting. J. Am. Stat. Assoc. 1988, 83, 596–610. [Google Scholar] [CrossRef]
  16. Team, R.C. R: A Language and Environment For Statistical Computing. 2013. Available online: http://www.R-project.org/ (accessed on 17 August 2021).
  17. Wickham, H. ggplot2: Elegant Graphics for Data Analysis; Springer: Berlin/Heidelberg, Germany, 2016. [Google Scholar]
  18. Smith, D.; Jarvie, H.; Bowes, M. Carbon, nitrogen, and phosphorus stoichiometry and eutrophication in River Thames tributaries, UK. Agric. Environ. Lett. 2017, 2, 20. [Google Scholar] [CrossRef]
  19. Hamilton, N.E.; Ferry, M. ggtern: Ternary diagrams using ggplot2. J. Stat. Softw. 2018, 87, 1–17. [Google Scholar] [CrossRef] [Green Version]
  20. Caporaso, J.G.; Kuczynski, J.; Stombaugh, J.; Bittinger, K.; Bushman, F.D.; Costello, E.K.; Fierer, N.; Peña, A.G.; Goodrich, J.K.; Gordon, J.I.; et al. QIIME allows analysis of high-throughput community sequencing data. Nat. Methods 2010, 7, 335. [Google Scholar] [CrossRef] [Green Version]
  21. DeSantis, T.Z.; Hugenholtz, P.; Larsen, N.; Rojas, M.; Brodie, E.L.; Keller, K.; Huber, T.; Dalevi, D.; Hu, P.; Andersen, G.L. Greengenes, a Chimera-Checked 16S rRNA Gene Database and Workbench Compatible with ARB. Appl. Environ. Microbiol. 2006, 72, 5069–5072. [Google Scholar] [CrossRef] [PubMed] [Green Version]
  22. Bokulich, N.A.; Kaehler, B.D.; Rideout, J.R.; Dillon, M.; Bolyen, E.; Knight, R.; Huttley, G.A.; Caporaso, J.G. Optimizing taxonomic classification of marker-gene amplicon sequences with QIIME 2’s q2-feature-classifier plugin. Microbiome 2018, 6, 90. [Google Scholar] [CrossRef]
  23. Callahan, B.J.; McMurdie, P.J.; Rosen, M.J.; Han, A.W.; Johnson, A.J.A.; Holmes, S.P. DADA2: High-resolution sample inference from Illumina amplicon data. Nat. Methods 2016, 13, 581. [Google Scholar] [CrossRef] [PubMed] [Green Version]
  24. Fischer, M.A.; Güllert, S.; Neulinger, S.C.; Streit, W.R.; Schmitz, R.A. Evaluation of 16S rRNA gene primer pairs for monitoring microbial community structures showed high reproducibility within and low comparability between datasets generated with multiple archaeal and bacterial primer pairs. Front. Microbiol. 2016, 7, 1297. [Google Scholar] [CrossRef] [PubMed]
  25. Bukin, Y.S.; Galachyants, Y.P.; Morozov, I.; Bukin, S.; Zakharenko, A.; Zemskaya, T. The effect of 16S rRNA region choice on bacterial community metabarcoding results. Sci. Data 2019, 6, 190007. [Google Scholar] [CrossRef] [Green Version]
  26. Wear, E.K.; Wilbanks, E.G.; Nelson, C.E.; Carlson, C.A. Primer selection impacts specific population abundances but not community dynamics in a monthly time-series 16S rRNA gene amplicon analysis of coastal marine bacterioplankton. Environ. Microbiol. 2018, 20, 2709–2726. [Google Scholar] [CrossRef] [Green Version]
  27. Parulekar, N.N.; Kolekar, P.; Jenkins, A.; Kleiven, S.; Utkilen, H.; Johansen, A.; Sawant, S.; Kulkarni-Kale, U.; Kale, M.; Sæbø, M. Characterization of bacterial community associated with phytoplankton bloom in a eutrophic lake in South Norway using 16S rRNA gene amplicon sequence analysis. PLoS ONE 2017, 12, e0173408. [Google Scholar] [CrossRef] [PubMed]
  28. Bennke, C.; Pollehne, F.; Müller, A.; Hansen, R.; Kreikemeyer, B.; Labrenz, M. The distribution of phytoplankton in the Baltic Sea assessed by a prokaryotic 16S rRNA gene primer system. J. Plankton Res. 2018, 40, 244–254. [Google Scholar] [CrossRef]
  29. Lomas, M.W.; Glibert, P.M. Comparisons of nitrate uptake, storage, and reduction in marine diatoms and flagellates. J. Phycol. 2000, 36, 903–913. [Google Scholar] [CrossRef]
  30. Busseni, G.; Vieira, F.R.J.; Amato, A.; Pelletier, E.; Karlusich, J.J.P.; Ferrante, M.I.; Wincker, P.; Rogato, A.; Bowler, C.; Sanges, R.; et al. Meta-Omics Reveals Genetic Flexibility of Diatom Nitrogen Transporters in Response to Environmental Changes. Mol. Biol. Evol. 2019, 36, 2522–2535. [Google Scholar] [CrossRef] [Green Version]
  31. Kamp, A.; Stief, P.; Bristow, L.; Thamdrup, B.; Glud, R.N. Intracellular Nitrate of Marine Diatoms as a Driver of Anaerobic Nitrogen Cycling in Sinking Aggregates. Front. Microbiol. 2016, 7, 1669. [Google Scholar] [CrossRef] [PubMed]
  32. Vincent, W.F.; Quesada, A. Cyanobacteria in High Latitude Lakes, Rivers and Seas. In Ecology of Cyanobacteria II; Springer: Berlin/Heidelberg, Germany, 2012; pp. 371–385. [Google Scholar]
  33. Lu, J.; Zhu, B.; Struewing, I.; Xu, N.; Duan, S. Nitrogen–phosphorus-associated metabolic activities during the development of a cyanobacterial bloom revealed by metatranscriptomics. Sci. Rep. 2019, 9, 2480. [Google Scholar] [CrossRef] [Green Version]
  34. Davis, T.W.; Bullerjahn, G.; Tuttle, T.; McKay, R.; Watson, S.B. Effects of Increasing Nitrogen and Phosphorus Concentrations on Phytoplankton Community Growth and Toxicity DuringPlanktothrixBlooms in Sandusky Bay, Lake Erie. Environ. Sci. Technol. 2015, 49, 7197–7207. [Google Scholar] [CrossRef]
  35. Jankowiak, J.; Hattenrath-Lehmann, T.; Kramer, B.J.; Ladds, M.; Gobler, C.J. Deciphering the effects of nitrogen, phosphorus, and temperature on cyanobacterial bloom intensification, diversity, and toxicity in western Lake Erie. Limnol. Oceanogr. 2019, 64, 1347–1370. [Google Scholar] [CrossRef] [Green Version]
  36. Wan, L.; Chen, X.; Deng, Q.; Yang, L.; Li, X.; Zhang, J.; Song, C.; Zhou, Y.; Cao, X. Phosphorus strategy in bloom-forming cyanobacteria (Dolichospermum and Microcystis) and its role in their succession. Harmful Algae 2019, 84, 46–55. [Google Scholar] [CrossRef]
  37. Cordeiro, R.S.; Vaz, I.C.; Magalhães, S.M.; Barbosa, F.A. Effects of nutritional conditions on lipid production by cyanobacteria. Anais da Academia Brasileira de Ciências 2017, 89, 2021–2031. [Google Scholar] [CrossRef]
  38. Arias, D.M.; Uggetti, E.; García-Galán, M.J.; García, J. Production of polyhydroxybutyrates and carbohydrates in a mixed cyanobacterial culture: Effect of nutrients limitation and photoperiods. New Biotechnol. 2018, 42, 1–11. [Google Scholar] [CrossRef] [Green Version]
  39. Kashtan, N.; Roggensack, S.E.; Rodrigue, S.; Thompson, J.W.; Biller, S.J.; Coe, A.; Ding, H.; Marttinen, P.; Malmstrom, R.R.; Stocker, R.; et al. Single-Cell Genomics Reveals Hundreds of Coexisting Subpopulations in Wild Prochlorococcus. Science 2014, 344, 416–420. [Google Scholar] [CrossRef] [PubMed] [Green Version]
  40. Segawa, T.; Takeuchi, N.; Fujita, K.; Aizen, V.B.; Willerslev, E.; Yonezawa, T. Demographic analysis of cyanobacteria based on the mutation rates estimated from an ancient ice core. Heredity 2018, 120, 562. [Google Scholar] [CrossRef]
  41. Pinevich, A.V.; Averina, S.G.; Gavrilova, O.V.; Migunova, A.V. Baeocytes in the cyanobacterium Pleurocapsa sp.: Characterization of the differentiated cells produced by multiple fission. Microbiology 2008, 77, 62–68. [Google Scholar] [CrossRef]
  42. Tandon, R.; Kesarwani, S.; Tiwari, G. Baeocytes and pseudofilamentous stages of Pleurocapsa concharum Hansgirg (Cyanobacteria, Pleurocapsales) in culture. Nova Hedwig. 2016, 102, 429–437. [Google Scholar] [CrossRef]
  43. Kaplan-Levy, R.N.; Hadas, O.; Summers, M.L.; Rücker, J.; Sukenik, A. Akinetes: Dormant cells of cyanobacteria. In Dormancy and Resistance in Harsh Environments; Springer: Berlin/Heidelberg, Germany, 2010; pp. 5–27. [Google Scholar]
  44. Kapkov, V.; Vasilieva, S.; Lobakova, E. Growth of Toxic Cyanobacteria Dolichospermum flos-aquae (Anabaena flos-aquae) in the Waters of the Boreal Zone. Mosc. Univ. Biol. Sci. Bull. 2019, 74, 15–20. [Google Scholar] [CrossRef]
  45. Salmaso, N.; Boscaini, A.; Capelli, C.; Cerasino, L.; Milan, M.; Putelli, S.; Tolotti, M. Historical colonization patterns of Dolichospermum lemmermannii (Cyanobacteria) in a deep lake south of the Alps. Adv. Oceanogr. Limnol. 2015, 6. [Google Scholar] [CrossRef] [Green Version]
  46. Kravchuk, E.S.; Ivanova, E.A.; Gladyshev, M.I. Seasonal dynamics of akinetes of Anabaena flos-aquae in bottom sediments and water column of small Siberian reservoir. Aquat. Ecol. 2006, 40, 325–336. [Google Scholar] [CrossRef]
  47. Perez, R.; Forchhammer, K.; Salerno, G.; Maldener, I. Clear differences in metabolic and morphological adaptations of akinetes of two Nostocales living in different habitats. Microbiology 2016, 162, 214–223. [Google Scholar] [CrossRef]
  48. Watzer, B.; Forchhammer, K. Cyanophycin synthesis optimizes nitrogen utilization in the unicellular cyanobacterium Synechocystis sp. strain PCC 6803. Appl. Environ. Microbiol. 2018, 84, e01298-18. [Google Scholar] [CrossRef] [Green Version]
  49. Perez, R.; Wörmer, L.; Sass, P.; Maldener, I. A highly asynchronous developmental program triggered during germination of dormant akinetes of filamentous diazotrophic cyanobacteria. FEMS Microbiol. Ecol. 2018, 94, fix131. [Google Scholar] [CrossRef]
  50. Park, C.-H.; Park, M.-H.; Kim, K.H.; Park, J.-H.; Kwon, D.-R.; Kim, N.Y.; Lim, B.-J.; Hwang, S.-J. Akinete germination chamber: An experimental device for cyanobacterial akinete germination and plankton emergence. Harmful Algae 2018, 72, 74–81. [Google Scholar] [CrossRef] [PubMed]
  51. Kim, B.; Lee, W.; Kim, Y.-O.; Lee, H.-O.; Han, M.-S. Relationship between akinete germination and vegetative population of Anabaena flos-aquae (Nostocales, Cyanobacteria) in Seokchon reservoir (Seoul, Korea). Arch. Hydrobiol. 2005, 163, 49–64. [Google Scholar] [CrossRef]
  52. Ramm, J.; Rücker, J.; Knie, M.; Nixdorf, B. Lost in the dark: Estimation of the akinete pool for the recruitment of Nostocales populations (cyanobacteria) in a temperate deep lake. J. Plankton Res. 2017, 39, 392–403. [Google Scholar] [CrossRef] [Green Version]
  53. Hildebrand, M.; Lerch, S.J.L.; Shrestha, R.P. Understanding Diatom Cell Wall Silicification—Moving Forward. Front. Mar. Sci. 2018, 5, 125. [Google Scholar] [CrossRef] [Green Version]
  54. Flori, S.; Jouneau, P.-H.; Bailleul, B.; Gallet, B.; Estrozi, L.F.; Moriscot, C.; Bastien, O.; Eicke, S.; Schober, A.; Bártulos, C.R.; et al. Plastid thylakoid architecture optimizes photosynthesis in diatoms. Nat. Commun. 2017, 8, 15885. [Google Scholar] [CrossRef] [PubMed] [Green Version]
  55. Olli, K.; Klais-Peets, R.; Tamminen, T. Rehabilitating the Cyanobacteria—Niche partitioning, resource use efficiency and phytoplankton community structure during diazotrophic cyanobacterial blooms. J. Ecol. 2015, 103, 1153–1164. [Google Scholar] [CrossRef]
  56. Caputo, A.A.A.; Nylander, J.A.; Foster, R. The genetic diversity and evolution of diatom-diazotroph associations highlights traits favoring symbiont integration. FEMS Microbiol. Lett. 2019, 366, 297. [Google Scholar] [CrossRef] [Green Version]
  57. Croft, M.T.; Lawrence, A.D.; Raux-Deery, E.; Warren, M.; Smith, A. Algae acquire vitamin B12 through a symbiotic relationship with bacteria. Nat. Cell Biol. 2005, 438, 90–93. [Google Scholar] [CrossRef]
  58. Wagner-Döbler, I.; Ballhausen, B.; Berger, M.; Brinkhoff, T.; Buchholz, I.; Bunk, B.; Cypionka, H.; Daniel, R.; Drepper, T.; Gerdts, G.; et al. The complete genome sequence of the algal symbiont Dinoroseobacter shibae: A hitchhiker’s guide to life in the sea. ISME J. 2010, 4, 61–77. [Google Scholar] [CrossRef] [PubMed] [Green Version]
  59. Kagami, M.; Yoshida, T.; Gurung, T.; Urabe, J. Direct and indirect effects of zooplankton on algal composition in in situ grazing experiments. Oecologia 2002, 133, 356–363. [Google Scholar] [CrossRef] [PubMed]
  60. Gustafsson, S.; Hansson, L.-A. Development of tolerance against toxic cyanobacteria in Daphnia. Aquat. Ecol. 2004, 38, 37–44. [Google Scholar] [CrossRef]
  61. Gibson, C.; Fitzsimons, A. Induction of the resting phase in the planktonic diatom Aulacoseira subarctica in very low light. Br. Phycol. J. 1990, 25, 329–334. [Google Scholar] [CrossRef]
Figure 1. Study area and location of the sampling site (67.595249 N; 33.003494 E). Blue arrows indicate directions of the currents in the Lake Imandra. API—apatite processing industry. Dashed lines indicate approximate borders of the parts of the lake.
Environments 08 00082 g001
Figure 2. Dead fish during typical summer HAB formed by the simultaneous bloom of diatom—Dolichospermum sp. in Lake Imandra. The affected species include Coregonus lavaretus, Coregonus albula, Osmerus eperlanus of all life stages and juveniles of Perca fluviatilis.
Environments 08 00082 g002
Figure 3. Annual average phosphorous load and critical phosphorous load baseline for Lake Imandra in 1990–2017.
Environments 08 00082 g003
Figure 4. Typical summer distribution patterns of Chlorophyll—a concentrations over different parts of Lake Imandra.
Environments 08 00082 g004
Figure 5. LOESS local regression analysis (a) and PCA (b) of the associations between total phosphorous and chlorophyll-a concentrations in Bolshaya Imandra, Jokostrovskaya Imandra, and sampling site areas located at the intersection of the two most eutrophic parts of the lake.
Environments 08 00082 g005
Figure 6. Dynamics of the mean concentration of TOC (µg-C/L), TP (µg-P/L), TN (µg-N/L), and Chl-a (µg/m3) in 1993–2017 (a). Squares and triangles reflect the regularity of HABs (square—irregular; triangle—regular). Concentrations of TOC, TP, TN, and Chl-a during HABs in Lake Imandra in 1993–2017. The values are expressed as relative percentages of their Redfield sum. The white circle represents the optimal Redfield ratio (b).
Environments 08 00082 g006
Figure 7. Temporal dynamics of the microbial biodiversity indices during summer HAB in Lake Imandra in 2017. Shannon (H) a—diversity index (a), UniFrac β—diversity index (b).
Environments 08 00082 g007
Figure 8. Correlation analysis of associations between relative abundances of cyanobacteria and EPMs during summer HAB in Imandra Lake.
Environments 08 00082 g008
Figure 9. PCA of the relative abundances of EPM and Cyanobacterial genera during HAB phases observed in Imandra Lake in July 2017 (a) and the impact of individual taxa to the distribution of the data within two-dimensional coordinates (b).
Environments 08 00082 g009
Figure 10. The relative abundance of pro- and eukaryotic photosynthetic species during various phases of HAB observed in Imandra Lake in July 2017.
Environments 08 00082 g010
Table 1. The morphometric characteristics and critical and actual annual phosphorus loadings of Lake Imandra and its parts. Hmax—the maximum lake depth; Z—the average lake depth; Slake—the lake surface area; V—the lake volume; Scathc—the catchment area; R—the water drainage rate; t—the time of water discharge; CLP—critical phosphorus loading; Q(P)max—the maximum permissible phosphorus admission to the lake; M(P)—the maximum permissible drainage module of phosphorus; L(P)—annual phosphorous load in 2017.
Hmax
(m)
Z
(m)
Slake
(km2)
V
(km3)
Scathc
(km2)
R
(m/s)
t
(Year)
CLP
(mg P/m2; Year)
Q(P)max
(ton P; Yyear)
M(P)
(mg P/m2; Year)
L(P)
(ton P; Year)
Entire Lake6713.381310.81123001452.38333270221507
Bolshaya I.6714.73124.5849931451.0036811523999
Jokostrovskaya I4210.93523.8460701450.842739616332
Babinskaya I.43.516.31492.4212381450.534086149176
Table 2. Typical recent average values of the physicochemical characteristics of the surface water in various areas of Lake Imandra during the summer months. Numerator—median value; denominator—range of values.
pHNH4
(µgN/l)
NO3
(µgN/)
NO3: NH3TN
(µgN/l)
Nopr
(µgN/l)
PO4
(µgP/l)
TP
(µgP/l)
TN:TP
Bolshaya I.7.5
6.8–8.4
7.0
1.0–114
5.0
0–1156
3.4
0–39.0
196
119–1629
188
117–365
3.0
1.0–153
27.0
7.0–251
8.4
2.5–18.9
Jokostrovskaya I.7.3
7.1–7.4
10.0
1.0–58.0
2.0
0–30.0
1.0
0–12.0
152
111–259
138
84–199
1.0
0–2.0
7.0
5.0–12.0
21.6
14.7–34.0
Babinskaya I.7.3
7.0–7.5
9.0
2.0–22.0
7.0
0–78.0
2.8
0–21.7
156
66.0–318
126
44–250
1.0
0–3.0
5.0
3.0–22.0
30.6
5.7–63.6
Publisher’s Note: MDPI stays neutral with regard to jurisdictional claims in published maps and institutional affiliations.

