Article

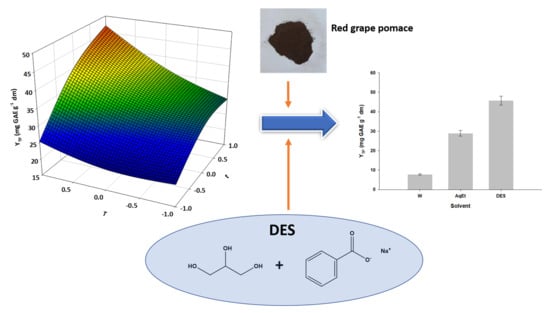
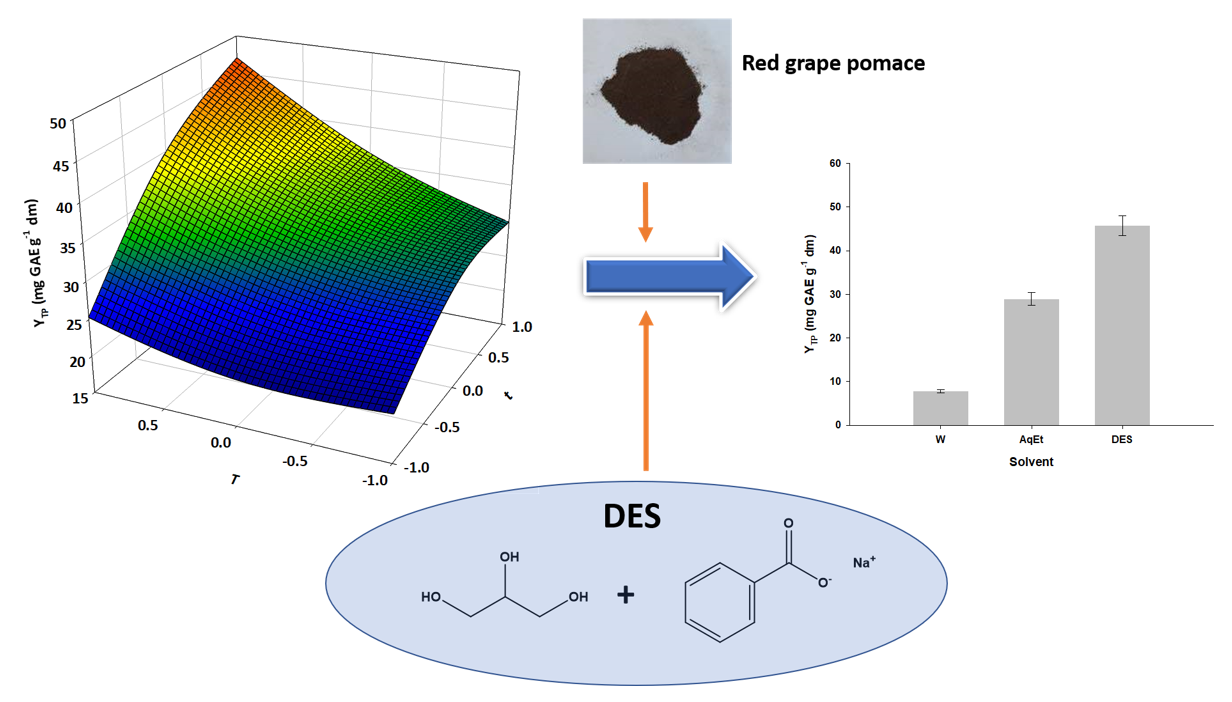
Development of a Green Methodology for Simultaneous Extraction of Polyphenols and Pigments from Red Winemaking Solid Wastes (Pomace) Using a Novel Glycerol-Sodium Benzoate Deep Eutectic Solvent and Ultrasonication Pretreatment

by
Aggeliki Alibade
1,2,
Achillia Lakka
2,
Eleni Bozinou
1,
Stavros I. Lalas
2,
Arhontoula Chatzilazarou
1 and
Dimitris P. Makris
2,*
1
Department of Wine, Vine & Beverage Sciences, University of West Attica, Ag. Spyridonos Str., 12243 Egaleo, Greece
2
Green Processes & Biorefinery Group, Department of Food Science & Nutrition, School of Agricultural Sciences, University of Thessaly, N. Temponera Street, 43100 Karditsa, Greece
*
Author to whom correspondence should be addressed.
Submission received: 30 June 2021 / Revised: 9 August 2021 / Accepted: 1 September 2021 / Published: 3 September 2021

Abstract

:
In this examination, two glycerol-based deep eutectic solvents (DESs) were tested for their efficiency in the recovery of antioxidant polyphenols and anthocyanin pigments from red grape pomace (RGP). The two DESs synthesized had sodium acetate and sodium benzoate as hydrogen bond acceptors, to test the role of the hydrogen bond acceptor polarity on the extraction performance. Furthermore, the process was enhanced by an ultrasonication pretreatment stage. After initial testing with respect to water content, ultrasonication power and liquid-to-solid ratio, the DES composed of glycerol and sodium benzoate (GL-SBz) was shown to be significantly more efficient than the one made of glycerol and sodium acetate (GL-SAc). Further optimization of the extraction with regard to time and temperature demonstrated GL-SBz to be a highly effective solvent for the production of RGP extracts rich in polyphenols including gallic acid, catechin and quercetin, and pigments including malvidin 3-O-glucoside p-coumarate and malvidin 3-O-glucoside. The extracts produced also had significantly higher antiradical activity and reducing power compared to those generated with aqueous ethanol or water. From this study, evidence emerged regarding the role of the hydrogen bond acceptor nature in the extraction efficiency of polyphenols. The process developed is proposed as a green, high-performing methodology for the production of RGP extracts with enhanced polyphenolic content and antioxidant activity.

Graphical Abstract

1. Introduction

The agri-food sector embraces industrial activities that largely pertain to the processing of plant-based materials, accompanied by ever-increasing amounts of associated wastes. The residual biomass which is regularly rejected as a result of plant tissue processing encompasses materials rich in organic substances, such as small branches, leaves, peels, seeds and roots. The uncontrolled deposition of these side streams in landfills may cause serious environmental problems, due to their exceptionally high polluting load, attributed to their content in polyphenols. However, as circular economy strategies dictate more and more the rational valorization of such wastes to approach zero-waste goals, the exploitation of agri-food processing residues as bioresources of high value-added materials and energy becomes of paramount importance [1].
Grape is one of the largest fruit crops worldwide, and based on data provided by the International Organization of Vine and Wine (OIV), in 2019 the global grape production was 77.8 million tons, of which 57% was destined for wine production. Vinification activities are crucial for the economies of several countries and, as estimated by the OIV, wine production in 2020 reached almost 258 million hectoliters [2]. The winemaking process inevitably generates a large volume of wastes, which represent about 13 to 20% of the initial grape mass. These residues are composed mainly of pomace (seeds and skins), stems, but also wine lees, and they bear a high content of polyphenolic substances. By virtue of the multitude of biological properties [3], several classes of this family of secondary metabolites have been extensively studied and numerous methodologies have been applied for the efficient recovery of polyphenols from vinification wastes [4].
Currently, in the framework of green chemistry principles, there has been a great shift in the development of eco-friendly extraction processes for effective polyphenol recovery, which aim at ensuring improved extraction yields, minimal environmental impact, low cost and high end-product quality [5]. Significant efforts have been expended on replacing conventional, volatile and toxic solvents with benign, recyclable and biodegradable ones [6]. Deep eutectic solvents (DESs) are a new generation of green liquids, which can be easily synthesized, usually by one constituent serving as a hydrogen bond donor (HBD) and another one as a hydrogen bond acceptor (HBA). The materials used to make up DESs may be cheap food-grade biosubstances, such as organic acids, organic acid salts, polyols and amino acids. Over mainly the last seven years, DESs have been the subject of an outstanding number of studies, which demonstrates their applicability in the extraction of natural compounds, including polyphenols [7].
In addition to replacing conventional with green solvents, cutting-edge technologies implemented in polyphenol extraction also involve physical green processes as a means of assisting solid–liquid extraction, such as ultrasonication. Ultrasonication has been extensively investigated for extraction for many years, and it has been proven by several studies to offer unprecedented benefits over conventional extraction methodologies, including improved yields, lower working temperatures and a significantly shorter extraction period [8]. The mechanisms implicated in extraction enhancement by ultrasonication are mostly cavitation phenomena. The result of this process is the implosion of cavitation bubbles on the surface of the solid matrix, generating microjetting and several associated effects such as surface peeling, erosion and particle breakdown, but also macroturbulences and micromixing [9]. The use of ultrasonication as a pretreatment method has been shown to be particularly effective in the extraction of polyphenols from RGP [10], but also from other plant matrices, such as elderberry flowers [11] and wheat bran [12].
In a recent study, an issue was raised concerning the effect of the polarity of the HBA on the extraction performance, and it was evidenced that DESs containing HBAs such as sodium propionate and sodium butyrate may be more effective solvents for polyphenol extraction than ones containing the more polar sodium acetate [13]. Considering these data, the project described herein was undertaken to test a novel DES, composed of glycerol and sodium benzoate, for its efficiency in extracting polyphenols and pigments from RGP, in comparison with a DES composed of glycerol and sodium acetate (Supplementary Materials). Ultrasonication was used as a pretreatment stage and extract evaluation was based on the analytical polyphenolic composition and typical in vitro antioxidant assays.

2. Materials and Methods

2.1. Chemicals

Catechin, quercetin, L-ascorbic acid (99.5%), Folin-Ciocalteu reagent, 2,4,6-tris(2-pyridyl)-s-triazine (TPTZ), rutin (quercetin 3-O-rutinoside) (>94%) and 2,2-diphenylpicrylhydrazyl (DPPH) were obtained from Sigma-Aldrich (Darmstadt, Germany). Iron chloride hexahydrate, sodium benzoate (99%) and citric acid anhydrous were obtained from Merck (Darmstadt, Germany). Sodium carbonate anhydrous (99%), glycerol anhydrous (99.5%) and sodium acetate trihydrate were obtained from Penta (Praha, Czechia). Gallic acid hydrate was obtained from Panreac (Barcelona, Spain). Pelargonin (pelargonidin 3,5-di-O-glucoside) chloride was obtained from Extrasynthese (Genay, France). Solvents used for chromatography were HPLC grade.

2.2. Deep Eutectic Solvent (DES) Synthesis

The methodology followed was as previously described [13]. Briefly, exact amounts of glycerol (hydrogen bond donor—HBD) and sodium acetate or sodium benzoate (hydrogen bond acceptor—HBA) were mixed in a Duran™ bottle of appropriate volume and heated at 70 °C, under stirring at 400 rpm, for approximately 60 min, to form perfectly transparent liquids. For the combination of glycerol/sodium acetate, a transparent liquid was formed when the HBD:HBA ratio was 3 or higher, but for the glycerol/sodium benzoate pair, this was achieved at a HBD:HBA ratio of 9. Thus, two DESs were prepared, glycerol/sodium acetate (9:1), termed as GL-SAc, and glycerol/sodium benzoate (9:1), termed as GL-SBz. After preparation, these two solvents were stored in sealed glass vials at room temperature, and visually inspected for the appearance of crystals (an indication of instability) over several weeks.

2.3. Red Grape Pomace (RGP) Collection and Handling

RGP was from industrial vinification of grapes (Vitis vinifera, cv. Muscat of Hamburg), kindly provided by a winery in Karditsa (Central Greece). The waste material was collected after a pomace contact that lasted 7 days, transferred to the laboratory within 2 h and stored at −40 °C. To prepare the appropriate material for solid–liquid extraction, a portion of RGP was thawed and spread over aluminum trays to form layers of approximately 0.5 cm thickness. The trays were inserted into a laboratory oven (Binder BD56, Bohemia, NY, USA) and dried for 6 h at 80 °C. The dried material (moisture content < 2%) was then pulverized in a laboratory table mill and sieved, to yield a powder with an average particle diameter of 0.384 mm. This material was used for all extraction processes.

2.4. Effect of Water Proportion

The DES/water proportions tested were 60, 70, 80 and 90% w/w. A volume of 7 mL of each mixture was transferred into a 10 mL glass Duran™ bottle with 0.350 g of RGP. The bottle was immersed into an oil bath, placed on a thermostated hotplate (Witeg, Wertheim, Germany) and extractions were performed at 50 °C, under continuous stirring at 500 rpm, for 150 min. Extracts were centrifuged at 10,000× g prior to examinations.

2.5. Ultrasonication Pretreatment

A volume of 7 mL of the DES/water mixture and 0.350 g of the RGP were placed into a 10 mL Duran™ glass bottle and sonicated in an Elma S 100 (H) heated ultrasonic bath (Elma Schmidbauer GmbH, Singen, Germany) for 2, 4, 8 and 15 min at ambient temperature (25 ± 2 °C). Ultrasonication was accomplished at a nominal power of 550 W and frequency of 37 Hz. Following this, stirred-tank extractions were carried out as described in Section 2.4. Control extractions with water and 60% (v/v) ethanol were also performed. The actual ultrasonication power (P) dissipated into the system was determined as follows:
P = m C p d T d t
where m is the mass of the water in the ultrasonication bath (in g), Cp is the specific heat capacity of water (4.2 J g−1 K−1) and d T d t is the temperature rise per s, which was determined by the fitting temperature change (dT), measured by a thermocouple, versus time [14].

2.6. Effect of Liquid-to-Solid Ratio (RL/S)

A volume of 28 mL of solvent (DES/water mixture) and suitable amounts of RGP were combined in a 50 mL Duran™ glass bottle to provide RL/S of 5, 10, 20, 40 and 80 mL g−1. After ultrasonication pretreatment, samples were extracted as described in Section 2.4.

2.7. Combined Effect of Time and Temperature

Assessment of the effect of two key process variables, time, t, and temperature, T, was accomplished by deploying response surface methodology. The design of the experiment used was a central composite design (CCD) with three central points. The independent variables (t, T) were set in 3 levels, −1, 0 and 1, in accordance with the experimental design, and codified as previously described [15]. The actual and coded levels are displayed in Table 1. The choice of the ranges for both independent variables was made on the basis of data reported elsewhere [16]. The overall model significance (R2, p) and the individual coefficients significance (equations) was appraised by lack-of-fit and ANOVA tests, at a minimum 95% level.

2.8. Determinations

Total polyphenols were determined with a Folin-Ciocalteu protocol reported in detail elsewhere [15]. Gallic acid was used as the standard (10–80 mg L−1, R2 = 0.9997) and results were given as mg gallic acid equivalents (GAE) per g of dry mass (dm). The total number of pigments was determined according to a previously developed protocol [17], with some modifications. A volume of 0.067 mL of extract was mixed with 0.933 mL of HCl solution (0.25 M in ethanol), in a 1.5-mL Eppendorf tube, and vortexed. After 10 min, the absorbance was obtained at 520 nm, using the ethanolic HCl solution as blank. The concentration in total pigments (CTPm) was determined as malvidin 3-O-glucoside equivalents (MvE), as follows:
C TPm   ( mg   MvE   L 1 ) = ( A × MW × F D ε ) × 10 3
where A is the absorbance at 520 nm, MW is the molecular weight of malvidin 3-O-glucoside (529), FD is the dilution factor and ε is the molar absorptivity of malvidin 3-O-glucoside (28,000). The yield in total pigments (YTPm) was then determined:
Y TPm   ( mg   CyE   g 1   dm ) = C TPm × V dm
where V is the volume (in L) of the solvent used for the extraction and dm is the dry mass of RGP (in g).
The antiradical activity (AAR) was determined with an assay based on the stable DPPH, and the results were expressed as μmol DPPH per g (dm). The ferric-reducing power was estimated with a previously described assay, and the results were reported as ascorbic acid equivalents (AAE) per g dm [15].

2.9. Liquid Chromatography—Diode Array–Mass Spectrometry (LC–DAD–MS)

A Finnigan MAT Spectra System P4000 pump (San Jose, CA, USA) was used, coupled to a UV6000LP diode array detector and a Finnigan AQA mass spectrometer. Separation was accomplished with a Fortis RP-18 column, 150 mm × 2.1 mm, 3 μm, at 40 °C, using a 10 μL injection loop. Mass spectra were obtained with electrospray ionization (ESI) in positive ion mode. Mass spectrometry settings, as well as the analytical elution program have been previously reported in detail [18].

2.10. High-Performance Liquid Chromatography (HPLC)

A previously used methodology was employed [15]. A Shimadzu CBM-20A liquid chromatograph (Shimadzu Europa GmbH, Duisburg, Germany) was used, coupled to a Shimadzu SPD-M20A detector. The equipment was interfaced with Shimadzu LC solution software. Analyses were accomplished with a Phenomenex Luna C18(2) column (100 Å, 5 μm, 4.6 × 250 mm; Phenomenex, Inc., Torrance, CA, USA), maintained at a temperature of 40 °C. The eluents used were (A) 0.5% aqueous formic acid and (B) 0.5% formic acid in MeCN/water (6:4), at a flow rate of 1 mL min−1. The volume of the sample injected onto the system was 20 μL. The elution program implemented was: 100% A to 60% A in 40 min, 60% A to 50% A in 10 min, 50% A to 30% A in 10 min and then isocratic elution for another 10 min. Quantification was accomplished by constructing calibration curves of catechin (R2 = 0.9999), caffeic acid (R2 = 0.9980), gallic acid (R2 = 0.9990), quercetin (R2 = 0.9990) and pelargonin (R2 = 0.9999). The standards used to construct calibration curves were prepared in HPLC-grade methanol, with concentrations of 0–50 μg mL−1.

2.11. Statistical Processing

All extraction processes were repeated at least twice, and all measurements performed in triplicate. Values were given as means ± standard deviation (sd). Linear regression analyses were performed at a minimum 95% significance level (p < 0.05), with SigmaPlot™ 12.5 (Systat Software Inc., San Jose, CA, USA). Response surface methodologies, experimental designs and relevant statistics, as well as distribution analyses, were carried out with JMP™ Pro 13 (SAS, Cary, NC, USA).

3. Results and Discussion

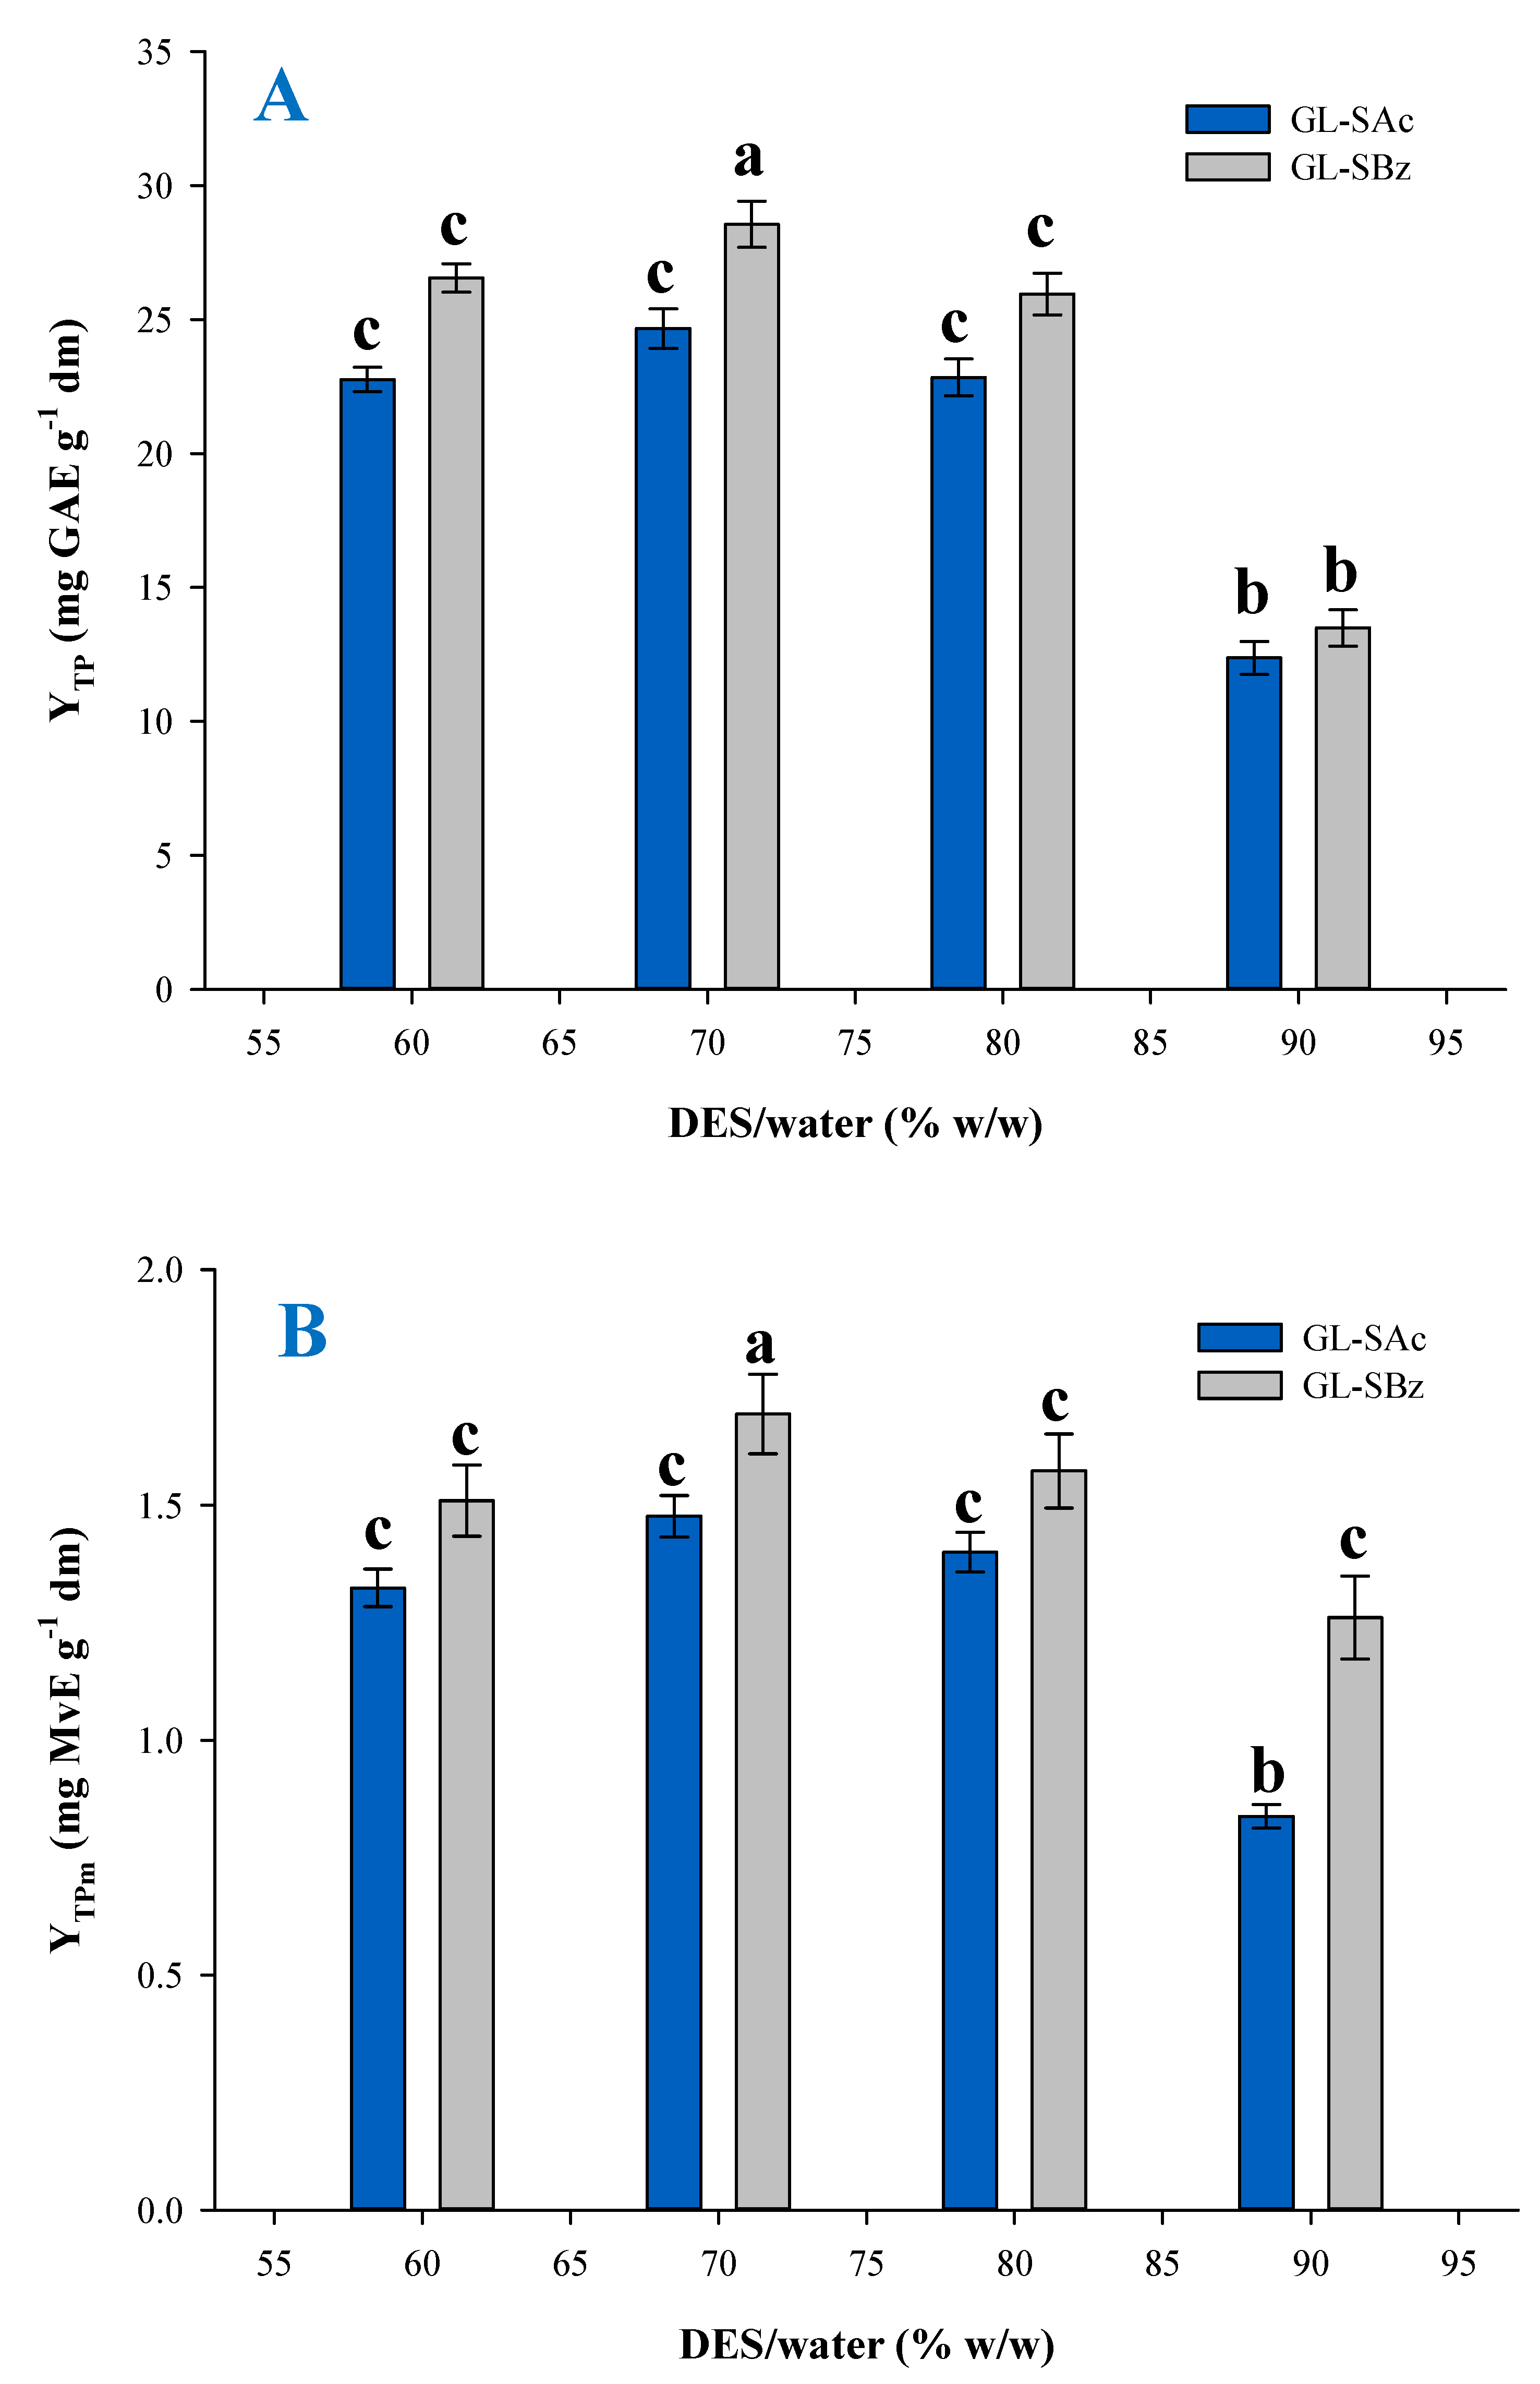
3.1. The Effect of DES/Water Proportion

In a recent study, the testing of a DES composed of glycerol (HBD), and sodium acetate, sodium propionate and sodium butyrate (HBAs) showed that the organic anion chain length might affect DES polarity to a significant extent, affecting polyphenol extractability [13]. The authors claimed that DES polarity could thus be tuned by choosing a HBA with suitable polarity. Furthermore, it was indicated that extractability could be regulated by the appropriate combination of the DES with water. As also evidenced by several recent studies, the amount of water in the final DES/water mixture is critical in maximizing the extraction yield of polyphenols [19]. Thus, optimization of solvent composition was achieved by screening a range of DES/water proportions varying from 60 to 90% (w/w). This range was chosen on the basis of previous studies [11]. It can be seen in Figure 1A that 70% was the most efficient proportion for both GL-SAc and GL-SBz, but for GL-SBz the difference was statistically significant (p < 0.05). Furthermore, GL-SBz had a higher performance than GL-SAc, which was also significant (p < 0.05). Likewise, GL-SBz/water (70%) gave a statistically higher yield in total pigments compared to any other proportion tested (Figure 1B). The difference between GL-SBz and GL-SAc was also significant in this case. On the grounds of this outcome, both GL-SBz and GL-SAc mixtures with water (70%) were selected for further examination.

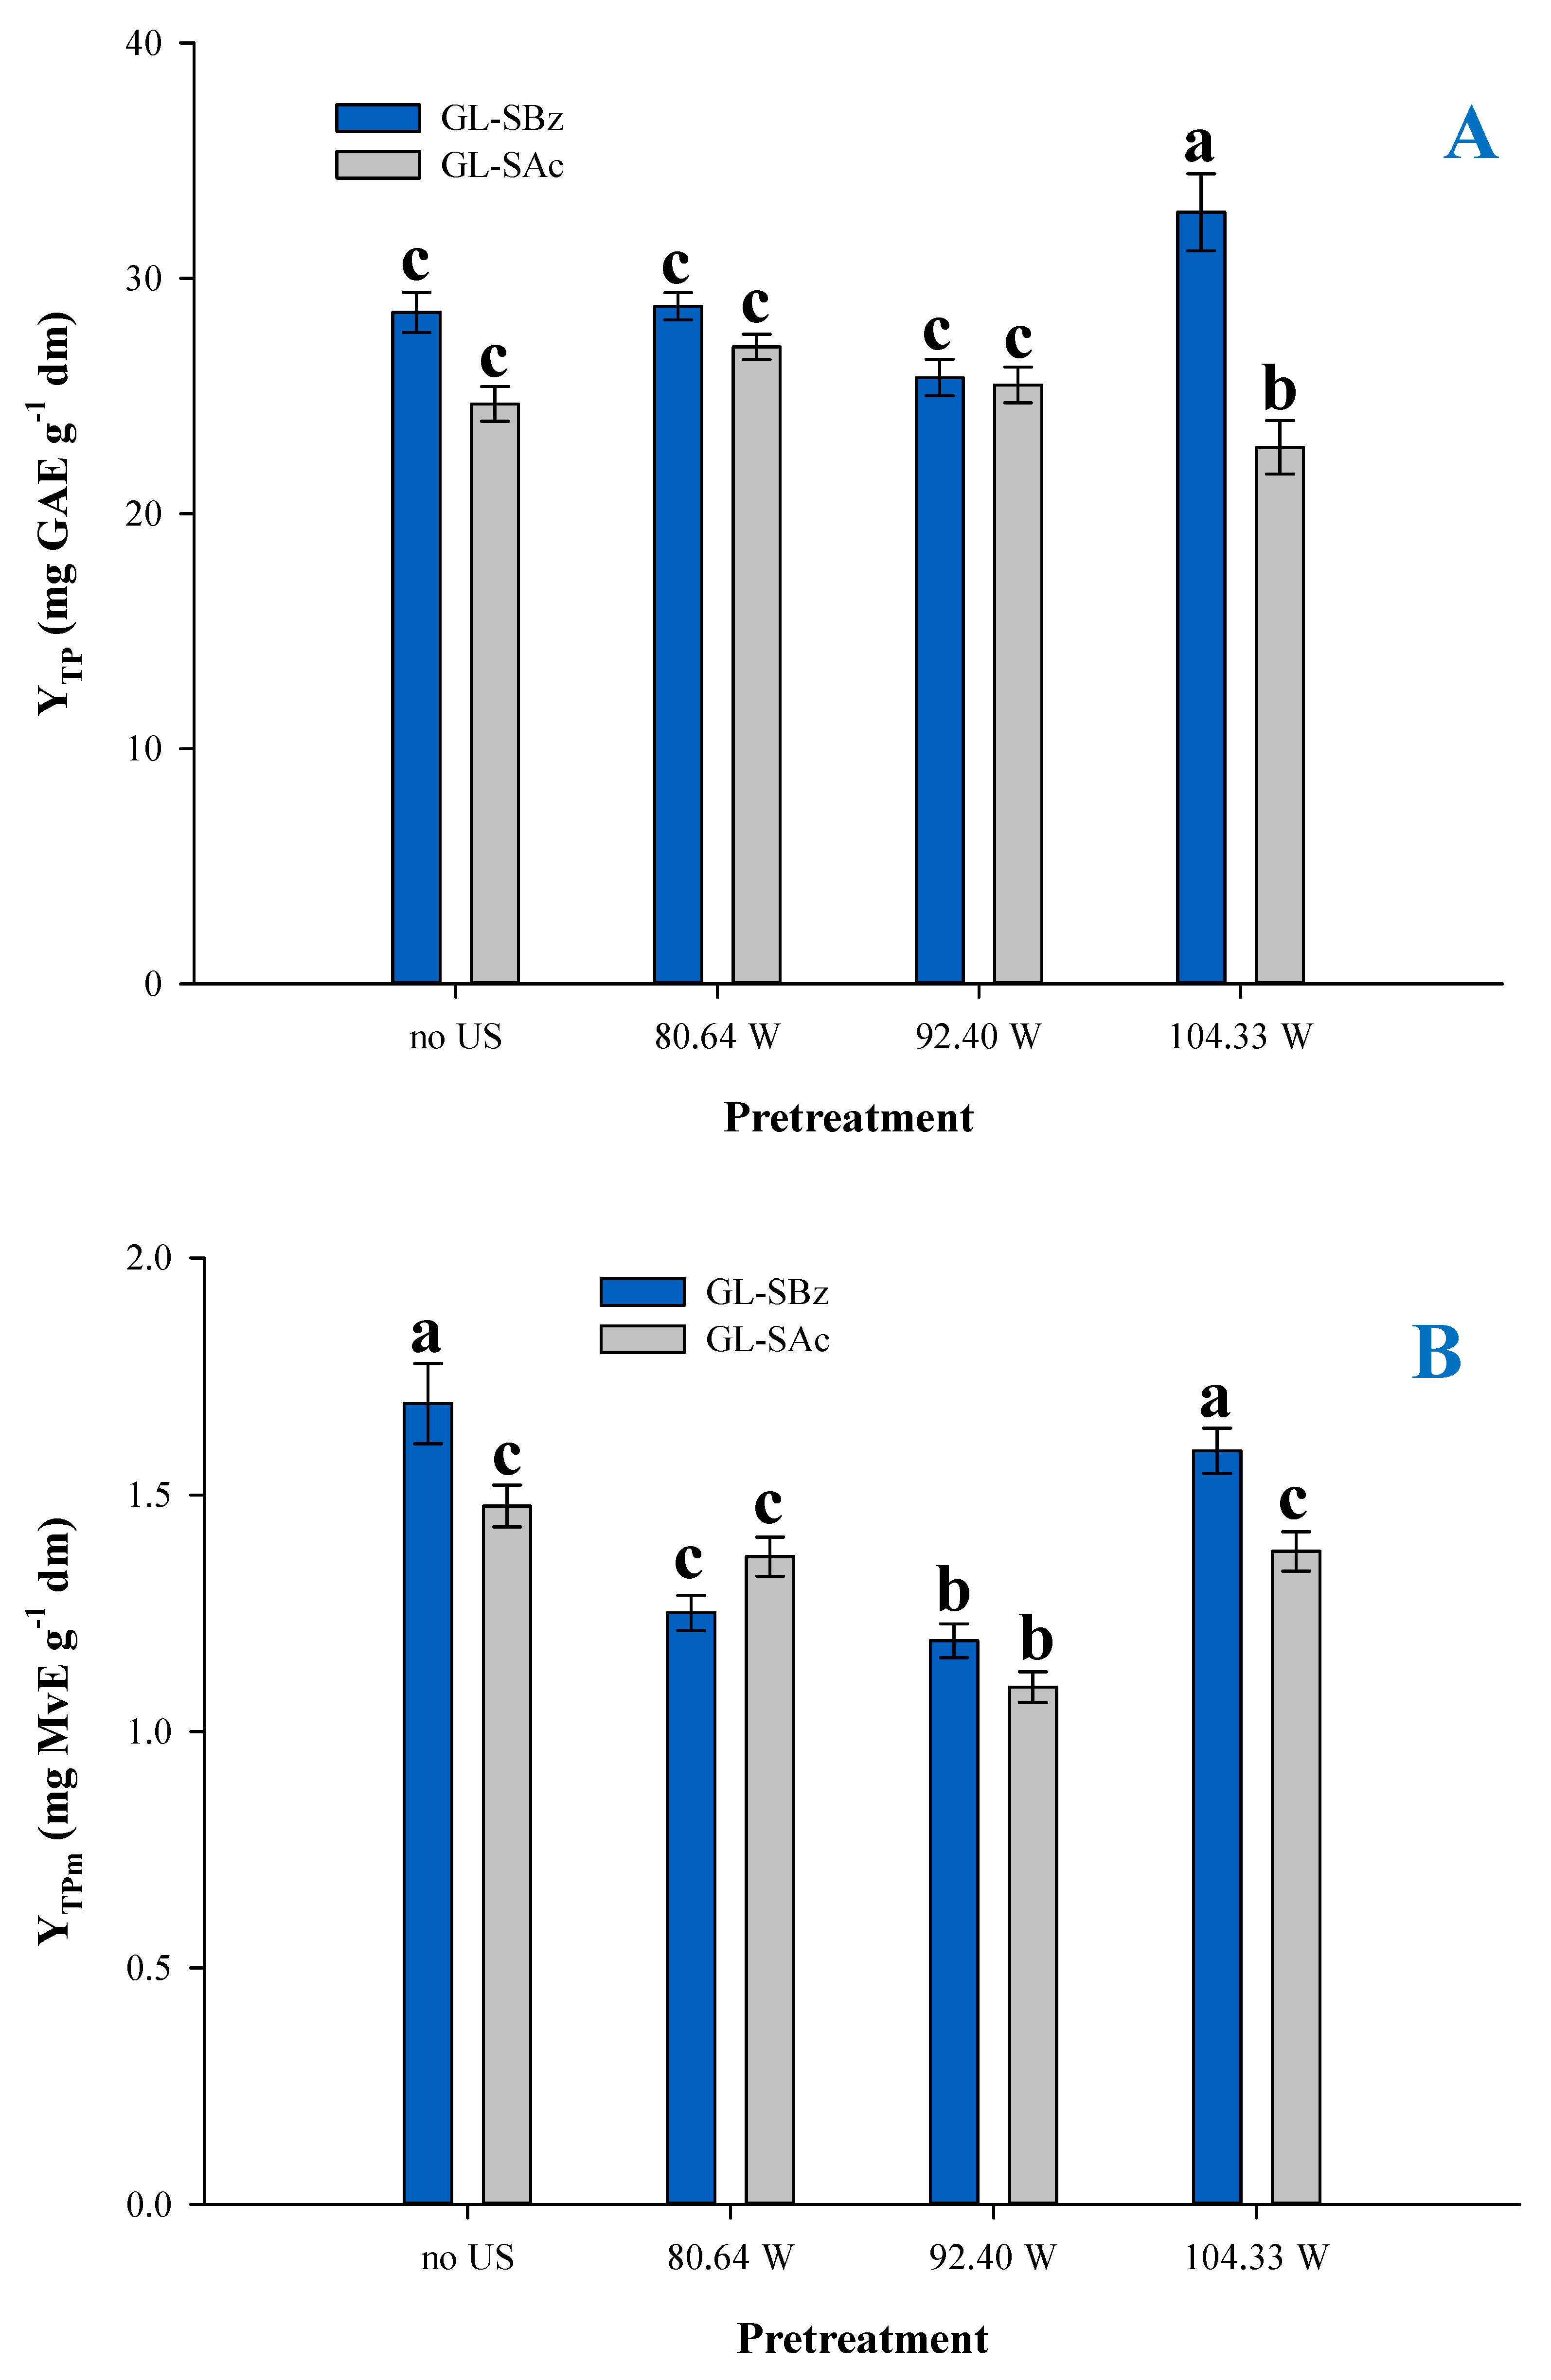
3.2. The Effect of Ultrasonication Power (P)

By keeping the volume of the coupling liquid (water) constant at 6.9 L in the ultrasonication bath, the ultrasonication time (tUS) varied from 2 to 15 min. Using Equation (1), the actual power dissipated into the system under these conditions was found to be 104.33 W. After ultrasonication, samples were extracted under stirred-tank mode, at 500 rpm and 50 °C, for 150 min. Preliminary experiments indicated that a statistically higher YTP and YTPm, with both GL-SAc and GL-SBz, could be achieved after at least 15 min of ultrasonication (data not shown); therefore this tUS was chosen to test the effect of actual ultrasonication power. This was achieved by adjusting the volume of the coupling liquid to 2, 5 and 6.9 L, which corresponded to P of 80.64, 92.40 and 104.33 W.
As can be seen in Figure 2A, a statistically higher YTP with GL-SBz could be achieved with a P of 104.33 W. The pretreatment at this P level was significantly more effective than the control (no ultrasonication), a phenomenon previously observed [11]. This finding confirmed the importance of US pretreatment in attaining a higher YTP. In contrast, at this P, extraction with GL-SAc gave a significantly lower YTP (p < 0.05), which was evidence of the effect of the solvent. Such evidence has been previously documented for phenolic acids [20] and flavonoids [21] during ultrasonication, supporting this argument. Ultrasonication variables are also critical in this regard, since they can affect hydroxyl free radical generation. Hydroxyl free radicals may attack polyphenols, causing important degradation, and this effect depends on polyphenol structure [22]. Ultrasonication power has been seen to exert a temperature-dependent effect on the YTP, highlighting the complexity of the phenomena implicated in similar processes [23,24]. Most likely, the solute (polyphenols) exhibited a lower solubility and lower stability in GL-SAc than in GL-SBz, hence the higher effectiveness found for GL-SBz.
The issue of polyphenol stability in DESs has also been previously addressed by studies on polyphenol extraction. It was reported that olive leaf polyphenols in a glycerol-glycine DES containing methyl β-cyclodextrin suffered extensive degradation after storage at 4–50 °C [25]. The same was observed for Moringa oleifera polyphenols in a glycerol-sodium acetate DES containing 2-hydroxypropyl β-cyclodextrin [26]. In both cases, a notable decline in antioxidant activity was also shown. However, polyphenols from Salvia fruticosa remained practically unchanged when extracts were stored for 30 days, even at 40 °C, in a glycerol-trisodium citrate DES, while the extracts retained the initial antioxidant activity [27].
Likewise, the YTPm found for the extraction with GL-SBz was significantly higher when P was 104.33 W, compared to the pretreatments performed at other P levels, but no statistical difference was found compared to the control (p > 0.05; Figure 2B). This result suggested that ultrasonication pretreatment may not be as effective for anthocyanin pigments. On the other hand, the lowest value was observed for the extraction with GL-SAc, at a P of 92.40 W. These findings led to the conclusion that a P of 104.33 W was the most appropriate condition. Moreover, it was confirmed that GL-SBz was a higher-performing system than GL-SAc.

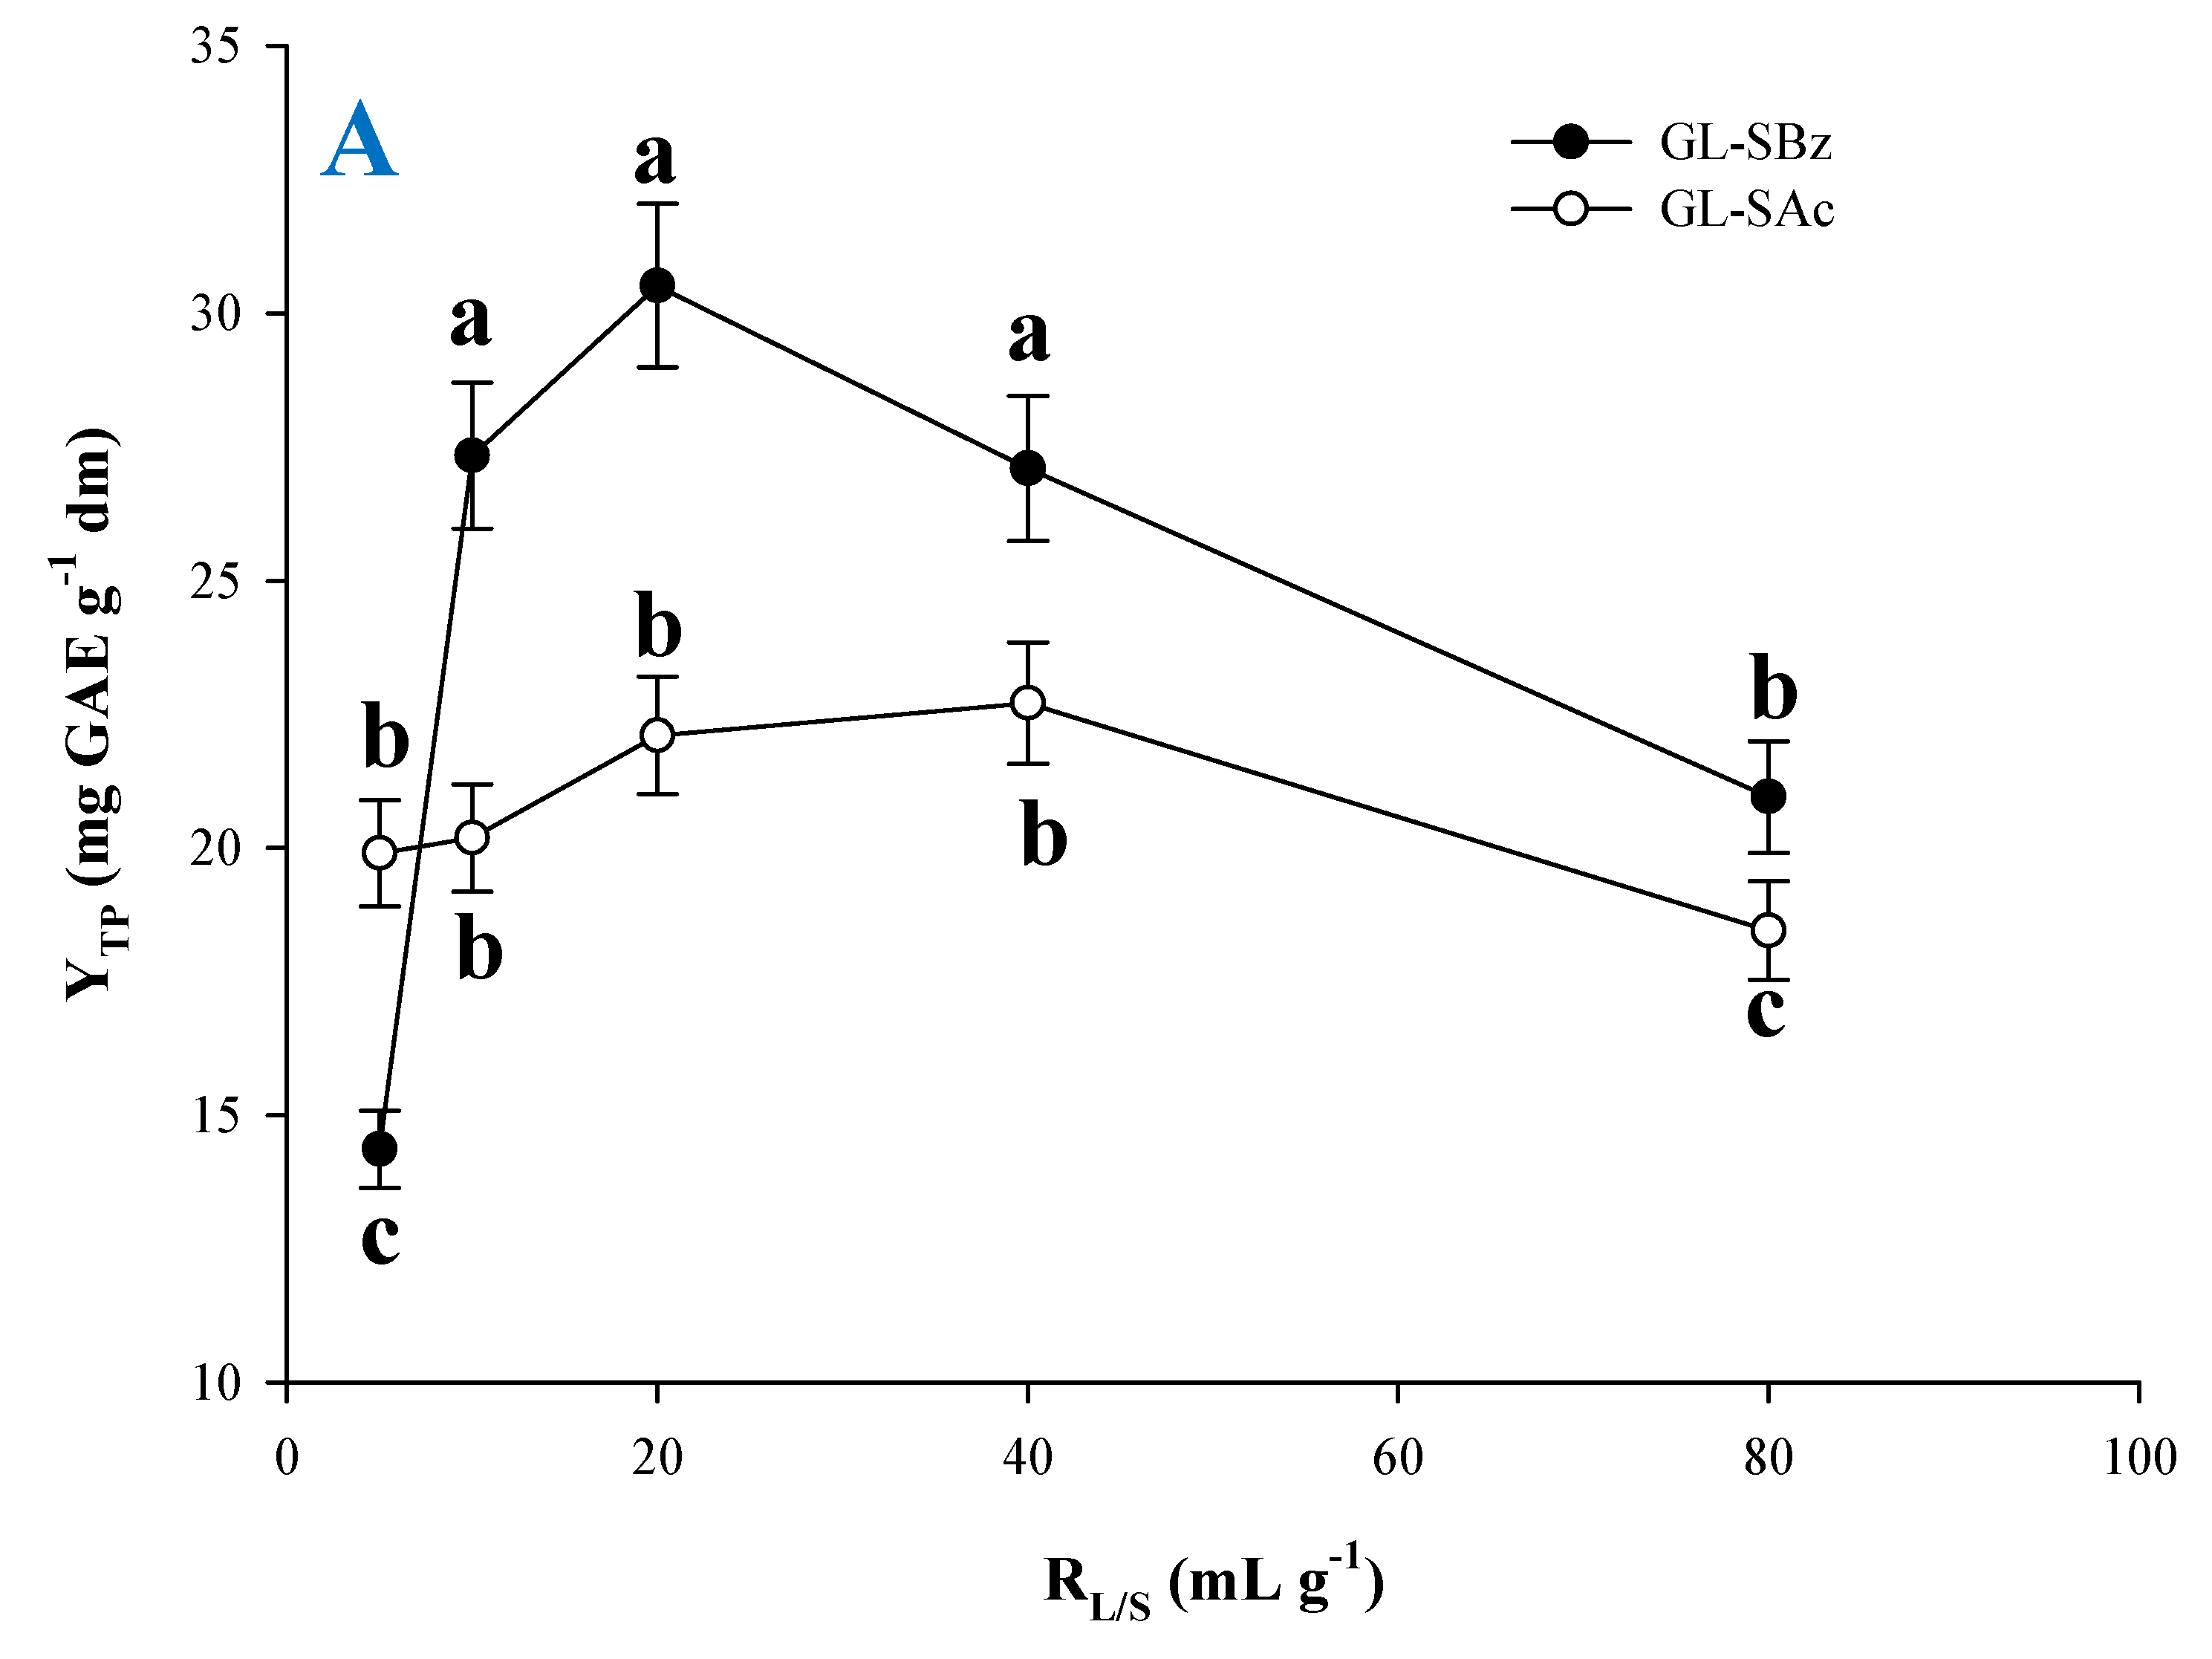
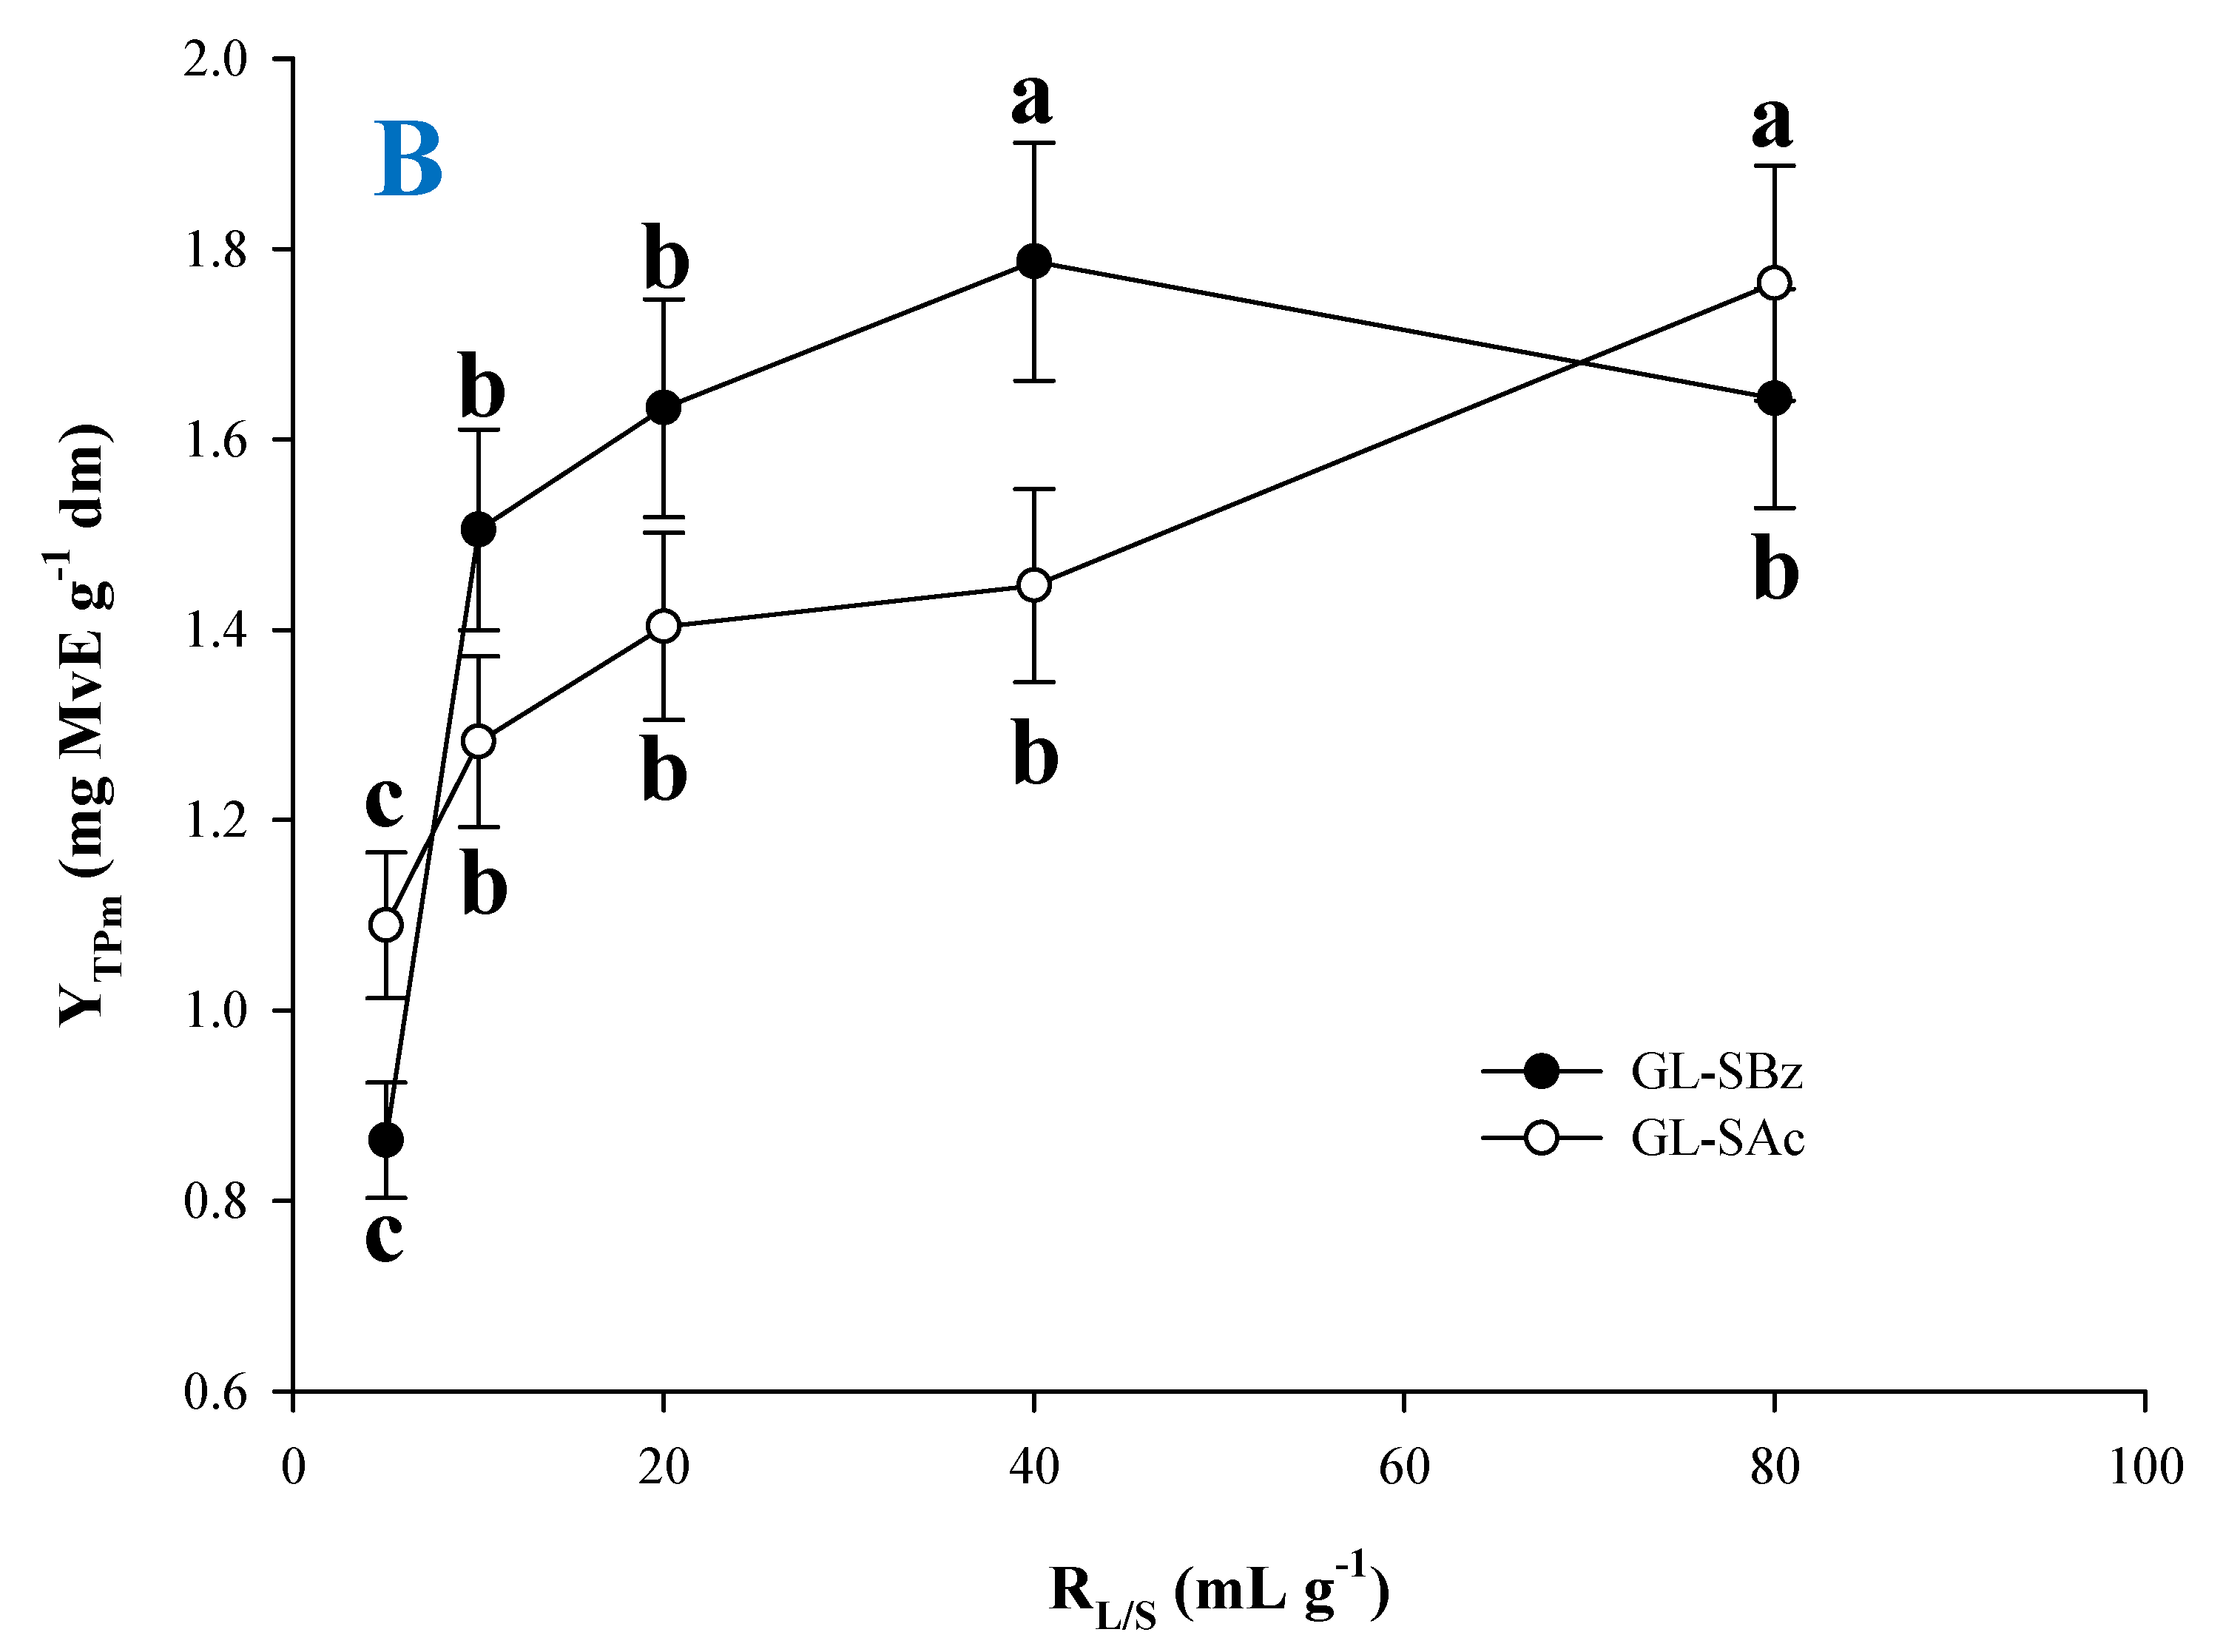
3.3. The Effect of Liquid-to-Solid Ratio (RL/S)

After establishing the conditions for optimal ultrasonication pretreatment, the next stage was to examine the effect of the RL/S. To this purpose, a range of RL/s were examined, varying from 5 to 80 mL g−1. With regards to the YTP, no statistical difference was seen within an RL/S range of 10 to 40 mL g−1 (p > 0.05), irrespective of the solvent used (Figure 3A). However, at an RL/S of 80 mL g−1, the YTP was significantly lower for the extraction with both GL-SBz and GL-SAc. The trend observed for the YTPm was different, and extraction with GL-SBz at an RL/S of 40 mL g−1 was shown to have significantly higher performance (Figure 3B). This did not hold true for the extraction with GL-SAc, which exhibited the highest YTPm at an RL/S of 80 mL g−1.
The variable RL/S is a key parameter in solid–liquid extraction, affecting the concentration gradient between the liquid phase and the solid particle. This gradient defines the diffusion rate of the solute (polyphenols), and it has been demonstrated that increases in the RL/S may significantly increase diffusivity [28]. For polyphenol extraction with various DESs, optimal RL/Ss varying from 29–50 mL g−1 have been determined [13,29,30]. Taking into consideration all the above information, an RL/S of 10 mL g−1 was selected as the most appropriate, to minimize requirements in solvent. It was revealed once again that GL-SBz was a far more effective solvent than GL-SAc, and thus GL-SAc was not further considered. All subsequent examinations were performed only with GL-SBz.

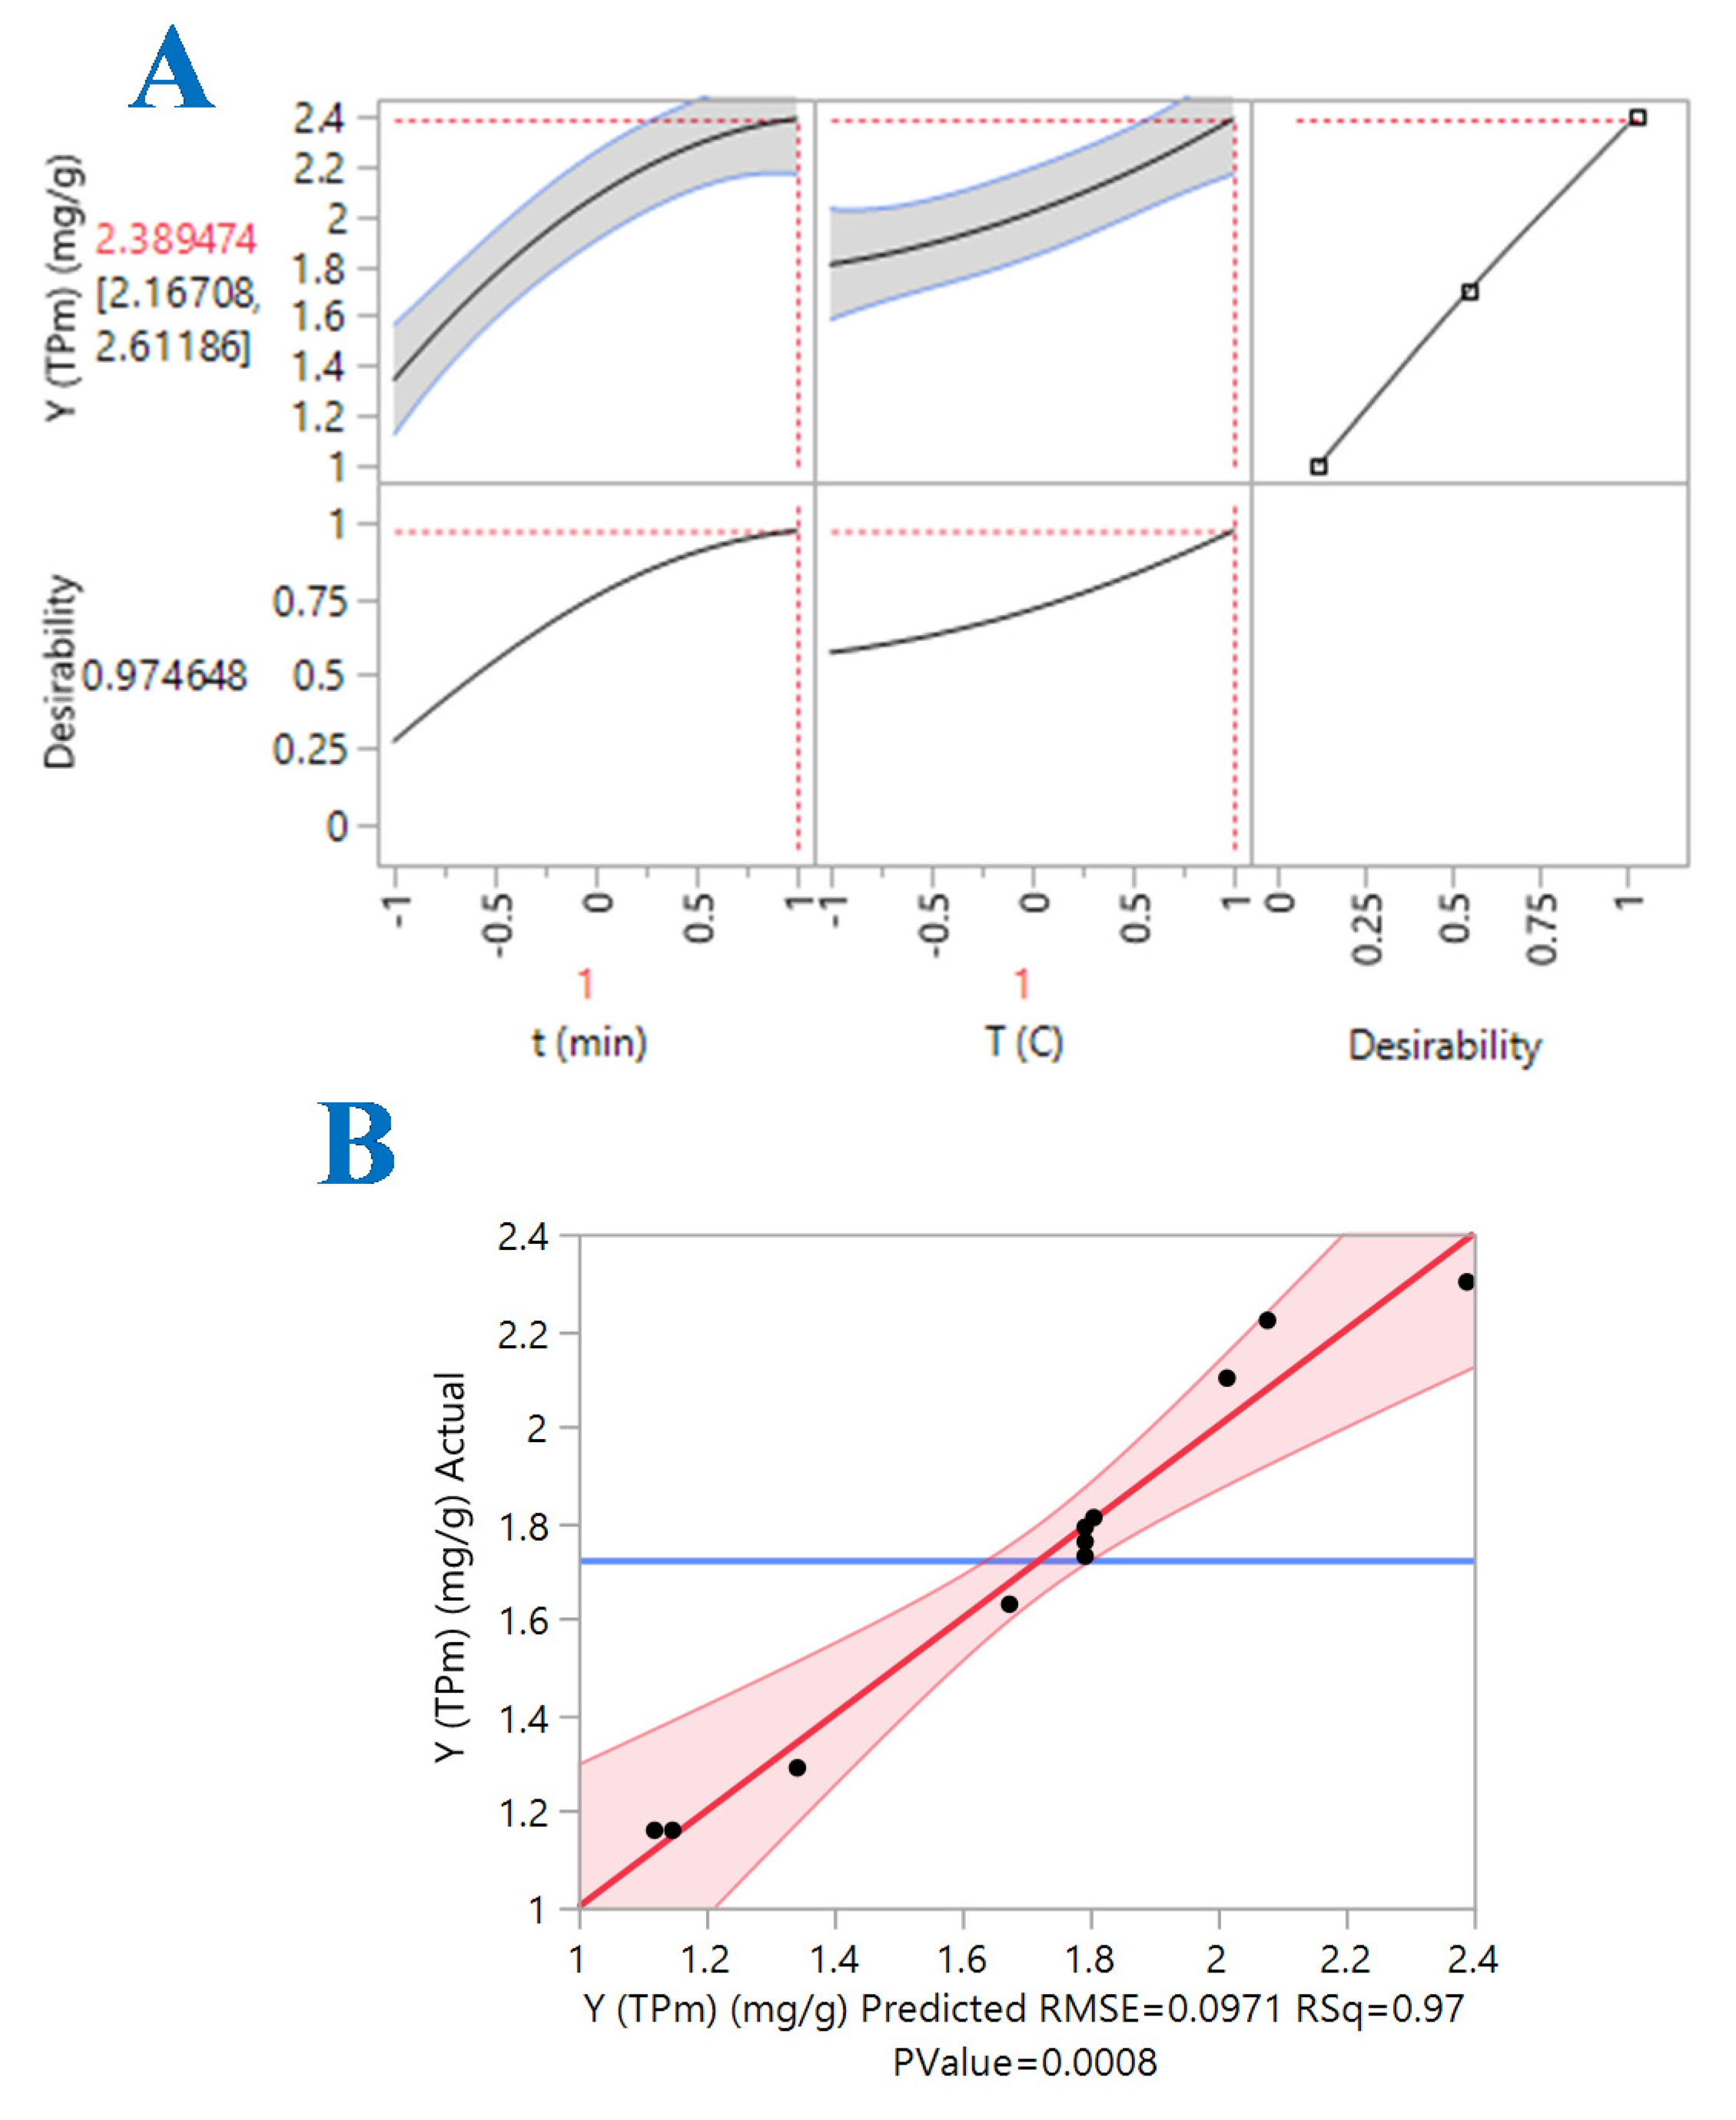
3.4. Optimization of Extraction Time and Temperature

The methodology deployed was designed to evaluate the effect of time, t, and temperature, T, on the yield in total polyphenols and total pigments, and to identify possible synergistic effects between them. Evaluation of the fitted models and response surface suitability was based on the ANOVA and lack-of-fit test (Table 2), taking into consideration the proximity of the actual (measured) and predicted values (Table 3) (Figure 4 and Figure 5). The mathematical models containing only the significant terms were as follows:
YTP = 32.59 + 7.53X1 + 5.24X2 + 3.33X1X2 − 3.75X12 + 2.07X22 (R2 = 0.99, p = 0.0001)
YTPm = 1.79 + 0.43X1 + 0.20X2 − 0.21X12 (R2 = 0.97, p = 0.0008)
The correlation coefficients (R2) of the models are indicators of the total variability around the mean given by the model. Thus, since both total R2 of the models were equal to or higher than 0.97, and the p value for lack of fit (assuming a confidence interval of 95%) was significant, it could be supported that the mathematical models described by Equations (4) and (5) exhibited excellent adjustment to the experimental data. The 3D plots derived by the models (Figure 6) give an at-a-glance picture of the effect of the experimental variables on the responses (YTP and YTPm). Based on the models, it could be argued that for both the YTP and YTPm, there were limitations regarding extraction time, as evidenced by the negative effect of X12. For the YTP, the cross term X1X2 was positive and significant, indicating a joint effect of time and temperature on acquiring increased YTP. To the contrary, this term was not significant for the YTPm. The use of the desirability function (Figure 4A and Figure 5A) enabled the estimation of the optimal conditions, as well as the theoretical maximal values for the YTP and YTPm, and for both responses, the optimum t was 240 min (X1 = 1), and the optimum T was 80 °C (X2 = 1).
To illustrate the efficiency of the process using GL-SBz, extractions were carried out under optimized conditions with water and 60% (v/v) aqueous ethanol. GL-SBz significantly outperformed both conventional solvents (p < 0.001), providing higher YTP by 489% and 58% compared to water and aqueous ethanol, respectively (Figure 7A). The YTP achieved with GL-SBz was 45.77 mg GAE g−1 dm, which is lower than the 55 mg GAE g−1 dm achieved with aqueous extraction [31], and 66.70 mg GAE g−1 dm determined for extraction with aqueous glycerol [16].
However, it should be noted that the range of polyphenol yields from RGP extraction may vary largely from 7.70 mg GAE g−1 dm [32] to as high as 77.80 mg GAE g−1 dm [33]. Similarly, the YTPm attained with GL-SBz was 1669% and 80% higher compared to that of water and aqueous ethanol, respectively (Figure 7B). The level of 2.30 mg MvE g−1 dm achieved for YTPm using GL-SBz was higher than levels acquired with conventional solvents, such as 50% methanol [34], 57% ethanol [35] and water [36], but higher values have been reported for extractions with 90% aqueous glycerol [16] and subcritical water/ethanol mixtures [37].
With regard to the antioxidant properties, the AAR determined for the extract generated with GL-SBz was 479% and 46% higher compared to the extracts obtained with water and aqueous ethanol, respectively (Figure 8A). In the same line, the PR was higher by 363% and 43%, respectively (Figure 8B). These findings illustrated that the higher yield in total polyphenols and pigments was accompanied by significantly improved antioxidant activity of the extracts. This outcome was in accordance with recent investigations on various plant materials [38], where AAR and PR were significantly correlated to the YTP.

3.5. Polyphenolic Composition

To shape an integrated image of the analytical polyphenolic composition, the extracts were subjected to HPLC analysis. The analyses of all three extracts showed the presence of eight major substances, three of which were anthocyanin pigments. Gallic acid, catechin, rutin and quercetin were identified by comparison of the corresponding retention times with those of the original standards. Caftaric acid (caffeoyltartaric acid) was tentatively identified by its molecular ion at m/z = 311 in negative ion mode, on the basis of previously published data [39]. In a similar fashion, malvidin 3-O-glucoside was tentatively identified by its molecular ion at m/z = 493 and the diagnostic fragment at m/z = 331 (aglycone), malvidin 3-O-glucoside acetate by its molecular ion at m/z = 535 and a fragment at 331 and malvidin 3-O-glucoside p-coumarate by its molecular ion at m/z = 639 and a fragment at 331, in positive ion mode [40].
The results of the quantitative analysis of the extracts are presented in Table 4. The extract produced with GL-SBz was the richest, containing in total 8630.94 μg of polyphenols and 3887.50 of anthocyanin pigments per g dm. This outcome clearly demonstrated the high efficiency of GL-SBz as a solvent for the recovery of polyphenols from RGP. Both the extracts obtained with aqueous ethanol and water were far less rich in polyphenolic phytochemicals. The profile of the GL-SBz extract was dominated by gallic acid, but it also contained important amounts of malvidin 3-O-glucoside p-coumarate, quercetin, catechin and malvidin 3-O-glucoside. In the ethanolic extract, the major constituent was malvidin 3-O-glucoside p-coumarate, followed by quercetin, catechin and malvidin 3-O-glucoside. The aqueous extract contained mainly gallic acid and catechin. These data pointed to different selectivities of the various solvents tested for RGP compounds.

4. Conclusions

In this study, two glycerol-based DESs having hydrogen bond acceptors with different polarities were tested for their efficiency in recovering RGP polyphenols. The method developed was integrated by ultrasonication pretreatment, which significantly boosted extraction efficiency. The DES with sodium benzoate as hydrogen bond acceptor (GL-SBz) was demonstrated to be far more efficient than the corresponding DES made with sodium acetate (GL-SAc). After optimizing extraction time and temperature, GL-SBz was shown to be a highly effective solvent for producing RGP extracts enriched in polyphenols and pigments. Both water and aqueous ethanol, which were tested for comparison, were proven to be far less effective in this regard. The high polyphenolic content of the extracts obtained with GL-SBz was also accompanied by enhanced antioxidant activity. The predominant polyphenols in the GL-SBz extract were gallic acid, malvidin 3-O-glucoside p-coumarate, quercetin, catechin and malvidin 3-O-glucoside. Currently, work is in progress to test the extracts obtained with this methodology in formulations simulating foods and cosmetics. These studies are anticipated to reveal both the stability and the efficiency of the extracts to act as antioxidant constituents.

Supplementary Materials

The following are available online at https://0-www-mdpi-com.brum.beds.ac.uk/article/10.3390/environments8090090/s1, Figure S1: Structures of hydrogen bond donor (glycerol) and hydrogen bond acceptors used in this study.

Author Contributions

Conceptualization, D.P.M. and S.I.L.; methodology, A.A., E.B. and A.C.; formal analysis, A.A., E.B. and A.L.; investigation, A.A., A.L., E.B. and A.C.; resources, D.P.M. and S.I.L.; writing—original draft preparation, D.P.M. and S.I.L.; writing—review and editing, D.P.M. and S.I.L.; supervision, A.C., D.P.M. and S.I.L. All authors have read and agreed to the published version of the manuscript.

Funding

This research received no external funding.

Institutional Review Board Statement

Not applicable.

Informed Consent Statement

Not applicable.

Data Availability Statement

Requests for the data presented in this study can be directed to the corresponding author.

Conflicts of Interest

The authors declare no conflict of interest.

References

  1. Osorio, L.L.D.R.; Flórez-López, E.; Grande-Tovar, C.D. The potential of selected agri-food loss and waste to contribute to a circular economy: Applications in the food, cosmetic and pharmaceutical industries. Molecules 2021, 26, 515. [Google Scholar] [CrossRef] [PubMed]
  2. Troilo, M.; Difonzo, G.; Paradiso, V.M.; Summo, C.; Caponio, F. Bioactive compounds from vine shoots, grape stalks, and wine lees: Their potential use in agro-food chains. Foods 2021, 10, 342. [Google Scholar] [CrossRef] [PubMed]
  3. Di Lorenzo, C.; Colombo, F.; Biella, S.; Stockley, C.; Restani, P. Polyphenols and human health: The role of bioavailability. Nutrients 2021, 13, 273. [Google Scholar] [CrossRef] [PubMed]
  4. Makris, D.P. Green extraction processes for the efficient recovery of bioactive polyphenols from wine industry solid wastes–Recent progress. Cur. Opin. Green Sustain. Chem. 2018, 13, 50–55. [Google Scholar] [CrossRef]
  5. Chávez-González, M.L.; Sepúlveda, L.; Verma, D.K.; Luna-García, H.A.; Rodríguez-Durán, L.V.; Ilina, A.; Aguilar, C.N. Conventional and emerging extraction processes of flavonoids. Processes 2020, 8, 434. [Google Scholar] [CrossRef] [Green Version]
  6. Chemat, F.; Abert Vian, M.; Ravi, H.K.; Khadhraoui, B.; Hilali, S.; Perino, S.; Fabiano Tixier, A.-S. Review of alternative solvents for green extraction of food and natural products: Panorama, principles, applications and prospects. Molecules 2019, 24, 3007. [Google Scholar] [CrossRef] [Green Version]
  7. Ivanović, M.; Islamčević Razboršek, M.; Kolar, M. Innovative extraction techniques using deep eutectic solvents and analytical methods for the isolation and characterization of natural bioactive compounds from plant material. Plants 2020, 9, 1428. [Google Scholar] [CrossRef]
  8. Medina-Torres, N.; Ayora-Talavera, T.; Espinosa-Andrews, H.; Sánchez-Contreras, A.; Pacheco, N. Ultrasound assisted extraction for the recovery of phenolic compounds from vegetable sources. Agronomy 2017, 7, 47. [Google Scholar] [CrossRef]
  9. Chemat, F.; Rombaut, N.; Sicaire, A.-G.; Meullemiestre, A.; Fabiano-Tixier, A.-S.; Abert-Vian, M. Ultrasound assisted extraction of food and natural products. Mechanisms, techniques, combinations, protocols and applications. A review. Ultrason. Sonochem. 2017, 34, 540–560. [Google Scholar] [CrossRef]
  10. Nayak, A.; Bhushan, B.; Rosales, A.; Turienzo, L.R.; Cortina, J. Valorisation potential of Cabernet grape pomace for the recovery of polyphenols: Process intensification, optimisation and study of kinetics. Food Bioprod. Proc. 2018, 109, 74–85. [Google Scholar] [CrossRef]
  11. Kaltsa, O.; Lakka, A.; Grigorakis, S.; Karageorgou, I.; Batra, G.; Bozinou, E.; Lalas, S.; Makris, D.P. A green extraction process for polyphenols from elderberry (Sambucus nigra) flowers using deep eutectic solvent and ultrasound-assisted pretreatment. Molecules 2020, 25, 921. [Google Scholar] [CrossRef] [PubMed] [Green Version]
  12. Cherif, M.M.; Grigorakis, S.; Halahlah, A.; Loupassaki, S.; Makris, D.P. High-efficiency extraction of phenolics from wheat waste biomass (bran) by combining deep eutectic solvent, ultrasound-assisted pretreatment and thermal treatment. Environ. Proc. 2020, 7, 845–859. [Google Scholar] [CrossRef]
  13. Slim, Z.; Jancheva, M.; Grigorakis, S.; Makris, D.P. Polyphenol extraction from Origanum dictamnus using low-transition temperature mixtures composed of glycerol and organic salts: Effect of organic anion carbon chain length. Chem. Eng. Com. 2018, 205, 1494–1506. [Google Scholar] [CrossRef]
  14. Kimura, T.; Sakamoto, T.; Leveque, J.-M.; Sohmiya, H.; Fujita, M.; Ikeda, S.; Ando, T. Standardization of ultrasonic power for sonochemical reaction. Ultrason. Sonochem. 1996, 3, S157–S161. [Google Scholar] [CrossRef]
  15. Lakka, A.; Grigorakis, S.; Karageorgou, I.; Batra, G.; Kaltsa, O.; Bozinou, E.; Lalas, S.; Makris, D.P. Saffron processing wastes as a bioresource of high-value added compounds: Development of a green extraction process for polyphenol recovery using a natural deep eutectic solvent. Antioxidants 2019, 8, 586. [Google Scholar] [CrossRef] [PubMed] [Green Version]
  16. Trasanidou, D.; Apostolakis, A.; Makris, D.P. Development of a green process for the preparation of antioxidant and pigment-enriched extracts from winery solid wastes using response surface methodology and kinetics. Chem. Eng. Com. 2016, 203, 1317–1325. [Google Scholar] [CrossRef]
  17. Dourtoglou, V.G.; Mamalos, A.; Makris, D.P. Storage of olives (Olea europaea) under CO2 atmosphere: Effect on anthocyanins, phenolics, sensory attributes and in vitro antioxidant properties. Food Chem. 2006, 99, 342–349. [Google Scholar] [CrossRef]
  18. Makris, D.; Kefalas, P. Characterization of polyphenolic phytochemicals in red grape pomace. Int. J. Waste Resour. 2013, 126. [Google Scholar] [CrossRef] [Green Version]
  19. Lu, W.; Liu, S. Choline chloride–based deep eutectic solvents (Ch-DESs) as promising green solvents for phenolic compounds extraction from bioresources: State-of-the-art, prospects, and challenges. Biomass Conver. Bioref. 2020. [CrossRef]
  20. Qiao, L.; Ye, X.; Sun, Y.; Ying, J.; Shen, Y.; Chen, J. Sonochemical effects on free phenolic acids under ultrasound treatment in a model system. Ultrason. Sonochem. 2013, 20, 1017–1025. [Google Scholar] [CrossRef]
  21. Qiao, L.; Sun, Y.; Chen, R.; Fu, Y.; Zhang, W.; Li, X.; Chen, J.; Shen, Y.; Ye, X. Sonochemical effects on 14 flavonoids common in citrus: Relation to stability. PLoS ONE 2014, 9, e87766. [Google Scholar]
  22. Wang, P.; Cheng, C.; Ma, Y.; Jia, M. Degradation behavior of polyphenols in model aqueous extraction system based on mechanical and sonochemical effects induced by ultrasound. Separ. Purif. Technol. 2020, 247, 116967. [Google Scholar] [CrossRef]
  23. Tomšik, A.; Pavlić, B.; Vladić, J.; Ramić, M.; Brindza, J.; Vidović, S. Optimization of ultrasound-assisted extraction of bioactive compounds from wild garlic (Allium ursinum L.). Ultrason. Sonochem. 2016, 29, 502–511. [Google Scholar] [CrossRef] [PubMed]
  24. Zhou, Y.; Zheng, J.; Gan, R.-Y.; Zhou, T.; Xu, D.-P.; Li, H.-B. Optimization of ultrasound-assisted extraction of antioxidants from the mung bean coat. Molecules 2017, 22, 638. [Google Scholar] [CrossRef] [PubMed] [Green Version]
  25. Athanasiadis, V.; Grigorakis, S.; Lalas, S.; Makris, D.P. Stability effects of methyl β-cyclodextrin on Olea europaea leaf extracts in a natural deep eutectic solvent. Eur. Food Res. Technol. 2018, 244, 1783–1792. [Google Scholar] [CrossRef]
  26. Karageorgou, I.; Grigorakis, S.; Lalas, S.; Makris, D.P. The effect of 2-hydroxypropyl β-cyclodextrin on the stability of polyphenolic compounds from Moringa oleifera Lam leaf extracts in a natural low-transition temperature mixture. Nova Biotech. Chim. 2018, 17, 29–37. [Google Scholar] [CrossRef]
  27. Grigorakis, S.; Halahlah, A.; Makris, D.P. Stability of Salvia fruticosa Mill. Polyphenols and antioxidant activity in a citrate-based natural deep eutectic solvent. Nova Biotech. Chim. 2020, 19, 200–207. [Google Scholar]
  28. Shewale, S.; Rathod, V.K. Extraction of total phenolic content from Azadirachta indica or (neem) leaves: Kinetics study. Prep. Biochem. Biotech. 2018, 48, 312–320. [Google Scholar] [CrossRef] [PubMed]
  29. Jancheva, M.; Grigorakis, S.; Loupassaki, S.; Makris, D.P. Optimised extraction of antioxidant polyphenols from Satureja thymbra using newly designed glycerol-based natural low-transition temperature mixtures (LTTMs). J. Applied Res. Med. Arom. Plants 2017, 6, 31–40. [Google Scholar] [CrossRef]
  30. Dedousi, M.; Mamoudaki, V.; Grigorakis, S.; Makris, D.P. Ultrasound-assisted extraction of polyphenolic antioxidants from olive (Olea europaea) leaves using a novel glycerol/sodium-potassium tartrate low-transition temperature mixture (LTTM). Environments 2017, 4, 31. [Google Scholar] [CrossRef] [Green Version]
  31. Rajha, H.N.; El Darra, N.; Hobaika, Z.; Boussetta, N.; Vorobiev, E.; Maroun, R.G.; Louka, N. Extraction of total phenolic compounds, flavonoids, anthocyanins and tannins from grape byproducts by response surface methodology. Influence of solid-liquid ratio, particle size, time, temperature and solvent mixtures on the optimization process. Food Nutr. Sci. 2014, 2014. [Google Scholar] [CrossRef] [Green Version]
  32. González-Centeno, M.; Comas-Serra, F.; Femenia, A.; Rosselló, C.; Simal, S. Effect of power ultrasound application on aqueous extraction of phenolic compounds and antioxidant capacity from grape pomace (Vitis vinifera L.): Experimental kinetics and modeling. Ultrason. Sonochem. 2015, 22, 506–514. [Google Scholar] [CrossRef] [PubMed] [Green Version]
  33. Pintać, D.; Majkić, T.; Torović, L.; Orčić, D.; Beara, I.; Simin, N.; Mimica-Dukić, N.; Lesjak, M. Solvent selection for efficient extraction of bioactive compounds from grape pomace. Ind. Crops Prod. 2018, 111, 379–390. [Google Scholar] [CrossRef]
  34. Liazid, A.; Guerrero, R.; Cantos, E.; Palma, M.; Barroso, C. Microwave assisted extraction of anthocyanins from grape skins. Food Chem. 2011, 124, 1238–1243. [Google Scholar] [CrossRef]
  35. Makris, D.; Boskou, G.; Chiou, A.; Andrikopoulos, N. An investigation on factors affecting recovery of antioxidant phenolics and anthocyanins from red grape (Vitis vinifera L.) pomace employing water/ethanol-based solutions. Am. J. Food Technol 2008, 3, 164–173. [Google Scholar] [CrossRef] [Green Version]
  36. Monrad, J.K.; Srinivas, K.; Howard, L.R.; King, J.W. Design and optimization of a semicontinuous hot–cold extraction of polyphenols from grape pomace. J. Agric. Food Chem. 2012, 60, 5571–5582. [Google Scholar] [CrossRef] [PubMed]
  37. Monrad, J.K.; Howard, L.R.; King, J.W.; Srinivas, K.; Mauromoustakos, A. Subcritical solvent extraction of anthocyanins from dried red grape pomace. J. Agric. Food Chem. 2010, 58, 2862–2868. [Google Scholar] [CrossRef]
  38. Georgantzi, C.; Lioliou, A.-E.; Paterakis, N.; Makris, D.P. Combination of lactic acid-based deep eutectic solvents (DES) with β-cyclodextrin: Performance screening using ultrasound-assisted extraction of polyphenols from selected native Greek medicinal plants. Agronomy 2017, 7, 54. [Google Scholar] [CrossRef] [Green Version]
  39. Makris, D.P.; Psarra, E.; Kallithraka, S.; Kefalas, P. The effect of polyphenolic composition as related to antioxidant capacity in white wines. Food Res. Inter. 2003, 36, 805–814. [Google Scholar] [CrossRef]
  40. Kefalas, P.; Makris, D. Liquid chromatography-mass spectrometry techniques in flavonoid analysis: Recent advances. In Natural Antioxidant Phenols: Sources, Structure-Activity Relationship, Current Trends in Analysis and Characterisation; Research Signpost: Kerala, India, 2006; pp. 69–123. [Google Scholar]
Figure 1. The effect of water proportion on the yield in total polyphenols (YTP) (A) and total pigments (YTPm) (B). Extractions were carried out at 50 °C and 500 rpm, with RL/S = 20 mL g−1 for 150 min. Letters a, b and c signify statistical difference (p < 0.05).
Environments 08 00090 g001
Figure 2. The effect of ultrasonication pretreatment on the yield in total polyphenols (YTP) (A) and total pigments (YTPm) (B). Ultrasonication period was 15 min, and it was accomplished at room temperature (25 ± 2 °C). After pretreatment, batch stirred-tank extractions were performed at 50 °C and 500 rpm, with RL/S = 20 mL g−1 for 150 min. Letters a, b and c signify statistical difference (p < 0.05).
Environments 08 00090 g002
Figure 3. The effect of the RL/S on the YTP (A) and YTPm (B). Samples received ultrasonication pretreatment for 15 min, with a P = 104.33 W at room temperature (25 ± 2 °C). After pretreatment, batch stirred-tank extractions were performed at 50 °C and 500 rpm for 150 min. Letters a, b and c signify statistical difference (p < 0.05).
Environments 08 00090 g003aEnvironments 08 00090 g003b
Figure 4. Statistical data on model fitting, accomplished with response surface methodology. (A) Desirability function showing optimal predicted values of both variables and maximum predicted YTP; (B) actual-by-predicted plot.
Environments 08 00090 g004
Figure 5. Statistical data on model fitting, accomplished with response surface methodology. (A) Desirability function showing optimal predicted values of both variables and maximum predicted YTPm; (B) actual-by-predicted plot.
Environments 08 00090 g005
Figure 6. Three-dimensional graphs illustrating the effect of the simultaneous shift of process variables on the YTP (A) and YTPm (B).
Environments 08 00090 g006
Figure 7. Plot illustrating the YTP (A) and YTPm (B) achieved with GL-SBz compared to 60% aqueous ethanol and water. Samples were pretreated with ultrasonication for 15 min, with a P = 104.33 W at room temperature (25 ± 2 °C). After pretreatment, batch stirred-tank extractions were performed under optimized conditions (t = 240 min, T = 80 °C), at RL/S = 10 mL g−1 and 500 rpm.
Environments 08 00090 g007
Figure 8. Plot illustrating the AAR (A) and PR (B) of the extracts produced with GL-SBz compared to 60% aqueous ethanol and water. Samples were pretreated with ultrasonication for 15 min, with a P = 104.33 W at room temperature (25 ± 2 °C). After pretreatment, batch stirred-tank extractions were performed under optimized conditions (t = 240 min, T = 80 °C), at RL/S = 10 mL g−1 and 500 rpm.
Environments 08 00090 g008
Table 1. Codified and actual variable levels used for the experimental design.
Independent VariablesCode UnitsCoded Variable Level
−101
t (min)X110115240
T (°C)X2506580
Table 2. Statistical information related to the mathematical models, generated using response surface methodology.
TermEstimateStandard Errort RatioProbability > t
YTP
Intercept32.5910530.63577851.26<0.0001 *
t7.530.50596614.88<0.0001 *
T5.24166670.50596610.360.0001 *
t × T3.330.6196795.370.0030 *
T × t−3.7526320.778665−4.820.0048 *
T × T2.07236840.7786652.660.0448 *
Lack-of-fit 0.2644
YTPm
Intercept1.79263160.0498135.99<0.0001 *
t0.43333330.0396410.930.0001 *
T0.20166670.039645.090.0038 *
t × T0.090.0485491.850.1229
T × t−0.2115790.061005−3.470.0179 *
T × T0.08342110.0610051.370.2297
Lack-of-fit 0.0567
Asterisks (*) on values in the “Parameter estimates” and “Test effects” inset tables indicate statistically significant values (minimum 95% significance level).
Table 3. Points of the experimental design with the corresponding measured and predicted values of the responses.
Design PointIndependent VariablesResponses
X1(t, min)X2(T, °C)YTP(mg GAE g1dm)YTPm(mg MvE g1dm)
MeasuredPredictedMeasuredPredicted
1−1 (10)−1 (50)21.2321.471.161.12
2−1 (10)1 (80)24.6425.291.291.34
31 (240)−1 (50)29.5729.871.811.81
41 (240)1 (80)46.3047.012.302.39
5−1 (10)0 (65)22.2021.311.161.15
61 (240)0 (65)37.3836.372.102.01
70 (115)−1 (50)29.9629.421.631.67
80 (115)1 (80)41.2739.912.222.08
90 (115)0 (65)31.4532.591.731.79
100 (115)0 (65)32.9332.591.761.79
110 (115)0 (65)31.4932.591.791.79
Table 4. Quantitative data on the polyphenolic composition of extracts obtained with the DES (GL-SBz) and the control solvents under optimized conditions. Values represent means of triplicate determination (±standard deviation).
CompoundYield (μg g−1 dm)
WaterAqEtDES
Non-pigment phenolics
Gallic acid128.31 ± 9.62135.72 ± 9.224675.15 ± 254.33
Caftaric acid68.88 ± 5.1780.96 ± 5.50356.17 ± 19.38
Catechin104.32 ± 7.82230.08 ± 15.621630.40 ± 88.69
Rutinn.d.40.72 ± 2.77169.46 ± 9.22
Quercetin8.43 ± 0.63268.07 ± 18.201799.77 ± 97.91
Sum309.94755.568630.94
Anthocyanin pigments
Malvidin 3-O-glucoside23.68 ± 1.78215.93 ± 14.661488.66 ± 80.98
Malvidin 3-O-glucoside acetaten.d.21.51 ± 1.46n.d.
Malvidin 3-O-glucoside p-coumaraten.d.572.61 ± 38.882398.83 ± 130.50
Sum23.68810.043887.50
Publisher’s Note: MDPI stays neutral with regard to jurisdictional claims in published maps and institutional affiliations.

