
Simplified Method for the Determination of Total Kjeldahl Nitrogen in Wastewater
by
Tristan D. Hicks
1, 
Caleb M. Kuns
1,
Chandrashekar Raman
2,†,
Zane T. Bates
1 and
Subhalakshmi Nagarajan
1,* 1
Department of Natural and Social Sciences, Bowling Green State University, Firelands Campus, Huron, OH 44839, USA
2
Geon® Performance Solutions, 25777 Detroit Road, Suite 202, Westlake, OH 44145, USA
*
Author to whom correspondence should be addressed.
†
C.R. is a product manager at Geon® Performance Solutions. The opinions expressed in this paper are solely his own and do not reflect the view of Geon® Performance Solutions.
Environments 2022, 9(5), 55; https://0-doi-org.brum.beds.ac.uk/10.3390/environments9050055
Submission received: 13 January 2022
/
Revised: 15 March 2022
/
Accepted: 1 April 2022
/
Published: 28 April 2022
Abstract
:The increase in total Kjeldahl nitrogen (TKN) concentrations is correlated with increases in cyanobacterial bloom biomass. Standard methods for the measurement of TKN are tedious, costly, time-consuming and involve the use of hazardous catalysts, such as mercury, high temperatures and significant amounts of toxic acids and bases. Since TKN plays a pivotal role in influencing algal blooms, there is an urgent need to develop simpler, safer and more accurate methods for the determination of TKN. The simplified TKN method (s-TKN™) developed by Hach® offers several advantages over the traditional TKN method, including eliminating the use of mercury, requiring low sample and reagent volumes and being cost-efficient and user-friendly. This communication presents preliminary results comparing the efficacy of s-TKN™ and the standard method, using commonly used primary standards and waste, estuarine and lake water matrices. For all primary standards analyzed, the s-TKN™ method exhibited good accuracy across a wide range of concentrations. The repeatability for the glycine–para-toluene sulfonic acid (Gly-PTSA) standard using the s-TKN™ method was 4.1% at the highest concentrations analyzed, with overall repeatability across concentrations comparable to the standard EPA method. For wastewater, estuarine and lake matrices, a good correlation (r2 = 0.9917) between the two methods and no statistical difference in the values (p > 0.05) were obtained between two methods. Preliminary studies indicate that the s-TKN™ method has the potential to reduce the expenditure associated with the cost of analysis and has the potential to be a safer and cheaper alternative, while providing comparable analytical results to the standard method.
1. Introduction
Cyanobacterial harmful algal blooms (CHABs) present an eminent threat to freshwater ecosystems. Research over the last decade has revealed phosphorus to be the key limiting nutrient for freshwater systems [1]. The role of nitrogen as a potential source of the occurrence of CHABs has not received much attention until recently for a couple of reasons: (1) in Lake Erie, total nitrogen loads have not increased significantly in the last 10 years [2], and (2) no correlations have been found between concentrations of oxidized forms of nitrogen (NO3− and NO2−) and the formation of CHABs [3]. However, all forms of nitrogen are not equally bioavailable to cyanobacteria. Bioavailable nitrogen is available in both reduced and oxidized forms, which are not utilized by cyanobacteria at similar rates, with many cyanobacterial species preferring the reduced forms of nitrogen. Davis et al. [4] demonstrated that microcystin concentrations increased more frequently with additions of dissolved nitrogen, and the addition of urea and phosphate yielded the highest microcystin concentrations. Newell [5] reported that an increase in non-nitrate nitrogen (or Kjeldahl nitrogen) is significantly correlated with CHAB biomass.
These findings, in conjunction with earlier work, demonstrate that chemically reduced forms of nitrogen (urea, NH4+ and dissolved organic nitrogen) are strongly favored by non-nitrogen-fixing cyanobacteria [6,7,8], with ammonium and urea being reported to be the preferred N source for CHABs [9,10,11]. In addition, dissolved organic nitrogen (DON) contributes significantly to the overall nitrogen content in estuaries and coastal waters [12,13,14,15]. These results demonstrate that managing phosphorus and nitrogen are important to controlling algal blooms [16].
The measurement of total Kjeldahl nitrogen (TKN) provides a useful parameter for measuring nitrogen content, as it includes bioavailable nitrogen forms (ammonium and urea). Typically, TKN is measured using a method developed by Johan Kjeldahl and consists of three steps: digestion, distillation, and titration [17]. In this method, samples are digested with concentrated sulfuric acid in the presence of a mercury catalyst to convert organic nitrogen to ammonium sulfate. The ammonium ion is subsequently released as ammonia, which is measured using titration. This classical method has several disadvantages, including the use of excess concentrated sulfuric acid, the use of a metallic catalyst (either mercury or copper is used), long reaction times, multiple steps, high costs associated with waste disposal (if mercury is used as a catalyst) and high temperatures (380 °C) required for digestion.
To overcome some of these limitations, semi-automated Kjeldahl methods have been developed to replace the use of mercury as a catalyst, reduce the number of steps and increase the efficiency of analysis. However, most semi-automated methods continue to utilize high temperatures (360 °C) and concentrated sulfuric acid and involve longer digestion times (3.5 h). The semi-automated method remains cost-intensive to set-up and run on a routine basis. The TKN method is also reported to suffer from interfering substances, including the presence of nitrates [18].
Since variability in TKN concentrations can have a profound effect on the occurrence of algal blooms, it is important to develop simpler methods for the determination of TKN. The Hach® simplified TKN (s-TKN™) method enables the simultaneous determination of TKN, total nitrogen (TN) and NOX (a combination of both nitrate and nitrite) in water and wastewater samples. The s-TKN™ method has several advantages over the semi-automated and classical Kjeldahl methods of analysis, including small sample sizes (less than 2 mL required for analysis), lower digestion times (1 h digestion), lower reaction temperatures (100 °C) and the use of less hazardous reaction conditions, while it eliminates the use of hazardous mercury compounds [19]. In addition, since all materials required for analysis come pre-packaged, there is minimal clean-up and preparation required.
To the best of our knowledge, there have been no published reports on the ability of this method to accurately and precisely estimate TKN concentrations. The goal of this communication is to evaluate the viability of the Hach® method for the measurement of TKN using well-known standards and wastewater matrices, and to compare efficacy with the Environmental Protection Agency’s (EPA) approved method (351.2).
2. Materials and Methods
The Hach® s-TKN™ method was used for the simultaneous determination of NOx, TN and TKN. The block digestor capable of heating to 100 °C is needed for digestion and the Hach® DR3800 spectrophotometer required for colorimetric analysis were purchased from Hach®. All materials and reagents required for analysis are integrated within the s-TKN™ kits, with detailed instructions for analysis. The persulfate method of converting organic nitrogen to nitrate, used in the Hach® method, has been found to be superior to the Kjeldahl digestion method in terms of cost, reliability, and precision [20]. TN is determined by digesting a sample for 1 h at 100 °C, with potassium persulfate oxidizing all forms of nitrogen to nitrate. The solution is neutralized and digestate is analyzed spectrophotometrically for nitrate. Nitrate ions react with 2,6-dimethylphenol in a solution of sulfuric acid and phosphoric acid to form nitrophenol. Nitrodimethylphenol is a highly colored product which is measured spectrophotometrically at 345 nm. The undigested sample is also reacted with 2,6-dimethylphenol to measure the nitrate originally present in the sample. TKN is then calculated using Equation (1).
[TKN] = [TN] − [Nitrate and nitrite (NOx)]
TKN was determined using the EPA-approved method (351.2) at the National Center for Water Quality Research at Heidelberg University. All reagents are prepared with ACS reagents and were used within six months. The digestion reagent used is a mixture of sulfuric acid–mercuric sulfate potassium sulfate solution. Digestion is carried out at 360 °C for 3 h in a block digestor; samples are cooled below 100 °C before ammonia is analyzed colorimetrically.
TKN standards—urea, glycine p-toluenesulfonic acid (Gly-PTSA), ammonium p-toluenesulfonic acid (Am-PTSA), nicotinic acid p-toluenesulfonic acid (Nic-PTSA), wastewater standard and 1.0 and 1000 ppm ammonia standard—were purchased from Hach®. All standards were prepared with deionized water and were analyzed within a week after preparation. The Am-PTSA and Nic-PTSA samples were analyzed in duplicate, while the Gly-PTSA samples were analyzed 5 times for each concentration to calculate relative standard deviation.
Three different types of sample matrices were analyzed: wastewater (29 samples), lake water (4 samples) and estuarine water (12 samples). All samples were collected on separate days (as an example, 29 wastewater samples were collected on 29 different days) and were refrigerated per EPA-recommended sampling techniques [21].
The initial precision and recovery of 5.0 ppm ammonia solution was analyzed using the manufacturer’s recommendations and was to be 107% (acceptable range 90–110%). The accuracy and precision were analyzed using wastewater effluent solution. The repeatability for wastewater effluent solution containing 3.56 mg/L of TKN is 3.9%.
3. Results and Discussion
The Hach® s-TKN™ method is applicable for the detection of TKN values in the range between 1 and 16 mg/L and is approved by the EPA for monitoring TKN in wastewater and other water bodies [22]. The goal of this paper is to assess the utility of the s-TKN™ method for determining TKN concentrations and to compare the efficacy to the traditional EPA method.
The efficacy of the s-TKN™ method was first analyzed using the standard samples commonly used in TKN analysis. Three primary standards (Gly-PTSA, Am-PTSA and Nic-PTSA) have been found to be useful to prove the accuracy of the method [23]. Am-PTSA is one of the easiest digestible standards with a digestibility index of zero. Nic-PTSA has a digestibility of 10, while Gly-PTSA has a digestibility index of 3. The Nic-PTSA and Gly-PTSA standards were analyzed at different concentrations using the s-TKN™ method and standard EPA method (351.2). Since Am-PTSA has very high digestibility, it was analyzed only using the s-TKN™ method. In addition, since urea is often used as a standard in TKN analysis, the efficacies of the s-TKN™ method were compared to the EPA 351.2 method.
Starting with Nic-PTSA, which is the hardest to digest, with concentrations ranging from 2 to 12 ppm, the s-TKN™ method was comparable to the standard EPA method in terms of the recovery rates of nitrogen and the percentage error, as shown in Table 1. A good correlation between values was obtained from both methods (r2 = 0.9994), as shown in Figure 1. Am-PTSA, an easily digestible standard, showed a good TKN recovery rate with a low error rate (Table 2).
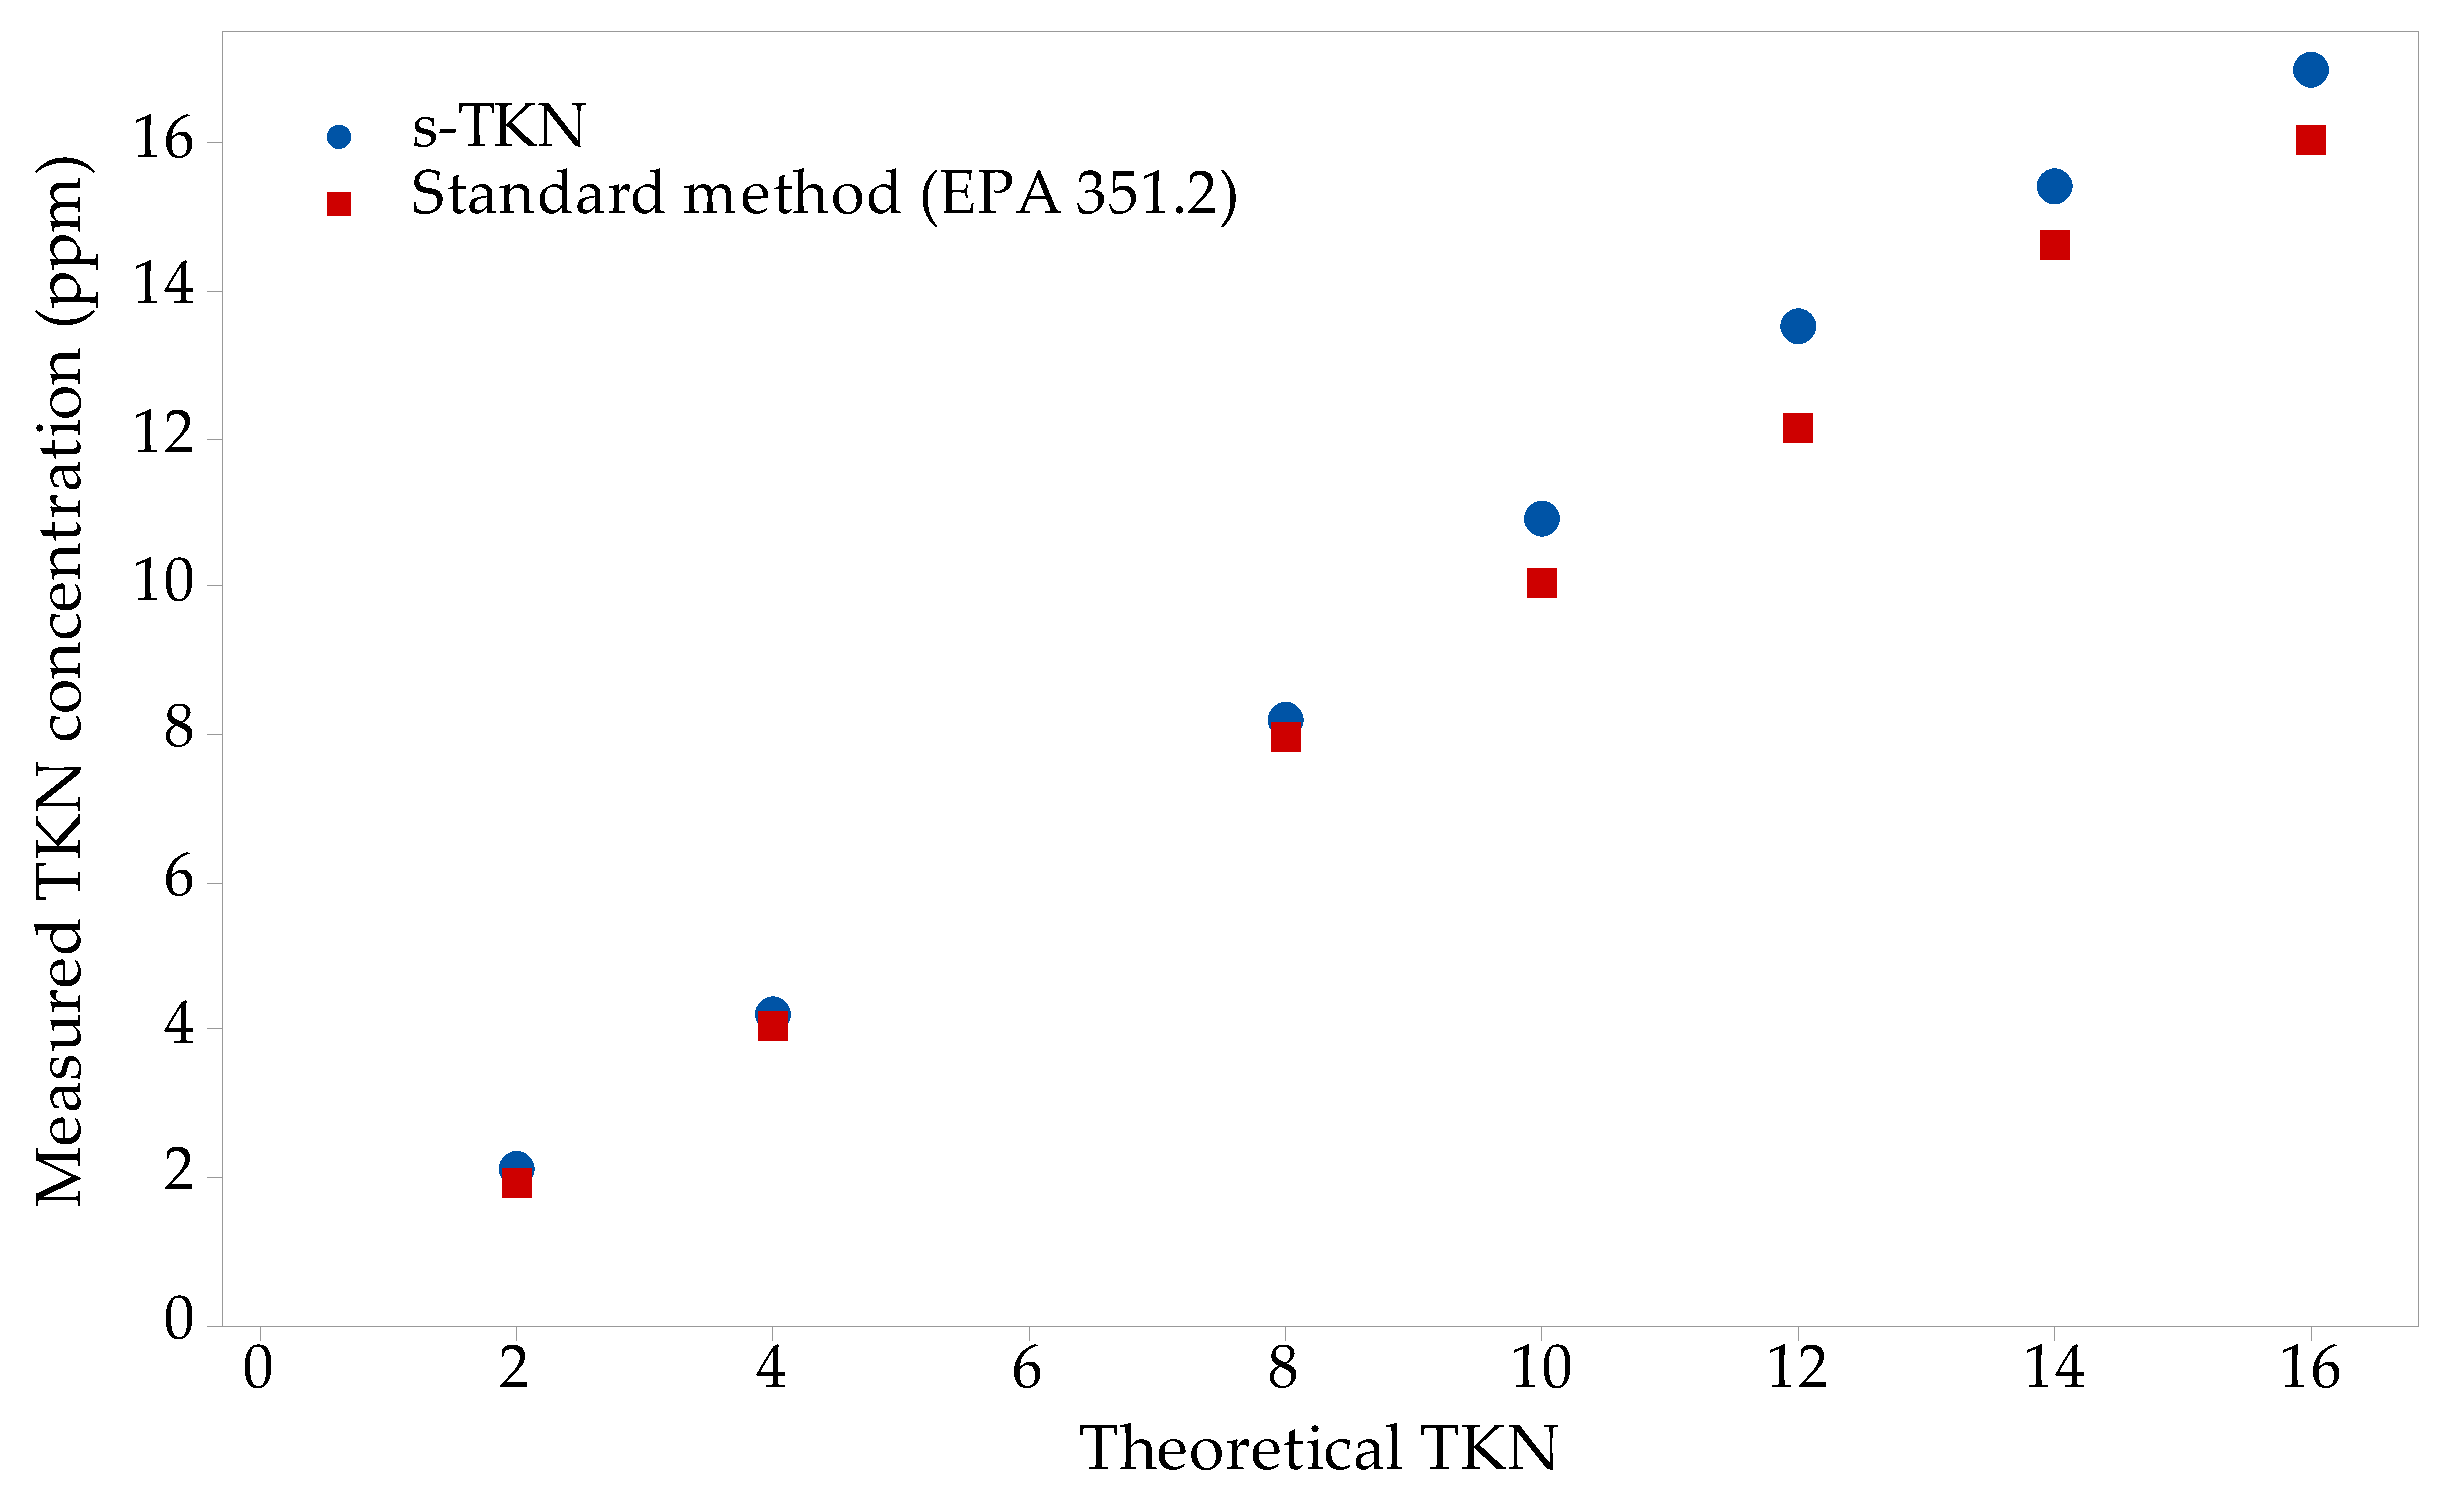
For urea, as shown in Figure 2 and Table 3, across a range of concentrations (2–16 ppm), there was good correlation between the values obtained using s-TKN™ and the standard method (r2 = 0.9922). While the error rates at some lower concentrations (2 and 4 ppm) are slightly higher in the s-TKNTM method, an overall paired t-test indicated no statistical difference (p > 0.05) between the s-TKNTM data set and that obtained using the EPA method.
We then analyzed the effect of adding nitrates on the TKN values obtained with both the standard method and the s-TKN™ method. Since the s-TKN™ method calculates the TKN values based on the difference in TN and inorganic nitrogen (as shown in equation 1) the TKN values calculated using the instrument are dependent on the concentration of TN and inorganic nitrogen. To analyze the effect of concentrations of TN and inorganic nitrogen on the calculated value of TKN, a mixed standard consisting of different concentrations of glycine-PTSA and nitrate (to account for inorganic nitrogen) was prepared and analyzed using both the s-TKN™ and EPA methods. When comparing only the TKN values, a good correlation was seen between the results obtained using both the methods (r2 = 0.9864) (Figure 3). The actual TKN values obtained are provided in the Supplementary Materials.
Figure 4 shows the contour plot for the error rate in TKN values observed as a function of the theoretical TKN and nitrate concentrations. The s-TKN™ method can measure total nitrogen concentrations from 1 to 16 ppm. The method has a higher error rate (>5%) when TKN and nitrate concentrations are close to 8 ppm. However, when higher concentrations of nitrate and total nitrogen are present, samples can be diluted and reanalyzed. For a fairly wide concentration range of TKN and nitrate, the error rate is ≤2.5%. Figure 5 shows that the contour plot for the relative standard deviation (RSD) observed was greater than 2% when the TKN and nitrate concentrations were at 8 ppm, with an overall range from 0.5 to 5.5%. As a reference, the RSD reported for the standard method is 7.6% [24].
On comparing the recovery rate (Table 4) between the standard and s-TKNTM methods, the average recovery rate is higher for the s-TKNTM method. As seen in Table 4, the recovery rates stayed relatively constant in the s-TKNTM method irrespective of the amounts of nitrate–nitrogen present in the sample.
In direct contrast, when the concentration of nitrate exceeded the concentration of TKN, the recovery rate was reduced in the standard method. In the standard method, solutions containing organic nitrogen and nitrate are heated to 300 °C and a loss of Kjeldahl nitrogen is observed [24]. This loss is due to a chemical reaction between the ammonium and nitrate, which leads to the formation of nitrous oxide.
The magnitude of this decomposition is higher in the traditional method than the s-TKNTM method, as samples are heated to a much higher temperature and have a longer digestion time (greater than 300 °C and 3–4 h) in the standard method. In contrast, digestion temperature and time (100 °C for one hour) are significantly lower in the Hach® method. Wastewater matrices and other real-world samples have the potential to have increased amounts of nitrate–nitrogen, and increased nitrate levels will lead to error in the TKN value measured using the standard method. These errors will be minimized in the Hach® method. In addition, the precision of TKN data obtained using the standard method is known to be affected when nitrate concentrations are higher than TKN values [24].
Dramatic changes in precision were not seen with the Hach® method. Even when the concentration of nitrate exceeded TKN, the RSD for TKN was around 3.3%.
Table 5 shows the overall error rate and RSD for TN and nitrate using the s-TKNTM method. TN and nitrate are directly measured colorimetrically in the s-TKNTM method. Over the range of concentrations analyzed, the RSD for nitrate was very low. The RSD for TN is well within the range reported [25]. The higher error rate obtained with 2 ppm of nitrate and 2 ppm of TKN is being re-evaluated in our laboratories at the current time. Work is also underway to collect data for mixed standards with nitrate and TKN concentrations higher than 8 ppm. Actual concentrations obtained for Nicotinic acid-PTSA, Ammonium-PTSA, Urea and mixed glycine-nitrate standard can be found under supplementary information (Tables S1–S4).
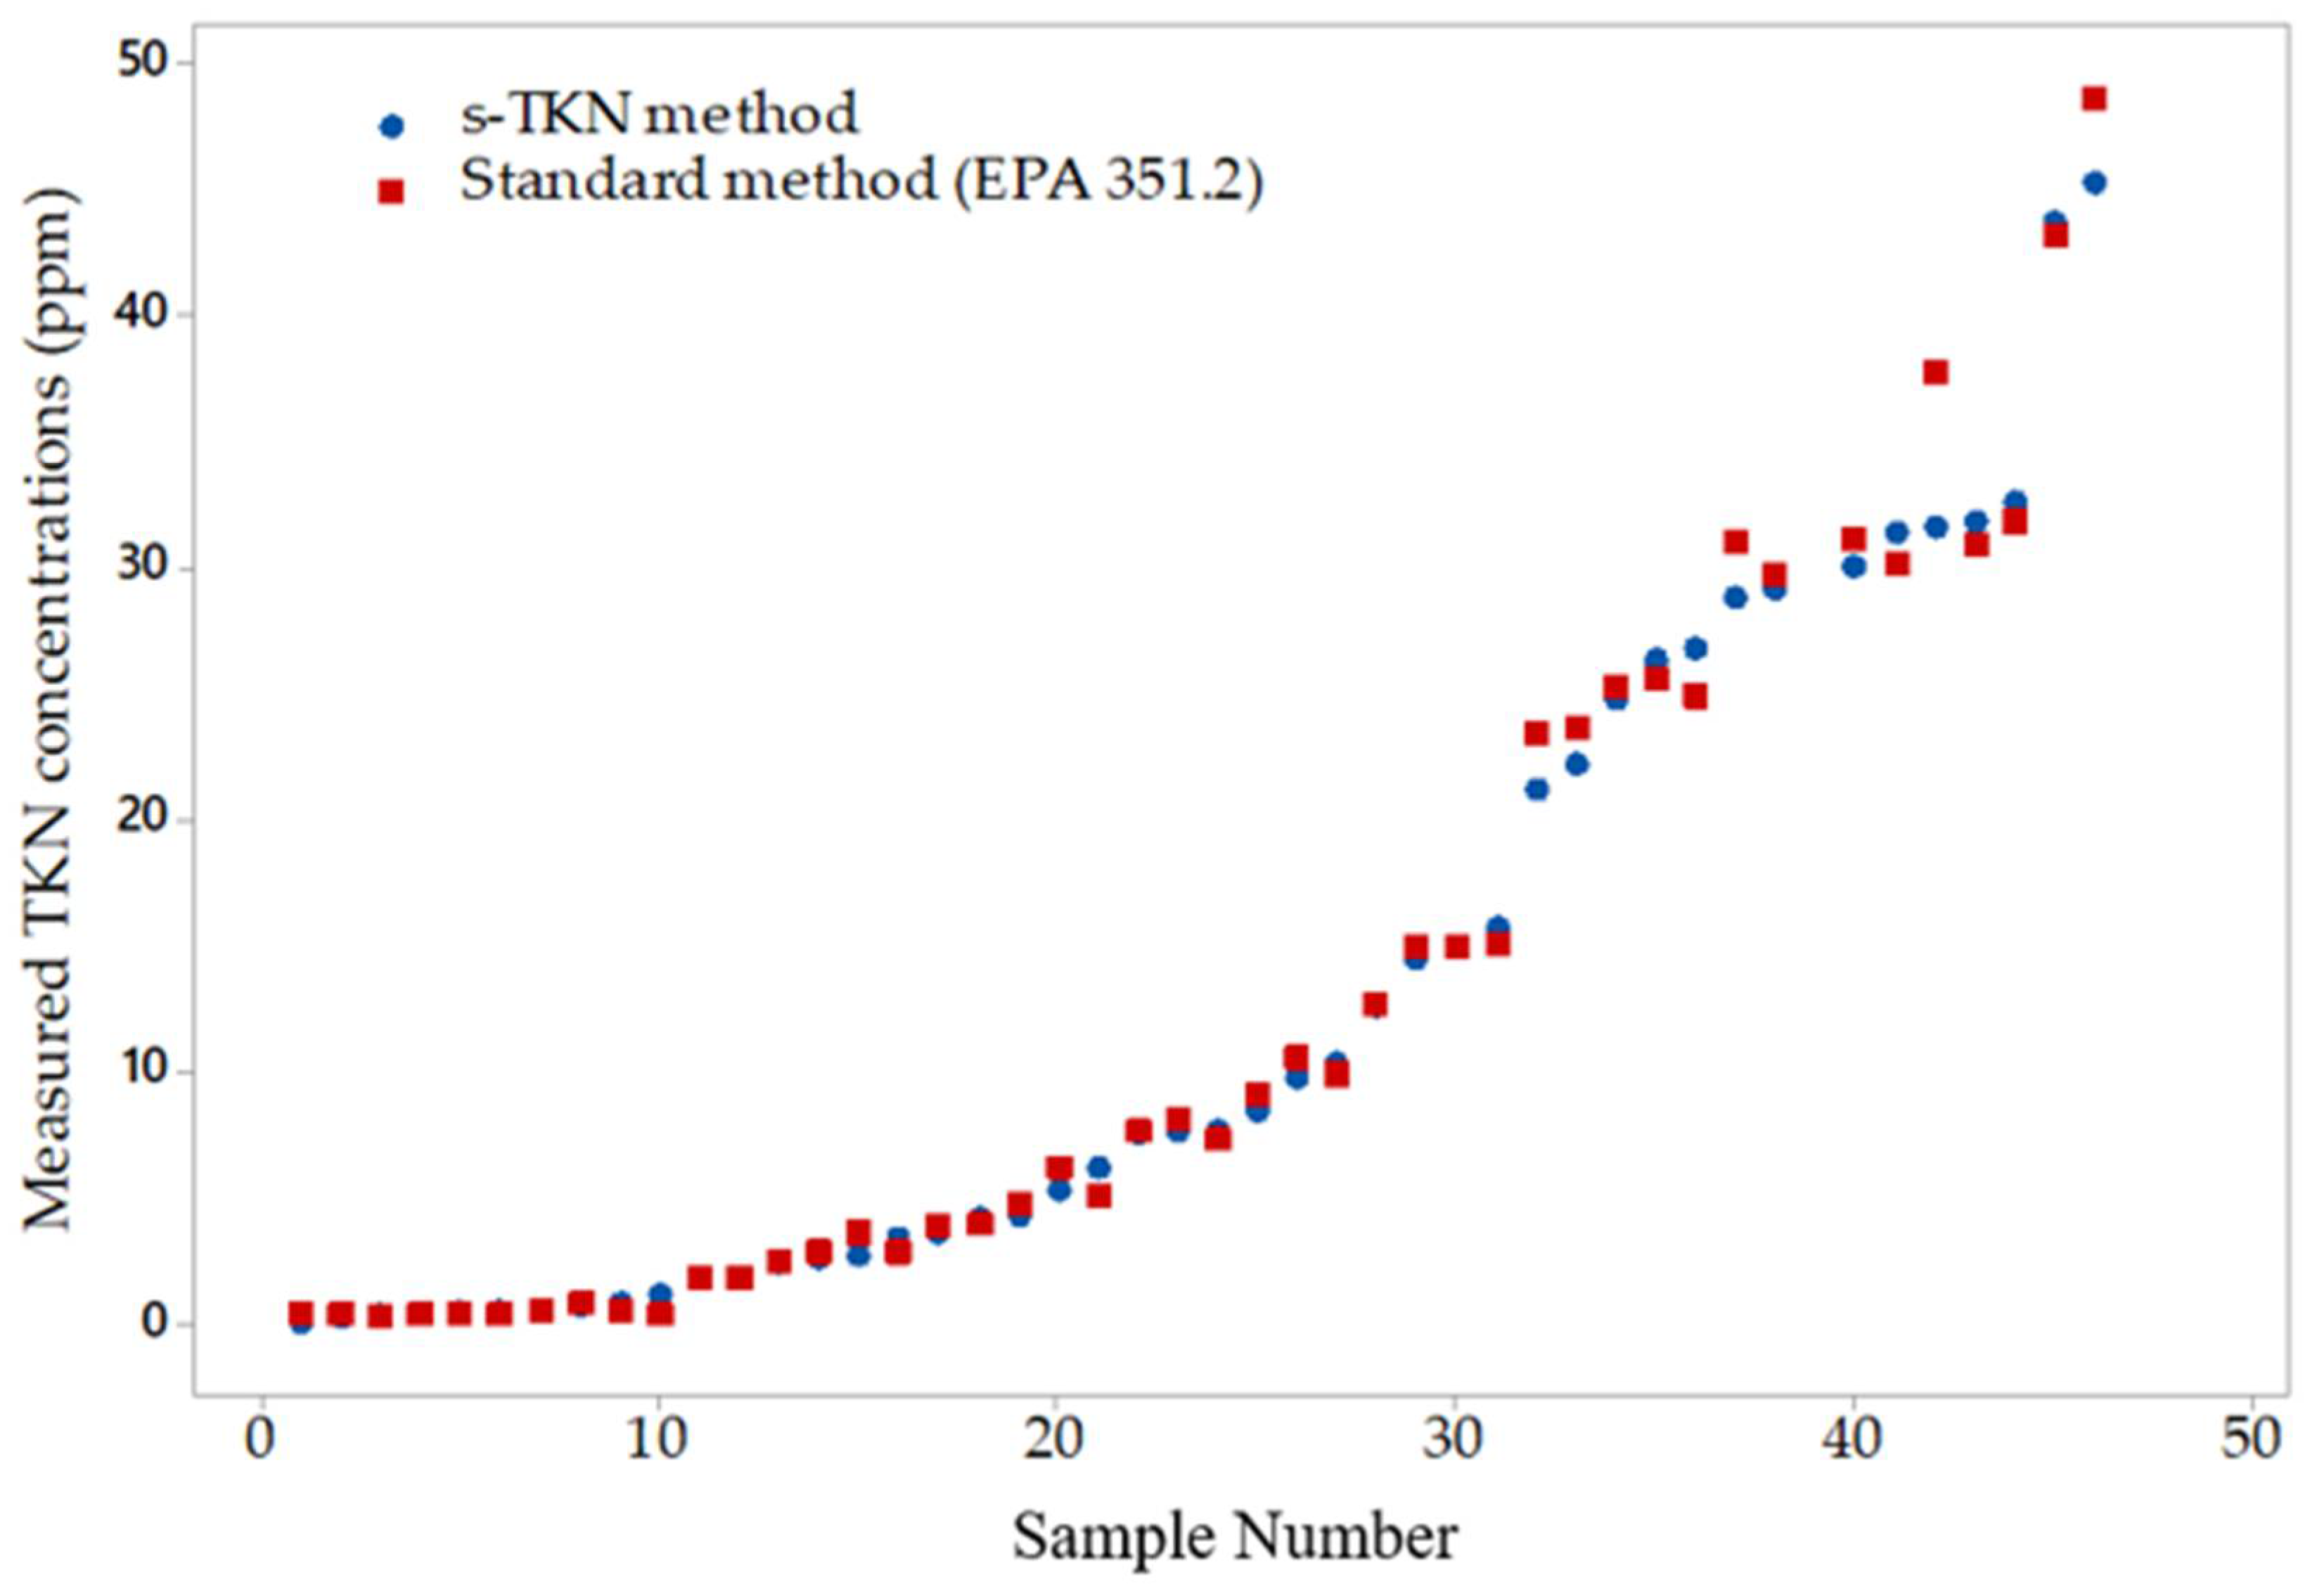
Finally, the efficacy of the Hach® method in measuring TKN values of 45 real-world samples representing wastewater influent, estuarine and lake water samples was determined and compared to the standard method. As shown in Figure 6, a good correlation was obtained between both methods (r2 = 0.9917). A Wilcoxon signed rank test indicates no significant difference between the data obtained from the s-TKN™ and standard methods (p > 0.05). Actual concentrations obtained can be found under supplementary information (Table S5).
4. Conclusions
Recent research has demonstrated the role of organic nitrogen and TKN in influencing cyanobacterial algal blooms. The standard method for measuring TKN in waste and lake water samples is tedious, time-consuming, expensive and involves the use of significant amounts of toxic acids and other reagents. The development of simpler methods to measure TKN is important in this context. The s-TKN™ method uses significantly smaller amounts of acids, and the analysis is complete in less than 1.5 h. The method is inherently safer for operators to perform and eliminates the use of hazardous reagents, such as mercury. The s-TKN™ method is EPA-compliant, cost-effective (USD 8 pertest for TKN, TN and NOx combined), while retaining good analytical efficiency comparable to the standard TKN method.
This communication is the first report comparing the efficacy of the s-TKN™ method and standard method with a variety of primary standards and water matrices. All primary standards analyzed using the s-TKN™ method show comparable precision and accuracy when compared to the standard method. Good correlation was seen between values obtained using the standard method and s-TKN™ method. In addition, for 45 different real-world samples encompassing multiple matrices, there was statistically (p > 0.05) no difference in values, and a good correlation (r2 = 0.9917) was found for the values obtained using the s-TKN™ and standard method.
Our work also demonstrates that the s-TKN™ method is largely unaffected by the presence of nitrate in the water sample. Using a mixed water standard containing TKN and nitrate, we have shown that when the nitrate concentration exceeds TKN concentrations, the recovery rate of TKN drops significantly in the standard method. Given that many real water matrices can have significantly high nitrate concentrations, the use of a standard method to measure TKN for these samples can potentially yield inaccurate values for TKN. We have demonstrated that the TKN values obtained using the sTKN™ method are independent of nitrate concentrations.
Further work is ongoing in our laboratories to document spike recoveries in wastewater samples. The results from this communication indicate that the s-TKN™ method has significant potential to reduce the expenditure associated with the cost of analysis and can be a viable environmentally friendlier alternative to the semi-automated methodology for TKN analysis.
Supplementary Materials
The following supporting information can be downloaded at: https://0-www-mdpi-com.brum.beds.ac.uk/article/10.3390/environments9050055/s1, Table S1: TKN concentrations from Nicotinic acid-PTSA measured using s-TKNTM and standard methods; Table S2: TKN concentrations from Ammonium-PTSA measured using s-TKNTM method. method; Table S3: TKN concentrations from Urea measured using s-TKNTM and standard method; Table S4: TKN concentrations from mixed standard - Glycine- PTSA and nitrate measured using s-TKNTM and standard method.; Table S5: TKN concentrations for real world matrices using s-TKNTM and standard method.
Author Contributions
Conceptualization, S.N.; methodology, T.D.H., C.M.K. contributed equally; software: T.D.H., C.M.K. contributed equally; validation: T.D.H., C.M.K. and Z.T.B.; formal analysis, T.D.H., C.M.K., C.R. and S.N.; investigation, T.D.H., C.M.K. writing—original draft preparation, S.N.; writing—review and editing, S.N. and C.R.; supervision, S.N.; project administration, S.N.; funding acquisition, S.N. All authors have read and agreed to the published version of the manuscript.
Funding
Funding from the Ohio Sea Grant (R/ER-140 PD) and Woodrow Wilson Foundation are gratefully acknowledged. Authors would like to thank Jeremy Pijor, Chief operator Avon Lake water regional water plant for providing water samples. Authors would also like to thank Sebastian Mejia, Old Woman Creek National Estuarine reserve for providing water samples.
Institutional Review Board Statement
Not applicable.
Informed Consent Statement
Not applicable.
Data Availability Statement
Not applicable.
Conflicts of Interest
The authors declare no conflict of interest. The funders had no role in the design of the study; in the collection, analyses, or interpretation of data; in the writing of the manuscript, or in the decision to publish the results.
References
- Schindler, D.W. Evolution of Phosphorus Limitation in Lakes. Science 1977, 195, 260–262. [Google Scholar] [CrossRef] [PubMed] [Green Version]
- Kane, D.D.; Conroy, J.D.; Peter Richards, R.; Baker, D.B.; Culver, D.A. Re-Eutrophication of Lake Erie: Correlations between Tributary Nutrient Loads and Phytoplankton Biomass. J. Great Lakes Res. 2014, 40, 496–501. [Google Scholar] [CrossRef]
- Stow, C.A.; Cha, Y.; Johnson, L.T.; Confesor, R.; Richards, R.P. Long-Term and Seasonal Trend Decomposition of Maumee River Nutrient Inputs to Western Lake Erie. Environ. Sci. Technol. 2015, 49, 3392–3400. [Google Scholar] [CrossRef] [PubMed]
- Davis, T.W.; Bullerjahn, G.S.; Tuttle, T.; McKay, R.M.; Watson, S.B. Effects of Increasing Nitrogen and Phosphorus Concentrations on Phytoplankton Community Growth and Toxicity during Planktothrix Blooms in Sandusky Bay, Lake Erie. Environ. Sci. Technol. 2015, 49, 7197–7207. [Google Scholar] [CrossRef] [PubMed]
- Newell, S.E.; Davis, T.W.; Johengen, T.H.; Gossiaux, D.; Burtner, A.; Palladino, D.; McCarthy, M.J. Reduced Forms of Nitrogen Are a Driver of Non-Nitrogen-Fixing Harmful Cyanobacterial Blooms and Toxicity in Lake Erie. Harmful Algae 2019, 81, 86–93. [Google Scholar] [CrossRef] [PubMed]
- Chaffin, J.D.; Bridgeman, T.B. Organic and Inorganic Nitrogen Utilization by Nitrogen-Stressed Cyanobacteria during Bloom Conditions. J. Appl. Phycol. 2014, 26, 299–309. [Google Scholar] [CrossRef]
- Chaffin, J.D.; Bridgeman, T.B.; Bade, D.L. Nitrogen Constrains the Growth of Late Summer Cyanobacterial Blooms in Lake Erie. Adv. Microbiol. 2013, 3, 16–26. [Google Scholar] [CrossRef] [Green Version]
- Chaffin, J.D.; Bridgeman, T.B.; Bade, D.L.; Mobilian, C.N. Summer Phytoplankton Nutrient Limitation in Maumee Bay of Lake Erie during High-Flow and Low-Flow Years. J. Great Lakes Res. 2014, 40, 524–531. [Google Scholar] [CrossRef]
- Glibert, P.M.; Harrison, J.; Heil, C.; Seitzinger, S. Escalating Worldwide Use of Urea—A Global Change Contributing to Coastal Eutrophication. Biogeochemistry 2006, 77, 441–463. [Google Scholar] [CrossRef]
- Monchamp, M.-E.; Pick, F.R.; Beisner, B.E.; Maranger, R. Nitrogen Forms Influence Microcystin Concentration and Composition via Changes in Cyanobacterial Community Structure. PLoS ONE 2014, 9, e85573. [Google Scholar] [CrossRef] [PubMed]
- Belisle, B.S.; Steffen, M.M.; Pound, H.L.; Watson, S.B.; DeBruyn, J.M.; Bourbonniere, R.A.; Boyer, G.L.; Wilhelm, S.W. Urea in Lake Erie: Organic Nutrient Sources as Potentially Important Drivers of Phytoplankton Biomass. J. Great Lakes Res. 2016, 42, 599–607. [Google Scholar] [CrossRef] [Green Version]
- Robertson, D.; Saad, D.A. Nutrient Inputs to the Laurentian Great Lakes by Source and Watershed Estimated Using SPARROW Watershed Models1. JAWRA J. Am. Water Resour. Assoc. 2011, 47, 1011–1033. [Google Scholar] [CrossRef] [PubMed]
- Palenik, B.; Henson, S.E. The Use of Amides and Other Organic Nitrogen Sources by the Phytoplankton Emiliania Huxleyi. Limnol. Oceanogr. 1997, 42, 1544–1551. [Google Scholar] [CrossRef] [Green Version]
- Antia, N.J.; Berland, B.R.; Bonin, D.J.; Maestrini, S.Y. Comparative Evaluation of Certain Organic and Inorganic Sources of Nitrogen for Phototrophic Growth of Marine Microalgae. J. Mar. Biol. Assoc. U. K. 1975, 55, 519–539. [Google Scholar] [CrossRef]
- Seitzinger, S.P.; Sanders, R.W. Contribution of Dissolved Organic Nitrogen from Rivers to Estuarine Eutrophication. Mar. Ecol. Prog. Ser. 1997, 159, 1–12. [Google Scholar] [CrossRef] [Green Version]
- Gobler, C.J.; Burkholder, J.M.; Davis, T.W.; Harke, M.J.; Johengen, T.; Stow, C.; Van de Waal, D. The Dual Role of Nitrogen Supply in Controlling the Growth and Toxicity of Cyanobacterial Blooms. Harmful Algae 2016, 54, 87–97. [Google Scholar] [CrossRef]
- Sáez-Plaza, P.; Navas, M.J.; Wybraniec, S.; Michałowski, T.; Asuero, A.G. An Overview of the Kjeldahl Method of Nitrogen Determination. Part II. Sample Preparation, Working Scale, Instrumental Finish, and Quality Control. Crit. Rev. Anal. Chem. 2013, 43, 224–272. [Google Scholar] [CrossRef]
- Available online: https://www.nemi.gov/methods/method_summary/9893/ (accessed on 15 March 2022).
- Schulz, C.; MacDonald, D.; Haukebo, T.; Nelson, D. Green Total Nitrogen Test Method—A Simple Alternative for TKN Analysis in Wastewater. Proc. Water Environ. Fed. 2009, 2009, 4714–4720. [Google Scholar] [CrossRef]
- Smart, M.M.; Reid, F.A.; Jones, J.R. A Comparison of a Persulfate Digestion and the Kjeldahl Procedure for Determination of Total Nitrogen in Freshwater Samples. Water Res. 1981, 15, 919–921. [Google Scholar] [CrossRef]
- U.S. Environmental Protection Agency. Sample preservation. In Methods for Chemical Analysis of Water and Wastes; EPA-600/4-79-020; U.S. Environmental Protection Agency: Cincinnati, OH, USA, 1983; pp. xv–xx. [Google Scholar]
- Available online: https://www.hach.com/simplified-tkn-s-tkn-tntplus-vial-test-0-16-mg-l-n-25-tests/product?id=7640209881#:~:text=Hach%20Method%2010242%20is%20compliant,the%20need%20to%20clean%20glassware (accessed on 15 March 2022).
- Brayton, S.V. Acid Digestions Using the Hach DigesdahlR Digestion Apparatus: Sample Preparation for Protein and Elemental Analysis; Technical Information Series—Booklet No. 14; Hach Company: Loveland, CO, USA, 1992. [Google Scholar]
- Schlueter, A. Nitrate Interference in Total Kjeldahl Nitrogen Determinations and its Removal by Anion Exchange Resins; USEPA Interagency. Energy-Environment Research and Development Program Report; 1977. Available online: https://cfpub.epa.gov/si/si_public_record_Report.cfm?Lab=ORD&dirEntryID=43817 (accessed on 15 March 2022).
- Rus, D.L.; Patton, C.J.; Mueller, D.K.; Crawford, C.G. Assessing Total Nitrogen in Surface-Water Samples—Precision and Bias of Analytical and Computational Methods; Scientific Investigations Report; U.S. Geological Survey: Reston, VA, USA, 2013; p. 48.
Figure 1.
TKN concentrations in Nic-PTSA analyzed using the s-TKNTM method and standard method.

Figure 2.
TKN concentrations in urea analyzed using the s-TKNTM method and standard method.

Figure 3.
TKN concentrations in mixed standards of Gly-PTSA-nitrate analyzed using the s-TKNTM method and the standard method.
Figure 3.
TKN concentrations in mixed standards of Gly-PTSA-nitrate analyzed using the s-TKNTM method and the standard method.

Figure 4.
Contour plot for the error percentage in measured TKN concentrations obtained using the s-TKNTM method.
Figure 4.
Contour plot for the error percentage in measured TKN concentrations obtained using the s-TKNTM method.

Figure 5.
Contour plot for the relative standard deviation in measured TKN concentrations obtained using the s-TKNTM method.
Figure 5.
Contour plot for the relative standard deviation in measured TKN concentrations obtained using the s-TKNTM method.

Figure 6.
Comparison of Hach® method and standard method on real-world samples.


Table 1.
Error rate and recovery rate of nitrogen using the simplified TKN method and the standard method (EPA 351.2) using the nicotinic acid-PTSA standard.
Table 1.
Error rate and recovery rate of nitrogen using the simplified TKN method and the standard method (EPA 351.2) using the nicotinic acid-PTSA standard.
| Theoretical TKN (ppm) | s-TKNTM Method (Percentage Error) | EPA Method (Percentage Error) | s-TKNTM Method (Percentage Recovered) | Standard Method (Percentage Recovered) |
|---|---|---|---|---|
| 2 | 1 | 1 | 99 | 99 |
| 4 | 2 | 7 | 98 | 93 |
| 8 | 3 | 4 | 97 | 96 |
| 10 | 3 | 5 | 97 | 95 |
| 12 | 2 | 5 | 98 | 95 |
| Average recovery rate | 98 | 96 | ||
Table 2.
Error rate and recovery rate of nitrogen using the simplified TKN method using Am-PTSA.
| Theoretical TKN (ppm) | s-TKNTM Method (Percentage Error) | s-TKNTM Method (Percentage Recovered) |
|---|---|---|
| 2 | 2 | 98 |
| 4 | 5 | 95 |
| 8 | 5 | 95 |
| 10 | 1 | 101 |
| 12 | 2 | 98 |
| 14 | 1 | 99 |
| 16 | 3 | 98 |
| Average recovery rate | 97 | |
Table 3.
Error rates and recovery rates of nitrogen using the simplified TKN method and the Standard method (EPA (351.2) using the urea standard.
Table 3.
Error rates and recovery rates of nitrogen using the simplified TKN method and the Standard method (EPA (351.2) using the urea standard.
| Theoretical TKN (ppm) | s-TKNTM Method (Percentage Error) | Standard Method (Percentage Error) | s-TKNTM Method (Percentage Recovered) | Standard Method (Percentage Recovered) |
|---|---|---|---|---|
| 2 | 4 | 5 | 105 | 95 |
| 4 | 5 | 1 | 105 | 101 |
| 8 | 2 | 1 | 102 | 99 |
| 10 | 3 | 6 | 103 | 106 |
| 12 | 2 | 2 | 98 | 102 |
| 14 | 5 | 5 | 105 | 105 |
| 16 | 3 | 2 | 103 | 98 |
| Average recovery rate | 104 | 100 | ||
Table 4.
Recovery rates of TKN from mixed standard - glycine–PTSA and nitrate for the standard and s-TKNTM methods.
Table 4.
Recovery rates of TKN from mixed standard - glycine–PTSA and nitrate for the standard and s-TKNTM methods.
| Theoretical Nitrate (ppm) | Theoretical TKN (ppm) | Theoretical TN (ppm) | Standard Method (Percentage Recovered) | s-TKNTM Method (Percentage Recovered) |
|---|---|---|---|---|
| 8 | 0 | 8 | NA | NA |
| 0 | 8 | 8 | 94 | 101 |
| 8 | 8 | 16 | 93 | 95 |
| 6 | 6 | 12 | 98 | 98 |
| 4 | 4 | 8 | 96 | 100 |
| 2 | 6 | 8 | 89 | 100 |
| 6 | 2 | 8 | 81 | 100 |
| 2 | 2 | 4 | 94 | 96 |
| Average recovery rate | 92 | 99 | ||
Table 5.
Percent rate and RSD of TN and nitrate in a mixed glycine–nitrate standard using the s-TKNTM method.
Table 5.
Percent rate and RSD of TN and nitrate in a mixed glycine–nitrate standard using the s-TKNTM method.
| Theoretical Nitrate (ppm) | Theoretical TKN (ppm) | Theoretical TN (ppm) | Percentage Error (TN) | RSD (TN) | Percentage Error (Nitrate) | RSD (Nitrate) |
|---|---|---|---|---|---|---|
| 8 | 0 | 8 | 1.2 | 2.2 | 3.0 | 0.5 |
| 0 | 8 | 8 | 1.3 | 1.4 | NA | NA |
| 8 | 8 | 16 | 1.9 | 1.3 | 2.0 | 0.5 |
| 6 | 6 | 12 | 0.3 | 1.6 | 4.0 | 0.7 |
| 4 | 4 | 8 | 3.0 | 3.4 | 2.0 | 0.8 |
| 2 | 6 | 8 | 0.8 | 0.6 | 4.0 | 0.7 |
| 6 | 2 | 8 | 1.1 | 0.9 | 1.0 | 0.4 |
| 2 | 2 | 4 | 1.8 | 2.0 | 11 | 0.7 |
Publisher’s Note: MDPI stays neutral with regard to jurisdictional claims in published maps and institutional affiliations. |
© 2022 by the authors. Licensee MDPI, Basel, Switzerland. This article is an open access article distributed under the terms and conditions of the Creative Commons Attribution (CC BY) license (https://creativecommons.org/licenses/by/4.0/).
Share and Cite
MDPI and ACS Style
Hicks, T.D.; Kuns, C.M.; Raman, C.; Bates, Z.T.; Nagarajan, S. Simplified Method for the Determination of Total Kjeldahl Nitrogen in Wastewater. Environments 2022, 9, 55. https://0-doi-org.brum.beds.ac.uk/10.3390/environments9050055
AMA Style
Hicks TD, Kuns CM, Raman C, Bates ZT, Nagarajan S. Simplified Method for the Determination of Total Kjeldahl Nitrogen in Wastewater. Environments. 2022; 9(5):55. https://0-doi-org.brum.beds.ac.uk/10.3390/environments9050055
Chicago/Turabian StyleHicks, Tristan D., Caleb M. Kuns, Chandrashekar Raman, Zane T. Bates, and Subhalakshmi Nagarajan. 2022. "Simplified Method for the Determination of Total Kjeldahl Nitrogen in Wastewater" Environments 9, no. 5: 55. https://0-doi-org.brum.beds.ac.uk/10.3390/environments9050055
Note that from the first issue of 2016, this journal uses article numbers instead of page numbers. See further details here.