Article

Applying the Balanced Scorecard and Predictive Analytics in the Administration of a European Funding Program

by
Alkinoos Psarras
1,*,
Theodoros Anagnostopoulos
1,2,
Nikos Tsotsolas
1,
Ioannis Salmon
1 and
Lazaros Vryzidis
1
1
Department of Business Administration, University of West Attica, 12241 Athens, Greece
2
Department of Infocommunication Technologies, ITMO University, 197101 St. Petersburg, Russia
*
Author to whom correspondence should be addressed.
Submission received: 27 October 2020 / Revised: 7 December 2020 / Accepted: 8 December 2020 / Published: 12 December 2020

Abstract

:
The performance measurement of a great variety of enterprises is a highly complicated issue, especially taking into account that performance has a great many aspects and many variables which may, at times, be highly inconsistent with each other. The use of analytics and advanced machine learning promotes the decision-making process for each and every organizational structure. This paper combines the Balanced Scorecard and predictive analytics in order to assess the performance of a co-financed European Union program, which addressed 4071 Greek Small and Medium-sized Enterprises (SMEs) that requested funding. The application of predictive analytics tools and metrics in the available dataset of all addressed SMEs reveal the M5 Model Tree regressor to be an overall best prediction model for estimating the effect of the evaluation of companies’ funding proposals on their financial results after the finalization of the co-financed program.

1. Introduction

The research data have revealed that there is an urgent need for Small and Medium-sized Enterprises (SMEs) to participate in all dimensions of international exchange as a very important contributor to economic development worldwide, as well as an important tool in dealing with many developmental issues in rapidly developing and developed countries (Prasanna et al. 2019). The internationalization of SMEs is a critical new field of studies within the majority of international markets (Cabral et al. 2020). Because of their large number, including the size of their workforce, SMEs play an increasingly competitive role in global markets. However, very few of them possess the resources and capabilities necessary to become internationalized (Genc et al. 2019). Pletnev and Barkhatov (2016) have investigated the issue of the gross domestic product (GDP) of many European countries and have found that 56% of it is contributed by the SMEs. In addition, Abdullahi et al. (2015) have conducted extensive research on SMEs and discovered that employment opportunities, as well as the alleviation of poverty, are directly linked with SME’s activities.
In order for SMEs to reach effective results, investments should be boosted. Thus, SMEs which operate both domestically and internationally should examine carefully investment projects which may improve their competitiveness. Understanding their present market position should be seriously considered, in order to choose the suitable investment plan and achieve the desired long-term outcomes. The philosophy behind the investment activities is to maintain the enterprise’s current market position and competitive advantage. It goes without saying that in an attempt to strengthen an enterprise’s competitive situation, the issue of flexibility to outside changes should be seriously taken into account. An assessment of the profitability levels of an enterprise together with the coherent analysis of risk management are always important considerations in investment decisions (Piątkowski 2020).
A variety of financial instruments can be of great importance within the domain of the European Union, in the implementation of cohesion policies for SMEs. At times, various financial aid programs may assist individual enterprises to further develop, innovate, modernize, and reinforce their operations and competitiveness. The existing operational programs of European subsidies constitute major supporting activities in the SME sector (Piątkowski 2020). Conceptual research is of utmost importance in our understanding of strategies which enhance the profitability and resolve managerial problems of SMEs by means of business projects and investments (Al-Tit et al. 2019).
It follows that SMEs play a crucial role in global economies. Especially in the Greek economy as 99.9% of registered enterprises are SMEs. In the aftermath of financial crisis, Greek SMEs have many obstacles to overcome, with the most important being the difficulty they face to access sufficient funding (Organization for Economic Cooperation and Development 2020). Consequently, because of the limited financial resources of the Greek SMEs, the maximum possible absorption and the best possible utilization of the available funding are of utmost importance.
In this paper, the Balanced Scorecard and predictive analytics are combined in order to assess the performance of the co-financed European Union financial program, “Competitive reinforcement of the Greek Small and Medium-sized Enterprises”. This financial program was materialized by a Greek government body which was responsible for implementing it and had the complete supervision of the evaluation and funding process. Research is performed with a dataset provided by 4071 companies, which submitted their investment plans to participate in this program.
More specifically, the financial perspective of the Balanced Scorecard is utilized in order to evaluate the extent to which the program’s actions affected the financial indicators of the companies which received the subsidies. This specific program aimed at financing business projects in order to modernize and reinforce the competitiveness of the Greek SMEs. These projects were oriented towards technology, business inventiveness, and employment. The strategic objective of the specific program that the present study investigates was the fortification of competitiveness of commercial businesses which belong to the tertiary sector by means of two basic interventions as follows:
-
The reinforcement and materialization of business plans aimed at the upgrading and renovation of the area where the business activity is implemented, as well as the technological and organizational modernization of commercial corporations.
-
The promotion of collaborations between businesses within a particular industry. These collaborations could have as a main target either the materialization of common purchases between suppliers in order to create economies of scale, or the common usage of storage area, the development of common distribution networks, etc.
The rest of the paper is organized as follows: Section 2 provides a literature review on the Balanced Scorecard method as well as on predictive analytics. Section 3 describes the research methodology that was used for the study, while in Section 4 the research results are found. Finally, the paper is concluded with the discussion of the results in Section 5 and the conclusions summary in Section 6.

2. Literature Review

2.1. Balanced Scorecard

The Balanced Scorecard constitutes one of the most important business tools developed in recent years and is widespread in business, industry, governments, and non-profit organizations (Grigoroudis et al. 2012). The thorough research of Madsen and Slåtten (2013) identified which factors are responsible for the wide diffusion of the Balanced Scorecard in certain countries. The role of consulting and software firms seems to be of great importance. In their recent study, Madsen and Slåtten (2015) illustrated how the idea of the Balanced Scorecard spread among countries, sectors, or organizations and how it is implemented within an organization. It is evident that the adoption process of management ideas such as the Balanced Scorecard is driven by supply and demand. This is due to the fact that consultants try to discover more complex management concepts and provide their clients with customized consulting services.
The present research utilizes the Balanced Scorecard as a tool in order to assess the effectiveness of a co-financed European Union program, which is aimed at fortifying the competitiveness of Greek SMEs. Recent research efforts highlight the importance of the Balanced Scorecard in assessing the performance of various schemes. For instance, Chen et al. (2020) applied the Balanced Scorecard in order to evaluate the sustainable performance of Chinese emerging family farms. Similarly, Pham et al. (2020) evaluated the performance of public hospitals in Vietnam, while Bawaneh (2019) measured the effectiveness of Jordanian manufacturing companies. The present study differs from several other studies as it utilizes intelligent analytics in order to predict the values of the financial indicators given the implemented actions.
The Balanced Scorecard supports the strategic planning and change management by aligning and transmitting the strategy and vision of the organization for each and every employee (Kaplan and Norton 1996). This is achieved by connecting the targets of the organization with the targets of its relevant departments. It is evident that organizational environments are evolving rapidly and becoming increasingly complex. They are also more capable in dealing with organizational changes and innovations in order to cope with corporate competitiveness. As a consequence, which Kim and Choi (2020) have pointed out, the shorter product life-cycles because of rapid technological change make competition more intense and demand highly unpredictable. Thus, the use of balanced approaches to performance management is absolutely vital.
The Balanced Scorecard investigates the organization by means of four different perspectives (Kaplan and Norton 1992):
  • The financial perspective (earnings per share, return on total assets, return on equity, etc.);
  • The customer perspective (market share, customer satisfaction, brand recognition, customer retention, customer complaints, etc.);
  • The internal business process perspective (cycle time, cost of services, capacity usage rate, labor utilization rate, etc.);
  • The learning and innovation perspective (employee productivity, employee satisfaction, number of cross-trained employees, leadership development, etc.).
Identifying and analyzing the intricate relations among the four aforementioned perspectives is of great importance in the implementation of the Balanced Scorecard. An important finding in the relevant literature is that this is because the changes which take place affect each other in a non-linear form (Salmon et al. 2019). In each and every perspective, the Balanced Scorecard places emphasis not only on result-oriented criteria concerning what should be achieved, but also on criteria targeted as to how it should be achieved. Following this scheme, Papalexandris et al. (2005) have highlighted in their study that a satisfactory equilibrium is achieved among short- and long-term objectives concerning the outcomes (lag performance measures) and the performance drivers (lead performance measures) of these particular outcomes.
Nevertheless, the contribution of the Balanced Scorecard—the evident realization of a great many performance alternatives, not considering the situation from the viewpoint of financial standards, adds complexity to the measurement of performance. Studies have brought to our attention the fact that the size of an organization, its structural complexities, and the variety of processes involved, are some of the important issues which make the measurement of organizational performance a complex issue (Keeble et al. 2003). The development of the right set of performance indicators within an organization requires the involvement of every unit which is demanded to apply them. In order to solve the problem at hand, the use of predefined models such as the Balanced Scorecard, so as to measure overall organizational performance, is a common practice (Medne and Lapina 2019). With regard to the so-called information overload, one should bear in mind the existing biases and the various evaluations which enhance the indicators of the Balanced Scorecard (Chan 2009). Siskos and Spyridakos (1999) came to the conclusion that multi-criteria applied in the decision-making process are absolutely necessary for dealing with this elaboration, in an attempt to evaluate performance and reach the desired outcomes.
Concerning the correct application of the Balanced Scorecard, organizations should closely examine their strategy so as to develop the strategic objectives which will be closely interrelated to the cause and effect target. In turn, the strategic objectives must be related to qualitative measures, which will be specifying what the organization should do in an attempt to achieve them. These indicators are connected with specific targets, which have a predetermined timetable of materialization. The last vital step according to Salmon et al. (2019), concerning the achievement of the aforementioned targets, is that specific action plans will be selected, which also have predefined timetable and budget constraints. Falle et al. (2016) in their research presented a solid example of the development and implementation of the Balanced Scorecard in an SME, illustrating various supporting factors and challenges which affect this process. The special needs of each and every organization should always be taken into account throughout the application process.
It should be kept in mind that although a solid evaluation metric is in existence, the results cannot always be predictable. In those cases that the distance between company goals and current criteria is enlarged, the use of feedback systems may boost its effectiveness (Cha et al. 2019). Nigri and Del Bardo (2018) investigated the integration of sustainability indicators in an attempt to apply them in managerial systems. In addition, they examined a variety of management systems to be used as a benchmark for reporting the outcomes.
According to Yun and Yigitcanlar (2017), in an attempt to be highly competitive, organizations should take into account altering their business models constantly. They must also assess the results of their decisions and actions while they continuously compete for resources and customers (Bentes et al. 2012). Knowledge management is a key element in favor of this process. Knowledge assets instigate an organization’s success and are an important parameter in the creation of values in order to ameliorate business performance together with entrepreneurial thinking and increasing business opportunities (Yan et al. 2019). Organizations using the Balanced Scorecard can better closely examine the extent to which their strategies bring about positive results. However, it should be reminded that due to the fact that they have a tendency to become increasingly service-oriented with less concrete expected results, the implementation of the Balanced Scorecard scheme provides a real challenge to them.
Bearing in mind that a relevant performance measurement tool is at hand like the Balanced Scorecard, enterprises of all kinds are capable of specifying their vision by means of outcomes which can be measured (Shepko and Douglas 1998). In this way, the projects within a particular structure can be better monitored and directly related to the individual strategic plans of the organization. Projects can be perceived as “mini-organizations”, demanding the exact specification and benchmarks of the parent corporation. Due to the fact that projects are somewhat more structured and controllable in conjunction to a specific organization, they have been associated with a high failure rate in the majority of the success-oriented variables (Stewart 2001). In an attempt to manage projects more successfully, as well as the general wellbeing of the organization which is the main provider of these services, the Balanced Scorecard methodological approach can be implemented with the aim of conducting health checks for the entire life-cycle of a particular project.
The Balanced Scorecard has been traditionally applied in private enterprises but recently it has proved useful in a variety of publicly funded projects (Kim et al. 2017). Due to the fact that the use of public funds has been scrutinized by governments, many public organizations have resorted to the private sector in an attempt to improve their accountability (Northcott and Taulapapa 2012). One should bear in mind that the transition from private to public enterprises in terms of using the Balanced Scorecard is not an easy one and many modifications are required in its implementation. This is because there seem to be multiple conglomerates of both customers and stakeholders, concerning the dissimilar elements of public organizations (Greatbanks and Tapp 2007).
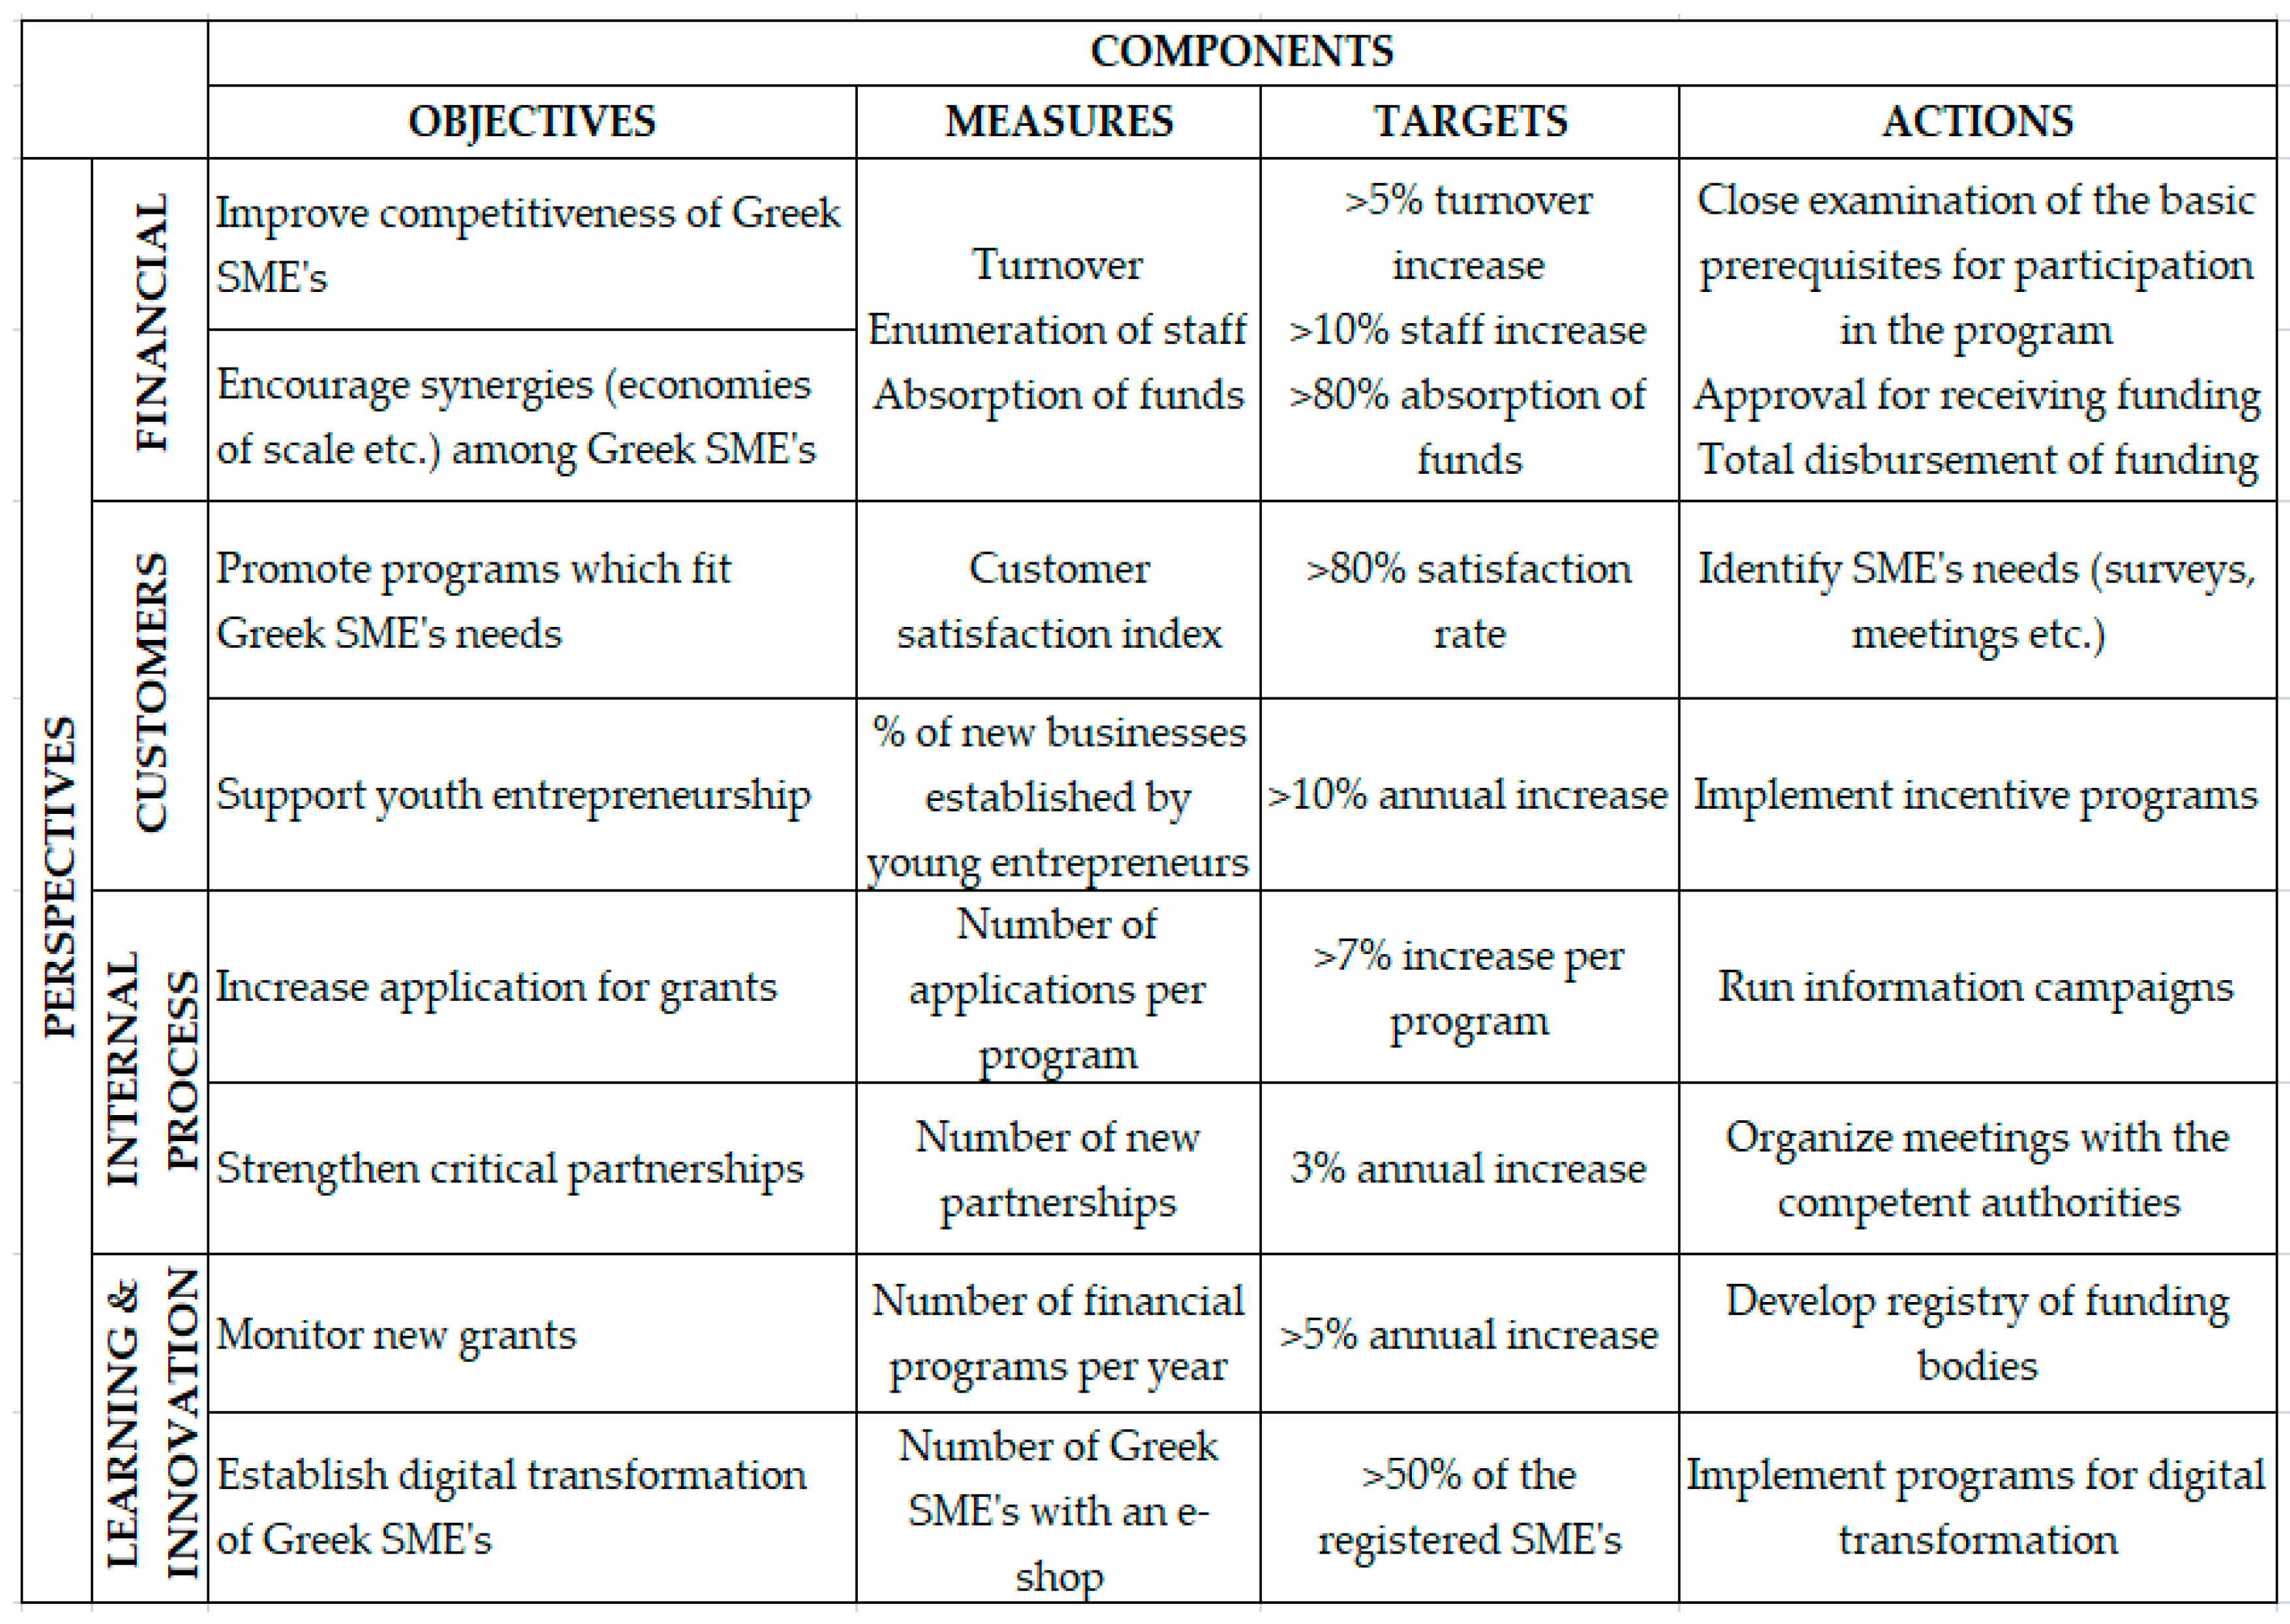
Given the aforementioned, Figure 1 exhibits the Balanced Scorecard of the government body which materialized the financial program studied in the present paper.

2.2. Predictive Analytics

Invaluable information can be extracted using Big Data Analytics (BDA) including descriptive, predictive, and prescriptive research. Recent studies have highlighted the contributions of big data and predictive analytics in tackling modern era problems and in creating cutting edge technologies. Lyons and Lăzăroiu (2020) and Scott et al. (2020) investigated the use of smart city data in dealing with the COVID-19 crisis. Poliak et al. (2020) conducted a research study to investigate the social dimensions of a new technology which is based on BDA, like self-driving cars. Similarly, Bourke et al. (2019) and Eysenck et al. (2019) highlighted with their research how predictive analytics can assist decision-making concerning the evolution of Industrial Internet of Things Systems.
In business environments, the use of analytics and advanced machine learning promotes the decision-making process for each and every organizational structure (Lismont et al. 2017). Meyers et al. (2019) have studied how the use of workforce analytics facilitates personnel objective settings and planning. Other researchers have used analytics to estimate future financial performance. Lee et al. (2018) have studied the extent to which there is a connection between business sales patterns and business text patterns, in an attempt to predict the future financial performance of a company by means of business text analysis. The analysis of data patterns and variables can lead to improved statistical models and a great variety of related applications. It has been customary to utilize machine learning algorithms in order to conduct effective analyses in the process industry. The various existing applications of machine learning have not only provided invaluable information in the decision-making process but have also modified the style of the process industry as a whole (Ge et al. 2017).
There is a great variety of reasons why organizations utilize analytics. Some of these are: advancing the effectiveness of financial and operational outcomes, reinforcing both local and global perspectives, and the establishment of funding programs of changing economies. The implementation of predictive analytics suggests a great variety of benefits, such as the achievement of a more satisfactory organizational performance as well as a better understanding of organizational dynamics including a better application of available data (Rajni and Malaya 2015). The final gains of BDA in business management is to arrive at more effective decision-making processes, comprehend business activities to a greater degree, minimize risk, and contribute to a better understanding of consumer behavior, always aiming at customer satisfaction (Mello and Martins 2019).
The starting block in machine learning model development is data preparation. This involves extracting the dataset from the database, examining the dataset structure, and making data selections (Ge et al. 2017). After the dataset is identified, a suitable regression model is selected in order to perform the analysis. There are various regressors that can be selected in order to analyze the dataset, such as Linear Regression, Support Vector Regression (SVR), Artificial Neural Network (ANN), k-Nearest Neighbors (k-NN), and M5 model tree. Linear regression is used in order to model the relationship between a dependent variable and one or more independent variables. On the other hand, SVR tries to maintain the error within a certain threshold, while the majority of linear regression models aim at minimizing the sum of squared errors. From another perspective, SVR allows us to examine the acceptable error within the model.
In addition, ANN’s attempt at investigating systems of interrelated neurons which are involved in the mutual exchange of messages is just like the biological neural networks. Each and every connection has been assigned with numeric weights, which can be modified based on the experience related to the entire learning process. Thus, ANNs are able to approximate any type of function by learning from the available data (Ge et al. 2017). Furthermore, k-NN can be used for both classification and regression. In both cases, the input consists of the k closest training samples while the output is related to the extent to which the method is applied to either classification or regression (Ge et al. 2017). Finally, the M5 model tree constitutes a decision tree learner applied in predicting values for a numerical response variable Y and can predict continuous numerical attributes. The M5 model tree is a way of simulating even hundreds of attributes with wide varieties of dimensionality (Kisi et al. 2017).

3. Research Methodology

3.1. Area of Study

The research was performed with a provided dataset of 4071 companies, which are the total number of companies that submitted their investment plans to participate in the co-financed European Union financial program, “Competitive reinforcement of the Greek Small and Medium-sized Enterprises”. Companies undergo three phases of evaluation and only a specific number of companies passes each one of the three subsequent phases, and the corresponding evaluations were used in the experiment of the current research effort.
Specifically, in the first phase, 4071 organizations, which had submitted proposals concerning the covering of their basic standings, were evaluated. These standings were set by the financial advisory body of the program. In the second phase, the business plans of the companies that were successful in the first phase were evaluated. In the third phase, the total financial disbursement was realized concerning the companies that passed the second phase. This was received by corporations whose business plans were approved and completely materialized. There were also 575 organizations whose business plans were approved on the one hand, but they did not receive the total approved disbursement as they did not materialize it as a whole.

3.2. Experimental Setup Dataset Structure

The data of the present study was retrieved from the database of the Greek government body which was responsible for implementing the program. For each one of the three phases, the provided evaluations were included in the given dataset. In each and every phase, companies received nominal values (0,1) based on the results of their evaluation, namely rejected/accepted. The available data from the companies, corresponding to the financial perspective of the Balanced Scorecard, namely Turnover (TUR), Enumeration of Staff (EOS), and Absorption of Funds (AOF), have been processed one year before and one year following the program for each and every corporation which took part in the program.
Nominal values in this research took only two values, 0 and 1. Such variables are called binary variables. Three independent binary variables were utilized in relation to the three discrete evaluation phases, namely: (1) Close examination of the basic prerequisites for participation in the program (CEP), (2) Approval for receiving funding (ARF), and (3) Total disbursement of funding (TDF). Specifically, CEP takes a value of 0 when companies do not comply with the basic criteria for participating in the program, and a value of 1 when companies reach all qualifications. ARF takes a value of 0 when companies’ business plans were dismissed, and a value of 1 when companies’ business plans were approved. TDF takes a value of 0 when companies’ business plans were approved in the second phase but were not completely materialized, and a value of 1 when companies’ business plans were approved in the second phase and were completely materialized.
The dataset has also three dependent numerical variables, namely: (1) Turnover, (2) Enumeration of staff, and (3) Absorption of funds. Specifically, Turnover measures the proportionate percentage change in turnover (e.g., one year before the program in conjunction with the year following the program). Enumeration of Staff measures the proportionate percentage change of the number of staff (e.g., one year before the program in conjunction with the year following the program). Absorption of Funds measures the amount of approved budget over the maximum limit of the funding. The dataset structure is presented in Table 1 and a sample of the dataset is presented in Table A1 in Appendix A.
The dataset has 4071 instances, where each instance depicts all the available information of a unique company taking part in the research effort. Thus, intelligent analytics are performed in order to predict with regression the values of the three dependent variables (TUR, EOS, AOF) for each company given certain values of the independent variables (CEP, ARF, TDF). The aim is to find an overall best regressor to apply to each of the three dependent values, which correspond to each one of the three evaluation phases. The research question is whether someone could predict the level of achievement of the three targets (dependent variables), which are belonging to the financial perspective of the Balanced Scorecard, by knowing the results of the evaluation in all three phases (independent variables).
The given dataset was evaluated, provided by the companies, which is decomposed in certain independent nominal variables and subsequent dependent numerical values of the current research effort.

3.3. Evaluation Method and Metrics

Machine learning regression algorithms are used as the core object of an intelligent predictive inference regression model to perform data analytics. Such algorithms are input with numerical and/or nominal values assigned to certain independent variables and can predict the numerical value of a dependent numerical variable. This process is defined as regression and the machine learning algorithm as regressor.

3.3.1. Adopted Regressors

To define which regressors to adopt, the authors experimented with certain regression algorithms available in Weka (Frank et al. 2016). Such regressors are: (1) Linear Regression, (2) Support Vector Regression, (3) Artificial Neural Network, (4) k-Nearest Neighbors, and (5) M5 Model Tree. The Normalized Root Mean Square Error (NRMSE) value of each selected regressor was assessed in order to rank them and define the optimum one for the problem, for each of the three dependent variables. The selected regressors were experimented for all the three dependent variables, whereby the efficiency of these regressors was investigated locally in order to reach a prediction of a specific dependent variable and the overall best regressor.

3.3.2. 10-Fold Cross Validation

The adopted regression models were evaluated with the 10-fold cross validation evaluation method, which divides the initial dataset to 10 equal sized parts and then in a certain loop incorporates the first 9 parts to train the regressor and the remaining 1 to test the regressor. This process is repeated until all the parts are used for training and testing.

3.3.3. Normalized Root Mean Square Error (NRMSE)

The effectiveness of the adopted regressors was assessed by incorporating the Normalized Root Mean Square Error (NRMSE) evaluation metric, NRMSE [ 0 , 1 ] , which is defined in the following equation:
NRMSE = ( p a ) 2 ¯ a ¯
where p are the predicted values, a are the actual values, and a ¯ , is the average of the actual values of the depended regression variable. A low value of NRMSE means an efficient regressor, while a high value of NRMSE means a week regressor. A threshold of NRMSE < 0.5 indicates that the adopted regressor has an acceptable prediction behavior, while a value of NRMSE   0.5 indicates that the mean of the dependent variable distribution cannot be hardly predicted, which means that the regressor is very weak (Frank et al. 2016).

3.3.4. Experimental Setup Parameters

The experimented parameters of the adopted dataset include the experimented regressors, the evaluation method, as well as the evaluation metric incorporated to assess the proposed regression models, as shown in Table 2.
The analysis was conducted taking into account the financial perspective of the Balanced Scorecard. The basic objective targets of this perspective are the competitive reinforcement and the strengthening of collaborations among Small and Medium-size Enterprises. The present study investigates the extent to which the actions of the program (CEP, ARF, TDF) improved the indicators of the financial perspective (TUR, EOS, AOF) and ensured the achievement of the program’s objective targets.

4. Research Results

4.1. Experimented Regressors’ Evaluation

The regression algorithms of the proposed model were evaluated for the adopted dataset. The 10-fold cross validation was applied to the dataset. For the selected regressors, the following values of NRMSE were observed for the three dependent variables (TUR, EOS, AOF) for each company given certain values of the independent variables (CEP, ARF, TDF), either for local or for overall regression prediction. The locally efficient regressors are indicated with an asterisk (*). To generalize the outcome of the current research, a pair t-test was applied to the regression results of each regressor.

4.1.1. Local Regression for TUR

The experimented Linear Regression achieved NRMSE =   0.1096 *, SVR achieved NRMSE =   0.1098 , ANN achieved NRMSE =   0.1219 , k-NN achieved   NRMSE =   0.1097 , and M5 Model Tree achieved NRMSE =   0.1096 *, as shown in Table 3. Linear Regression and M5 Model Tree regressors achieved the higher local prediction for TUR, so these regressors were adopted for further experiments to define the overall best regressor for all the three dependent variables.

4.1.2. Local Regression for EOS

The experimented Linear Regression achieved NRMSE =   0.0515 , SVR achieved NRMSE =   0.0566 , ANN achieved NRMSE =   0.0538 , k-NN achieved   NRMSE =   0.0546 , and M5 Model Tree achieved NRMSE =   0.0506 *, as shown in Table 4. M5 Model Tree regressor achieved the higher local prediction for EOS, so these regressors were adopted for further experiments to define the overall best regressor for all the three dependent variables.

4.1.3. Local Regression for AOF

The experimented Linear Regression achieved NRMSE =   0.1309 *, SVR achieved NRMSE =   0.1413 , ANN achieved NRMSE =   0.1577 , k-NN achieved NRMSE =   0.1309 *, and M5 Model Tree achieved NRMSE =   0.1309 *, as shown in Table 5. Linear Regression, k-NN, and M5 Model Tree regressors achieved the higher local prediction for AOF, so these regressors were adopted for further experiments to define the overall best regressor for all the three dependent variables.

4.1.4. Proposed Overall Regressor for Dependent Variables

To define the proposed regressor for the three dependent variables, certain notations were used. Specifically, the overall best regressor was denoted with the symbol ++, which is efficient for each of the three dependent variables. The weak regressors are denoted with , since they are worse in every variable. Medium efficiency regressors are denoted with the symbol + −, since they are efficient for at least one variable but not for all the three variables, as shown in Table 6. The experimented Linear Regression achieved NRMSE =   0.1309 *, SVR achieved   NRMSE =   0.1413 , ANN achieved NRMSE =   0.1577 , k-NN achieved NRMSE =   0.1309 *, and M5 Model Tree achieved NRMSE =   0.1309 *, as shown in Table 5. Linear Regression, k-NN, and M5 Model Tree regressors achieved the higher local prediction for AOF, so these regressors were adopted for further experiments to define the overall best regressor for all the three dependent variables, as shown in Table 6. Thus, the M5 Model Tree regressor was adopted as the overall best prediction model.

5. Discussion

The purpose of this paper was to assess the efficiency of a co-financed European Union program by means of its impact on the financial perspective targets of the participated companies as these targets are set within the application of the Balanced Scorecard. In order to evaluate each and every perspective of the Balanced Scorecard, it is very important that the following sequence must be defined: strategic objectives -> measures -> targets -> actions, as shown in Figure 1. The main strategic objective of the program, which is under study, was the reinforcement of competitiveness of Greek SMEs which belong to the tertiary sector. The actions which contribute to the realization of these strategic objectives are the three phases through which the businesses that submitted their investment plans underwent. As mentioned above, these phases are the following: (1) Close examination of the basic prerequisites for participation in the program, (2) Approval for receiving funding, and (3) Total disbursement of funding. The indicators by means of which the effectiveness of the aforementioned actions were evaluated are: (1) Turnover, (2) Enumeration of staff, and (3) Absorption of funds. In short, the actions of the Balanced Scorecard constitute the independent variables and the indicators constitute the dependent variables of the dataset.
The question answered by the aforementioned analysis is to what extent the actions of this program affected the financial indicators of the companies which received financing in conjunction with the corresponding indicators of the companies which did not receive financing. Although the present study experiments with several complex regression models such as ANNs and SVR, it was proved that the simplest models, like Linear Regression, k-NN, and M5 Model Tree, outperform the more complex ones in the present research effort. This is exactly the impact of machine learning in the scientific community since the specific research area depends on the experimented domain knowledge that cannot be exclusively modeled due to implicit loss of information in the real world problem we study uniquely.
As previously mentioned, the contribution of the Balanced Scorecard involves the use of a great variety of multiple performance perspectives with the exception of the financial considerations involved. This study focuses on the financial perspective because of the available data, without this suggesting that the remaining perspectives are not equally important. The future research will be focused on identifying the effect of the program’s actions and the remaining dimensions of the Balanced Scorecard, modeling all four perspectives. By adding more targets, which belong to other dimensions, like dependent variables in the prediction models, more independent variables shall be also considered in order to structure more accurate models. Some of these independent variables could be scale variables, ordinal variables, or nominal variables with more than two categories and not just binary ones, because binary independent variables may not be accurate predictors of the dependent variable, which is a limitation of the current study as well.

6. Conclusions

This study integrates two tools, the Balanced Scorecard and predictive analytics, to provide a better assessment of the outcomes of a co-financed European Union program which was materialized by a Greek government body. The present research indicates that the simplest models like Linear Regression, the k-NN, and the M5 Model Tree, uncovered a positive correlation between the program’s actions and the financial indicators of the companies which received the subsidies. Future research will be centered upon identifying the outcome of the program’s actions in more accurate ways by involving more dependent variables from the Balanced Scorecard model and also more independent variables to run predictive analytics for the production of more accurate predictors. Moreover, data for all the remaining dimensions of the Balanced Scorecard should be collected in order to structure a model for all perspectives as a whole.

Author Contributions

Conceptualization, A.P. and I.S.; methodology, I.S. and L.V.; software, T.A.; validation, T.A. and N.T.; formal analysis, T.A.; investigation, A.P.; resources, A.P.; data curation, T.A.; writing—original draft preparation, A.P.; writing—review and editing, T.A. and N.T.; visualization, A.P. and N.T.; supervision, I.S. and L.V.; project administration, I.S. and L.V.; funding acquisition, I.S. All authors have read and agreed to the published version of the manuscript.

Funding

This research was funded by the course of Advanced Quantitative Statistics offered by the Master of Business Administration (MBA) of the Department of Business Administration at the University of West Attica, Greece.

Conflicts of Interest

The authors declare no conflict of interest.

Abbreviations

The following abbreviations are used in this manuscript:
ANNArtificial neural network
AOFAbsorption of funds
ARFApproval for receiving funding
BDABig data analytics
CEPClose examination of the basic prerequisites for participation in the program
EOSEnumeration of staff
GDPGross domestic product
k-NNk-nearest neighbors
NRMSENormalized root mean square error
SMEsSmall and medium-sized enterprises
SVRSupport vector regression
TDFTotal disbursement of funding
TURTurnover

Appendix A

Table A1. Dataset sample.
Non−Dependent VariablesDependent Variables
Company IDCEPARFTDFTUREOSAOF
1000−5.00%100.00%0.00%
200011.20%−25.00%0.00%
31118.98%0.00%91.22%
411119.92%50.00%46.20%
5000−9.82%0.00%0.00%
6110−1.55%−16.67%78.02%
71116.70%0.00%100.00%
811011.63%50.00%88.19%
9100−16.24%−33.33%0.00%
101102.19%0.00%78.68%
111101.94%11.11%43.90%
121113.51%0.00%44.22%
130009.78%0.00%0.00%
140001.88%−25.00%0.00%
15100−8.15%0.00%0.00%
1600018.33%0.00%0.00%
17100−1.68%0.00%0.00%
181114.65%12.50%97.01%
191000.71%−11.11%0.00%
2011112.25%100.00%99.97%

References

  1. Abdullahi, Mohammed Sani, Puspa Liza Ghazali, Zainudin Awang, Izah Mohd Tahir, and Nor Azman Mat. 2015. The effect of finance, infrastructure and training on the performance of small and medium scale enterprises (SMEs) in Nigeria. International Journal of Business and Technopreneurship 5: 421–52. [Google Scholar]
  2. Al-Tit, Ahmad, Anis Omri, and Jalel Euchi. 2019. Critical Success Factors of Small and Medium-Sized Enterprises in Saudi Arabia: Insights from Sustainability Perspective. Administrative Sciences 9: 32. [Google Scholar] [CrossRef] [Green Version]
  3. Bawaneh, Shamsi S. 2019. Using the Balanced Scorecard Perspectives to Measure the Performance of Manufacturing Companies in Jordan. Academy of Accounting and Financial Studies Journal 23: 1–15. [Google Scholar]
  4. Bentes, Alexandre Veronese, Jorge Carneiro, Jorge Ferreira da Silva, and Herbert Kimura. 2012. Multidimensional assessment of organizational performance: Integrating BSC and AHP. Journal of Business Research 65: 1790–99. [Google Scholar] [CrossRef]
  5. Bourke, Eilis, Maria Kovacova, Jana Kliestikova, and Zuzana Rowland. 2019. Smart Industrial Internet of Things Devices, Services, and Applications: Ubiquitous Sensing and Sensory Data, Predictive Analytics Algorithms, and Cognitive Computing Technologies. Analysis and Metaphysics 18: 50–56. [Google Scholar]
  6. Cabral, Ângelo Miguel R., Fernando Manuel P. O. Carvalho, and José António Vasconcelos Ferreira. 2020. International Performance of SMEs’ International Strategic Groups. Administrative Sciences 10: 65. [Google Scholar] [CrossRef]
  7. Cha, Namjun, Junseok Hwang, and Eungdo Kim. 2019. How to Improve Performance and Diversity of Government-Funded Research Institute Ecosystem? Focus on Result Sharing and Feedback Policy. Journal of Open Innovation: Technology, Market, and Complexity 5: 66. [Google Scholar] [CrossRef] [Green Version]
  8. Chan, Yee-Ching Lilian. 2009. An Analytic Hierarchy framework for evaluating Balanced Scorecards of healthcare organizations. Canadian Journal of Administrative Sciences 23: 85–104. [Google Scholar] [CrossRef]
  9. Chen, Nan, Xinglong Yang, and Nicola Shadbolt. 2020. The Balanced Scorecard as a Tool Evaluating the Sustainable Performance of Chinese Emerging Family Farms—Evidence from Jilin Province in China. Sustainability 12: 6793. [Google Scholar] [CrossRef]
  10. Eysenck, Glenn, Erika Kovalova, Veronika Machova, and Vladimir Konecny. 2019. Big Data Analytics Processes in Industrial Internet of Things Systems: Sensing and Computing Technologies, Machine Learning Techniques, and Autonomous Decision-Making Algorithms. Journal of Self-Governance and Management Economics 7: 28–34. [Google Scholar]
  11. Falle, Susanna, Romana Rauter, Sabrina Engert, and Rupert J. Baumgartner. 2016. Sustainability Management with the Sustainability Balanced Scorecard in SMEs: Findings from an Austrian Case Study. Sustainability 8: 545. [Google Scholar] [CrossRef] [Green Version]
  12. Frank, Eibe, Mark A. Hall, and Ian H. Witten. 2016. The Weka Workbench. Online Appendix for Data Mining: Practical Machine Learning Tools and Techniques, 4th ed. Burlington: Morgan Kaufmann. [Google Scholar]
  13. Ge, Zhiqiang, Zhihuan Song, Steven X. Ding, and Biao Huang. 2017. Data Mining and Analytics in the Process Industry: The Role of Machine Learning. IEEE Access 5: 20592–616. [Google Scholar] [CrossRef]
  14. Genc, Ebru, Mumin Dayan, and Omer Faruk Genc. 2019. The impact of SME internationalization on innovation: The mediating role of market and entrepreneurial orientation. Industrial Marketing Management 82: 253–64. [Google Scholar] [CrossRef]
  15. Greatbanks, Richard, and David Tapp. 2007. The impact of balanced scorecards in a public sector environment: Empirical evidence from Dunedin City Council, New Zealand. International Journal of Operations & Production Management 27: 846–73. [Google Scholar]
  16. Grigoroudis, Evangelos, Eva Orfanoudaki, and Constantin D. Zopounidis. 2012. Strategic performance measurement in a healthcare organisation: A multiple criteria approach based on balanced scorecard. Omega 40: 104–19. [Google Scholar] [CrossRef]
  17. Kaplan, Robert S., and David P. Norton. 1992. The Balanced Scorecard: Measures that Drive Performance. Harvard Business Review 70: 71–79. [Google Scholar]
  18. Kaplan, Robert S., and David P. Norton. 1996. Using the Balanced Scorecard as a Strategic Management System. Harvard Business Review 74: 75–85. [Google Scholar]
  19. Keeble, Justin J., Sophie Topiol, and Simon Berkeley. 2003. Using Indicators to Measure Sustainability Performance at a Corporate and Project Level. Journal of Business Ethics 44: 149–58. [Google Scholar] [CrossRef]
  20. Kim, Eungdo, Soyoung Kim, and Hongbum Kim. 2017. Development of an evaluation framework for publicly funded R&D projects: The case of Korea’s Next Generation Network. Evaluation and Program Planning 63: 18–28. [Google Scholar]
  21. Kim, Jaeseong, and Sang Ok Choi. 2020. The Intensity of Organizational Change and the Perception of Organizational Innovativeness; with Discussion on Open Innovation. Journal of Open Innovation: Technology, Market, and Complexity 6: 66. [Google Scholar] [CrossRef]
  22. Kisi, Ozgur, Jalal Shiri, and Vahdettin Demir. 2017. Handbook of Neural Computation. Cambridge: Academic Press, chp. 3. pp. 45–65. [Google Scholar]
  23. Lee, BangRae, Jun-Hwan Park, Leenam Kwon, Young-Ho Moon, YoungHo Shin, GyuSeok Kim, and Han-joon Kim. 2018. About relationship between business text patterns and financial performance in corporate data. Journal of Open Innovation: Technology, Market, and Complexity 4: 1–18. [Google Scholar] [CrossRef]
  24. Lismont, Jasmien, Jan Vanthienen, Bart Baesens, and Wilfried Lemahieu. 2017. Defining analytics maturity indicators: A survey approach. International Journal of Information Management 37: 114–24. [Google Scholar] [CrossRef] [Green Version]
  25. Lyons, Nancy, and George Lăzăroiu. 2020. Addressing the COVID-19 Crisis by Harnessing Internet of Things Sensors and Machine Learning Algorithms in Data-driven Smart Sustainable Cities. Geopolitics, History, and International Relations 12: 65–71. [Google Scholar]
  26. Madsen, Dag Øivind, and Kåre Slåtten. 2013. The Role of the Management Fashion Arena in the Cross-National Diffusion of Management Concepts: The Case of the Balanced Scorecard in the Scandinavian Countries. Administrative Sciences 3: 110–42. [Google Scholar] [CrossRef]
  27. Madsen, Dag Øivind, and Kåre Slåtten. 2015. The Balanced Scorecard: Fashion or Virus? Administrative Sciences 5: 90–124. [Google Scholar] [CrossRef] [Green Version]
  28. Medne, Aija, and Inga Lapina. 2019. Sustainability and Continuous Improvement of Organization: Review of Process-Oriented Performance Indicators. Journal of Open Innovation: Technology, Market, and Complexity 5: 49. [Google Scholar] [CrossRef] [Green Version]
  29. Mello, Raquel, and Roberto Antonio Martins. 2019. Can Big Data Analytics Enhance Performance Measurement Systems? IEEE Engineering Management Review 47: 52–57. [Google Scholar] [CrossRef]
  30. Meyers, Thomas D., Ladislav Vagner, Katarina Janoskova, Iulia Grecu, and Gheorghe Grecu. 2019. Big Data-driven Algorithmic Decision-Making in Selecting and Managing Employees: Advanced Predictive Analytics, Workforce Metrics, and Digital Innovations for Enhancing Organizational Human Capital. Psychosociological Issues in Human Resource Management 7: 49–54. [Google Scholar]
  31. Nigri, Giorgia, and Mara Del Bardo. 2018. Sustainability Reporting and Performance Measurement Systems: How do Small-and Medium-Sized Benefit Corporations Manage Integration? Sustainability 10: 4499. [Google Scholar] [CrossRef] [Green Version]
  32. Northcott, Deryl, and Tuivaiti Ma’amora Taulapapa. 2012. Using the balanced scorecard to manage performance in public sector organizations: Issues and challenges. International Journal of Public Sector Management 25: 166–91. [Google Scholar] [CrossRef]
  33. Organization for Economic Cooperation and Development. 2020. Financing SMEs and Entrepreneurs 2020: An OECD Scoreboard. Available online: https://0-www-oecd--ilibrary-org.brum.beds.ac.uk/sites/0f52ae26-en/index.html?itemId=/content/component/0f52ae26-en (accessed on 3 December 2020).
  34. Papalexandris, Alexandros, George Ioannou, Gregory Prastacos, and Klas Eric Soderquist. 2005. An Integrated Methodology for Putting the Balanced Scorecard into Action. European Management Journal 23: 214–27. [Google Scholar] [CrossRef]
  35. Pham, Cuong Duc, Sen Thi VU, Yen Thi Kim Pham, and Nam Thi Vu. 2020. Evaluating Performance of Vietnamese Public Hospitals Based on Balanced Scorecard. Journal of Asian Finance, Economics and Business 7: 339–49. [Google Scholar] [CrossRef]
  36. Piątkowski, Marcin J. 2020. Results of SME Investment Activities: A Comparative Analysis among Enterprises Using and Not Using EU Subsidies in Poland. Administrative Sciences 10: 4. [Google Scholar] [CrossRef] [Green Version]
  37. Pletnev, Dmitri, and Victor Barkhatov. 2016. Business success of small and medium sized enterprises in Russia and social responsibility of managers. Procedia-Social and Behavioral Sciences 221: 185–93. [Google Scholar] [CrossRef] [Green Version]
  38. Poliak, Milos, Andrew Baker, Vladimir Konecny, and Elvira Nica. 2020. Regulatory and Governance Mechanisms for Self-Driving Cars: Social Equity Benefits and Machine Learning-based Ethical Judgments. Contemporary Readings in Law and Social Justice 12: 58–64. [Google Scholar]
  39. Prasanna, Rpir, Jmsb Jayasundara, Sisira Kumara Naradda Gamage, Ems Ekanayake, Psk Rajapakshe, and Gaknj Abeyrathne. 2019. Sustainability of SMEs in the Competition: A Systemic Review on Technological Challenges and SME Performance. Journal of Open Innovation: Technology, Market, and Complexity 5: 100. [Google Scholar] [CrossRef] [Green Version]
  40. Rajni, Jindal, and Dutta Borah Malaya. 2015. Predictive Analytics in a Higher Education Context. IT Professional 17: 24–33. [Google Scholar] [CrossRef]
  41. Salmon, Ioannis, Ilias Pappas, Athanasios Spyridakos, and Issak Vryzidis. 2019. Applying Multicriteria Decision Aid in a Weighted Balanced Scorecard Method for Supporting Decision Making in Change Management. Journal of Applied Research Review 16: 62–79. [Google Scholar]
  42. Scott, Roger, Milos Poliak, Jaromir Vrbka, and Elvira Nica. 2020. COVID-19 Response and Recovery in Smart Sustainable City Governance and Management: Data-driven Internet of Things Systems and Machine Learning-based Analytics. Geopolitics, History, and International Relations 12: 16–22. [Google Scholar]
  43. Shepko, Robert, and Brian Douglas. 1998. Reframing for Crisis. Business Officer 32: 32–36. [Google Scholar]
  44. Siskos, Yannis, and Athanasios Spyridakos. 1999. Intelligent multicriteria decision support: Overview and perspectives. European Journal of Operational Research 113: 236–246. [Google Scholar] [CrossRef]
  45. Stewart, Wendy E. 2001. Balanced Scorecard for projects. Project Management Journal 32: 38–53. [Google Scholar] [CrossRef]
  46. Yan, Min-Ren, Chun-Han Wang, Nelson Jose Cruz Flores, and Ying-Yueh Su. 2019. Targeting Open Market with Strategic Business Innovations: A Case Study of Growth Dynamics in Essential Oil and Aromatherapy Industry. Journal of Open Innovation: Technology, Market, and Complexity 5: 7. [Google Scholar] [CrossRef] [Green Version]
  47. Yun, JinHyo Joseph, and Tan Yigitcanlar. 2017. Open Innovation in Value Chain for Sustainability of Firms. Sustainability 9: 811. [Google Scholar] [CrossRef] [Green Version]
Figure 1. The Balanced Scorecard.
Admsci 10 00102 g001
Table 1. Dataset structure.
AttributeTypeValue
CEPIndependent{0,1}
ARFIndependent{0,1}
TDFIndependent{0,1}
TURDependentNumber
EOSDependentNumber
AOFDependentNumber
Table 2. Experimental setup parameters and values.
ParameterValue
1st Experimented RegressorLinear Regression
2nd Experimented RegressorSVR
3rd Experimented RegressorANN
4th Experimented Regressork-NN
5th Experimented RegressorM5 Model Tree
Evaluation Method10-Fold Cross Validation
Evaluation Metrics NRMSE
Table 3. Experiments for Turnover (TUR).
RegressorNRMSE
Linear Regression0.1096*
SVR0.1098
ANN0.1219
k-NN0.1097
M5 Model Tree0.1096*
Table 4. Experiments for Enumeration of Staff (EOS).
RegressorNRMSE
Linear Regression0.0515
SVR0.0566
ANN0.0538
k-NN0.0546
M5 Model Tree0.0506*
Table 5. Experiments for Absorption of Funds (AOF).
RegressorNRMSE
Linear Regression0.1309*
SVR0.1413
ANN0.1577
k-NN0.1309
M5 Model Tree0.1309*
Table 6. Overall assessment of regressors.
RegressorAssessment
Linear Regression+ −
SVR− −
ANN− −
k-NN+ −
M5 Model Tree a+ +
Note: a M5 Model Tree is adopted as optimal prediction model for the current research effort.
Publisher’s Note: MDPI stays neutral with regard to jurisdictional claims in published maps and institutional affiliations.

