Toward a Multi-Sided Model of Service Quality for Logistics Service Providers


Institute of Supply Chain Management, University of St. Gallen, 9000 St. Gallen, Switzerland
*
Author to whom correspondence should be addressed.
Adm. Sci. 2020, 10(4), 79; https://0-doi-org.brum.beds.ac.uk/10.3390/admsci10040079
Submission received: 3 September 2020
/
Revised: 5 October 2020
/
Accepted: 7 October 2020
/
Published: 12 October 2020
Abstract
:The aim of this research was to identify quality discrepancies in the existing service offerings of logistics service providers (LSPs). A multi-sided model of service quality (SERVQUAL) highlighting existing gaps in service provision was developed. A qualitative case study approach was employed, and the data were analyzed via a pattern-matching technique. The contribution to the literature is twofold. First, the study transferred the original service quality model developed in the 1980s from a business-to-consumer context to a business-to-business context that is specific to LSPs. Second, the results provide a means of closing the identified service quality gaps arising in an LSP context. Two internal gaps were found: non-homogeneous expectations between the sales and operations departments, and a communication and knowledge gap between these two entities. The three external gaps between LSPs and customers are a loyalty and corporate brand image gap, an innovation and information technology gap and an information asymmetry gap.
1. Introduction
The logistics service industry focuses on core services, such as organizing, planning and controlling the transport of physical goods and additional value-added services (VAS) (König et al. 2019). In the future, this industry is expected to face increased competition due to the market entry of companies from non-logistics backgrounds (Tipping and Kauschke 2016), which will draw on their inherent understanding of customers’ processes (retailers or industrial companies) or will have superior digital competencies (information technology [IT] companies) (Hofmann and Osterwalder 2017). To maintain their current market position and capture more customer value, logistics service providers (LSPs) must position themselves as strategic partners rather than as easily replaceable service providers (Ali and Kaur 2018). Extending their service portfolios with VAS could relieve LSPs of the ongoing margin pressure in the logistics service industry (Lieb and Lieb 2016). For instance, the fields of contract manufacturing and financial VAS (FVAS) offer portfolio extension opportunities because, thus far, the industry has only rarely offered such services (Wetzel and Hofmann 2020). One reason for this negligence is that customers are not yet ready to purchase sophisticated VAS from their LSPs; they view these functions as having high strategic importance and question the competence of LSPs in these areas.
This challenges LSPs to convince customers of their competence to offer sophisticated VAS. Customers will only entrust LSPs with more strategic functions when they feel that these companies understand their needs and when the current service level that their LSPs provide matches their expectation (Hussain et al. 2015; Parasuraman et al. 1996). Therefore, LSPs need to detect areas for improvement from the customers’ viewpoint and resolve perceived discrepancies. This is crucial if LSPs are to convince their customers about their capability to offer VAS in more sophisticated and profitable areas.
The present study built upon the pioneering research of Parasuraman et al. (1985), whose service quality model (i.e., “gap model”), along with the service quality (SERVQUAL) scale, is the driving force in research focused on service quality measurement (Durvasula et al. 1999). This study evaluated the current market situation of the logistics service industry, proposed potential existing discrepancies based on an extensive literature review, and used interviews with industry professionals representing both LSPs and their customers to answer the following research questions (RQs):
RQ 1:
What are the relevant internal and external service quality gaps in the logistics service industry?
RQ 2:
What actions must be taken to close the internal and external service quality gaps in the logistics service industry?
In answering the RQs, this study extends Parasuraman et al.’s (1985) service quality approach to a multi-sided service quality model for LSPs and their customers. Industry professionals can use this model to identify service quality aspects that may have been previously hidden or insufficiently addressed. Actions to close the identified gaps are also recommended. A qualitative case study approach was used, and the data were analyzed using a pattern-matching technique linking the empirically based patterns retrieved from the interviews with predefined theoretical propositions (Yin 2009).
The remainder of this paper is structured as follows. Section 2 sets the theoretical frame of reference. Section 3 develops propositions regarding the expected internal and external discrepancies. Section 4 provides an overview of the methodology. The empirical findings of the case studies are presented and the enhanced service quality model is developed in Section 5. The model is discussed in Section 6, and Section 7 concludes the paper.
2. Theoretical Background
This study approached the literature review as follows. The first step was examining the general service quality research to obtain an overview of the relevant stakeholders, their incentive structures, and their goals. There was a particular focus on intra- and inter-company service quality expectations. Approaching the topic from a general perspective enabled the exploration of a broad range of perspectives that could potentially uncover applications in the context of LSPs. The (unique) characteristics and issues of LSPs were the focus of the second part of the literature review.
Researchers distinguish between two components of logistics service quality. Functional or process quality is focused on the service delivery process and encompasses, for example, the level of knowledge of sales staff or ease of the service ordering process. In contrast, technical or outcome quality is focused on the service delivery outcome and encompasses, for example, how well a service conforms to the technical requirements or the timeliness of service provision (McKnight et al. 2017).
Maintaining and proactively fostering a high level of service quality are strong drivers of customer loyalty and its dimensions of retention, extension, and referrals (Wallenburg 2009). This is in line with Bienstock et al. (2015), who find that customers’ perceptions of logistics outcome quality strongly influence their future purchase intentions. High service quality is also linked to a higher market share, directly and indirectly, through increased customer loyalty (Rafiq and Jaafar 2007). For more complex services and a longer contracting period, proactive performance is an even greater guarantor of customer loyalty than cost improvement (Wallenburg 2009). This indicates the need for service quality improvement when offering VAS, which are often complex in nature. Therefore, Mentzer et al. (2001a) argue that logistics service quality should be regarded as a process rather than as a single concept. This allows LSPs to identify and strategically tackle the individual drivers behind customers’ perceptions of logistics service quality (Gil-Saura et al. 2018).
2.1. Service Quality Model Research
As mentioned, a level of service quality that matches both internal and external expectations will enable LSPs to effectively market and distribute their VAS in the future. Accordingly, a comprehensive service quality model that captures prevalent expectation mismatches between LSPs and their customers is needed to identify areas for improvement in both intra- and inter-company relationships.
Many models of service quality have been introduced with different advantages and limitations, which vary in their suitability for academic work (see Grönroos (1984), Haywood-Farmer (1988); Cronin and Taylor (1992)). This study focused on extending the most prominent and widely used service quality model by Parasuraman et al. (1985), which identifies five different mismatches (gaps) between expected and perceived service quality by customers in a business-to-consumer (B2C) context (see Figure 1).
Gap 1 exists between consumers’ expectations and the management’s perception of these expectations. Parasuraman et al. (1985) explain that executives may not always fully understand which features of the service customers value most and which features are truly necessary to meet customers’ needs. Luk and Layton (2002) confirm this perception mismatch and highlight its impact on front-line staff. Eventually, service personnel might find themselves trapped in role ambiguity, stuck between catering to customers’ needs and following management guidelines. The mismatch between the management’s perception and customers’ expectations can be corrected by systematically conducting market research and disseminating the derived customer expectations to managers (Dimitriadis and Stevens 2008).
Gap 2 occurs between the management’s perception and the service quality specification. Due to resource, market, and management indifference constraints at the service-providing firm, some customer expectations—although recognized by the service provider—will not be fulfilled. An example of this discrepancy is customers viewing a fast response to their enquiries as a crucial service quality attribute and service firms being unable to maintain short response times during peak hours. Closing this gap requires a solid understanding of customers’ goals and processes and modeling these into the service design process (Tan et al. 2016).
Gap 3 is between service quality specifications and the actual service quality delivered. Some parts of a service cannot be standardized; thus, variance exists between the specified and delivered service quality. In particular, contact personnel play a pivotal role in maintaining high-quality service, but standardizing these contact points is complicated. Nonetheless, where applicable, services should be standardized to the greatest extent possible (Dimitriadis and Stevens 2008). This includes aligning customer touch points and relevant information and sharing data via a common database. The evolution of automated service solutions, such as chatbots, might further close this gap (Huang and Rust 2018).
Gap 4 exists between the delivered service and external communication with customers. All advertising through media or other channels affects customers’ expectations and perceptions. Exaggerated promises or poor communication of crucial information about service delivery can negatively affect customers’ perceptions. Further, De Chernatony and Segal-Horn (2003) posit that, if a company’s values are regarded only as a superficial construct, service delivery and external communications are likely to mismatch. Thus, they argue that brand values should become deeply entrenched in a company’s and its employees’ mindsets.
The last and most important mismatch, Gap 5, is the discrepancy between customers’ expected and perceived service. Judgement of service quality depends on the perceived actual service performance and what service level the customer expects. Therefore, Gap 5 is the sum of all the previous gaps. Au and Tse (2019) find that a negative deviation from expected service quality has a greater impact than a positive deviation and should thus be avoided.
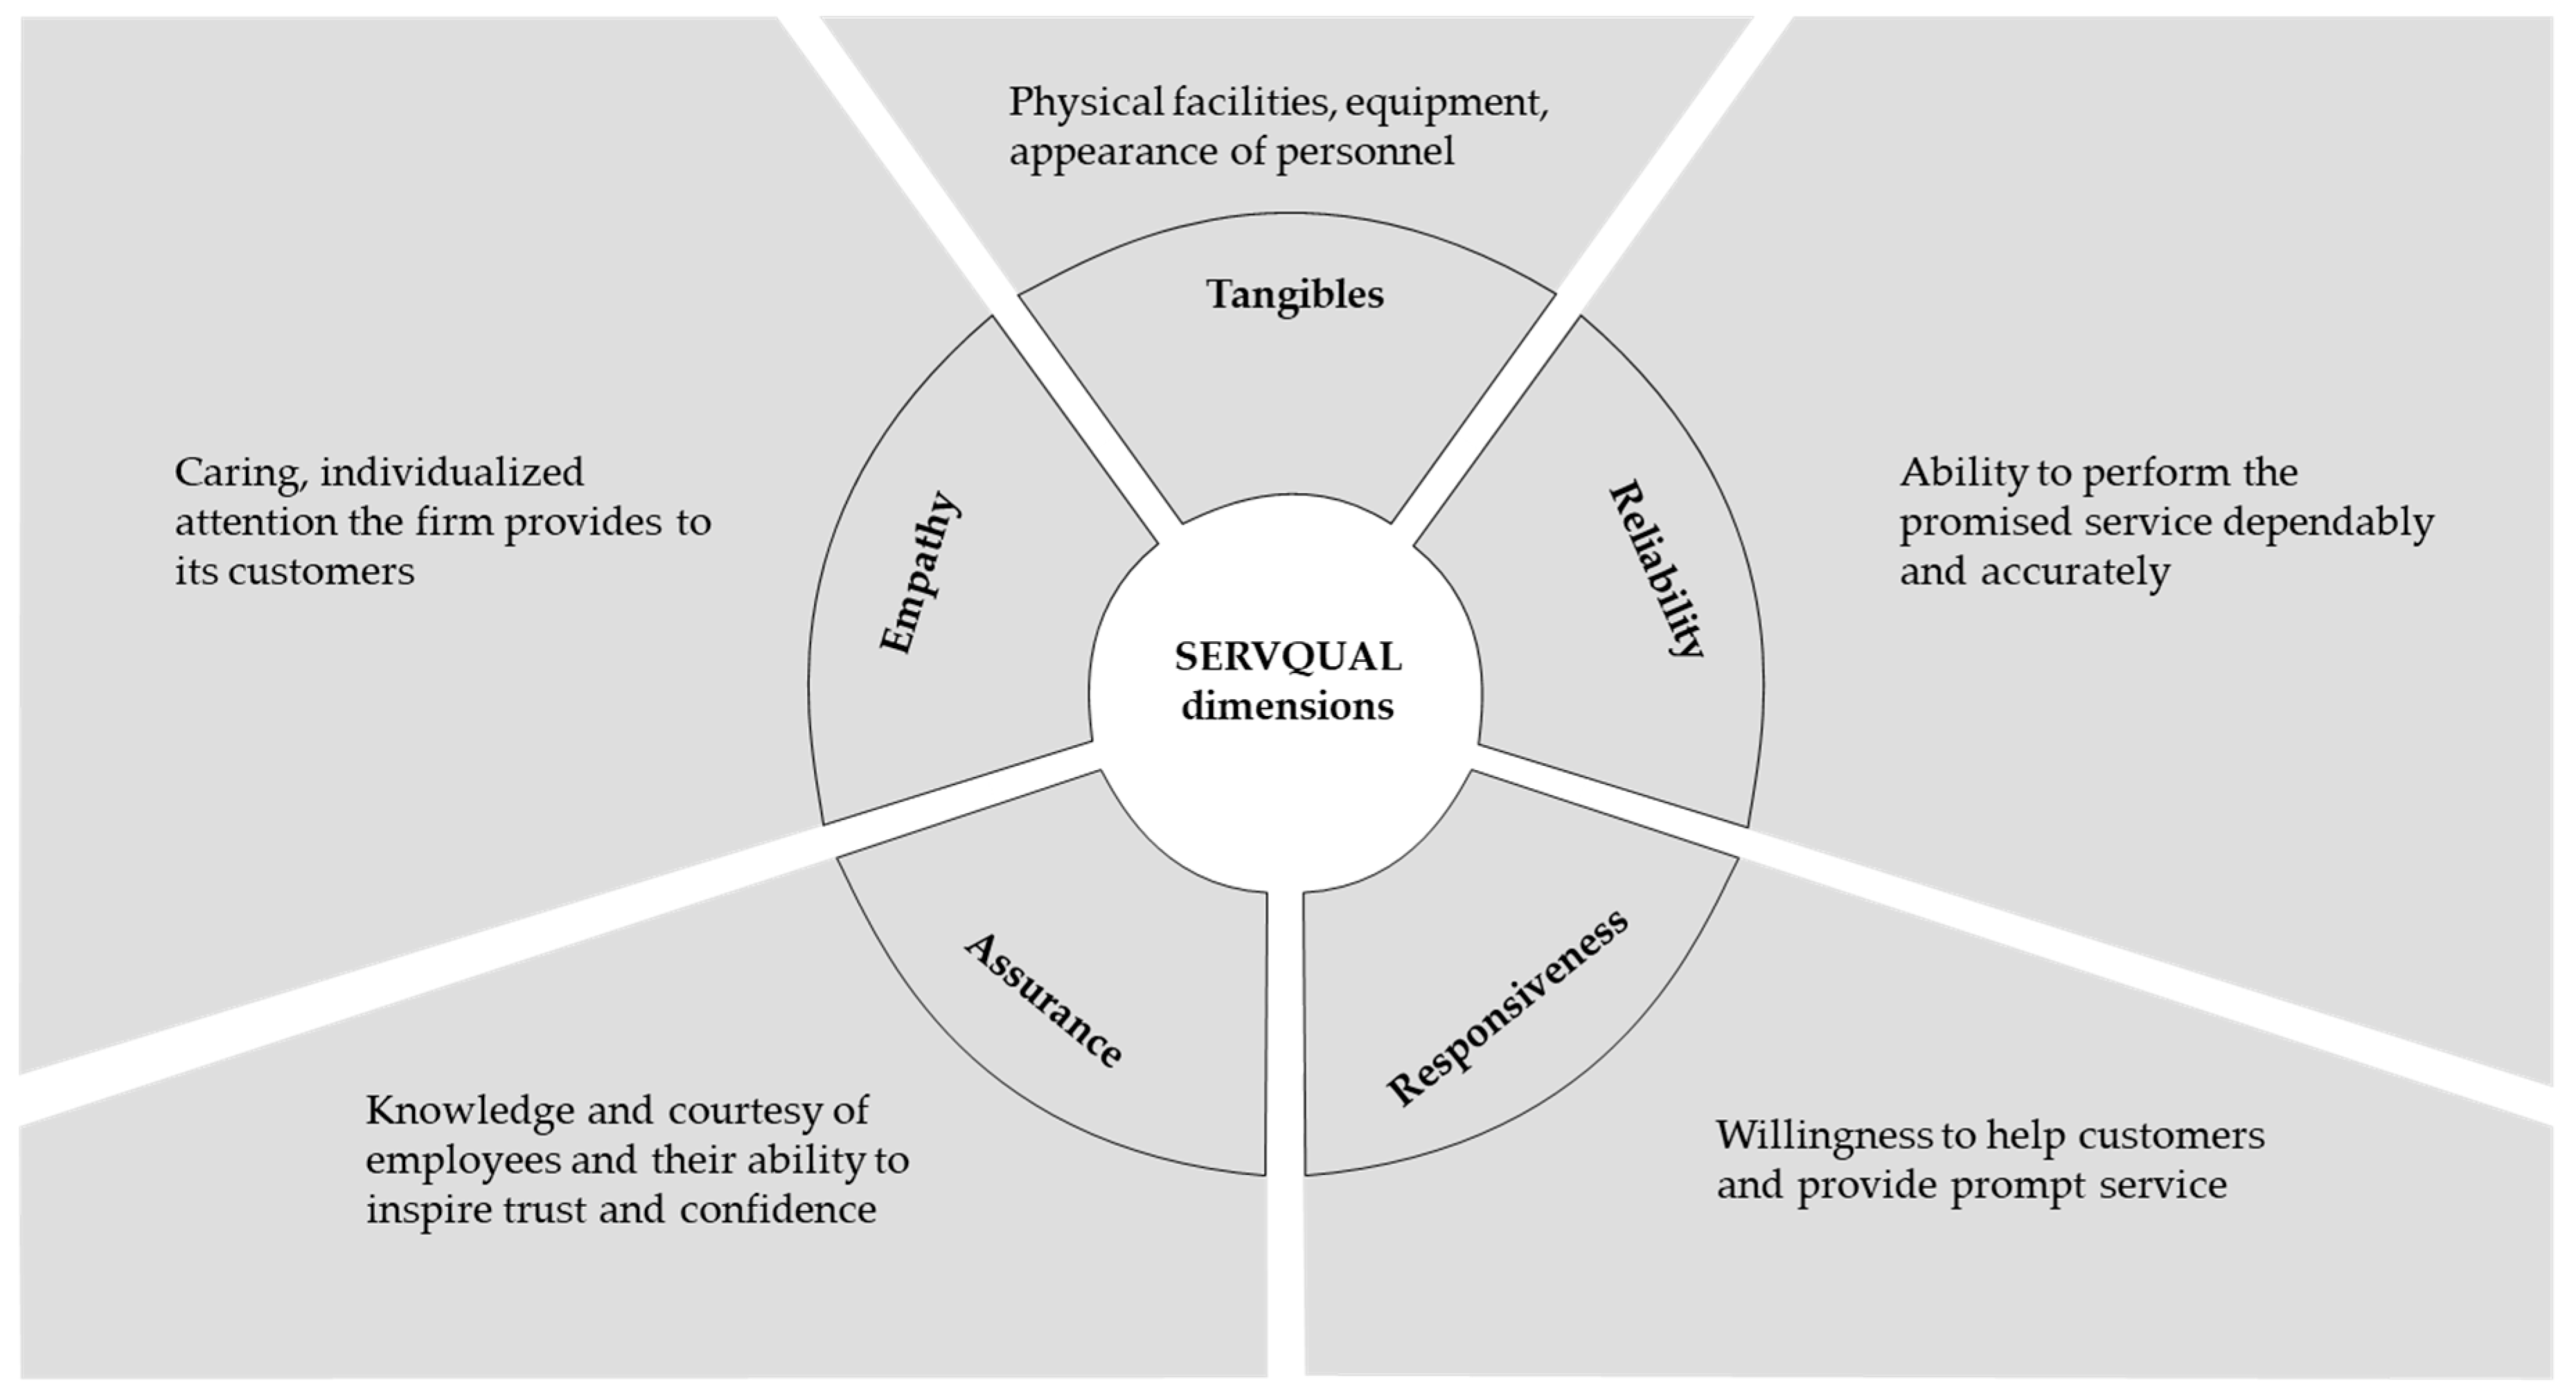
In 1988, Parasuraman et al. introduced the SERVQUAL scale to measure gaps that they introduced in their service quality model. The SERVQUAL scale is a 22-item instrument that assesses customers’ perceptions of service quality in the retail and service industries. The five dimensions of SERVQUAL (see Figure 2) are tangibles, reliability, responsiveness, assurance, and empathy (Hussain et al. 2015). Tangibles include components such as the company’s equipment, the external appearance of stores, and the appearance of personnel and physical facilities (Parasuraman et al. 1988). Reliability refers to the dependability and accuracy of the company’s potential to perform the promised service (Ramanathan et al. 2018). Responsiveness describes how willing the company is to help its customers and how fast the company provides its services when demanded (Hussain et al. 2015). Assurance represents the state of employees’ knowledge, their courtesy levels, and their ability to inspire trust and confidence in their customers (Ramanathan et al. 2018; Bruch and Vogel 2011). Finally, empathy describes the level of caring and personalized attention the company is able to provide to customers (Ramanathan et al. 2018). The SERVQUAL scale is used to qualify the expected discrepancies of this study as gaps.
2.2. Need for Action
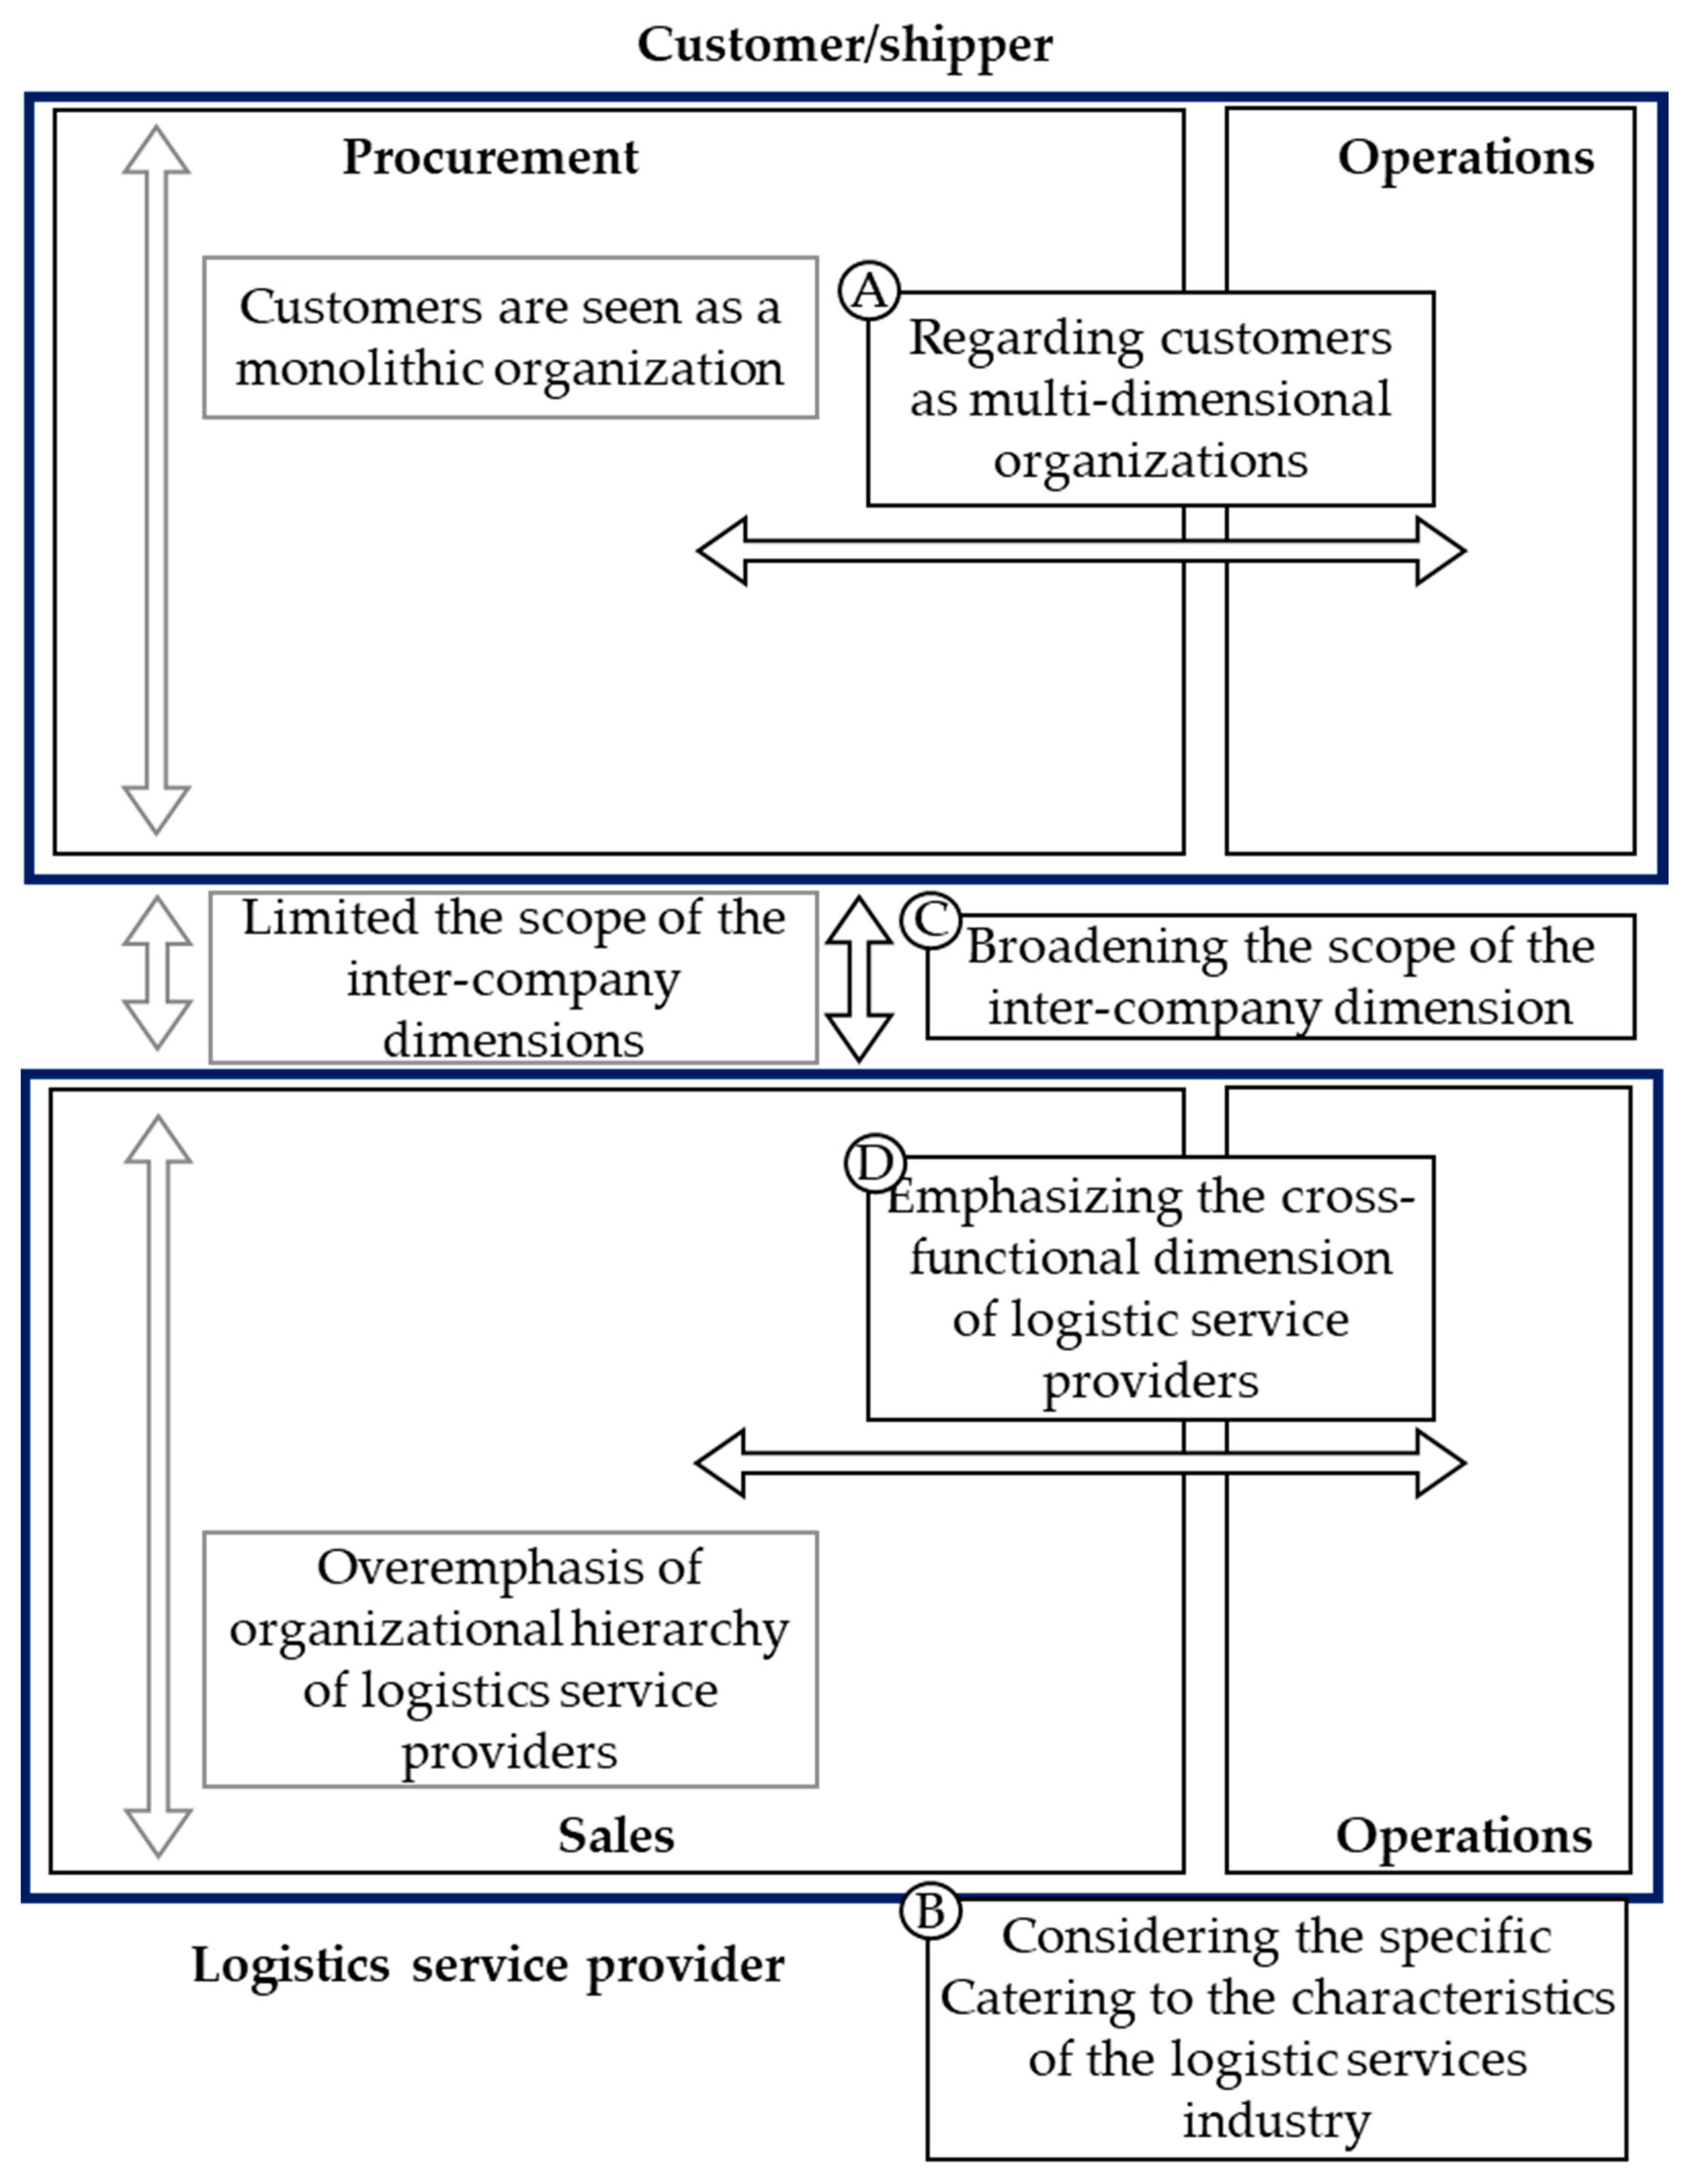
In the past, scholars have extended the existing service quality model to examine organizational barriers (Parasuraman et al. 1991) and measure service quality in the recreational sports industry (Ko and Pastore 2005), the airline industry (Hussain et al. 2015), and the leasing market (Ramanathan et al. 2018). As the original model only covers B2C relationships, researchers have evaluated the fit of the original service quality model in a business-to-business (B2B) context. B2B contexts exhibit distinct features compared to B2C contexts, such as the disintegration of buyers and consumers of services, the more rational and parameter-driven purchase decision-making process, and the increased lifetime and volume of buyer–seller relationships (Gounaris 2005). Nevertheless, Durvasula et al. (1999) posit that Parasuraman et al. (1985) service quality model can generally be applied in a B2B context, although with caution. To cater to the B2B nature of the contracting party in a relationship between LSPs and their customers, a modern service quality model must regard customers as multidimensional organizations, both horizontally and vertically (see Extension A in Figure 3).
In the logistics service industry, some attempts have been made to investigate factors, such as loyalty, in the buyer–seller relationship (Gil-Saura et al. 2018; Davis and Mentzer 2006). Seth et al. (2006) created a service quality model to analyze the different interface gaps between LSPs and various manufacturers. However, to date, no service quality model in the literature covers both internal and external gaps that are specific to LSPs and their customers. Given the distinct nature of this relationship, a service quality model that caters to the characteristics of the logistics service industry is needed (see Extension B in Figure 3).
With the erosion of margins in LSPs’ core businesses and the resulting pressure to innovate, establishing a strong and mutually nurturing relationship with customers is crucial. Panayides and So (2005) explain that relationship orientation has a positive influence on organizational learning, fostering firms’ innovation. Given its B2C origin, Parasuraman et al.’s (1985) service quality model takes a rather one-dimensional approach to the service provider–client relationship. Of the five gaps identified by the original service quality model, only one gap (Gap 1) is related to inter-company discrepancies. However, paying little attention to customers’ functional quality expectations (regarding the service delivery process) and technical quality expectations (regarding the actual service outcome) will result in disappointed customers. In the age of service-dominant logic (see Lusch (2011)), failing to satisfy customers’ needs negatively affects an LSP’s business model. A comprehensive service quality model would allow decision-makers to uncover the inter-organizational service quality gaps that are hindering satisfactory collaboration. Thus, the original service quality model must be extended to broaden the scope of the inter-company dimension (see Extension C in Figure 3). In this context, concomitant factors, such as loyalty, collaboration, and trust, must be examined.
Furthermore, the original service quality model from 1985 does not account for the effects of globalization—a trend that has dramatically changed the business environment for LSPs. Examples of this globalization effect are (1) increased consolidation approaches in the logistics market that result in mergers, acquisitions, and alliances (Andersson and Norrman 2002; Lieb 2015), and (2) the growing number of large multinational companies with increasingly vertically and horizontally integrated structures (Wiersema and Bowen 2008). These corporations comprise many autonomous departments and business units with their own targets and key performance indicators (KPIs) for measuring their success (Wiersema and Bowen 2008). These varying goals can create internal conflicts of interest, leading to additional gaps that the original service quality model does not address. Thus, the original service quality model with its hierarchy-focused view must be amended to include a cross-functional dimension (see Extension D in Figure 3).
It is especially noteworthy that neither a positive nor a negative mismatch in service quality is desirable. A large positive gap indicates a “service overkill,” which implies a waste of resources that could have been better invested in improving other services, whereas a negative gap implies that customers’ demands remain unmet (Lings and Brooks 1998). This study adopted a multi-sided view of service quality and derived a set of theoretical propositions regarding internal and external discrepancies from the literature. From this, possible discrepancies between buyers and LSPs were identified. Recommended actions to close these gaps will be offered.
3. Development of Propositions
3.1. Internal Discrepancies
Understanding customers’ requirements is a key hurdle in customer service. Assessing service quality is even more challenging when multiple departments are involved in delivering the service, as each internal department has its own targets and standardized processes (Slizyte and Bakanauskiene 2007; Rangarajan et al. 2018). Metrics and performance measurements are used to translate the organization’s mission or strategy into reality (Melnyk et al. 2004). In theory, these incentives and processes should be aligned between the targets of collaborating departments, as these targets determine how individuals within an organization behave and create incentives that might foster internal conflicts of interest (Rangarajan et al. 2018; Baker et al. 1988). In the logistics service industry, one can identify potential internal and external target mismatches by analyzing the typical KPIs and objectives of the different parties within LSPs (e.g., operations and sales departments) as well as relationships with customers and shippers (e.g., operations and procurement departments).
In general, every operations department has the basic task of satisfying its customers’ requirements. Such requirements can be defined as a set of five major performance objectives that apply to all types of operations: quality, speed, reliability, flexibility, and cost (Van Weele 2010).
In contrast, the procurement department is responsible for all activities that involve getting the goods ordered from the supplier to the final destination (Van Weele 2010). The generic performance measures for this department have been identified as time, quality, and cost (Santa et al. 2014; Kumar et al. 2005).
LSPs’ sales departments are, as the name implies, responsible for selling the company’s offered logistics services and increasing the company’s market share. Many sales departments use incentive contracts to motivate their sales representatives. These incentives include revenue-based sales commissions, which often lead to a central problem in agency theory (Rangarajan et al. 2018; Baker et al. 1988). That is, while the main goal of a sales representative is to sell as many services as possible, the goal of the operations department is to provide its services in an efficient, timely, and cost-effective manner. Thus, the following was expected:
Proposition 1:
There is a discrepancy between an LSP’s operations and sales department in terms of non-homogenous internal expectations.
Many logistics services are tailored to specific requirements to ensure a flexible, cooperative arrangement for customers (Skjoett-Larsen 2000). This leads to subdivisions in the operations department of an LSP, which, for example, focus on specific transport modes, key accounts, or specific trade lanes. This job specialization enables the operations department to process most of the relevant market changes and maintain close contact with its subcontractors. This specialization does not apply to sales departments at LSPs, especially to local sales teams. Such teams are expected to be able to concurrently quote a wide range of different transport modes, trade lanes, customers, and shipment requirements. This might lead to a knowledge discrepancy, as the sales department can only handle a limited portion of all relevant information (Grönroos 1998). This, in turn, can lead to a disadvantage, particularly if the sales department cannot fully factor in current market developments.
Furthermore, as supply chains have become more interconnected and interdependent due to globalization, every shipment delay can have an immense impact and serious negative consequences on the downstream processes of the overall supply chain (Ketchen and Hult 2007). Especially when handling shipments with high logistics service requirements and tight schedules, customers issue comprehensive shipping guidelines and handling restrictions to avoid legal issues and uphold a high level of service quality (Aigbogun et al. 2014). Customers expect the sales department at their LSP to have read and understood all the relevant requirements. However, due to time constraints, these instructions and requirements might not be thoroughly communicated to the operations departments, which will negatively affect the perceived service quality. Thus, the following was expected:
Proposition 2:
There are communication and knowledge discrepancies between an LSP’s internal operations and sales departments.
As identified above, the main performance measure for the customer’s procurement department is the extent of the cost savings. This could lead to a selection bias toward low quotations from LSPs. LSPs’ sales departments are expected to react to this bias by decreasing their service costs. As there must be some sort of trade-off between low-cost and high-quality services (Ghodsypour and O’Brien 2001), the biased selection process might lead to internal discrepancies with an LSP’s operations department’s goal of ensuring a high service level within an uninterrupted supply chain. Thus, the following was expected:
Proposition 3:
There is a discrepancy between an LSP’s operations and sales departments in terms of differing internal incentives and targets.
3.2. External Discrepancies
This study analyzed possible discrepancies between LSPs and their customers. Corporate image plays an important role in how customers assess service quality (Gil-Saura et al. 2018). A good and well-known image can be an asset due to its positive impact on customers’ perceptions and expectations. An additional factor in service quality is customer loyalty, which focuses on customers’ repeat purchase behavior and attitudes towards the service-providing firm (Hennig-Thurau et al. 2002). Davis and Mentzer (2006) identify a loyalty gap between customers and LSPs in terms of what loyalty means to each party. Their study shows that a powerful customer views loyalty in a more behavioral way, whereas suppliers in weaker positions see loyalty from an affective perspective. This loyalty gap is caused by a dependence asymmetry between these two parties (Davis and Mentzer 2006).
LSPs face tough competition, especially in the field of standard transportation services, due to the large number of competitors and accessible information made widely available on the internet (Ho and Chang 2015). This increases customers’ negotiation power, leading to an unbalanced distribution of power allowing customers to demand contract terms that might be disadvantageous to LSPs (Habib et al. 2015).
LSPs might further intensify this dependence asymmetry in terms of loyalty by overvaluing their own corporate brands. Such overestimation means that they assume their sales departments are capable of demanding higher freight rates, whereas customers may not see or value the LSP’s presumably superior brand-related service quality and may switch to another LSP instead of paying a premium for logistics services. Thus, the following was expected:
Proposition 4:
There is a loyalty and corporate brand image discrepancy between an LSP and its customers.
According to a study on buyers and providers of logistics services, service quality attributes, such as systems that can be synchronized through the entire supply chain and across research and development (R&D) capabilities, are one-dimensional quality attributes that customers value (Sohn et al. 2017). This suggests that these two attributes are normal quality criteria for customers and that the degree to which LSPs provide them is proportional to customers’ satisfaction levels. The study goes on to show that, in contrast, LSPs see these same two aspects (i.e., systems that can be synchronized through the entire supply chain and across R&D capabilities) as non-standard quality attributes. This implies that LSPs view these as clearly differentiating attributes that exceed their customers’ expectations. Therefore, LSPs do not expect customers to demand such services (Sohn et al. 2017). Other researchers find that IT capabilities offer a significant competitive advantage to LSPs by allowing them to reduce costs, improve service quality, and provide customized and innovative services for their customers (Lai et al. 2008; Karia 2018).
These findings suggest that logistics service customers expect (1) to receive real-time data on their shipment status through easily accessible electronic data interchange (EDI) connections and (2) for their LSPs to demonstrate innovative capabilities to continuously improve the provided logistics services. This leads to the assumption that the logistics service industry has not fully met customers’ demands for new and innovative services combined with a more sophisticated IT infrastructure. Thus, the following was expected:
Proposition 5:
There is an innovation and IT discrepancy between an LSP and its customers.
The entire process of customers and shippers purchasing logistics services can span a couple of months to a few years, from defining and specifying the required service level to negotiating and contracting (Andersson and Norrman 2002). An LSP’s procurement department coordinates the entire in-bound supply process and provides its suppliers with regular forecasts of what and what quantities it will procure in the future.
In theory, customers’ sales teams’ forecasts should serve as direct input for suppliers’ forecasts (in this case, the LSPs as the suppliers of logistics services). The volume of information for each trade lane enables LSPs to enhance their capacity utilization, adopt a longer-term planning horizon, and negotiate attractive freight rate deals with their subcontractors for the length of the customers’ contracts. However, due to both processual and behavioral motives, customers often do not share information about supply chain performance with their LSPs (Marinagi et al. 2015) While disconnected information systems or communication barriers represent processual barriers to information sharing, behavioral barriers are often the result of a lack of trust in a mutual relationship. Trust and trustworthiness in B2B relationships consist of four factors: (1) personal values and norms, (2) market environment, (3) business infrastructure and (4) business process design (Özer and Zheng 2017).
An apparent behavioral motive for customers to only share imprecise volume information with their LSPs is a lack of trust based on risk aversion and expected competitive vulnerability. Customers’ limited information sharing is, to a certain degree, based on assumptions about the future development of their business (Van der Vorst and Beulens 2002). Therefore, they expect the volumes per trade lane to vary to a certain degree each year. However, if a previously quoted large-volume trade lane has substantially lower total volume during the contract fulfillment phase, this may result in a potential claim from the LSP. The customer might decide to minimize the risk of a lawsuit by providing less or no detailed volume forecasts to their LSP during the quotation phase. Further, shippers might bundle pick-up or delivery locations to larger regions in their quotation requests to ensure that confidential information about precise supplier locations is not shared with competitors through data leaks.
However, limited information sharing between customers and LSPs leads to increased bullwhip effects along the supply chain, increased costs and lead times, and decreased capacity utilization. This negatively affects the overall performance of the supply chain (Marinagi et al. 2015) and hinders the use of innovative applications, such as blockchain or internet of things (IoT) appliances, both of which rely on a shared information base (Kim and Chai 2017). Thus, the following was expected:
Proposition 6:
There is a discrepancy between an LSP and its customers in terms of limited trust and information sharing across the supply chain based on both processual and behavioral motives.
The six propositions are further summarized in the Table 1.
4. Methodology
4.1. Overall Approach
A qualitative case study approach was deployed to answer the RQs. The requirements for using a case study approach are as follows: (1) the focus of the study is on answering a “how” research question, (2) the study cannot manipulate the participants’ behavior, and (3) the boundaries between the phenomenon and context are not yet clear (Baxter and Jack 2008). This approach was preferred over a quantitative study because the identified service gaps were difficult to measure due to a lack of suitable secondary data (either they were not available or were not disclosed by the companies; see other case studies with a qualitative approach (Ritala et al. 2014; Leigh and Li 2015)). Therefore, a qualitative approach incorporating voices from across the relevant industry landscape and different positions provided a variety of perspectives on the topic and enabled matching the statements from LSPs and customers.
The case was selected because it enabled analyzing the difference in perceptions and expectations in service quality between buyers and sellers in the logistics service industry. This in turn provided the opportunity to identify and close potential gaps and issues. The interviews focused on buyers and sellers of international logistics services in Europe, and the study explored international logistics services, such as airfreight, ocean freight, and international trucking services, and VAS, such as supply chain finance solutions.
4.2. Data Collection
This study employed a purposive sampling strategy with a focus on logistics service industry specialists in the sales and purchasing departments (see Table A1 in the Appendix A), as these individuals have the required perspective on the phenomenon to allow for answering the RQs (Robinson 2014).
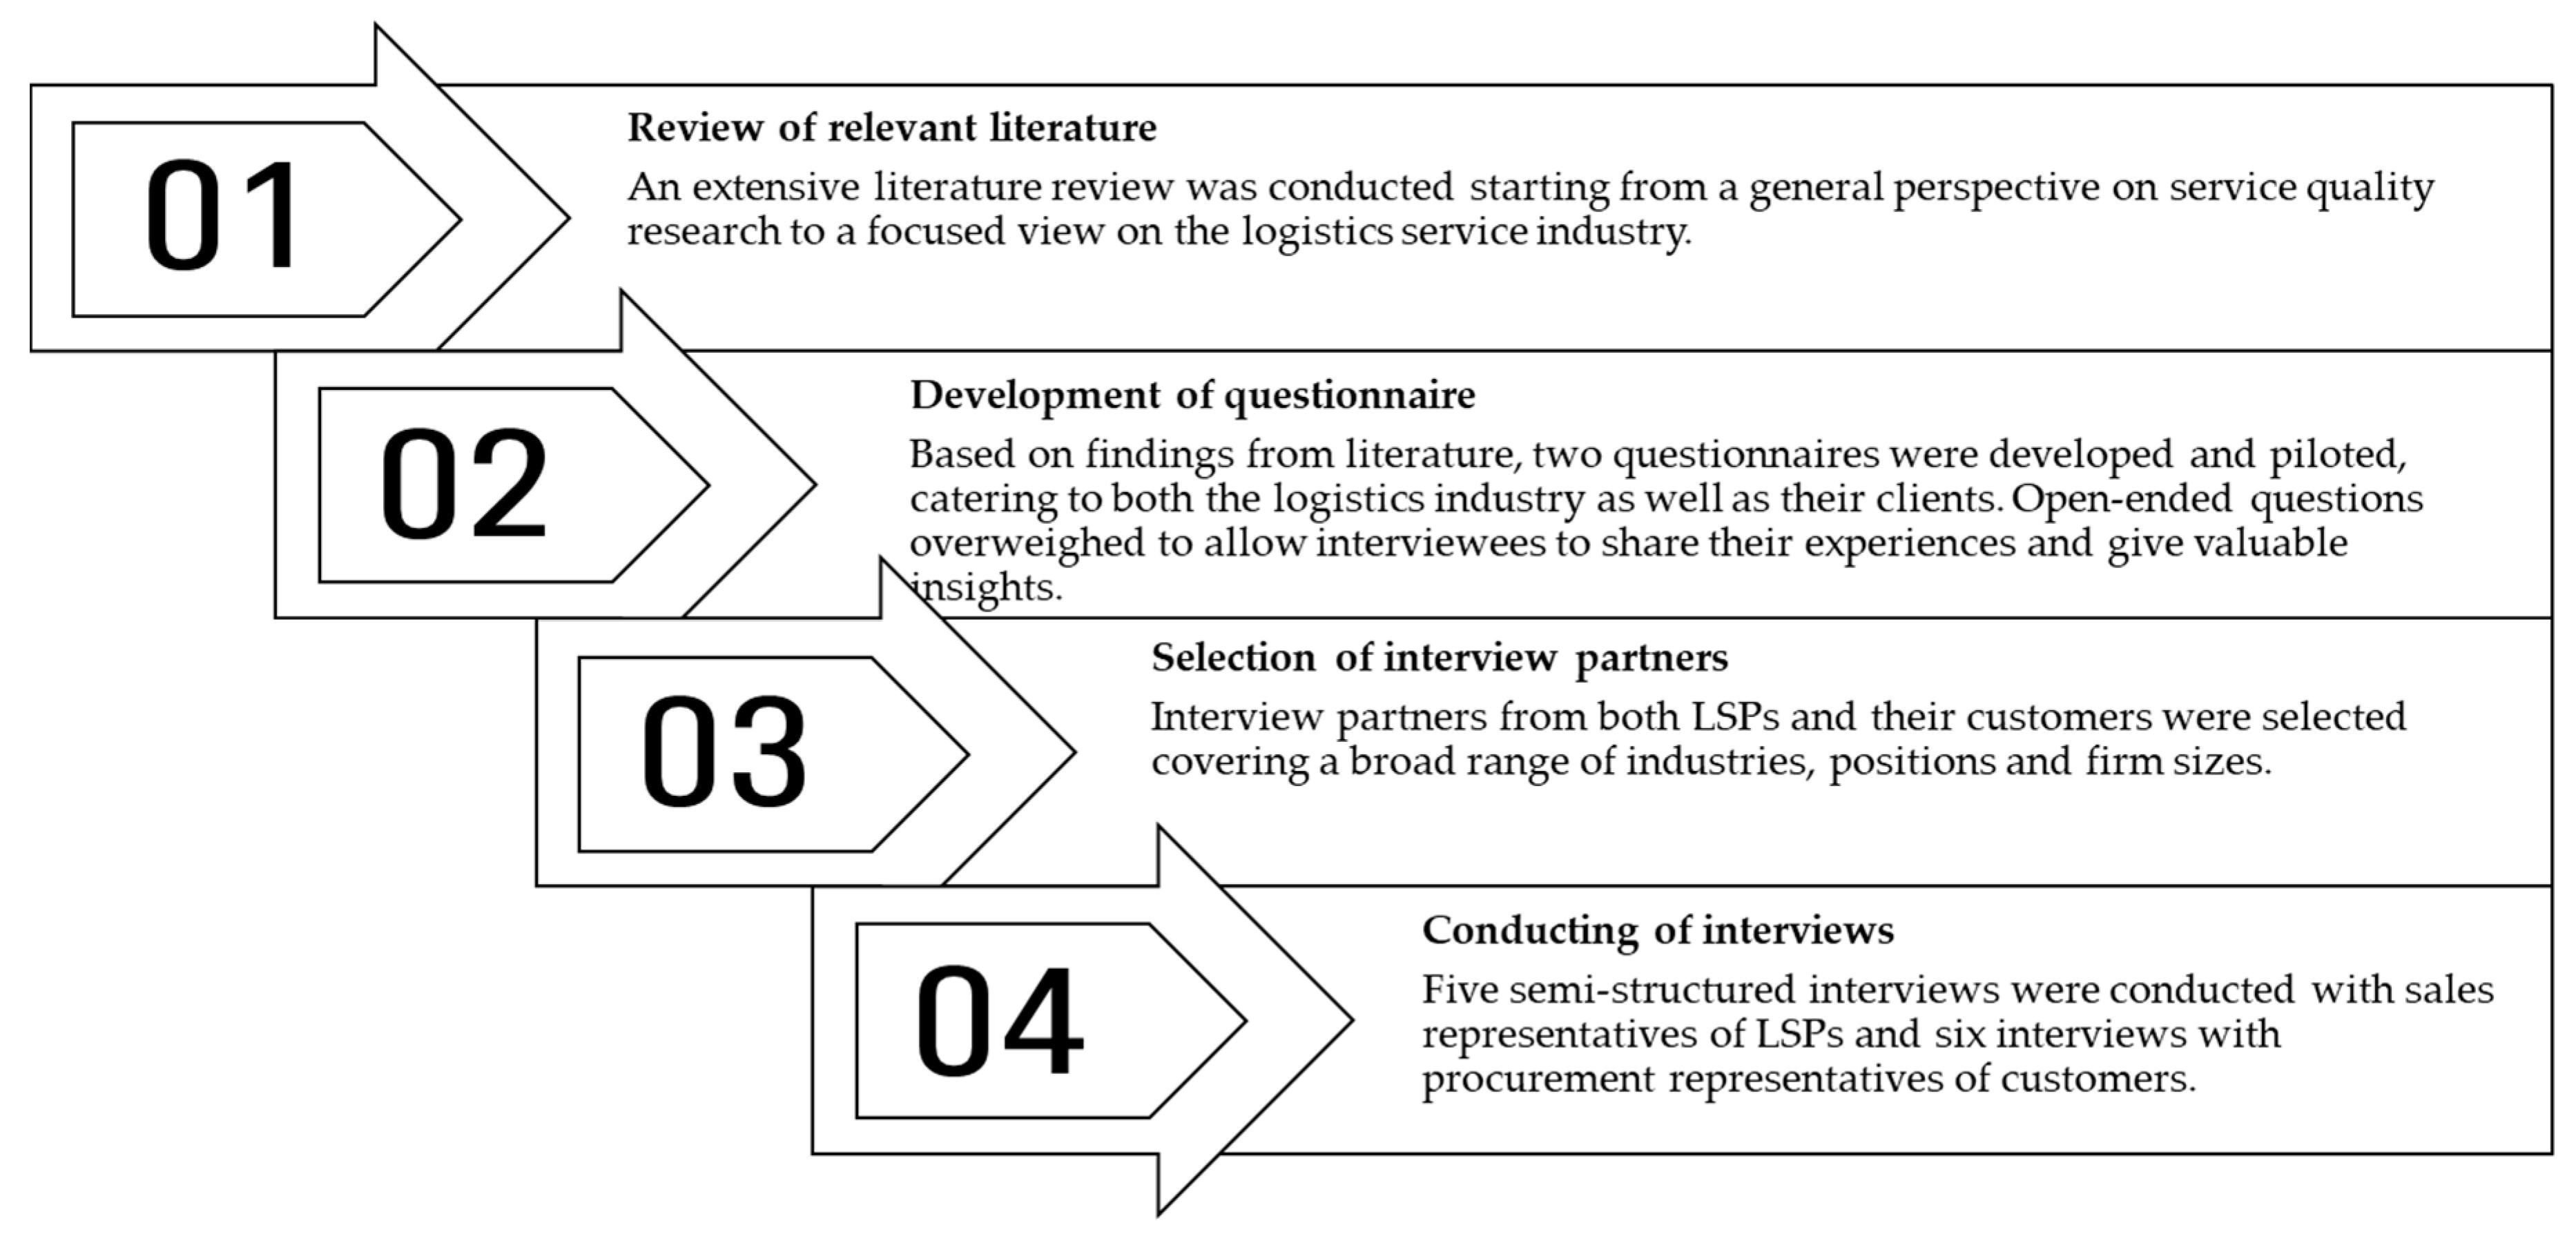
An extensive literature review was the first step in constructing a research framework (see Figure 4). Then, interview questions were developed for two interview groups (LSPs as sellers of logistics services, customers as buyers of logistics services). There were two questionnaires, which mainly consisted of open questions. They were iteratively evaluated together with an industry professional. Then, the interviewees were selected. The selection criteria for LSPs were that they were (1) currently employed at one of the top 25 global freight forwarders in 2016 (Burnson 2017) and (2) working in the sales department. The selection criteria for interviewees in the logistics service procurement department at the customer companies were that (1) they were actively involved in making purchasing decisions, and (2) their company demanded international logistics services on a regular basis (i.e., at least once per week). The interviews were the final step of the data collection process. In total, five semi-structured interviews were conducted with sales representatives of LSPs, and six interviews were conducted with procurement representatives of companies that purchased logistics services. Each interview lasted for approximately 30 min (see Table A1 in the Appendix A).
4.3. Data Analysis
The pattern-matching technique allowed for linking the empirically based patterns that were retrieved from the interviews to the predefined theoretical propositions. The coinciding patterns should strengthen the internal validity of these results (Yin 2009). All previously described phenomena must comply with a certain set of criteria to be included in the multi-sided model of service quality. On one hand, the necessary criteria must be fully met to be classified as a gap. On the other hand, sufficient criteria can support a finding without being pivotal to the final classification decision process. The classification criteria that had to be met, based on the interviews, were as follows:
- The majority of the involved parties must state that the described phenomenon has been observed in their daily business and potentially creates discrepancies (necessary criterion).
- The majority of the involved parties must mention that this phenomenon has an effect on their perceived service quality, based on the SERVQUAL dimensions (necessary criterion).
- The majority of the involved parties must appreciate the potential resolution of the discrepancy in terms of simplifying business interactions (sufficient criterion).
- The involved parties must mention that this phenomenon not only occurs in their company but also could be an industry-wide phenomenon (sufficient criterion).
All confirmed gaps will be addressed with a set of recommended actions to lessen the effects or close the gaps entirely.
5. Empirical Findings
5.1. Non-Homogenous Internal Expectations at the LSP (Gap 1)
The first discrepancy represents the internal gap between LSPs’ operations and sales departments. The industry professionals in sales positions at various LSPs were asked what their internal operations department expected from them and what disagreements might occur during their daily tasks.
As the Country Head of Tender Management Switzerland (LSP 1) explained, “The sales department most often has the target of increasing volume and acquiring new business. This can create internal discrepancies, as unrealistic high-volume targets force sales to be less selective when acquiring new customers.” This view was more or less shared among the other interviewees, most of whom added that the sales department could underestimate complexity as well. This led to the following description from the Business Development Manager for Sales (LSP 2): “We […] have quite ambitious targets to achieve in terms of acquiring new businesses and, sometimes, we might acquire new business that involves complicated handling procedures that lead to issues on the operations side.”
The above statements indicate a gap between the operations and sales departments in terms of internal expectations. The analysis, therefore, complements previous research dealing with differing expectations between departments, such as (Robinson 2014) identifying gaps between supply chain incentive alignments or (Burnson 2017) that some individuals in departments neglect the goals of other departments (see also (Norrman and Naslund 2019; Nauta et al. 2002; Spaho 2013; Walton and Dutton 1969; Li and Chen 2019)). This gap can be explained by varying department targets. The sales department is mainly concerned with increasing its sales volumes; therefore, it is not as selective about how complicated the handling of certain shipments might be. The acquisition of new complex tenders leads to a negative development of department targets at the operations department level, as it cannot handle these shipments with as much efficiency as its internal targets might require. In this sense, the findings are consistent with those of Nauta et al. (2002), who observe that the goals of manufacturing, planning, and sales employees differ and can be approximated by focusing on prosocial value orientation.
In terms of meeting the requirements to be qualified as a gap, the impact of this gap on service quality, based on the SERVQUAL dimensions, is mainly related to reliability and responsiveness. The differing internal expectations might lead to longer shipment handling times than those promised to the customer, negatively impacting the expected logistics service quality. Thus, the sales department must be aware of what operations can and cannot do, according to the Sales Executive for European Logistics (LSP 5), as one should never sell services that cannot be provided.
Therefore, sales representatives are advised to contact the operations department to get its opinion on potential shipment handling lead times, before promising standard lead times that are not realistic due to customs or special handling limitations. Another recommended action arose during an interview: an important sales meeting should always be accompanied by an operations manager to ensure that negotiated contracts are in line with the operations department’s capabilities and targets. This supports the findings of Norrman and Naslund (2019), who show that incentives and organizational changes affect employees’ behavior toward an improvement in departmental superordinate alignment.
5.2. Asymmetric Information between an LSP’s Operations and Sales Departments (Gap 2)
The second discrepancy is also characterized by the internal gap between an LSP’s operations and sales departments. The industry professionals in sales positions at various LSPs were asked how they compare their logistics and current market knowledge to their own operations department and whether any discrepancies occur.
Generally speaking, asymmetric information persists due to the continuously changing framework in which logistic services are provided. Given this circumstance, even sales personnel who previously worked in operations will lose their in-depth knowledge over time, according to the Sales Department Manager (LSP 3). This is even more prominent “in terms of handling dangerous goods,” according to the Key Account Manager for Marketing and Sales (LSP 2), who gave the following example: “the IATA (International Air Transport Association) requires operations to attend regular courses to be kept up to date with these special and sometimes changing handling requirements for dangerous goods.”
These statements from the interviews indicate that an asymmetric information gap exists between the two departments, especially concerning special handling requirements for dangerous or pharmaceutical goods. The analysis complements previous research dealing with internal asymmetric information (Vining 2003; Dahlmann and Röhrich 2019). This could cause quotations to customers to contain exceedingly low or high handling charges, which would either lead to diminished profit margins or a loss of tenders due to uncompetitive rates.
The expected discrepancy fulfills the requirements to be qualified as a gap—its impact on service quality, based on the SERVQUAL dimensions, is related to the assurance dimension. The differing knowledge in terms of actual costs for certain handling procedures might cause customers to feel that LSPs cannot provide certain services in a professional manner, negatively impacting perceived service quality.
Fostering boundary spanners would help to overcome this knowledge gap; these are individuals who maintain relationships with colleagues from different organizational departments, thus facilitating the cross-unit transfer of information (Tortoriello et al. 2012). An internal database with rate cards for special handling requirements that the operations department updates regularly in collaboration with the sales department might also be helpful. Vining (2003), for instance, examines factors affecting internal market failure and states that information asymmetries that can be interpreted as public good problems imply additional communication costs, which result in an increased risk of internal market failure. Alternatively, regularly distributed internal newsletters could inform the sales department of changes to requirements for special goods and corresponding changes in handling charges.
5.3. Service Quality Problems Due to the Cost Savings Maxim (Issue)
The third discrepancy results from a customer–internal issue arising within an LSP’s operations and procurement departments. The interviewed procurement employees were asked if their companies’ emphasize cost savings, and which effects they observed when management indeed stressed this target.
Following the answers of the Head of Operations (commodity trader) as well as the Key Account Manager for Marketing and Sales (LSP 2), it is necessary to further differentiate depending on the complexity of the requested service. Increasing complexity tends to reduce the importance of cost savings, while service quality becomes the dominant decision-making factor. However, generally, it seems necessary to evaluate the conditions as a whole, as the Head of Logistics (food retailer) pointed out: “We try not to look only for the best conditions in terms of low prices, as they might not be sustainable. If service quality issues occur, these savings could be diminished through revenue loss or extra costs required for express transports.”
The interviews illuminated a gap between the operations and procurement departments in terms of differing business unit targets. Most of the interviewees mentioned that, in general, the pressure on freight rates has increased dramatically in the last couple of years. In their opinion, cost savings are a major target for their customers, and higher price sensitivity definitely impacts the service quality that they provide. In contrast, only a minority of the customer procurement interviewees stated that cost savings are an important performance measure for their company. Instead, they stressed that they would rather select LSPs on the basis of their service quality. This discrepancy in statements might be due to the fact that large corporations presumably have the necessary negotiation power to demand both competitive freight rates and high service quality. Furthermore, the interviewees from customer procurement departments might have been reluctant to disclose inter-departmental conflicts in the interviews.
Thus, the internal discrepancy between customers’ procurement and operations departments is classified as an issue resulting from a lack of confirmatory statements from industry professionals on both sides. Therefore, no recommended actions are provided, as no evidence emerged from the interviews.
5.4. Dependence Asymmetry between LSPs and Their Customers (Gap 3)
The next discrepancy represents an external gap between LSPs and their customers. Industry professionals from both sides were first asked if they saw a difference in terms of corporate brand image-related service quality when comparing their LSP to the largest global freight forwarders. They were then asked what loyalty meant to both sides in terms of a long-term relationship with their forwarder or customer, respectively.
The Head of Operations (commodity trader) said, “Well, in my opinion, there are no real differences in service quality for the top global freight forwarders or in general in the logistics industry because they could not afford to have service issues, as their customers would simply change to one of the other top global carriers if discrepancies occurred.” While this view was not fully shared by most interviewees, the possible interchangeability of LSPs makes soft facts, such as relationships, an important factor for long-term relationships. Most LSPs stated that they prefer long-term partnerships. Some, like the Business Development Manager of Sales (LSP 3), even stated that they would not participate in low-price tenders, which would most likely reoccur within 6 months.
The interviews pointed to a gap between LSPs and their customers in terms of the nature of loyalty due to a dependence asymmetry. Gassenheimer and Ramsey (1994) argue that mutual dependence and power dependence imbalances are critical aspects of a loyal relationship between a buyer and a supplier. The results are, therefore, in agreement with Davis and Mentzer (2006). All of the LSPs stated that long-term partnerships are crucial for ensuring high-quality and reliable service. Further, partnerships enable LSPs to consider customers’ individual requirements. In line with this, the majority of the customer procurement interviewees stated that, in general, they prefer long-term partnerships. However, they mentioned additional requirements that must be fulfilled to keep these long-term commitments stable and beneficial to both sides. As the Country Head of Tender Management Switzerland (LSP 1) explained, “Most customers state that they are interested in a long-term relationship but expect high concession from their logistics providers in terms of fixed freight rates over a long period of time (1–2 years) and other included services. This ensures budget planning reliability on the customer’s side but creates high risks for the freight forwarders, who have to be considered before participating in such quotation requests.”
This indicates a power imbalance between the LSPs and their customers, as both parties might not have the same motivation to maintain a long-term relationship, which is in agreement with the findings of Davis and Mentzer (2006). It is also consistent with Wallenburg (2009), who finds that an LSP’s proactive cost and performance improvements are key drivers of increasing customer loyalty. This power imbalance can have serious consequences for the LSP–customer relationship (see, e.g., Habib et al. (2015), as effective supply chain management requires both LSPs and their customers to maintain and build long-term relationships (Mentzer et al. 2001b). Furthermore, the study proposed that a discrepancy exists in the perceived differentiation potential of LSPs’ corporate brand image, but this could not be confirmed in the interviews.
The impact of this gap on service quality, according to the SERVQUAL dimensions, lies in the empathy dimension. The process of building long-lasting relationships that benefit both parties enables LSPs to give personal attention to specific customer problems, ensuring continuous improvement in perceived service quality for customers.
Thus, LSPs should focus on providing superior service to powerful customers to ensure that they provide an adequate service level while keeping loyalty levels unchanged. In this sense, the findings can be linked to those of Cahill et al. (2010), who stress that it is not price satisfaction but rather relational satisfaction that drives customer loyalty. Furthermore, sales representatives should focus on understanding and solving specific customer problems, as these intangible aspects lead to customer loyalty in the long term (Davis and Mentzer 2006). Finally, sales representatives should proactively inquire about their customers’ pain points and expectations to detect development perspectives in their service portfolios.
5.5. LSPs’ Missing Investments in New Services and Innovative Assets (Gap 4)
The following discrepancy represents another external gap between LSPs and their customers. The sales representatives of LSPs were asked if they expected customers to demand new and innovative services. The interviewees from the customers’ procurement departments were asked if they expected and demanded these new services as well as more investment in IT infrastructure from their LSPs. The Business Development Manager of Sales (LSP 3) replied: “It depends on the size of the customer. A customer who has a generally innovative company culture does request its LSPs to be more innovative, but we have many traditional customers who focus on their existing business and try to optimize their processes.” This view was shared by the Sales Executive for European Logistics (LSP 5), who added: “A major interest of some of our customers in terms of EDI connection is that they could start to work completely paperless.” On the customer side, some interviewees stated that “no LSP so far has approached [them] with new innovative solutions that actually solved any […] logistic related issues,” and therefore they “did not expect really anything from [their] LSPs besides handling [their] transports,” as the Team Leader Export and Procurement (sensor producer) described it.
These statements indicate a clear gap between LSPs and their customers in terms of expectations regarding new and innovative services, especially making the whole supply chain more transparent and providing real-time data on shipment statuses. This gap corresponds to the findings of Bommer et al. (2001), who report that customers’ expectations for service quality differ from those of the supplier. The majority of the interviewed LSP employees mentioned investing heavily in innovative services and IT infrastructure and building up their own innovation departments at their global corporate headquarters. When asked about disruptive innovations that came to mind, they mainly mentioned process innovations. For instance, the Key Account Manager for Marketing and Sales (LSP 2) answered, “digitalizing our internal processes and services.” However, they did not mention actually providing new innovative services, such as inventory financing or other VAS. One reason for this could be the prevailing focus on decreasing costs (e.g., through innovative, more efficient processes). The results correspond to the findings of Bellingkrodt and Wallenburg (2013), who state that LSPs often have insufficient internal competencies, and thus external knowledge sources are important for innovations to address new customers. The interviewed customers stated that their LSPs made investments in their IT systems, but a great deal of progress was still necessary in terms of user friendliness and advanced capabilities.
The impact of this gap on service quality, with regard to the SERVQUAL dimensions, involves responsiveness and tangibles. The lack of user-friendly systems and missing investments in new services and IT infrastructure create a discrepancy in terms of dependably providing reliable and real-time data to customers, therefore negatively affecting perceived service quality.
Therefore, LSPs should increase their investments in developing new VAS for their customers to sustain their competitive edge. Particularly for smaller LSPs, it could be beneficial to form alliances and set up larger shared innovations departments to bundle financial and personnel resources. Based on the interviews, LSPs should analyze current customer issues and design specific new applications and services that solve real customer problems and consequently create actual added value. Sales representatives should inform their customers about new service developments at their LSPs at an early stage. This might help in identifying the future demand for these services, adapting to specific customer demands during the development phase, and illustrating to customers that the LSP emphasizes the development of new services to solve specific customer issues.
5.6. Limited Trust and Information Sharing across the Supply Chain (Gap 5)
The fifth discrepancy represents an external gap between LSPs and their customers relating to limited trust and information sharing across the supply chain. Volume forecasts were used during the interviews to indicate the level of information sharing among the shippers and their freight forwarders. The sales representatives were asked whether they had ever received quotation requests with little or no volume information and what the consequence was for the issued quotation. The interviewees from the shippers’ procurement departments were asked if they usually provided all the relevant internal information to their freight forwarders. If they said no, they were asked for the rationale for not disclosing all the internal volume information.
While the explanations differed, all of the interviews confirmed the existence of asymmetric information. According to the Key Account Manager for Marketing and Sales (LSP 2), for LSPs this “leads to an immense risk potential […] as we have no idea what charges might be involved with this request. […] We use a freight rate that involves the smallest risk and [include] a security buffer for us. This obviously leads to high fright rates, which […] cannot be compared, […] as every LSP has made his own assumptions.” Most interviewees on the customer side were aware of the negative impact and added premiums. Nonetheless, some customers “only provide rough estimates of volumes in a consolidated format,” said the Global Transportation Specialist Procurement (garment producer). He and almost all the others further agreed that: “[We] bundle our pick-up and delivery locations [as] we simply do not want to [disclose] this confidential information.”
These statements indicate a gap between the LSPs and certain customers. All of the interviews showed that information asymmetry exists regarding forecast volumes, locations, and limited information sharing, and it is based mainly on behavioral motives relating to trust. The analysis, therefore, complements previous supply chain management research addressing trust and information sharing (Rollins et al. 2011; Zolfagharinia and Haughton 2012). Zolfagharinia and Haughton (2012) analyze information sharing activities in the outsourcing of logistics activities and determine that the sharing of demand information diminishes with shrinking supplier capacity. Some LPSs try to “contact the customer [and] clarify the uncertainties,” but if no further information is provided, the Business Development Manager for Sales (LSP 3) might “refuse to give a quotation, as it would require too much effort and risk from [their] side.” LSPs attributed the limited information-sharing efforts by some customers to either negotiation tactics or a lack of insight into their own processes due to the paucity of data analysis systems. Interestingly, the interviewees from LSPs did not mention shippers’ lack of trust in freight forwarders.
In terms of satisfying the criteria to be qualified as a gap, the impact of this gap on service quality lies in the reliability and assurance dimensions of the SERVQUAL. Shippers’ procurement departments’ unwillingness to disclose all relevant information has negative effects on the entire supply chain. LSPs cannot adapt to a longer-term planning horizon and optimize their capabilities and capacities. This causes longer lead times or price premiums, adding to the bullwhip effect along the supply chain (Ojha et al. 2019). When supply chains, rather than companies, compete (Santos et al. 2019), inefficient and fragile supply chains have negative consequences for all involved actors. Furthermore, these actions keep LSPs from inspiring trust and confidence in their customers due to a lack of information, which has a negative impact on perceived service quality.
The recommendations for addressing the identified gap are directed to both LPSs and their customers. Decision-makers at LSPs should address the limited level of trust that shippers indicated by sensitizing their staff concerning data confidentiality, remodeling processes, and improving the security of their IT systems. In turn, shippers’ procurement departments and their commissioned logistics consultancy firms should rethink their bargaining tactics to strengthen the overall supply chain and receive reliable and competitive freight rates from their LSPs. Alternatively, they should communicate with their service providers whenever they experience a lack of trust in the mutual relationship. Non-disclosure agreements (NDAs), which one of the interviewed shippers uses, might shorten the time that it takes to establish a trusting relationship.
6. Discussion
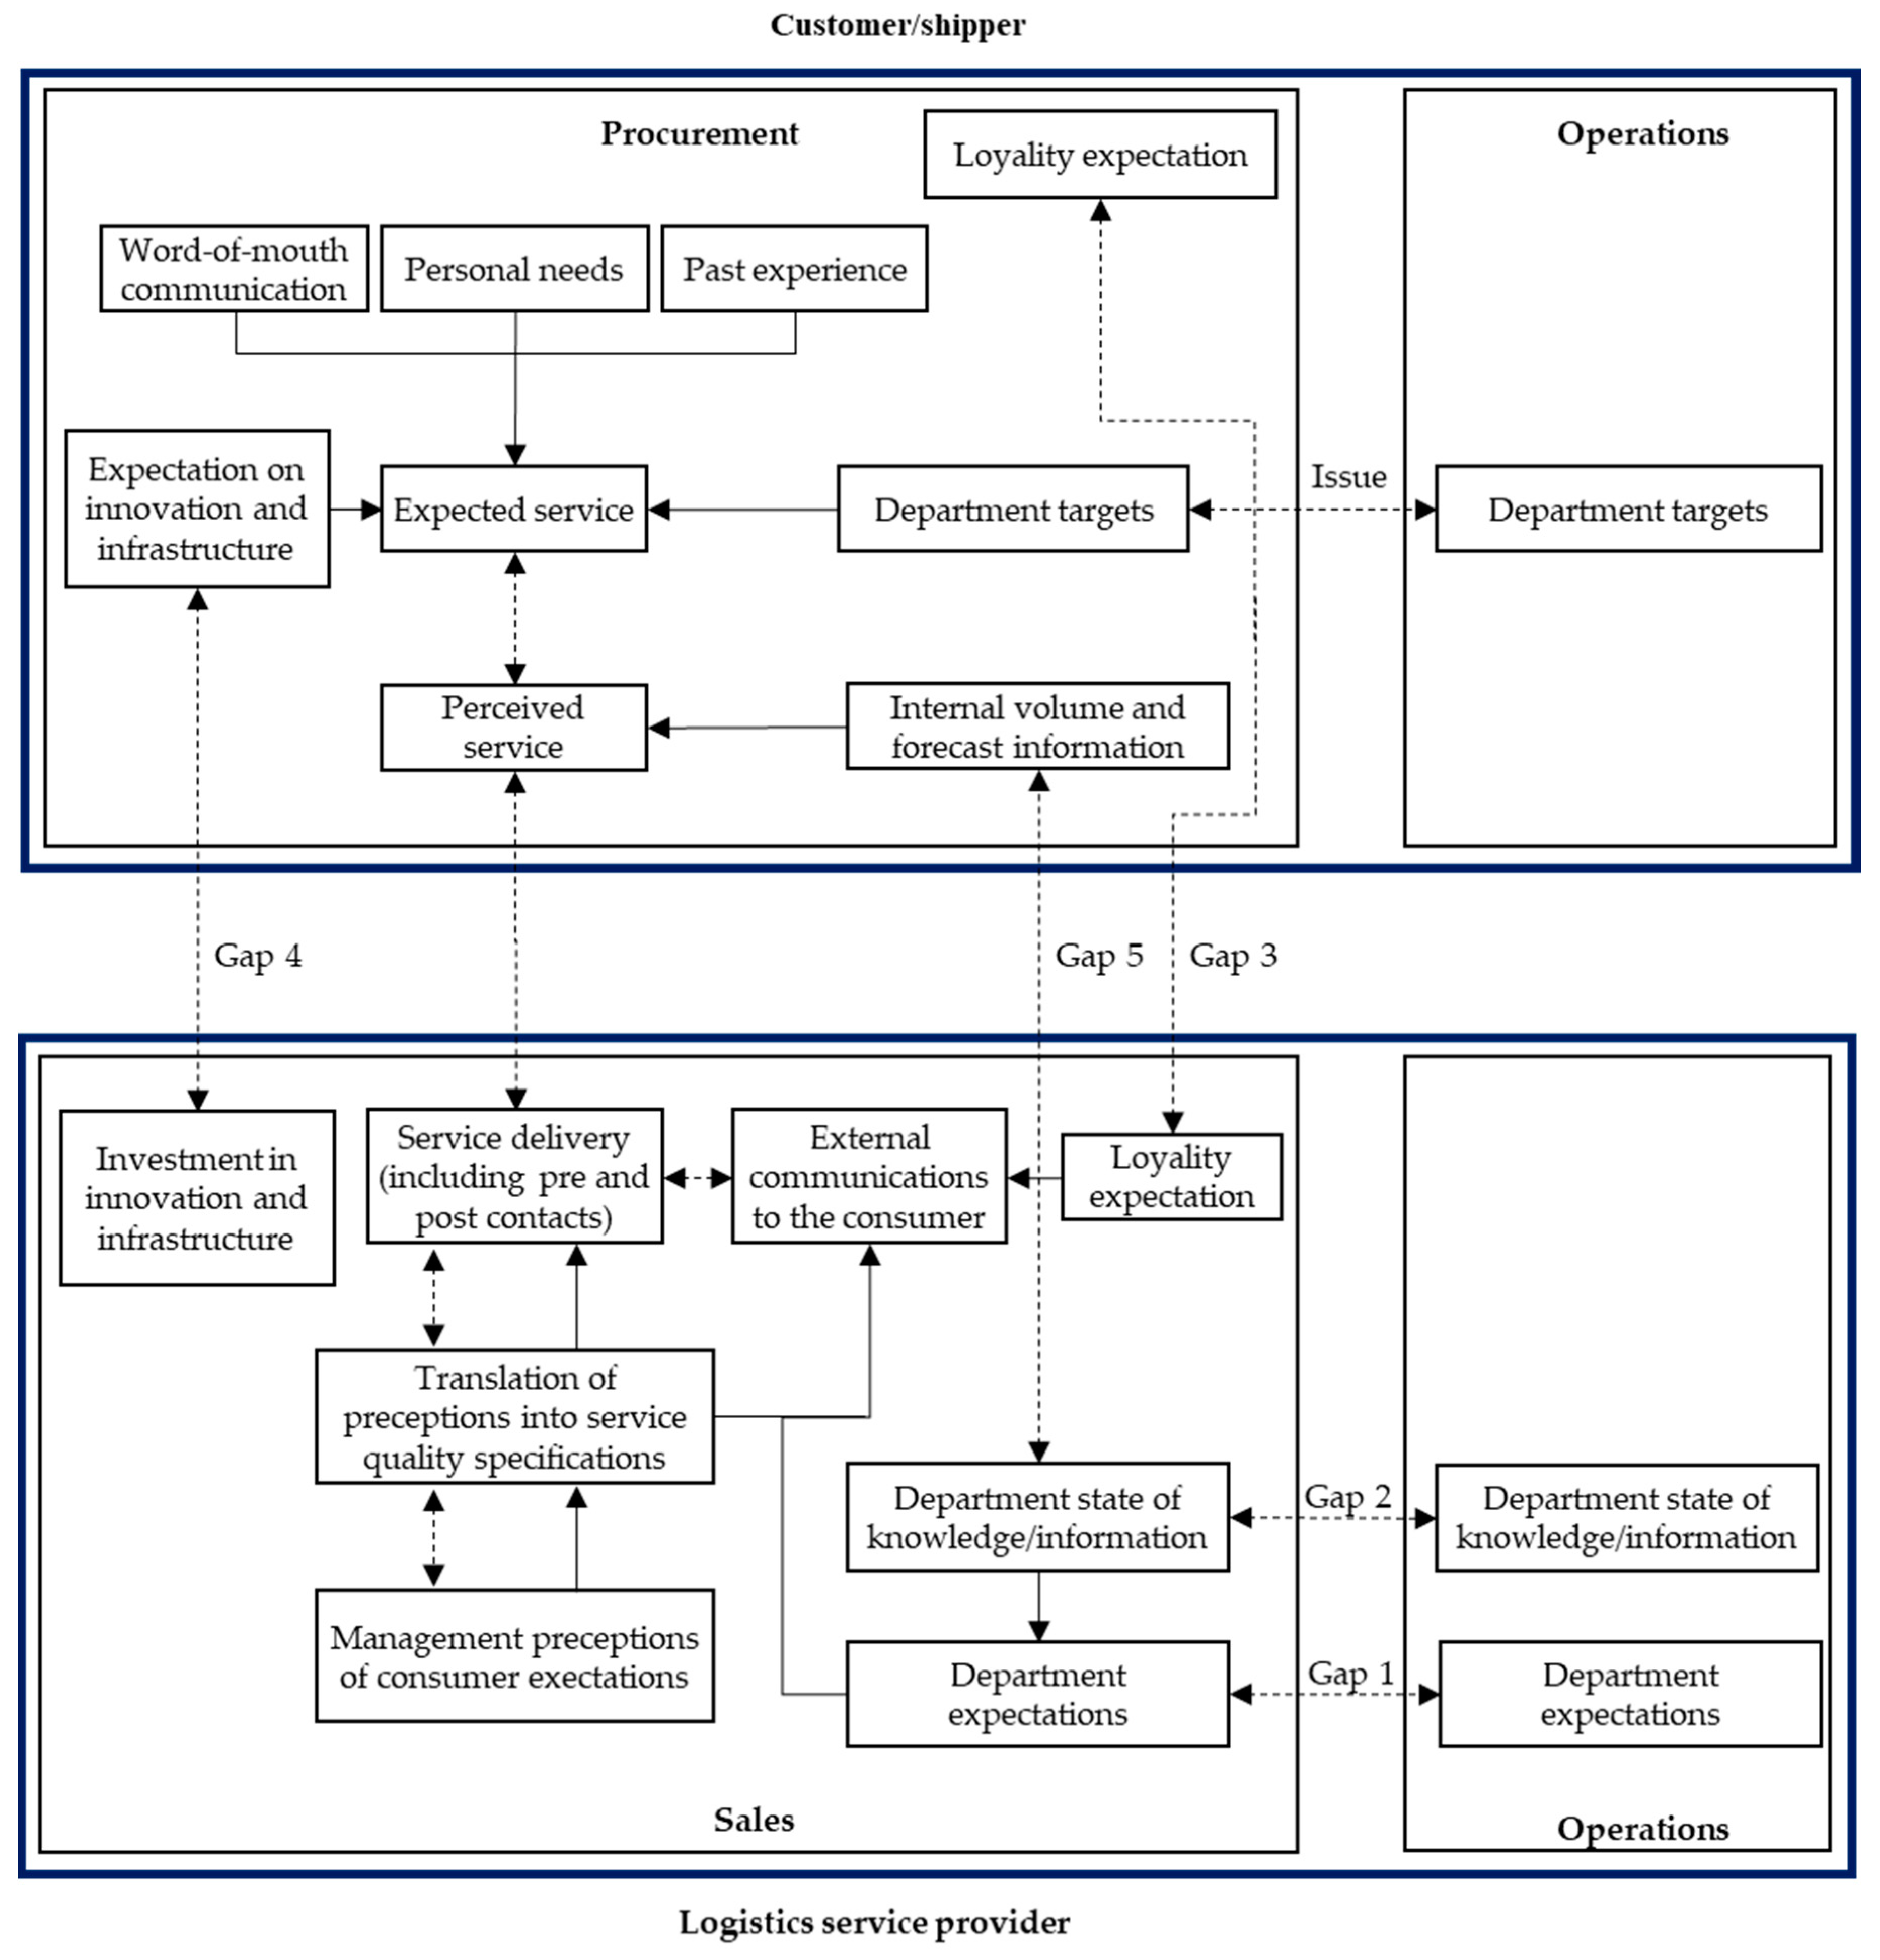
The aim of this study was to take a multi-sided view on service quality and identify potential discrepancies between expected and perceived service quality in logistics services and VAS. The study extended the original model of service quality (see Figure 5). It was assumed that internal and external discrepancies between customers and LSPs exist, which should be resolved in the future to ensure frictionless collaboration and enable the implementation of new and more sophisticated VAS, such as supply chain finance solutions.
To ensure lucidity, the multi-sided model does not individually display the gaps identified by Parasuraman et al. (1985); rather, it focuses on the gaps and issues that it uncovered in the present study.
The first three discrepancies, Gap 1, Gap 2, and Gap 3, were identified as having a direct influence on internal expectations at LSPs. Therefore, these expectations are directly or indirectly embedded in external communication with their customers. Gap 4 creates a discrepancy in expected service because customers anticipate that their LSP will make more investments in their current IT system and develop new services that solve actual customer problems. Consequently, Gap 4 has a direct impact on customers’ expected service in combination with the identified issue (service quality issues at the LSP due to the costs savings maxim). Gap 5 is caused by information asymmetry between the internally existing volume information on the customer’s side and the volume information they provide to their LSP during the quotation process. LSPs have less information to work with, and department expectations at LSPs are directly affected; external communication is indirectly influenced through varying quotation proposals.
The results of this study imply that some discrepancies need special attention from management to ensure a continuously high level of service quality and fully satisfied customers. Especially in terms of providing new services and reliable real-time data, there is tremendous potential for improvement. The interviewed LSPs were all quite satisfied with the investments that they had made in new infrastructure and IT solutions. However, their customers expect more sophisticated and reliable IT systems from their LSPs in the near future. LSPs’ conservative approach to IT investments corresponds with the findings of Piplani et al. (2004), who identify rapid IT development as the main barrier to the general adoption of IT innovations. The present study’s findings indicate that the logistics service industry must increase its investments in these new services, and in IT infrastructure, to keep customers satisfied and avoid losing market share to potential new providers from, for example, the start-up sector. With shrinking profit margins, the financial situation of the logistics service industry might give the impression that further investments in new services and IT infrastructure are difficult to handle, but the financial consequences might be even more severe if these issues are ignored.
Another result concerns the limited trust and consequent restricted information sharing between customers and LSPs. Without exception, all of the LSP sales representatives indicated that they deal with imprecise volume forecasts from shippers on a regular basis. Such quotation requests—often ideated by logistics consultancy firms—decrease overall supply chain performance and create confusion in the market. This is in line with Shen et al. (2018), who confirm that information sharing along the supply chain can enhance overall performance. The interviews revealed asymmetric perceptions of the issue. While the LSPs assumed that bargaining tactics were the main motive for customers’ behavior, the shippers felt that limited trust caused by previous data leaks at LSPs was the main reason for withholding precise information.
7. Conclusions
This study identified potential discrepancies in service quality within LSPs’ existing services. It extended the original B2C service quality model by Parasuraman et al. (1985) to include five gaps arising in the B2B context between LSPs and their customers. It augmented the original service quality model by (1) emphasizing the cross-functional dimension between departments within LSPs, (2) broadening the scope of the inter-company dimension, (3) regarding customers as multi-dimensional organizations, and (4) catering to the specific characteristics of the logistics services industry. It then derived recommendations for how to close these gaps. The internal process of closing potential gaps between perceived and expected service quality is meant to ensure outstanding service delivery to increase customers’ perception of LSPs’ competence, allowing them to offer even more complex services in the future (e.g., FVAS).
Of the five gaps identified, Gaps 1 and 2 occurred internally and addressed non-homogeneous expectations between the sales and operations departments as well as communication and knowledge gaps between the two entities. Gaps 3, 4, and 5 occurred between LSPs and their customers. They represented a loyalty and corporate brand image gap, an innovation and IT gap, and an information asymmetry gap, respectively. The suggested actions that LSPs should take include investments in IT infrastructure, regular assessments of client satisfaction, investments in innovative services that add value for customers, and development of trust among the different supply chain actors.
This study contributes to the current literature by extending service quality research with a model that is specific to the B2B context of the logistics service industry. In the past, the supply chain management literature has rarely focused on the perspective of LSPs, as LSPs are the least integrated link in the entire supply chain (Martinsen and Bjorklund 2012). On the basis of multiple interviews with the top 25 globally operating LSPs and their potential clients, this study derived a multi-sided service quality model covering discrepancies inside and outside of organizational boundaries. Previous well-known studies on service quality failed to identify service quality gaps arising in the inter-company relationship. Further, the developed service quality model caters to the growing number of large multinational companies with complex vertically and horizontally integrated structures (Wiersema and Bowen 2008) by analyzing the cross-functional dimensions of service quality in both LSPs and their customers.
The study aimed to make LSPs’ middle and senior management aware of the potential gaps between perceived and expected service quality and to suggest potential actions to close these gaps. If applied, the proposed actions could ensure service delivery that aligns with customers’ expectations. Achieving customer satisfaction will enable sales representatives to convince customers of LSPs’ ability to offer new VAS and to take over more strategic functions in the future. This will allow LSPs to set themselves apart from pure price-driven businesses and establish long-term relationships with their customers.
In terms of limitations, readers should be aware that there are differing service expectations across national and cultural boundaries, as well as differing service quality expectations among customers and industries (Mentzer et al. 2004). Furthermore, this study did not consider aspects of service quality that might occur if LSPs mandate subcontractors to carry out certain parts of their logistics services or if LSPs outsource tasks, for example, to shared service centers. This involvement of additional parties might lead to discrepancies that will need to be examined in further research.
Additionally, as this study pointed out that limited trust inhibits the information sharing between an LSP and its customers, more research needs to be conducted in this area. Shen et al. (2018) confirm that information sharing can enhance overall performance. In addition, this study showed that trust is an important factor within the supply chain. Further research might therefore tackle the problem of how the involved parties can ensure trust among the parties and foster information sharing between each other.
To thrive in a highly competitive market, LSPs must ensure that their service quality level matches their customers’ expectations. Only if customers perceive their LSPs to be trustworthy and competent partners will they entrust them with more complex (and more lucrative) VAS in the future.
Author Contributions
Conceptualization, P.W. and E.H.; methodology, P.W. and E.H.; validation, P.W. and E.H.; formal analysis, P.W. and E.H.; investigation, P.W. and E.H.; writing—original draft preparation, P.W. and E.H.; writing—review and editing, P.W. and E.H.; visualization, P.W. and E.H.; project administration, P.W. and E.H. All authors have read and agreed to the published version of the manuscript.
Funding
This research was supported by the Nederlandse Organisatie voor Wetenschappelijk Onderzoek.
Acknowledgments
We thank our colleagues Michael Henke, Axel Schulte, Philipp Sprenger, Tanja Brink and Yaghoob Mohammad Ali Nia Omran from Fraunhofer (Germany), Federico Caniato, Antonella Moretto and Agostino Bonzani from Politecnico di Milano (Italy), Janet Godsell, Donato Masi and Sumeer Chakuu from Warwick (UK) and Michiel Steeman, Ronald de Boer and Luca Gelsomino from Windesheim University of Applied Sciences (the Netherlands), who provided insight and expertise that greatly assisted the research, although they may not agree with interpretations and/or conclusions of this paper.
Conflicts of Interest
The authors declare no conflict of interest.
Appendix A

Table A1.
Interview Details.
| Position | Company |
|---|---|
| Country Head of Tender Management Switzerland | Global LSP 1: The company is an international provider of supply chain solutions serving 12 core industries from its 500 offices worldwide. It offers its clients end-to-end solutions in over 70 countries, handling air and sea freight and logistics and manufacturing, among others. |
| Key Account Manager, Marketing and Sales | Global LSP 2: The company offers a full range of logistics services, including air, land, and sea freight; contract logistics; consultancy services. Over 75,000 employees serve clients from around 2000 locations worldwide. |
| Business Development Manager, Sales | Global LSP 3: The firm offers air, land, and sea freight as well as a range of specialized services. It operates through a network of over 700 locations, with a strong focus on service quality. |
| Sales Department Manager | Global LSP 4: The company is a European market leader in logistics services, comprising service transport logistics, warehousing, and specialized services. |
| Sales Executive, European Logistics | Global LSP 5: The firm is specialized in air, land, and sea freight; logistics solutions; customs clearance. It operates 1000 offices and facilities worldwide, employing over 45,000 people. |
| Head of Logistics | National food retailer: The company operates two distribution centers and over 100 retail stores in Switzerland. It offers products under house brands and selected external brands. |
| Head of Procurement | National food producer: The company develops and manufactures 970 different white-label products for its retail partners, specializing in sweet and savory snacks. |
| Team Leader Export and Procurement | Sensor producer: The company is a leading manufacturer of digital systems and micro-sensors, which can, for example, be found in industries such as medicine, automotive, and consumer goods. Its internal sales offices serve customers in the US, Europe, and Asia. |
| Global Transportation Specialist (Procurement) | Garment producer: The company is privately owned and serves 120 markets from its 49 subsidiaries through retailers and its own stores. |
| Head of Operations | Global commodity trader: The company is one of the largest diversified commodity traders in the world, and it focuses on producing and marketing raw materials. Further, the company offers its clients services in the areas of financing and logistics. |
| Head of Global Supply Chain Management | International specialty chemical company: The company is a globally operating developer, producer, and supplier of specialty chemicals. It employs more than 2000 people in Switzerland in its over 20 subsidiaries. |
References
- Aigbogun, Osaro, Zulkipli Ghazali, and Radzuan Razali. 2014. A framework to enhance supply chain resilience the case of Malaysian pharmaceutical industry. Global Business and Management Research 6: 219. [Google Scholar]
- Ali, Sadia Samar, and Rajbir Kaur. 2018. An analysis of satisfaction level of 3PL service users with the help of ACSI. Benchmarking: An International Journal 25: 24–46. [Google Scholar] [CrossRef]
- Andersson, Dan, and Andreas Norrman. 2002. Procurement of logistics services–A minutes work or a multi-year project? European Journal of Purchasing & Supply Management 8: 3–14. [Google Scholar]
- Au, Alan Kai Ming, and Alan Ching Biu Tse. 2019. Expectancy disconfirmation: Effects of deviation from expected delay duration on service evaluation in the airline industry. Asia Pacific Journal of Marketing and Logistics 31: 291–300. [Google Scholar] [CrossRef]
- Baker, George P., Michael C. Jensen, and Kevin J. Murphy. 1988. Compensation and incentives: Practice vs. theory. The Journal of Finance 43: 593–616. [Google Scholar] [CrossRef]
- Baxter, Pamela, and Susan Jack. 2008. Qualitative case study methodology: Study design and implementation for novice researchers. The Qualitative Report 13: 544–59. [Google Scholar]
- Bellingkrodt, Silvia, and Carl Marcus Wallenburg. 2013. The role of external relationships for LSP innovativeness: A contingency approach. Journal of Business Logistics 34: 209–21. [Google Scholar] [CrossRef]
- Bienstock, Carol C., Marla Royne Stafford, and Thomas F. Stafford. 2015. The role of technology in industrial customers’ perceptions of logistics service quality and their future purchase intentions. In Revolution in Marketing: Market Driving Changes. Cham: Springer, p. 122. [Google Scholar]
- Bommer, Michael, Brian O’Neil, and Shadrach Treat. 2001. Strategic assessment of the supply chain interface: A beverage industry case study. International Journal of Physical Distribution & Logistics Management 31: 11–25. [Google Scholar]
- Bruch, Heike, and Bernd Vogel. 2011. Fully Charged: How Great Leaders Boost Their Organization’s Energy and Ignite High Performance. Boston: Harvard Business Press. [Google Scholar]
- Burnson, P. 2017. Top 25 Freight Forwarders 2017: Digitization & E-Commerce Continue to Reshape. Available online: https://www.logisticsmgmt.com/article/top_25_freight_forwarders_2017_digitization_e_commerce_continue_to_reshape (accessed on 27 September 2018).
- Cahill, David L., Thomas J. Goldsby, A. Michael Knemeyer, and Carl Marcus Wallenburg. 2010. Customer loyalty in logistics outsourcing relationships: An examination of the moderating effects of conflict frequency. Journal of Business Logistics 31: 253–77. [Google Scholar] [CrossRef]
- Cronin, J. Joseph, Jr., and Steven A. Taylor. 1992. Measuring service quality: A reexamination and extension. The Journal of Marketing 56: 55–68. [Google Scholar] [CrossRef]
- Dahlmann, Frederik, and Jens K. Roehrich. 2019. Sustainable supply chain management and partner engagement to manage climate change information. Business Strategy and the Environment 28: 1632–47. [Google Scholar] [CrossRef]
- Davis, Beth R., and John T. Mentzer. 2006. Logistics service driven loyalty: An exploratory study. Journal of Business Logistics 27: 53–73. [Google Scholar] [CrossRef]
- De Chernatony, Leslie, and Susan Segal-Horn. 2003. The criteria for successful services brands. European Journal of Marketing 37: 1095–118. [Google Scholar] [CrossRef] [Green Version]
- Dimitriadis, Sergios, and Eric Stevens. 2008. Integrated customer relationship management for service activities: An internal/external gap model. Managing Service Quality: An International Journal 18: 496–511. [Google Scholar] [CrossRef]
- Durvasula, Srinivas, Steven Lysonski, and Subhash C. Mehta. 1999. Testing the SERVQUAL scale in the business-to-business sector: The case of ocean freight shipping service. Journal of Services Marketing 13: 132–50. [Google Scholar] [CrossRef] [Green Version]
- Gassenheimer, Jule B., and Rosemary Ramsey. 1994. The impact of dependence on dealer satisfaction: A comparison of reseller-supplier relationships. Journal of Retailing 70: 253–66. [Google Scholar] [CrossRef]
- Ghodsypour, Seyed Hassan, and C. O’brien. 2001. The total cost of logistics in supplier selection, under conditions of multiple sourcing, multiple criteria and capacity constraint. International Journal of Production Economics 73: 15–27. [Google Scholar] [CrossRef]
- Gil-Saura, Irene, Gloria Berenguer-Contri, and Eugenia Ruiz-Molina. 2018. Satisfaction and loyalty in B2B relationships in the freight forwarding industry: Adding perceived value and service quality into equation. Transport 33: 1184–95. [Google Scholar] [CrossRef] [Green Version]
- Gounaris, Spiros. 2005. Measuring service quality in B2B services: An evaluation of the SERVQUAL scale vis-a-vis the INDSERV scale. Journal of Services Marketing 19: 421–35. [Google Scholar] [CrossRef] [Green Version]
- Grönroos, Christian. 1984. A service quality model and its marketing implications. European Journal of Marketing 18: 36–44. [Google Scholar] [CrossRef]
- Grönroos, Christian. 1998. Marketing services: The case of a missing product. Journal of Business & Industrial Marketing 13: 322–38. [Google Scholar]
- Habib, Farooq, Marko Bastl, and Colin Pilbeam. 2015. Strategic responses to power dominance in buyer-supplier relationships: A weaker actor’s perspective. International Journal of Physical Distribution & Logistics Management 45: 182–203. [Google Scholar]
- Haywood-Farmer, John. 1988. A conceptual model of service quality. International Journal of Operations & Production Management 8: 19–29. [Google Scholar] [CrossRef]
- Hennig-Thurau, Thorsten, Kevin P. Gwinner, and Dwayne D. Gremler. 2002. Understanding relationship marketing outcomes: an integration of relational benefits and relationship quality. Journal of Service Research 4: 230–47. [Google Scholar] [CrossRef]
- Ho, Li-Hsing, and Pi-Yun Chang. 2015. Innovation capabilities, service capabilities and corporate performance in logistics services. International Journal of Organizational Innovation 7: 24–33. [Google Scholar]
- Hofmann, Erik, and Florin Osterwalder. 2017. Third-party logistics providers in the digital age: Towards a new competitive arena? Logistics 1: 9. [Google Scholar] [CrossRef] [Green Version]
- Huang, Ming-Hui, and Roland T. Rust. 2018. Artificial intelligence in service. Journal of Service Research 21: 155–72. [Google Scholar] [CrossRef]
- Hussain, Rahim, Amjad Al Nasser, and Yomna K. Hussain. 2015. Service quality and customer satisfaction of a UAE-based airline: An empirical investigation. Journal of Air Transport Management 42: 167–75. [Google Scholar] [CrossRef]
- Karia, Noorliza. 2018. Knowledge resources, technology resources and competitive advantage of logistics service providers. Knowledge Management Research & Practice 16: 414–26. [Google Scholar]
- Ketchen, David J., Jr., and G. Tomas M. Hult. 2007. Bridging organization theory and supply chain management: The case of best value supply chains. Journal of Operations Management 25: 573–80. [Google Scholar] [CrossRef]
- Kim, Minkyun, and Sangmi Chai. 2017. The impact of supplier innovativeness, information sharing and strategic sourcing on improving supply chain agility: Global supply chain perspective. International Journal of Production Economics 187: 42–52. [Google Scholar] [CrossRef]
- Ko, Yong Jae, and Donna L. Pastore. 2005. A Hierarchial model of service quality for the recreational sport industry. Sport Marketing Quarterly 14: 84–97. [Google Scholar]
- König, Christian, Nigel D. Caldwell, and Abhijeet Ghadge. 2019. Service provider boundaries in competitive markets: The case of the logistics industry. International Journal of Production Research 57: 5624–39. [Google Scholar] [CrossRef] [Green Version]
- Kumar, Arun, Linet Ozdamar, and Chai Peng Ng. 2005. Procurement performance measurement system in the health care industry. Leadership in Health Services 18: 152–66. [Google Scholar] [CrossRef] [PubMed]
- Lai, Fujun, Dahui Li, Qiang Wang, and Xiande Zhao. 2008. The information technology capability of third-party logistics providers: A resource-based view and empirical evidence from China. Journal of Supply Chain Management 44: 22–38. [Google Scholar] [CrossRef]
- Leigh, Michael, and Xiaohong Li. 2015. Industrial ecology, industrial symbiosis and supply chain environmental sustainability: A case study of a large UK distributor. Journal of Cleaner Production 106: 632–43. [Google Scholar] [CrossRef]
- Li, Shuting, and Xiangfeng Chen. 2019. The role of supply chain finance in third-party logistics industry: A case study from China. International Journal of Logistics Research and Applications 22: 154–71. [Google Scholar] [CrossRef]
- Lieb, R. 2015. Consolidation in the 3PL industry: Why is it happening, and what does it mean? Supply Chain Quarterly 2015: 36–41. [Google Scholar]
- Lieb, Robert C., and Kristin J. Lieb. 2016. 3PL CEO perspectives on the current status and future prospects of the third-party logistics industry in North America: The 2014 survey. Transportation Journal 55: 78–92. [Google Scholar] [CrossRef]
- Lings, Ian N., and Roger F. Brooks. 1998. Implementing and measuring the effectiveness of internal marketing. Journal of Marketing Management 14: 325–51. [Google Scholar] [CrossRef]
- Luk, Sherriff TK, and Roger Layton. 2002. Perception gaps in customer expectations: Managers versus service providers and customers. Service Industries Journal 22: 109–28. [Google Scholar] [CrossRef]
- Lusch, Robert F. 2011. Reframing supply chain management: A service-dominant logic perspective. Journal of Supply Chain Management 47: 14–18. [Google Scholar] [CrossRef]
- Marinagi, C., P. Trivellas, and P. Reklitis. 2015. Information quality and supply chain performance: The mediating role of information sharing. Procedia-Social and Behavioral Sciences 175: 473–9. [Google Scholar] [CrossRef] [Green Version]
- Martinsen, Uni, and Maria Björklund. 2012. Matches and gaps in the green logistics market. International Journal of Physical Distribution & Logistics Management 42: 562–83. [Google Scholar]
- McKnight, D. Harrison, Nancy K. Lankton, Andreas Nicolaou, and Jean Price. 2017. Distinguishing the effects of B2B information quality, system quality, and service outcome quality on trust and distrust. The Journal of Strategic Information Systems 26: 118–41. [Google Scholar] [CrossRef]
- Melnyk, Steven A., Douglas M. Stewart, and Morgan Swink. 2004. Metrics and performance measurement in operations management: Dealing with the metrics maze. Journal of Operations Management 22: 209–18. [Google Scholar] [CrossRef]
- Mentzer, John T., Daniel J. Flint, and G. Tomas M. Hult. 2001. Logistics service quality as a segment-customized process. Journal of Marketing 65: 82–104. [Google Scholar] [CrossRef]
- Mentzer, John T., William DeWitt, James S. Keebler, Soonhong Min, Nancy W. Nix, Carlo D. Smith, and Zach G. Zacharia. 2001. Defining supply chain management. Journal of Business Logistics 22: 1–25. [Google Scholar] [CrossRef]
- Mentzer, John T., Matthew B. Myers, and Mee-Shew Cheung. 2004. Global market segmentation for logistics services. Industrial Marketing Management 33: 15–20. [Google Scholar] [CrossRef]
- Nauta, Aukje, Carsten KW De Dreu, and Taco Van Der Vaart. 2002. Social value orientation, organizational goal concerns and interdepartmental problem-solving behavior. Journal of Organizational Behavior: The International Journal of Industrial, Occupational and Organizational Psychology and Behavior 23: 199–213. [Google Scholar] [CrossRef] [Green Version]
- Norrman, Andreas, and Dag Naslund. 2019. Supply chain incentive alignment: The gap between perceived importance and actual practice. Operations and Supply Chain Management: An International Journal 12: 129–42. [Google Scholar] [CrossRef] [Green Version]
- Ojha, Divesh, Funda Sahin, Jeff Shockley, and Sri V. Sridharan. 2019. Is there a performance tradeoff in managing order fulfillment and the bullwhip effect in supply chains? The role of information sharing and information type. International Journal of Production Economics 208: 529–43. [Google Scholar] [CrossRef]
- Özer, Özalp, and Yanchong Zheng. 2017. Establishing trust and trustworthiness for supply chain information sharing. In Handbook of Information Exchange in Supply Chain Management. Edited by A.Y. Ha and C.S. Tang. Cham: Springer International Publishing, pp. 287–312. [Google Scholar]
- Panayides, Photis M., and Meko So. 2005. Logistics service provider–client relationships. Transportation Research Part E: Logistics and Transportation Review 41: 179–200. [Google Scholar] [CrossRef]
- Parasuraman, Anantharanthan, Valarie A. Zeithaml, and Leonard L. Berry. 1985. A conceptual model of service quality and its implications for future research. The Journal of Marketing 49: 41–50. [Google Scholar] [CrossRef]
- Parasuraman, Ananthanarayanan, Valarie A. Zeithaml, and Leonard L. Berry. 1988. SERVQUA—A multiple-item scale for measuring consumer perceptions of service quality. Journal of Retailing 64: 12–40. [Google Scholar]
- Parasuraman, Anantharanthan, Leonard L. Berry, and Valarie A. Zeithaml. 1991. Perceived service quality as a customer-based performance measure: An empirical examination of organizational barriers using an extended service quality model. Human Resource Management 30: 335–64. [Google Scholar] [CrossRef]
- Parasuraman, Ananthanarayanan, Valarie A. Zeithaml, and Leonard L. Berry. 1996. The behavioral consequences of service quality. The Journal of Marketing 60: 31–46. [Google Scholar]
- Piplani, Rajesh, Shaligram Pokharel, and Albert Tan. 2004. Perspectives on the use of information technology at third party logistics service providers in Singapore. Asia Pacific Journal of Marketing and Logistics 16: 27–41. [Google Scholar] [CrossRef]
- Rafiq, Mohammed, and Harlina S. Jaafar. 2007. Measuring customers’ perceptions of logistics service quality of 3PL service providers. Journal of Business Logistics 28: 159–75. [Google Scholar] [CrossRef]
- Ramanathan, Usha, Sandar Win, and Andreas Wien. 2018. A SERVQUAL approach to identifying the influences of service quality on leasing market segment in the German financial sector. Benchmarking: An International Journal 25: 1935–55. [Google Scholar] [CrossRef] [Green Version]
- Rangarajan, Devarajan, Arun Sharma, Bert Paesbrugghe, and Robert Boute. 2018. Aligning sales and operations management: An agenda for inquiry. Journal of Personal Selling & Sales Management 38: 220–40. [Google Scholar]
- Ritala, Paavo, Arash Golnam, and Alain Wegmann. 2014. Coopetition-based business models: The case of Amazon.com. Industrial Marketing Management 43: 236–49. [Google Scholar] [CrossRef]
- Robinson, Oliver C. 2014. Sampling in interview-based qualitative research: A theoretical and practical guide. Qualitative Research in Psychology 11: 25–41. [Google Scholar] [CrossRef]
- Rollins, Minna, Saara Pekkarinen, and Mari Mehtälä. 2011. Inter-firm customer knowledge sharing in logistics services: An empirical study. International Journal of Physical Distribution & Logistics Management 41: 956–71. [Google Scholar]
- Santa, Ricardo, Paul Hyland, and Mario Ferrer. 2014. Technological innovation and operational effectiveness: Their role in achieving performance improvements. Production Planning & Control 25: 969–79. [Google Scholar]
- Santos, Gilberto, Federica Murmura, and Laura Bravi. 2019. Developing a model of vendor rating to manage quality in the supply chain. International Journal of Quality and Service Sciences 11: 34–52. [Google Scholar] [CrossRef]
- Seth, Nitin, S.G. Deshmukh, and Prem Vrat. 2006. A conceptual model for quality of service in the supply chain. International Journal of Physical Distribution & Logistics Management 36: 547–75. [Google Scholar]
- Shen, Bin, Tsan-Ming Choi, and Stefan Minner. 2018. A review on supply chain contracting with information considerations: Information updating and information asymmetry. International Journal of Production Research 57: 4898–4936. [Google Scholar] [CrossRef] [Green Version]
- Skjoett-Larsen, Tage. 2000. Third party logistics—From an interorganizational point of view. International Journal of Physical Distribution & Logistics Management 30: 112–27. [Google Scholar]
- Sližytė, Asta, and Irena Bakanauskienė. 2007. Designing performance measurement system in organization. Management of Organizations: Systematic Research 43: 135–48. [Google Scholar]
- Sohn, Jea-Il, Su-Han Woo, and Taek-Won Kim. 2017. Assessment of logistics service quality using the Kano model in a logistics-triadic relationship. International Journal of Logistics Management 28: 680–98. [Google Scholar] [CrossRef]
- Spaho, Kenan. 2013. Organizational communication and conflict management. Management Journal of Contemporary Management Issues 18: 103–18. [Google Scholar]
- Tan, Lay-Hong, Syaiful-Rizal Hamid, and Boon-Cheong Chew. 2016. Service quality audit based on conceptual gaps model of service quality: A case study of top three largest local bank in Malaysia. International Journal of Productivity and Quality Management 18: 99–115. [Google Scholar] [CrossRef]
- Tipping, Andrew, and Perter Kauschke. 2016. Shifting Patterns: The Future of the Logistics Industry. Available online: https://www.pwc.com/gx/en/industries/transportation-logistics/publications/the-future-of-the-logistics-industry.html (accessed on 12 October 2020).
- Tortoriello, Marco, Ray Reagans, and Bill McEvily. 2012. Bridging the knowledge gap: The influence of strong ties, network cohesion, and network range on the transfer of knowledge between organizational units. Organization Science 23: 1024–39. [Google Scholar] [CrossRef]
- Van Der Vorst, Jack GAJ, and Adrie JM Beulens. 2002. Identifying sources of uncertainty to generate supply chain redesign strategies. International Journal of Physical Distribution & Logistics Management 32: 409–30. [Google Scholar]
- Van Weele, Arjan J. 2010. Purchasing & Supply Chain Management: Analysis, Strategy, Planning and Practice. 5 vols. Hampshire: Cengage Learning EMEA. [Google Scholar]
- Vining, Aidan R. 2003. Internal market failure: A framework for diagnosing firm inefficiency. Journal of Management Studies 40: 431–57. [Google Scholar] [CrossRef]
- Wallenburg, Carl Marcus. 2009. Innovation in logistics outsourcing relationships: Proactive improvement by logistics service providers as a driver of customer loyalty. Journal of Supply Chain Management 45: 75–93. [Google Scholar] [CrossRef]
- Walton, Richard E., and John M. Dutton. 1969. The management of interdepartmental conflict: A model and review. Administrative Science Quarterly 14: 73–84. [Google Scholar] [CrossRef]
- Wetzel, Philipp, and Erik Hofmann. 2020. Service portfolio extensions and sales incentives: An examination of financial value-added services provided by logistics service providers. International Journal of Supply Chain and Operations Resilience 4: 21–36. [Google Scholar] [CrossRef]
- Wiersema, Margarethe F., and Harry P. Bowen. 2008. Corporate diversification: The impact of foreign competition, industry globalization, and product diversification. Strategic Management Journal 29: 115–32. [Google Scholar] [CrossRef]
- Yin, R.K. 2009. Chapter 4: Collecting case study evidence: The principles. In Case study Research: Design and Methods. London: Sage, pp. 111–64. [Google Scholar]
- Zolfagharinia, Hossein, and Michael A. Haughton. 2012. The benefit of information sharing in a logistics outsourcing context. International Journal of Logistics Systems and Management 13: 187–208. [Google Scholar] [CrossRef]
Figure 1.
The five mismatches (gaps) between customers’ expected and perceived service quality.

Figure 2.
The five dimensions of SERVQUAL (Parasuraman et al. 1988).
Figure 2.
The five dimensions of SERVQUAL (Parasuraman et al. 1988).

Figure 3.
Necessary extensions to the traditional service quality model.

Figure 4.
Structure of the data collection process.

Figure 5.
Multi-sided model of service quality for the logistics service industry.

Table 1.
Propositions.
| Number | Proposition Content |
|---|---|
| Proposition 1 | There is a discrepancy between an LSP’s operations and sales department in terms of non-homogenous internal expectations. |
| Proposition 2 | There are communication and knowledge discrepancies between an LSP’s internal operations and sales departments. |
| Proposition 3 | There is a discrepancy between an LSP’s operations and sales departments in terms of differing internal incentives and targets. |
| Proposition 4 | There is a loyalty and corporate brand image discrepancy between an LSP and its customers. |
| Proposition 5 | There is an innovation and IT discrepancy between an LSP and its customers. |
| Proposition 6 | There is a discrepancy between an LSP and its customers in terms of limited trust and information sharing across the supply chain based on both processual and behavioral motives. |
© 2020 by the authors. Licensee MDPI, Basel, Switzerland. This article is an open access article distributed under the terms and conditions of the Creative Commons Attribution (CC BY) license (http://creativecommons.org/licenses/by/4.0/).
Share and Cite
MDPI and ACS Style
Wetzel, P.; Hofmann, E. Toward a Multi-Sided Model of Service Quality for Logistics Service Providers. Adm. Sci. 2020, 10, 79. https://0-doi-org.brum.beds.ac.uk/10.3390/admsci10040079
AMA Style
Wetzel P, Hofmann E. Toward a Multi-Sided Model of Service Quality for Logistics Service Providers. Administrative Sciences. 2020; 10(4):79. https://0-doi-org.brum.beds.ac.uk/10.3390/admsci10040079
Chicago/Turabian StyleWetzel, Philipp, and Erik Hofmann. 2020. "Toward a Multi-Sided Model of Service Quality for Logistics Service Providers" Administrative Sciences 10, no. 4: 79. https://0-doi-org.brum.beds.ac.uk/10.3390/admsci10040079
Note that from the first issue of 2016, this journal uses article numbers instead of page numbers. See further details here.