Detecting Bid-Rigging in Public Procurement. A Cluster Analysis Approach


1
Faculty of Business Administration in Foreign Languages, Bucharest University of Economic Studies, 010374 Bucharest, Romania
2
Faculty of Management, Bucharest University of Economic Studies, 010374 Bucharest, Romania
*
Author to whom correspondence should be addressed.
Adm. Sci. 2021, 11(1), 13; https://0-doi-org.brum.beds.ac.uk/10.3390/admsci11010013
Submission received: 29 December 2020
/
Revised: 4 February 2021
/
Accepted: 5 February 2021
/
Published: 10 February 2021
(This article belongs to the Special Issue E-administration—Its Use and Spread)
Abstract
:This paper analyses the public procurement auctions for snow removal contracts to find out whether bid-rigging occurred. Due to the limited participation in the auction processes, detection of anticompetitive agreements was possible. The econometric analysis used in our study supported the findings of a cartel agreement. Cluster analysis, statistical hypothesis, normality and symmetry and nonparametric tests reveal two types of auctions: competitive and noncompetitive bids. The aim of this paper is to analyze the public procurement auctions with nonparametric statistical methods. Our findings are in line with the literature in the field.
1. Introduction
Bid rigging in public procurements is one of the main problematic aspects targeted by the governments and the local public authorities. Government procurements usually account for 10–15% of gross domestic product (GDP) in developing countries (Global Trade Negotiations 2006) and up to 25% of GDP in the developed countries (Blume and Heidhues 2006). Local public authorities outsource their utilitarian projects and services through open-bid auctions, direct negotiation, or competitive biddings (Menezes and Monteiro 2006). Due to the public procurement legislation, in most cases, public procurements procedures are conducted through competitive auctions (Bolotova et al. 2008).
Collusion and corruption are the main factors of concern in the auctions (Porter 2005; Pesendorfer 2000; Connor 2001). Other studies (Harrington 2005; Carayannis and Popescu 2005; Porrini 2015; Liao et al. 2003) confirm that bidders concluded anticompetitive agreements to increase the bidding price and get better contracts from the public authorities.
Public procurements organized by the governmental bodies and the local authorities’ departments have many weaknesses, depicted in the economic literature, as follows:
- Excessive state intervention, discrimination in awarding contracts, favoritism for local contractors create substantial problems in the awarding process (İriş and Santos-Pinto 2013; Clancy 2018);
- Lack of transparency in the public procurement contracts is a common practice within the government departments (McAfee and McMillan 1992; Stempel et al. 2018; Marshall and Marx 2007);
- Abuse of the state prerogatives and corruption in the public auctions (Previtali and Cerchiello 2018; Kim et al. 2017);
- Bidders form cartels to increase the auction price and get contracts at the auctioneers’ costs (Banerjee et al. 2018; Olaussen et al. 2018; Otamendi et al. 2018).
Nevertheless, there are few articles reviewed in the empirical literature on bid-rigging for public procurement auctions. Zona (1986) proposes and analyzes the bid-rigging in the construction of the highways tendered in the public auctions, based on a multilinear regression model. McMillan (1991) describes the agreement between bidders of public works in Japan, while Howard and Kaserman (1989) evaluate the damages in bid-rigging cases with regression methods. Finally, Commander and Schankerman (1997) examined the scheme to submit identical bids within the public procurement auctions.
In general, the detection of rigged tenders is based on two main components: structural screening (which addresses issues related to the specific features of the market and the tender) and behavioral screening (which addresses issues related to the behavior of tenderers).
Structural screening is a predominantly preventive measure, but it can be applied both ex-ante and ex-post to the auction. Thus, the analysis of the market structure and the specificity of certain forms of auction organization can provide important information and indications about those markets or those types of purchases that are prone, by their specificity, to facilitate the auctioning of auctions. In developing the proposal for a set of indicators that could be considered for structural screening, both the indicators suggested by the OECD guide to combating auction fraud and those selected to build the aggregate competitive pressure index were considered. It is appreciated that the latter is relevant in assessing the ability of a market to facilitate or not the occurrence of such anticompetitive behavior. The role of structural screening is to act as a filter, which can lead to the identification of those tenders in industries or areas more exposed to the conclusion of agreements between competitors.
Behavioral screening is performed ex-post during the auction and has the role of observing certain aspects that may suggest agreements between the participants in the auctions. Thus, certain behavioral patterns of bidders can be captured, related either to the way of bidding or to the subsequent development of contracts, which may be the result of agreements. Some of the indicators proposed by the OECD in the document entitled: “Guidelines for detection of bid-rigging in public procurement” were used for behavioral issues. Unlike structural screening, behavioral screening can lead to the identification of tenders with a high probability of fraud, the indicators considered may be, initially, indications of initiating investigations and, subsequently, even evidence, as appropriate.
Traditionally, public procurement had only to be economically efficient, with little regard for other objectives than the purely economic ones. In recent times, however, due to a more general ascension of the sustainable development concept, governments have been put in the position to “lead by example” and use their purchasing power to advance the goals of sustainable development; as a specific development, sustainable public procurement has been slowly creeping in. From “secondary considerations” in the 2004 Directives (Arnould 2004; Caranta et al. 2013; Caranta 2016), the need to include social and environmental considerations in public tendering procedures has led to the coining of new terms, much more powerful and all-encompassing, such as “horizontal policies” (Kunzlik and Arrowsmith 2009; Arrowsmith and Kunzlik 2009; Comba 2010), “sustainable procurement” or even “strategic procurement”. We can state that with the new 2014 Directives, the sustainability paradigm is almost taking over the realm of public procurement, and it is marketed as a major “selling point” of the new legislation.
With strict reference to Romania, the special law is dedicated to the regulation of public procurement, which—among others—compels the elaboration of a national plan in this respect, with concrete objectives, but also to “the introduction in the process of public procurement of environmental protection criteria that would allow the improvement of services’ quality and optimization of costs with public procurement in the short, medium and long term” (Government of Romania 2006). However, based on the studies undertaken, we can say that a rethinking of the legal norms pertaining to the public procurement field, in accordance with the best European practices, is meant to lead to the attainment of some higher performance thresholds to increase achievements.
The national legal framework related to the GPP system was extremely limited at that time, consisting of (i) the national strategy for sustainable development, horizons 2013–2020–2030 (Government of Romania 2008) and the emergency ordinance, which regulated the awarding of public procurement contracts (Government of Romania 2014). Before stating the expected changes, one should mention that the chapter “Environment” of the government program 2013–2016 (Parliament of Romania 2016) contains some commitments regarding public procurement, among which their encouragement by adopting a specific action plan, aimed at “promoting the models of sustainable production and consumption”, the development of clean and environmentally friendly technologies, setting efficient criteria for public procurement, recalling on the need to inform/raise the awareness of the authorities in the same field.
This article presents a case study of an anticompetitive agreement put in place by the snow removal operators in Romania. We evaluate the bids during 2015–2017 and make statistical analysis between the starting prices and the bidding prices.
The structure of the paper is the following. First, we introduce the statistical methods used in our analysis. Then, we make a description of the bids and test the hypothesis. In the Results section, we make a split of the data in two clusters, from the perspective of competition. The Discussion section presents conclusions of the analyses and underlines limitations of the study and future research.
2. Materials and Methods
To analyze the existence of a cartel on a given market, an adequate quantitative method is represented by the statistical analysis of the auction time-series from that market (Connor 2001; Tenorio 1993). In this case, it is necessary to use more variables, not just starting and bid awarding price. Examples of such variables are sales capacities, transportation, experience, etc.
The analytical method to detect bid-rigging was the cluster method, mainly used when we do not have a priori information above the existence of a cartel (Smith 1993; Imhof et al. 2018; Abrantes-Metz et al. 2012; Buşu 2012; Andrei and Busu 2014). The first step was to divide bids into several categories, which differ significantly from one another. Thus, it was assumed that there were only two ways to bid—collusive and competitive—which means we were likely to have 2 clusters that differ significantly from each other. The first cluster with the auctions resulting from the struggle between firms to obtain the respective good, and the other involved auctions in which the participants had concluded various agreements between themselves (so-called rigged bids).
To perform this analysis, we started from the ratio between the bidding price and starting price of an auction. Detecting possible anticompetitive agreements was achieved in the following steps:
- Performing a cluster analysis. This was done by dividing the data into two groups according to the ratio defined above. The first cluster included those auctions with a high ratio (when the sale price was close to the starting price), while the second cluster included auctions with a low ratio (sale price was significantly lower than the starting price) likely to be the result of competitive behavior.
- Applying nonparametric tests. These tests helped us check whether the two clusters were significantly different in terms of distribution from a statistical point of view. It also tested the statistical assumptions that there were significant differences between the two bidding modalities. Thus, if there were collusive behaviors, two different bidding models should have resulted. In addition, we needed to do a box-plot test to analyze the difference between the average of the two data series.
- Testing for normality and symmetry. Normality and symmetry series data of the two groups was tested by Kolmogorov–Smirnov test. This test compared the probabilistic distribution of the two clusters with a certain theoretical distribution. In general, the normal distribution was selected for theoretical distribution. Prior, considering the selection of the two clusters, we expected the first cluster (for which the ratio was high) to have a normal distribution, while the second cluster (for which the ratio was low) had an asymmetric distribution. This result would confirm the hypothesis that the cluster for which the ratio was low corresponds to the situation of competition, while the second cluster would correspond with the situation where, among the participants, there was a collusive agreement (because anticompetitive agreements maintain an extremely low bidding level close to the starting price).
- Testing statistical hypotheses. Testing statistical assumptions were performed to see if there were significant differences between different data categories. In our case, we tested if there were significant differences between the bids in consecutive years.
National Company for Highways and National Roads of Romania (CNADNR) has the responsibilities of exploitation, permanent maintenance, modernization and development of national road network and highway day on the territory of Romania. CNADNR has its structure 7 subunits without legal personality, called the Regional Directorate of Roads and Bridges (DRDP), located in Bucharest, Craiova, Iasi, Cluj, Timisoara, Constanta, Brasov. Hereinafter, we refer to them as SDN1, SDN2, etc.
The authors focused on the snow removal sector in Romania as it is one of the most important sectors with a high percentage impact on national GDP. The data were collected from the CNADNR’s website. The data represent all snow removal bids during 2015 and 2017.
During the analyzed period, respectively the winter seasons 2015–2016 and 2016–2017, modalities of awarding public procurement contracts used by DRDP were tendering procedures and negotiation without prior publication of a contract notice, and the award criterion was the lowest price. DRDP has concluded framework agreements, subsequent agreements, service contracts and additional acts, as their object was services routine maintenance in winter of the national roads under their management.
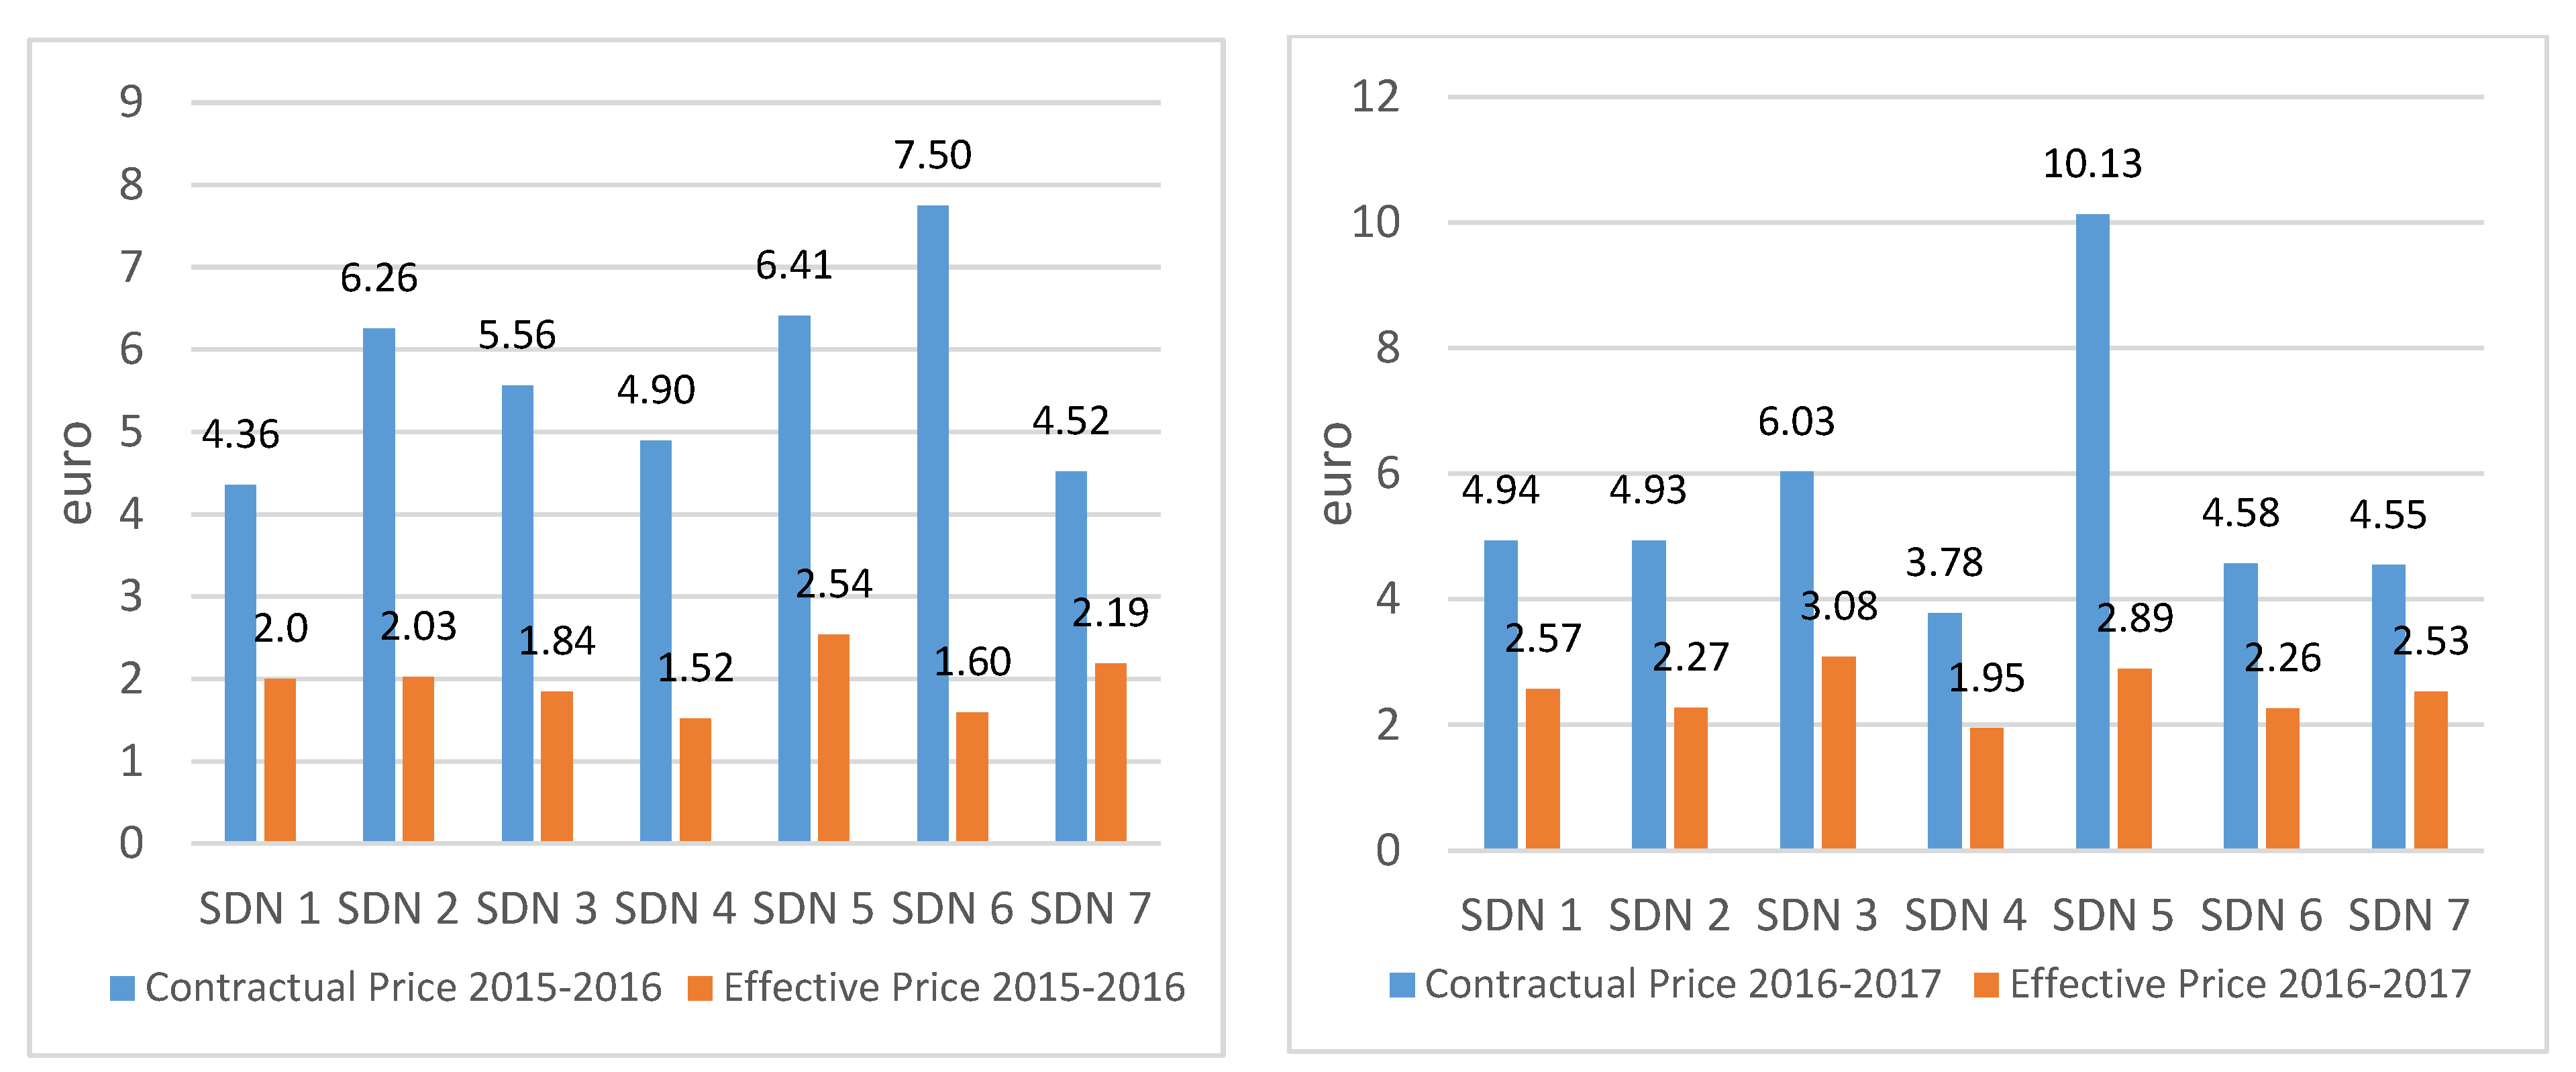
From the information provided by CNADNR, a comparative analysis between contractual and actual prices per km removed snow was performed (see Figure 1). It was found that there are significant differences between them both at the same season as well between the two seasons.
The data revealed that the large differences between the values of contracts for the provision of the current winter maintenance of national roads and motorways and the amounts actually paid for them were because the value of the contracts is established considering the duration of the winter season of approximately 5 months (15 October–31 March); and uniform weather conditions throughout this period.
Statistical analysis was approached in two steps. In the first stage, the increases were analyzed in statistical terms, i.e., percentage of the effective price paid/km, and the differences between the contract price and that actual price paid by the authorities for each lot in the 2015–2017 period. The second step is an analysis of the percentage increase of the price actually paid per kilometer from year-to-year using the cluster method to identify a discontinuity of data on the procedures for awarding public procurement contracts.
The result of the statistical analyses is presented in the Results section.
3. Results
3.1. Testing the Statistical Hypotheses
The first test was to verify whether there are statistically significant differences between the prices awarded in 2015–2016 and those from 2016–2017, calculated as price/km.
The statistical assumptions that were tested were as follows:
(there are no statistically significant differences between the 2015–2016 and 2016–2017 of the auctions in terms of the actual price paid per kilometer);
(there are statistically significant differences between the 2015–2016 and 2016–2017 auctions in terms of the price actually paid per kilometer).
Testing these statistical assumptions was performed using Student’s t-test. The results of this test are shown in Table 1.
From this table, it can be noticed that there are significant differences in bid data during the period 2015–2016 to the period 2016–2017 (t0.05,42 = −4.67, p-value = 0.000). This shows that the price paid per kilometer of removed snow has significantly increased between the two analyzed periods.
To test from a statistical point of view, the differences between the two periods, regarding the contract price per skimmed and the actual price paid, an analysis was made both for the period 2015–2016 and for 2016–2017.
The statistical assumptions that were tested were as follows:
(there are no statistically significant differences between the contract price per kilometer paid for the 2015–2016 or 2016–2017 bids)
(there are statistically significant differences between the contract price per kilometer paid for the 2015–2016 and 2016–2017 bids)
Testing of these statistical hypotheses was carried out by Student’s t-test. The results of this test are shown in Table 2.
The above table indicates that there are statistically significant differences between the contract price and the price actually paid for each kilometer of snow removed, both for the period 2015–2016 (t = 12.75, p-value = 0.000) and 2016–2017 (t = 15.71, p-value = 0.000).
It should be noted that for SDN 5, the contract for the period 2016–2017 was divided into smaller batches, and thus, the number of degrees of freedom (No. of contracts awarded—1) differs 2016–2017 (df = 49) compared to 2015 to 2016 (df = 42).
3.2. Cluster Analysis
An appropriate method to analyze market discontinuities on a given auction market is the statistical analysis of the bidding time series on that market (Hazak et al. 2016; Vadász et al. 2016).
An analytical method for detecting such behaviors is the cluster method, predominantly used when there is no a priori information on the existence of collusive behaviors (Caldiero et al. 2010). The first step is to divide auctions into two categories with significant differences between them. Thus, it is assumed that there are only two ways to bid—collusive and competitive—which means we are likely to have 2 clusters that differ significantly from each other.
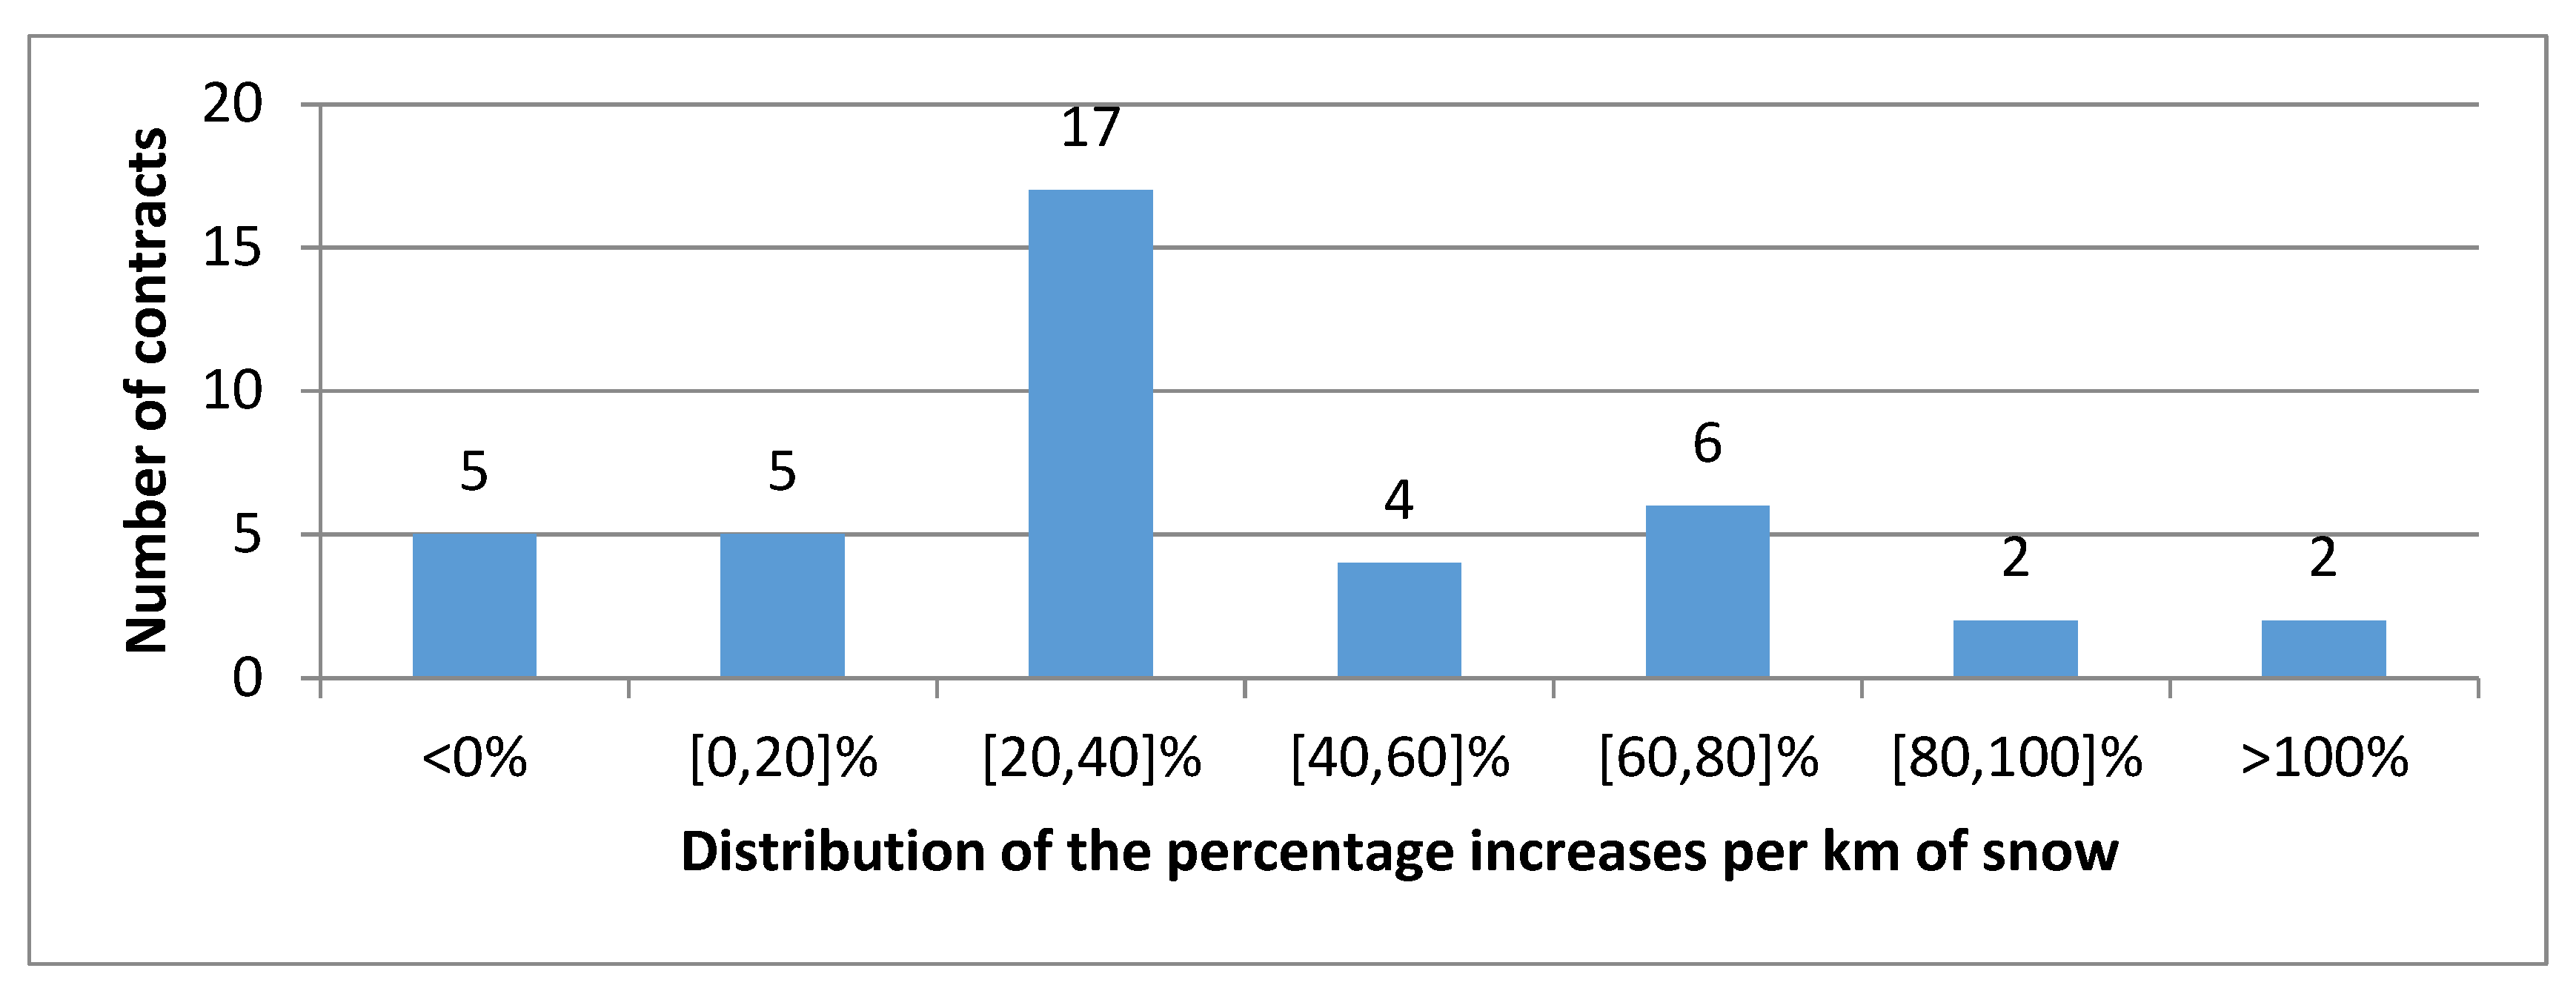
To carry out this analysis, we start with the calculation of the percentage increases between the prices which were actually paid by the contracting authority for snow removal kilometer in the analyzed period (see Figure 2).
From the chart above, we observe that most snow removal contracts have an increase of approximately 20–40%. Such (moderate) increases could be justified by the tightening of weather conditions in winter 2016–2017 compared to 2015–2016.
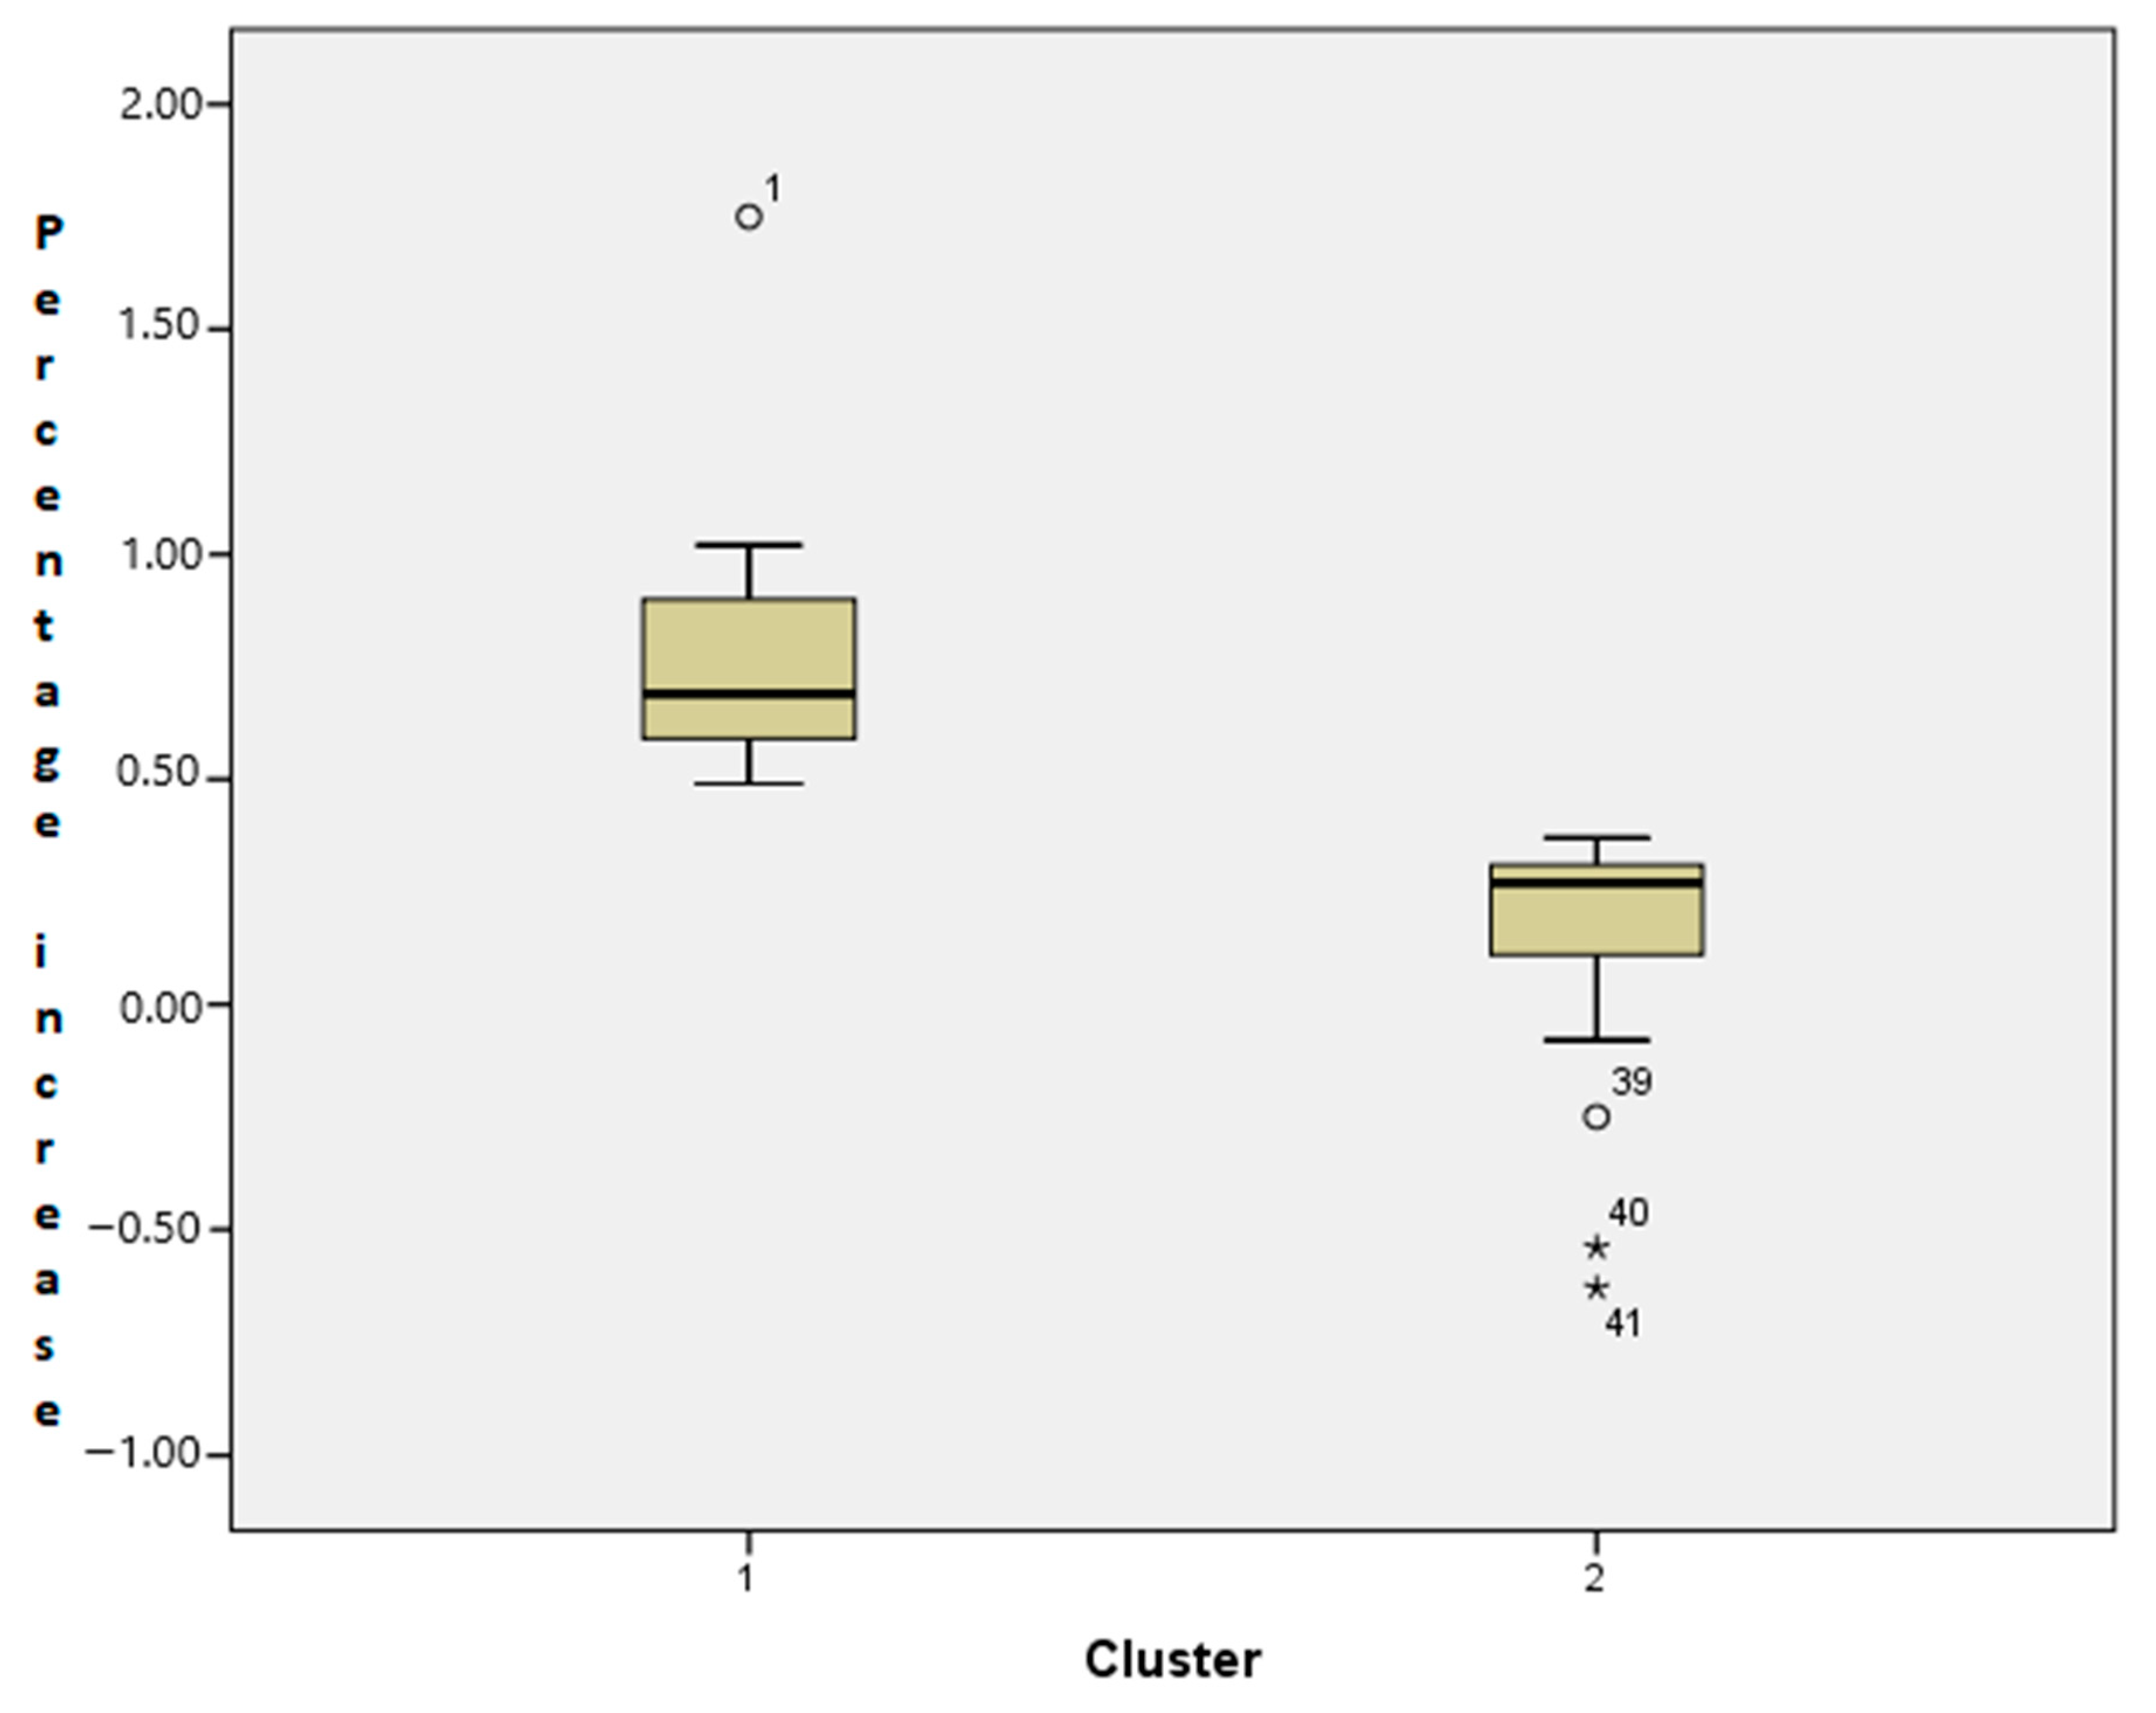
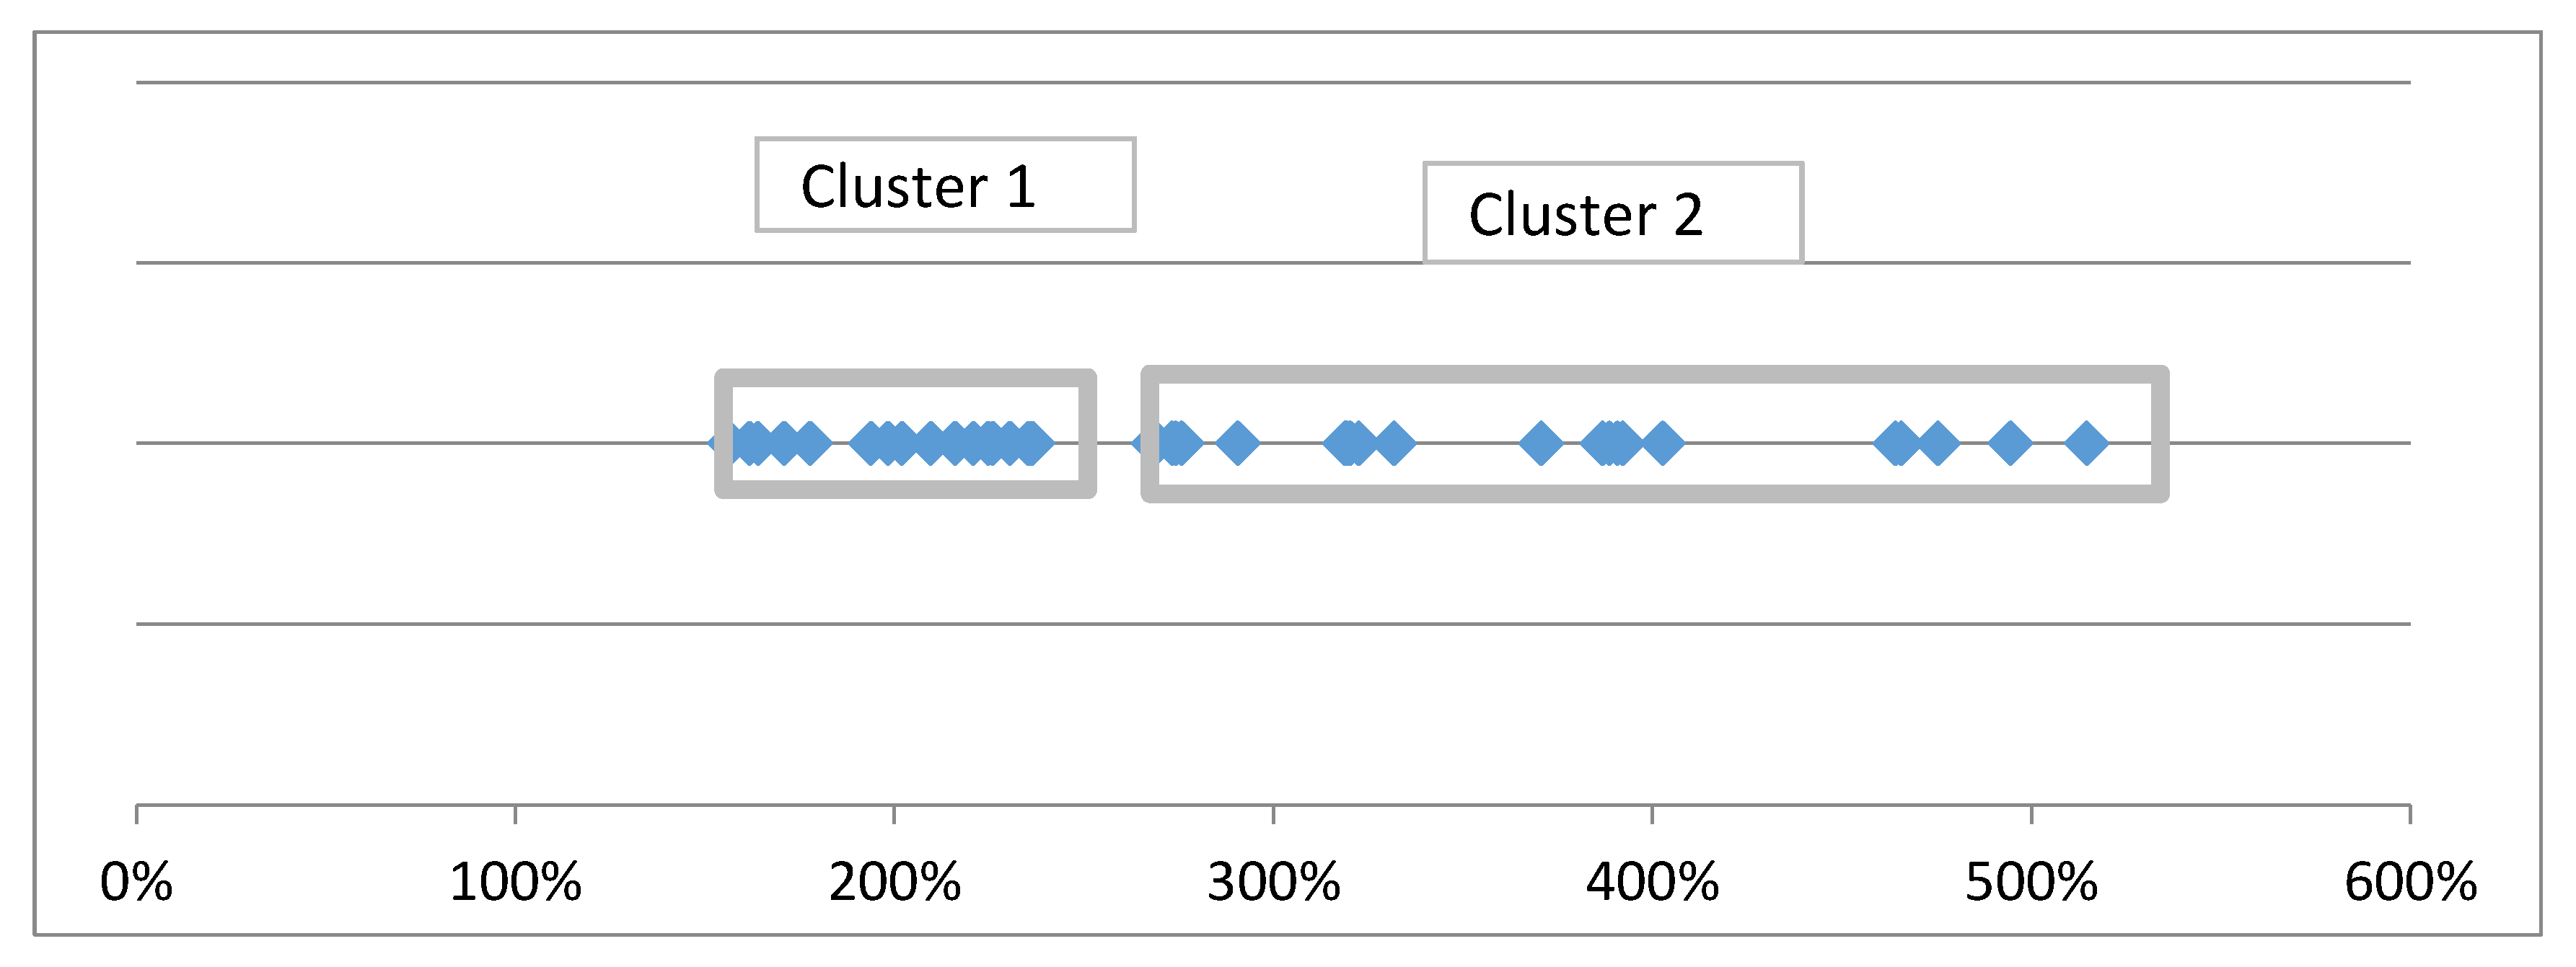
Detection of discontinuities in auction data is accomplished by dividing the data into two groups according to the percentage increase of the paid amount per snowy kilometer from the two time periods defined above. The first cluster contains those auctions for which the percentage increase is significant, while the second includes auctions for which this ratio is low or even negative (see Figure 3) (the bid price in 2016–2017 is lower than in 2015–2016).
A cluster analysis was performed in SPSS, splitting the auctions that took place in two clusters. This was done to test whether there is a group of auctions for which the percentage increases in contract values are substantially higher in 2016–2017 than in 2015–2016 (over 50%).
First, some data for which the analysis would have been distorted was removed. These correspond to certain changes in the contractual conditions in SDL county 3 and 4.
From this figure, it can be clearly seen, splitting into two clusters of auctions. The first cluster, located on the left side, includes 14 auctions (34% of the total) with high percentages previously defined, ranging from 50% to 126%. Thus, the price per kilometer of snow removal is significantly higher in the 2016–2017 period compared to 2015–2016. Moreover, the standard deviation of the data series on these prices is 0.32. Regarding the second cluster, comprising 27 auctions (13% of total auctions), the percentage increase was in this case from −63% to 37%. The value of the percentage increments for the second cluster has a much greater variation (the distribution normality test is done at the next step). A descriptive statistics of the two clusters could be seen in Table 3.
Now we apply the nonparametric test. To test whether the distribution of each cluster is normal, the Kolmogorov–Smirnov and Shapiro–Wilk tests were performed to test the normality of a series of data. This test was applied to each cluster, and the results can be seen in Table 4.
The conclusion of these tests is that the data of the first cluster is not normally distributed (Sig = 0.004 < 0.05, Sig = 0.001 < 0.05), while the data of the second cluster have a normal distribution (Sig = 0.200 > 0.05, Sig = 0.132 > 0.05). This indicates a discontinuity of data by the existence of a “gap” between the first and the second cluster. Auctions that correspond to the first cluster, those whose increase in the actual price paid in winter 2016–2017 compared to 2015–2016 was between 49% and 175%, would require a more in-depth analysis.
Now, we test the normality and symmetry. This step is closely related to the previous one. We tested the symmetry of the two distributions to check for differences between compared and theoretical models. In theory, the percentage increases due to collusive behaviors follow an asymmetric distribution, while the distribution of symmetric percentage increases is related to symmetric distributions. For this, we calculated the coefficient of symmetry (skewness) for the two clusters and the kurtosis of distribution. The results can be seen in Table 5.
From the table above, we observe that data from the first cluster is asymmetrical, meaning that this cluster auction tends to concentrate at the maximum value, which may correspond to a collusive behavior, while data at the second cluster has a symmetric distribution, corresponding to a possible non- affected auction.
3.3. Box-Plot Analysis
The data discontinuity described above can be noted in Figure A2 (Appendix A). The cluster analysis in SPSS 23 shows the following distribution in the two clusters (see Figure 4).
Normality tests for the two clusters can be seen in Table 6.
The conclusion of these tests is that the data of the first cluster are normally distributed (Sig = 0.000 < 0.05), while data for the second cluster do not have a normal distribution (Sig = 0.061 > 0.05—Test Shapiro–Wilk, Sig. = 0.073 > 0.05—Kolmogorov–Smirnov test). This confirms that the difference between the two clusters is statistically significant.
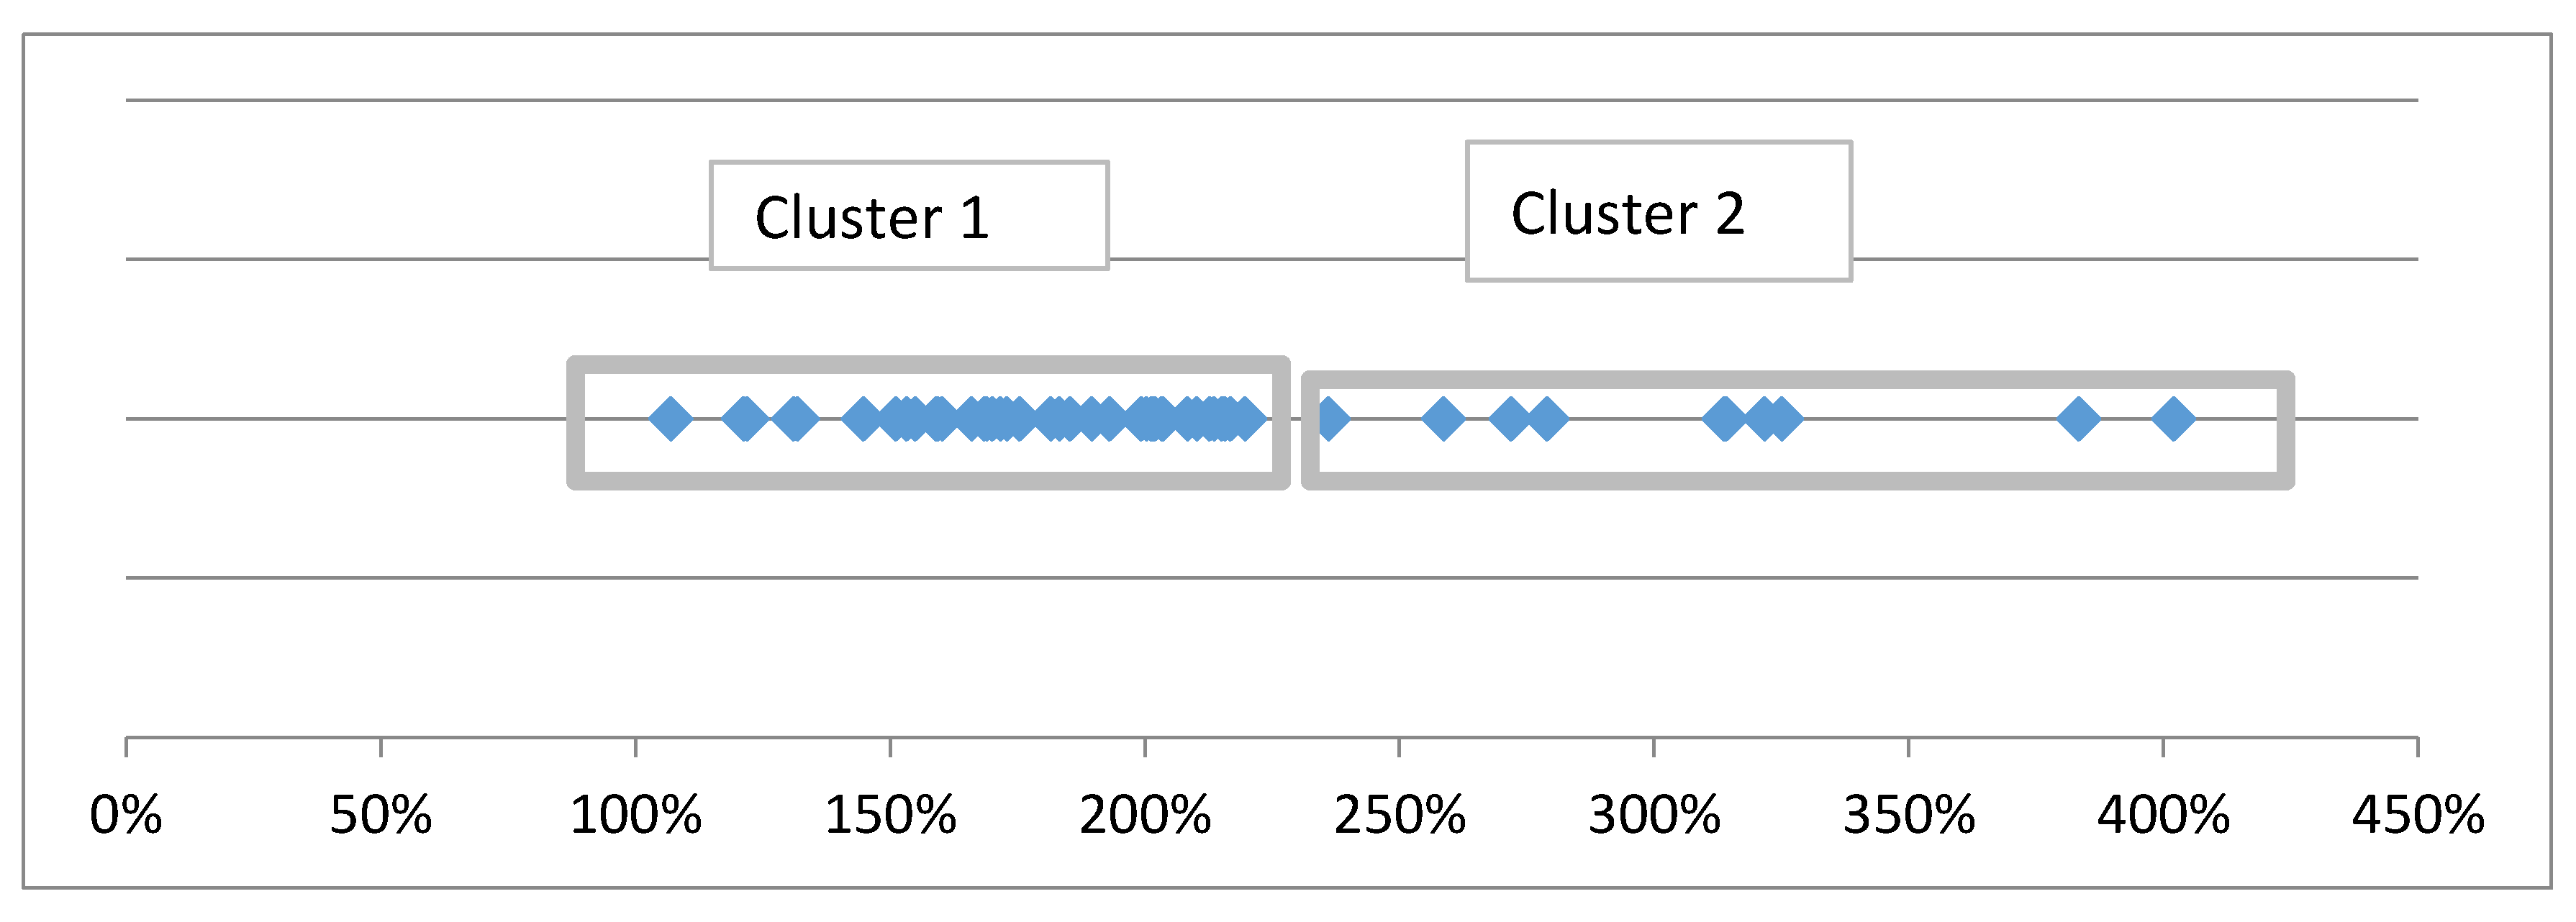
Now we focus on auctions for winter 2016–2017. The data discontinuity described above can be seen in Figure A3 (Appendix A). The cluster analysis in SPSS shows the next split between the two clusters (see Figure 5).
Normality tests for the two clusters can be seen in Table 7.
The conclusion of these tests is that the data for the second cluster are normally distributed (Sig. = 0.60 > 0.05—Shapiro–Wilk test, Sig = 0.200 > 0.05—Kolmogorov–Smirnov test) of the first cluster did not have a normal distribution (Sig. = 0.033 < 0.05—Shapiro–Wilk test; Sig. = 0.025 < 0.05—Kolmogorov–Smirnov test). This statistically confirms the discontinuity in data from the two clusters.
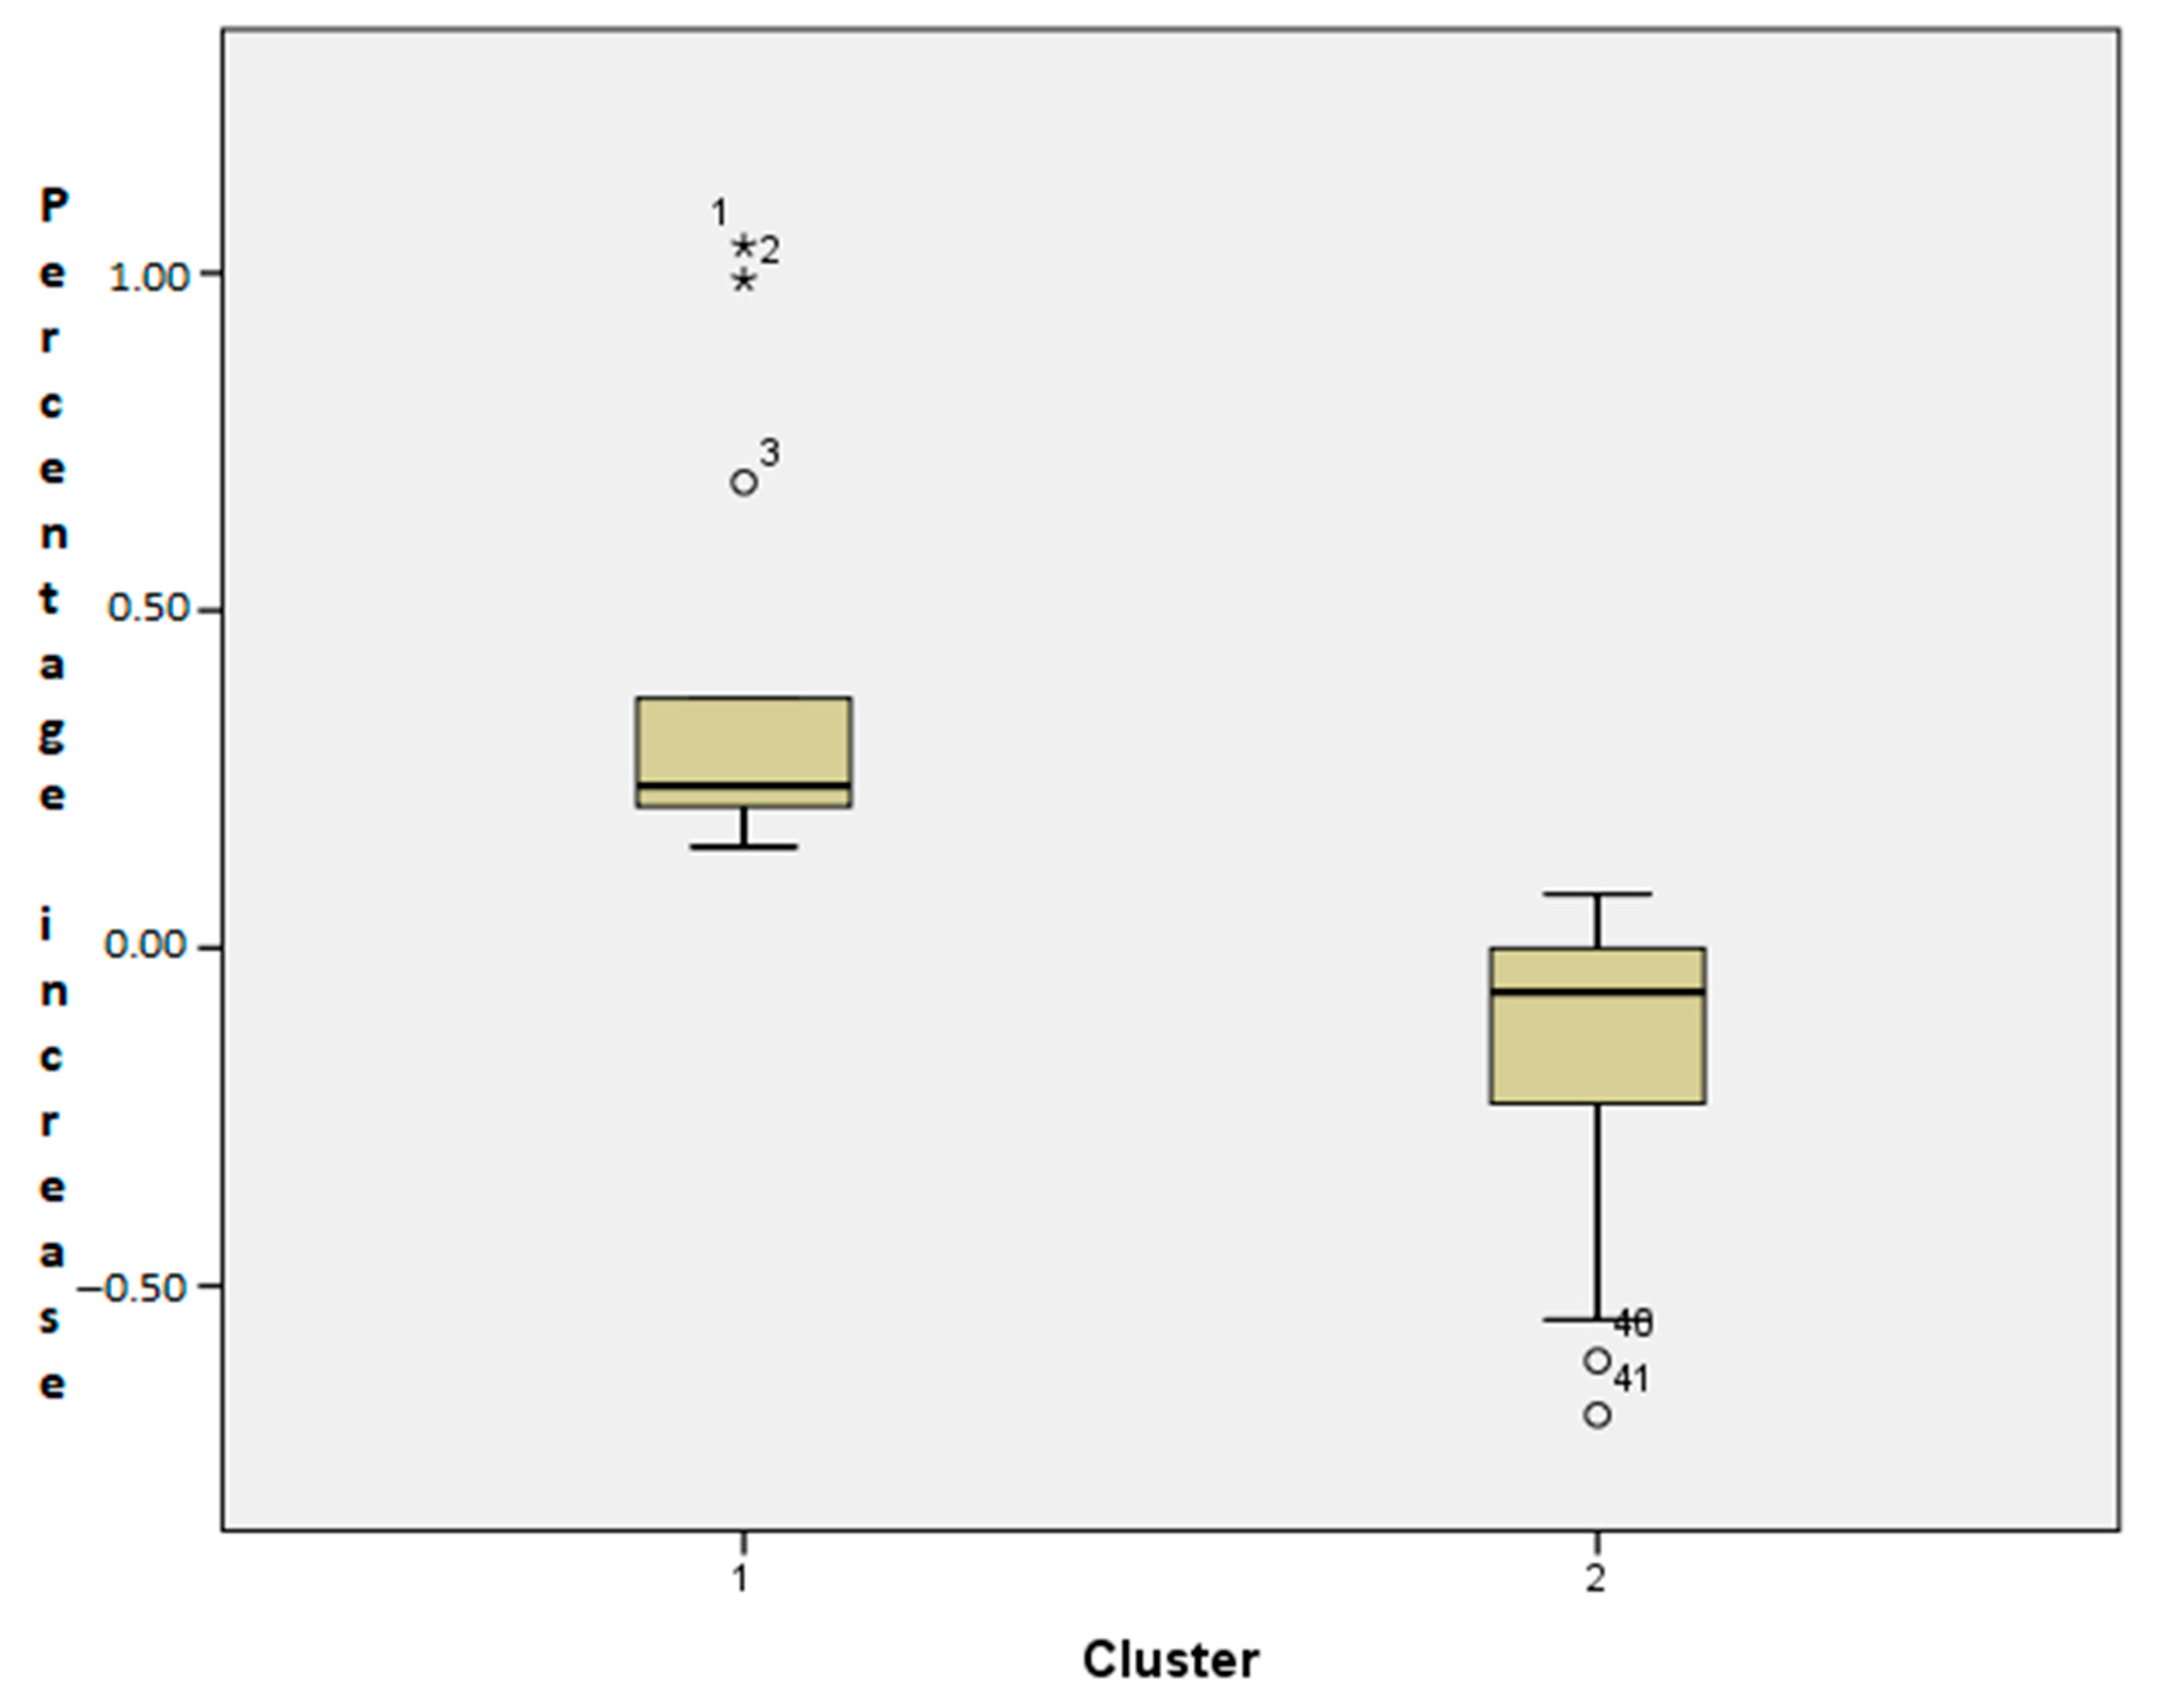
Now we perform a cluster analysis on the percentage increases between the price per contract kilometer in 2016–2017 compared to 2015–2016. The data discontinuity described above can be seen in Figure A4 (Appendix A). The cluster analysis in SPSS shows the next division in the two clusters (Figure 6).
Normality tests for the two clusters can be seen in Table 8.
The conclusion of these tests is that the data of the second cluster is normally distributed (Sig. = 0.096 > 0.05—Shapiro–Wilk test; Sig. = 0.062 > 0.05—Kolmogorov–Smirnov), while the of the first cluster do not have a normal distribution (Sig. = 0.000 < 0.05—Shapiro–Wilk test, Sig = 0.000 > 0.05—Kolmogorov–Smirnov test).
The statistical tests performed in this section are proving the existence of two types of bid-rigging during the analyzed period: competitive and anticompetitive.
4. Discussion of the Results
The existence of the two clusters indicates a certain “gap” or discontinuity in data. This discontinuity occurs at auctions where price growth is over 15% in 2016–2017 compared to 2015–2016. Most maintenance contracts for snow removal have a 20–40% increase in value in the 2016–2017 winter season compared to that of 2015–2016. Regarding the actual price paid per km of snow removal, the increases of percentages were set between 49% to 175% (in the analyzed period), which may not be economically reasonable.
From the cluster analysis on the percentage increases between the actual price and the contractual price per designated km in the two analyzed seasons (winter 2015–2016 and winter 2016–2017), it follows that there is a category of contracts with a normal (Gaussian) value and another category of contracts that do not follow such data distribution. This indicates that auctions in the second cluster could raise some suspicions about the organization/performance of these award procedures. The lots/SDNs in this category are found in Figure A2 of Appendix A.
We also note a discontinuity in the data as far as it concerns the contract prices per km of snow in the 2016–2017 season, compared to 2015–2016. This discontinuity appears in contracts whose value has increased by over 15% (with a maximum increase of 104%) (Figure A1 in Appendix A). This is a confirmation through the statistical analysis that there have been certain award procedures where the increase in the price paid per kilometer of snow can raise some suspicions about the organization/running of these award procedures. Lots/SDNs in this category can be found in Figure A1 and Figure A2 of Appendix A.
We may conclude, based on the testing of the statistical assumptions, that there was a significant difference between the contractual price and the actual per km of snow, both for the winter 2015–2016 and for winter 2016–2017 (Table 2). In addition, there are significant differences in terms of both statistics and in terms of the actual price paid per km over the 2016–2017 season compared to 2015–2016 (Figure A3 and Figure A4 from Appendix A). These results show that we may be in the presence of an anticompetitive practice/agreement/bid-rigging regarding the results of the procedures for the snow removal auctions for the period 2016–2017.
The econometric analyses used in our study (Section 3.1, Section 3.2 and Section 3.3) supported the findings of a cartel agreement. Cluster analysis, statistical hypothesis, normality and symmetry and nonparametric tests reveal two types of auctions during the analyzed period: competitive and noncompetitive bids.
5. Conclusions
This scientific research confirms the need to pay maximum attention to the procurement problem, for the reasons we referred to in the paper, in line with our wide review of the specialized literature. Incidentally, a clear institutional framework was adopted at the EU level, containing norms meant to bring significant improvements to the above-mentioned plan, which were predominantly transposed at the Member State level. However, as we have found by studying the reports of the relevant institutions, the margins of expectation are still high regarding the actual achievements. Second, when we discuss the issues related to the elaboration and implementation of national legal instruments aimed at stimulating public procurement, we come up with a whole series of critical issues. In a nutshell, we find that these instruments have not demonstrated enough efficiency in stimulating green procurement in the public sector.
The statistical analyses underline the high probability of stating for prerequisites for alleged anticompetitive agreements between the undertakings which participated in public procurement auctions in the analyzed period.
The analytical methods for detecting anticompetitive behaviors are often used by worldwide competition authorities in dealing with anticompetitive cases. The enterprises could claim compensation whenever they have been harmed by the existence of a cartel on their operational market. The use of analytical methods based on statistical data could be a method for observing certain anticompetitive behaviors on the market. By utilizing these methods, we are not able to directly prove the collusive behavior of the analyzed enterprises, but we could highlight the improbable results, which would require more careful attention. These methods aim primarily to avoid false-positive and false-negative results. A false-positive result states that there is an anticompetitive agreement on a given market, although it does not actually exist. False-negative results are those which state that there is not an anticompetitive agreement on a certain market, although this cartel really exists. Moreover, the use of these analytical methods: should have empirical support, be easily applied and not too costly to implement.
There is a limitation of this study, which comes from the fact that only five regions are analyzed, and therefore further research should be extended to other regions. Another limitation of the research could be related to the fact that the number of companies that can provide the service object of the contract was slightly different between the two analyzed periods. Thus, further research should focus on other similar analyses to other types of bid-rigging in public procurements.
Author Contributions
Conceptualization, M.B.; Data curation, M.B.; Formal analysis, M.B.; Funding acquisition, C.B.; Methodology, M.B.; Project administration, C.B. and M.B.; Resources, C.B.; Software, M.B.; Supervision, C.B.; Validation, C.B. and M.B.; Writing—original draft, M.B.; Writing—review & editing, C.B. All authors have read and agreed to the published version of the manuscript.
Funding
This research received no external funding.
Institutional Review Board Statement
Not applicable.
Informed Consent Statement
Not applicable.
Data Availability Statement
The data presented in this study are available within the article.
Conflicts of Interest
The authors declare no conflict of interest.
Appendix A
Figure A1.
Percentage increase in actual prices paid 2016–2017 compared to 2015–2016.

Figure A2.
Percentage increase in estimated prices per kilometer in 2015–2016 compared to prices actually paid.
Figure A2.
Percentage increase in estimated prices per kilometer in 2015–2016 compared to prices actually paid.

Figure A3.
Percentage increase in estimated prices per kilometer of snow in 2016–2017 compared to prices actually paid.
Figure A3.
Percentage increase in estimated prices per kilometer of snow in 2016–2017 compared to prices actually paid.

Figure A4.
Percentage increase in estimated prices per kilometer of snow in 2016–2017 as compared to 2015–2016.
Figure A4.
Percentage increase in estimated prices per kilometer of snow in 2016–2017 as compared to 2015–2016.

References
- Abrantes-Metz, Rosa M., Michael Kraten, Albert D. Metz, and Gim S. Seow. 2012. Libor manipulation? Journal of Banking & Finance 36: 136–50. [Google Scholar]
- Andrei, Florin, and Mihail Busu. 2014. Detecting cartels through analytical methods. Romanian Competition Journal 24. Available online: https://0-heinonline-org.brum.beds.ac.uk/HOL/LandingPage?handle=hein.journals/rocmpj2014&div=7&id=&page= (accessed on 15 December 2020).
- Arnould, Joel. 2004. Secondary policies in public procurement: The innovations of the new directives. Public Procurement Law Review 13: 187–97. [Google Scholar]
- Arrowsmith, Sue, and Peter Kunzlik, eds. 2009. Social and Environmental Policies in EC Procurement Law: New Directives and New Directions. Cambridge: Cambridge University Press. [Google Scholar]
- Banerjee, Priyodorshi, Shashwat Khare, and Priyodorshi Srikant. 2018. Learning to Set the Reserve Price Optimally in Laboratory First Price Auctions. Games 9: 79. [Google Scholar] [CrossRef] [Green Version]
- Blume, Andreas, and Paul Heidhues. 2006. Private monitoring in auctions. Journal of Economic Theory 131: 179–211. [Google Scholar] [CrossRef] [Green Version]
- Bolotova, Yuliya, John M. Connor, and Douglas J. Miller. 2008. The impact of collusion on price behavior: Empirical results from two recent cases. International Journal of Industrial Organization 26: 1290–307. [Google Scholar] [CrossRef] [Green Version]
- Buşu, Mihail. 2012. An economic analysis on the degree of market concentration: Competition Indicators. Paper presented at 6th International Management Conference, Bucharest, Romania, November 15–16; pp. 529–37. [Google Scholar]
- Caldiero, Christopher, Maureen Taylor, and Lia Ungureanu. 2010. Organizational and media use of technology during fraud crises. The Handbook of Crisis Communication, 396–409. [Google Scholar] [CrossRef]
- Caranta, Roberto. 2016. Public procurement and award criteria. In Research Handbook on EU Public Procurement Law. Cheltenham: Edward Elgar Publishing. [Google Scholar]
- Caranta, Roberto, Gunilla Edelstam, and Martin Trybus, eds. 2013. EU Public Contract Law: Public Procurement and Beyond. Bruxelles: Primento. [Google Scholar]
- Carayannis, Elias G., and Denisa Popescu. 2005. Profiling a methodology for economic growth and convergence: Learning from the EU e-procurement experience for central and eastern European countries. Technovation 25: 1–15. [Google Scholar] [CrossRef]
- Clancy, Timothy. 2018. Application of Emerging-State Actor Theory: Analysis of Intervention and Containment Policies. Systems 6: 17. [Google Scholar] [CrossRef] [Green Version]
- Comba, Mario E. 2010. XI. Green and Social Considerations in Public Procurement Contracts: A Comparative Approach. The Law of Green and Social Procurement in Europe. 2: 299–319. [Google Scholar]
- Commander, Simon, and Mark Schankerman. 1997. Enterprise restructuring and social benefits. Economics of Transition 5: 1–24. [Google Scholar] [CrossRef]
- Connor, John M. 2001. Global Price Fixing our Customers are the Enemy. Norwell: Kluwer Academic Publishers. [Google Scholar]
- Global Trade Negotiations. 2006. Available online: https://stateinnovation.org/ (accessed on 30 March 2020).
- Government of Romania. 2006. Ordonanța de Urgență No. 34 Privind Atribuirea Contractelor de Achiziţie Publică; Bucharest: Government of Romania.
- Government of Romania. 2008. Hotărârea No. 1460 Pentru Aprobarea Strategiei Naţionale Pentru Dezvoltare Durabilă—Orizonturi 2013-20-2030; Bucharest: Guvernul României.
- Government of Romania. 2014. Expunere de Motive la Legea Privind Achiziţiile Publice Verzi. Available online: http://mmediu.ro/new/wp-content/uploads/2014/08/2014- 08-26_Expun_motiv_Lege-APV.pdf (accessed on 12 January 2021).
- Harrington, Joseph. 2005. Detecting Cartels, Advances in the Economics of Competition Law. Baltimore: Department of Economics, Johns Hopkins University. [Google Scholar]
- Hazak, Aaro, Tanel Kerikmäe, and Evelin Pärn-Lee. 2016. Efficiency and Bid Rigging in Simultaneous Procurement Auctions under an Oligopoly. International Journal of Procurement Management 13: 199–213. [Google Scholar] [CrossRef]
- Howard, Jeffrey H., and David Kaserman. 1989. Proof of damages in construction industry bid-rigging cases. Antitrust Bull 34: 359. [Google Scholar]
- Imhof, David, Yavuz Karagök, and Samuel Rutz. 2018. Screening For Bid Rigging—Does It Work? Journal of Competition Law & Economics 14: 235–61. [Google Scholar]
- İriş, Doruk, and Luís Santos-Pinto. 2013. Tacit collusion under fairness and reciprocity. Games 4: 50–65. [Google Scholar] [CrossRef] [Green Version]
- Kim, Eunji, Yoonhee Ha, and Sangheon Kim. 2017. Public Debt, Corruption and Sustainable Economic Growth. Sustainability 9: 433. [Google Scholar] [CrossRef] [Green Version]
- Kunzlik, Peter, and Sue Arrowsmith. 2009. Public Procurement & Horizontal Policies in EC Law–General Principles. Cambridge: Cambridge University Press. [Google Scholar]
- Liao, Shu-Hsien, Ching-Hsue Cheng, Wei-Bang Liao, and I-Liang Chen. 2003. A web-based architecture for implementing electronic procurement in military organizations. Technovation 23: 521–32. [Google Scholar] [CrossRef]
- Marshall, Robert C., and Leslie M. Marx. 2007. Bidder collusion. Journal of Economic Theory 133: 374–402. [Google Scholar] [CrossRef]
- McAfee, R. Preston, and John McMillan. 1992. Bidding rings. American Economic Review 82: 579–99. [Google Scholar]
- McMillan, John. 1991. Dango: JAPAN’S price-fixing conspiracies. Economics & Politics 3: 201–18. [Google Scholar]
- Menezes, Flavio M., and Paulo Klinger Monteiro. 2006. Corruption and auctions. Journal of Mathematical Economics 42: 97–108. [Google Scholar] [CrossRef]
- Olaussen, Jon Olaf, Are Oust, and Ole Jakob Sønstebø. 2018. Bidding Behavior in the Housing Market under Different Market Regimes. Journal of Risk and Financial Management 11: 41. [Google Scholar] [CrossRef] [Green Version]
- Otamendi, F. Javier, Isabelle Brocas, and Juan D. Carrillo. 2018. Sequential auctions with capacity constraints: An experimental investigation. Games 9: 15. [Google Scholar] [CrossRef] [Green Version]
- Parliament of Romania. 2016. Law No. 69 on Public Procurement. Available online: http://www.mmediu.ro/app/webroot/uploads/files/2016-08-04_LEGE_Nr_69_din_ 2016.pdf (accessed on 5 July 2019).
- Pesendorfer, Martin. 2000. A study of collusion in first-price auctions. Review of Economic Studies 67: 381–411. [Google Scholar] [CrossRef] [Green Version]
- Porrini, Donatella. 2015. Risk classification efficiency and the insurance market regulation. Risks 3: 445–54. [Google Scholar] [CrossRef]
- Porter, Robert H. 2005. Detecting collusion. Review of Industrial Organization 26: 147–67. [Google Scholar] [CrossRef]
- Previtali, Pietro, and Paola Cerchiello. 2018. The Prevention of Corruption as an Unavoidable Way to Ensure Healthcare System Sustainability. Sustainability 10: 3071. [Google Scholar] [CrossRef] [Green Version]
- Smith, Anthony A., Jr. 1993. Estimating nonlinear time-series models using simulated vector autoregressions. Journal of Applied Econometrics 8: S63–S84. [Google Scholar] [CrossRef] [Green Version]
- Stempel, Peter, Isaac Ginis, David Ullman, Austin Becker, and Robert Witkop. 2018. Real-Time Chronological Hazard Impact Modeling. Journal of Marine Science and Engineering 6: 134. [Google Scholar] [CrossRef] [Green Version]
- Tenorio, Rafael. 1993. Revenue equivalence and bidding behavior in a multi-unit auction market: An empirical analysis. The Review of Economics and Statistics 75: 302–14. [Google Scholar] [CrossRef]
- Vadász, Pál, András Benczúr, Géza Füzesi, and Sándor Munk. 2016. Identifying Illegal Cartel Activities from Open Sources. In Open Source Intelligence Investigation. Cham: Springer, pp. 251–73. [Google Scholar]
- Zona, John Douglas. 1986. Bid-Rigging and the Competitive Bidding Process: Theory and Evidence. Ph.D. dissertation, State University of New York at Stony Brook, New York, NY, USA. [Google Scholar]
Figure 1.
Comparison between contractual price and effective price per kilometer, in euro, during 2015–2016 and 2016–2017. Source: own processing using Statistical Package for the Social Sciences (SPSS) 23 software.
Figure 1.
Comparison between contractual price and effective price per kilometer, in euro, during 2015–2016 and 2016–2017. Source: own processing using Statistical Package for the Social Sciences (SPSS) 23 software.

Figure 2.
Distribution of the percentage increases per km of snow, 2016–2017 compared to 2015–2016 (actual price paid). Source: own processing using SPSS 23 software.
Figure 2.
Distribution of the percentage increases per km of snow, 2016–2017 compared to 2015–2016 (actual price paid). Source: own processing using SPSS 23 software.

Figure 3.
Box-plot cluster. Source: own processing using SPSS software.

Figure 4.
Box-plot cluster. Source: own processing data in SPSS 23.

Figure 5.
Box-plot cluster. Source: own processing data in SPSS 23.

Figure 6.
Box-plot cluster. Source: own processing using SPSS software.


Table 1.
Paired test.
| Mean | Std. Dev. | Std. Error Mean | 95% Confidence Interval of the Difference | t | df | Sig. | ||
|---|---|---|---|---|---|---|---|---|
| Lower | Upper | |||||||
| 2015–2016 vs. 2016–2017 | −2839.8 | 3988.25 | 608.2 | −4067.26 | −1612.5 | −4.67 | 42 | 0 |
Source: own processing using Statistical Package for the Social Sciences (SPSS) 23 software.
Table 2.
Paired sample test.
| Mean | Std. Dev. | Std. Error Mean | 95% Confidence Interval of the Difference | t | df | Sig. | ||
|---|---|---|---|---|---|---|---|---|
| Lower | Upper | |||||||
| Estimate_2015–Effective_2016 | 16,757.86 | 8621.47 | 1314.76 | 14,104.56 | 19,411.16 | 12.75 | 42 | 0.000 |
| Estimate_2016–Effectiv_2017 | 10,746.66 | 4838.09 | 684.21 | 9371.69 | 12,121.63 | 15.71 | 49 | 0.000 |
Source: own processing using Statistical Package for the Social Sciences (SPSS) 23 software.
Table 3.
Descriptive statistics.
| N | Range | Minimum | Maximum | Mean | St. Dev. | |
|---|---|---|---|---|---|---|
| Cluster 1 | 14 | 1.26 | 0.49 | 1.75 | 0.7736 | 0.3227 |
| Cluster 2 | 27 | 1 | −0.63 | 0.37 | 0.1526 | 0.26107 |
Source: own processing using SPSS 23 software.
Table 4.
Test of normality.
| Kolmogorov–Smirnov a | Shapiro–Wilk | |||||
|---|---|---|---|---|---|---|
| Statistic | df | Sig. | Statistic | df | Sig. | |
| Cluster1 | 0.28 | 14 | 0.004 | 0.741 | 14 | 0.001 |
| Cluster2 | 0.156 | 14 | 0.2 | 0.905 | 14 | 0.132 |
a Lilliefors significance correction.
Table 5.
Descriptive statistics.
| Skewness | Kurtosis | |||
|---|---|---|---|---|
| Statistic | Std. Error | Statistic | Std. Error | |
| Cluster 1 | 2.365 | 0.597 | 6.655 | 1.154 |
| Cluster 2 | −1.95 | 0.448 | 3.384 | 0.872 |
Source: own processing using SPSS 23 software.
Table 6.
Test of normality.
| Kolmogorov–Smirnov a | Shapiro–Wilk | |||||
|---|---|---|---|---|---|---|
| Statistic | df | Sig. | Statistic | df | Sig. | |
| Cluster 1 | 0.145 | 17 | 0.00 | 0.897 | 17 | 0.00 |
| Cluster 2 | 0.198 | 25 | 0.07 | 0.791 | 25 | 0.06 |
a Lilieforce significance correction. Source: own computation in SPSS 23.
Table 7.
Test of Normality.
| Kolmogorov–Smirnov a | Shapiro–Wilk | |||||
|---|---|---|---|---|---|---|
| Statistic | df | Sig. | Statistic | df | Sig. | |
| Cluster 1 | 0.15 | 40 | 0.025 | 0.939 | 40 | 0.033 |
| Cluster 2 | 0.192 | 10 | 0.200 | 0.945 | 10 | 0.606 |
a Lilieforce significance correction. Source: own processing using SPSS 23 software.
Table 8.
Test of Normality.
| Kolmogorov–Smirnov a | Shapiro–Wilk | |||||
|---|---|---|---|---|---|---|
| Statistic | df | Sig. | Statistic | df | Sig. | |
| Cluster 1 | 0.234 | 28 | 0.000 | 0.834 | 28 | 0.000 |
| Cluster 2 | 0.305 | 13 | 0.062 | 0.744 | 13 | 0.096 |
a This is a lower bound of the true significance. Lilieforce significance correction. Source: own computation in SPSS.
Publisher’s Note: MDPI stays neutral with regard to jurisdictional claims in published maps and institutional affiliations. |
© 2021 by the authors. Licensee MDPI, Basel, Switzerland. This article is an open access article distributed under the terms and conditions of the Creative Commons Attribution (CC BY) license (http://creativecommons.org/licenses/by/4.0/).
Share and Cite
MDPI and ACS Style
Busu, M.; Busu, C. Detecting Bid-Rigging in Public Procurement. A Cluster Analysis Approach. Adm. Sci. 2021, 11, 13. https://0-doi-org.brum.beds.ac.uk/10.3390/admsci11010013
AMA Style
Busu M, Busu C. Detecting Bid-Rigging in Public Procurement. A Cluster Analysis Approach. Administrative Sciences. 2021; 11(1):13. https://0-doi-org.brum.beds.ac.uk/10.3390/admsci11010013
Chicago/Turabian StyleBusu, Mihail, and Cristian Busu. 2021. "Detecting Bid-Rigging in Public Procurement. A Cluster Analysis Approach" Administrative Sciences 11, no. 1: 13. https://0-doi-org.brum.beds.ac.uk/10.3390/admsci11010013
Note that from the first issue of 2016, this journal uses article numbers instead of page numbers. See further details here.