Article

Deep Learning-Based Template Matching Spike Classification for Extracellular Recordings

1
School of Electrical and Electronic Engineering, Yonsei University, Seoul 03722, Korea
2
Department of Medical Science, College of Medicine, Catholic Kwandong University, Gangneung 25601, Korea
3
Translational Brain Research Center, Catholic Kwandong University, International St. Mary’s Hospital, Incheon 22711, Korea
4
Department of Neuroscience, University of Science & Technology, Daejeon 34113, Korea
5
Center for Neuroscience, Korea Institute of Science and Technology, Seoul 02792, Korea
*
Author to whom correspondence should be addressed.
Equally contributing authors.
Submission received: 12 November 2019 / Revised: 20 December 2019 / Accepted: 30 December 2019 / Published: 31 December 2019
(This article belongs to the Section Applied Biosciences and Bioengineering)

Abstract

:
We propose a deep learning-based spike sorting method for extracellular recordings. For analysis of extracellular single unit activity, the process of detecting and classifying action potentials called “spike sorting” has become essential. This is achieved through distinguishing the morphological differences of the spikes from each neuron, which arises from the differences of the surrounding environment and characteristics of the neurons. However, cases of high structural similarity and noise make the task difficult. And for manual spike sorting, it requires professional knowledge along with extensive time cost and suffers from human bias. We propose a deep learning-based spike sorting method on extracellular recordings from a single electrode that is efficient, robust to noise, and accurate. In circumstances where labelled data does not exist, we created pseudo-labels through principal component analysis and K-means clustering to be used for multi-layer perceptron training and built high performing spike classification model. When tested, our model outperformed conventional methods by 2.1% on simulation data of various noise levels, by 6.0% on simulation data of various clusters count, and by 1.7% on in-vivo data. As a result, we showed that the deep learning-based classification can classify spikes from extracellular recordings, even showing high classification accuracy on spikes that are difficult even for manual classification.

1. Introduction

Much of neuroscience studies require the analysis of extracellular recordings which is a measurement of neuronal activities. It measures neural signals under various behaviors through microelectrodes inserted into the brain tissue. When obtaining such extracellular recordings, neuronal activities from multiple neurons surrounding each of the microelectrodes are simultaneously recorded. These neurons each show distinct waveform shape of action potential that we call “spikes” depending their morphology, distance from the electrode, intrinsic membrane properties, and the surrounding environment [1,2,3,4]. It is important to match the spikes to the corresponding neurons, i.e., spike sorting. The spike sorting procedure is composed of spike detection which filters out noise from the extracellular recordings and sample spike signals, feature extraction which increases efficacy of classification, and lastly classification of the feature domain data. When processed manually, this procedure is costly, not only requiring professional knowledge but also extensive amounts of time. To reduce such cost, various semi-automatic and fully-automatic spike sorting methods are being developed [5,6,7,8], however the show unsatisfactory efficiency and accuracy [9]. With increasing recording periods, and the number of spikes associated with this, the risk of subjective factors and cost also increases [8,10,11]. Moreover, when large numbers of spikes are mapped on the feature domain simultaneously, the boundary between clusters becomes unclear for proper classification, and as a result, much of the signal data are thrown away [12].
A classic spike sorting method derived to resolve the abovementioned problems is template matching where first spike templates that represent each neuron and classify each spike according to the similarity between the spike templates is created [13]. A widely used template-making technique is where aligned spikes are first mapped to the feature domain through feature extraction, such as principal component analysis (PCA) [14], and clustered center spikes obtained from clustering techniques, such as k-means clustering [15], are extracted as templates [16,17]. The similarities between each spike and the template spikes are typically measured by the Euclidean distance [18,19] and the cross-correlation coefficient [20,21] between them. Although various studies have reported the classification of spikes according to their shapes and amplitudes, there is as of yet no survey that decides which of them is the most optimal technique [12]. Moreover, the performance of template matching depends heavily on the creation of the templates and generally requires manual intervention and adjustment [9].
Recently, deep learning-based algorithms have shown their efficiency in numerous fields and tasks, especially in classification. Starting with the year 2012 award winning AlexNet [22] from ILSVRC’s ImageNet, deep learning-based methods have shown high performance in cases of large 1-dimensional and 2-dimensional data analysis and classification [23]. Its application in the field of neural signal analysis can also be seen. SpikeDeeptector uses deep learning to classify spike signals from artifacts [24], and Melinda et al. proposed a supervised deep learning model that uses Convolution neural network and long short-term memory to classify the different action potentials on microelectrode array (MEA) recordings [25]. In this paper, we propose an efficient unsupervised deep learning spike sorting model where manual labeling is not required and show that it can address the problems and the limitations of previous template matching methods. When tested on extracellular recordings from a single electrode, our deep learning model shows higher accuracy compared to the previous template matching methods. The preliminary study for this research has been partially presented in annual meeting of International Brain Research Organization in 2019 [26].

2. Materials and Methods

2.1. Dataset

We used two publicly available simulated spike signal datasets and an in-vivo spike signal dataset for our study. First, by using the simulated spike signals where each spike is labeled, we will present the accuracy of the tested models, and through testing on the in-vivo dataset, we will show the applicability of the models in real life applications. Dataset 1 is a simulated dataset provided from University of Leicester that is widely used in spike signal research [12,27,28]. The dataset was generated at sampling rate of 24 kHz. It is composed of four subset data named Easy1, Easy2, Difficult1, and Difficult2. Each subset data contains spikes from three different neuron types under four conditions of noise levels, 0.05, 0.10, 0.15, and 0.20, where the numbers represent the standard deviation of noise. Spikes are detected by setting a threshold value of 4 σ n where action potentials values above the threshold are considered as spikes. σ n is obtained as follows:
σ n = median { | x | 0.6745 }
The dataset is publicly available at https://www2.le.ac.uk/departments/engineering/research/bioengineering/neuroengineering-lab/spike-sorting. Dataset 2 is a simulation data containing various number of neural signal types [29]. This was recorded at a sampling rate of 24 kHz, and threshold value was set to 5 σ n . For our experiment, five datasets each for different numbers of clusters (2~5) were selected. Dataset 2 is publicly available at https://www135.lamp.le.ac.uk/hgr3/. The in-vivo dataset was acquired from the cortex of a mouse using a tetrode. Neural activities were amplified (×10,000), filtered (600 Hz–6 kHz), and digitized (30.3 KHz) using Digital Lynx (Neuralynx, Bozeman, MT, USA) [30,31,32]. Single units were manually isolated from trained expert using SpikeSort 3D (Neuralynx) and cluster quality was assessed by L-ratio, isolation distance, cross-correlation, and inter-spike interval (ISI) [33]. Single channel recordings from the tetrode recordings were used for our experiment.

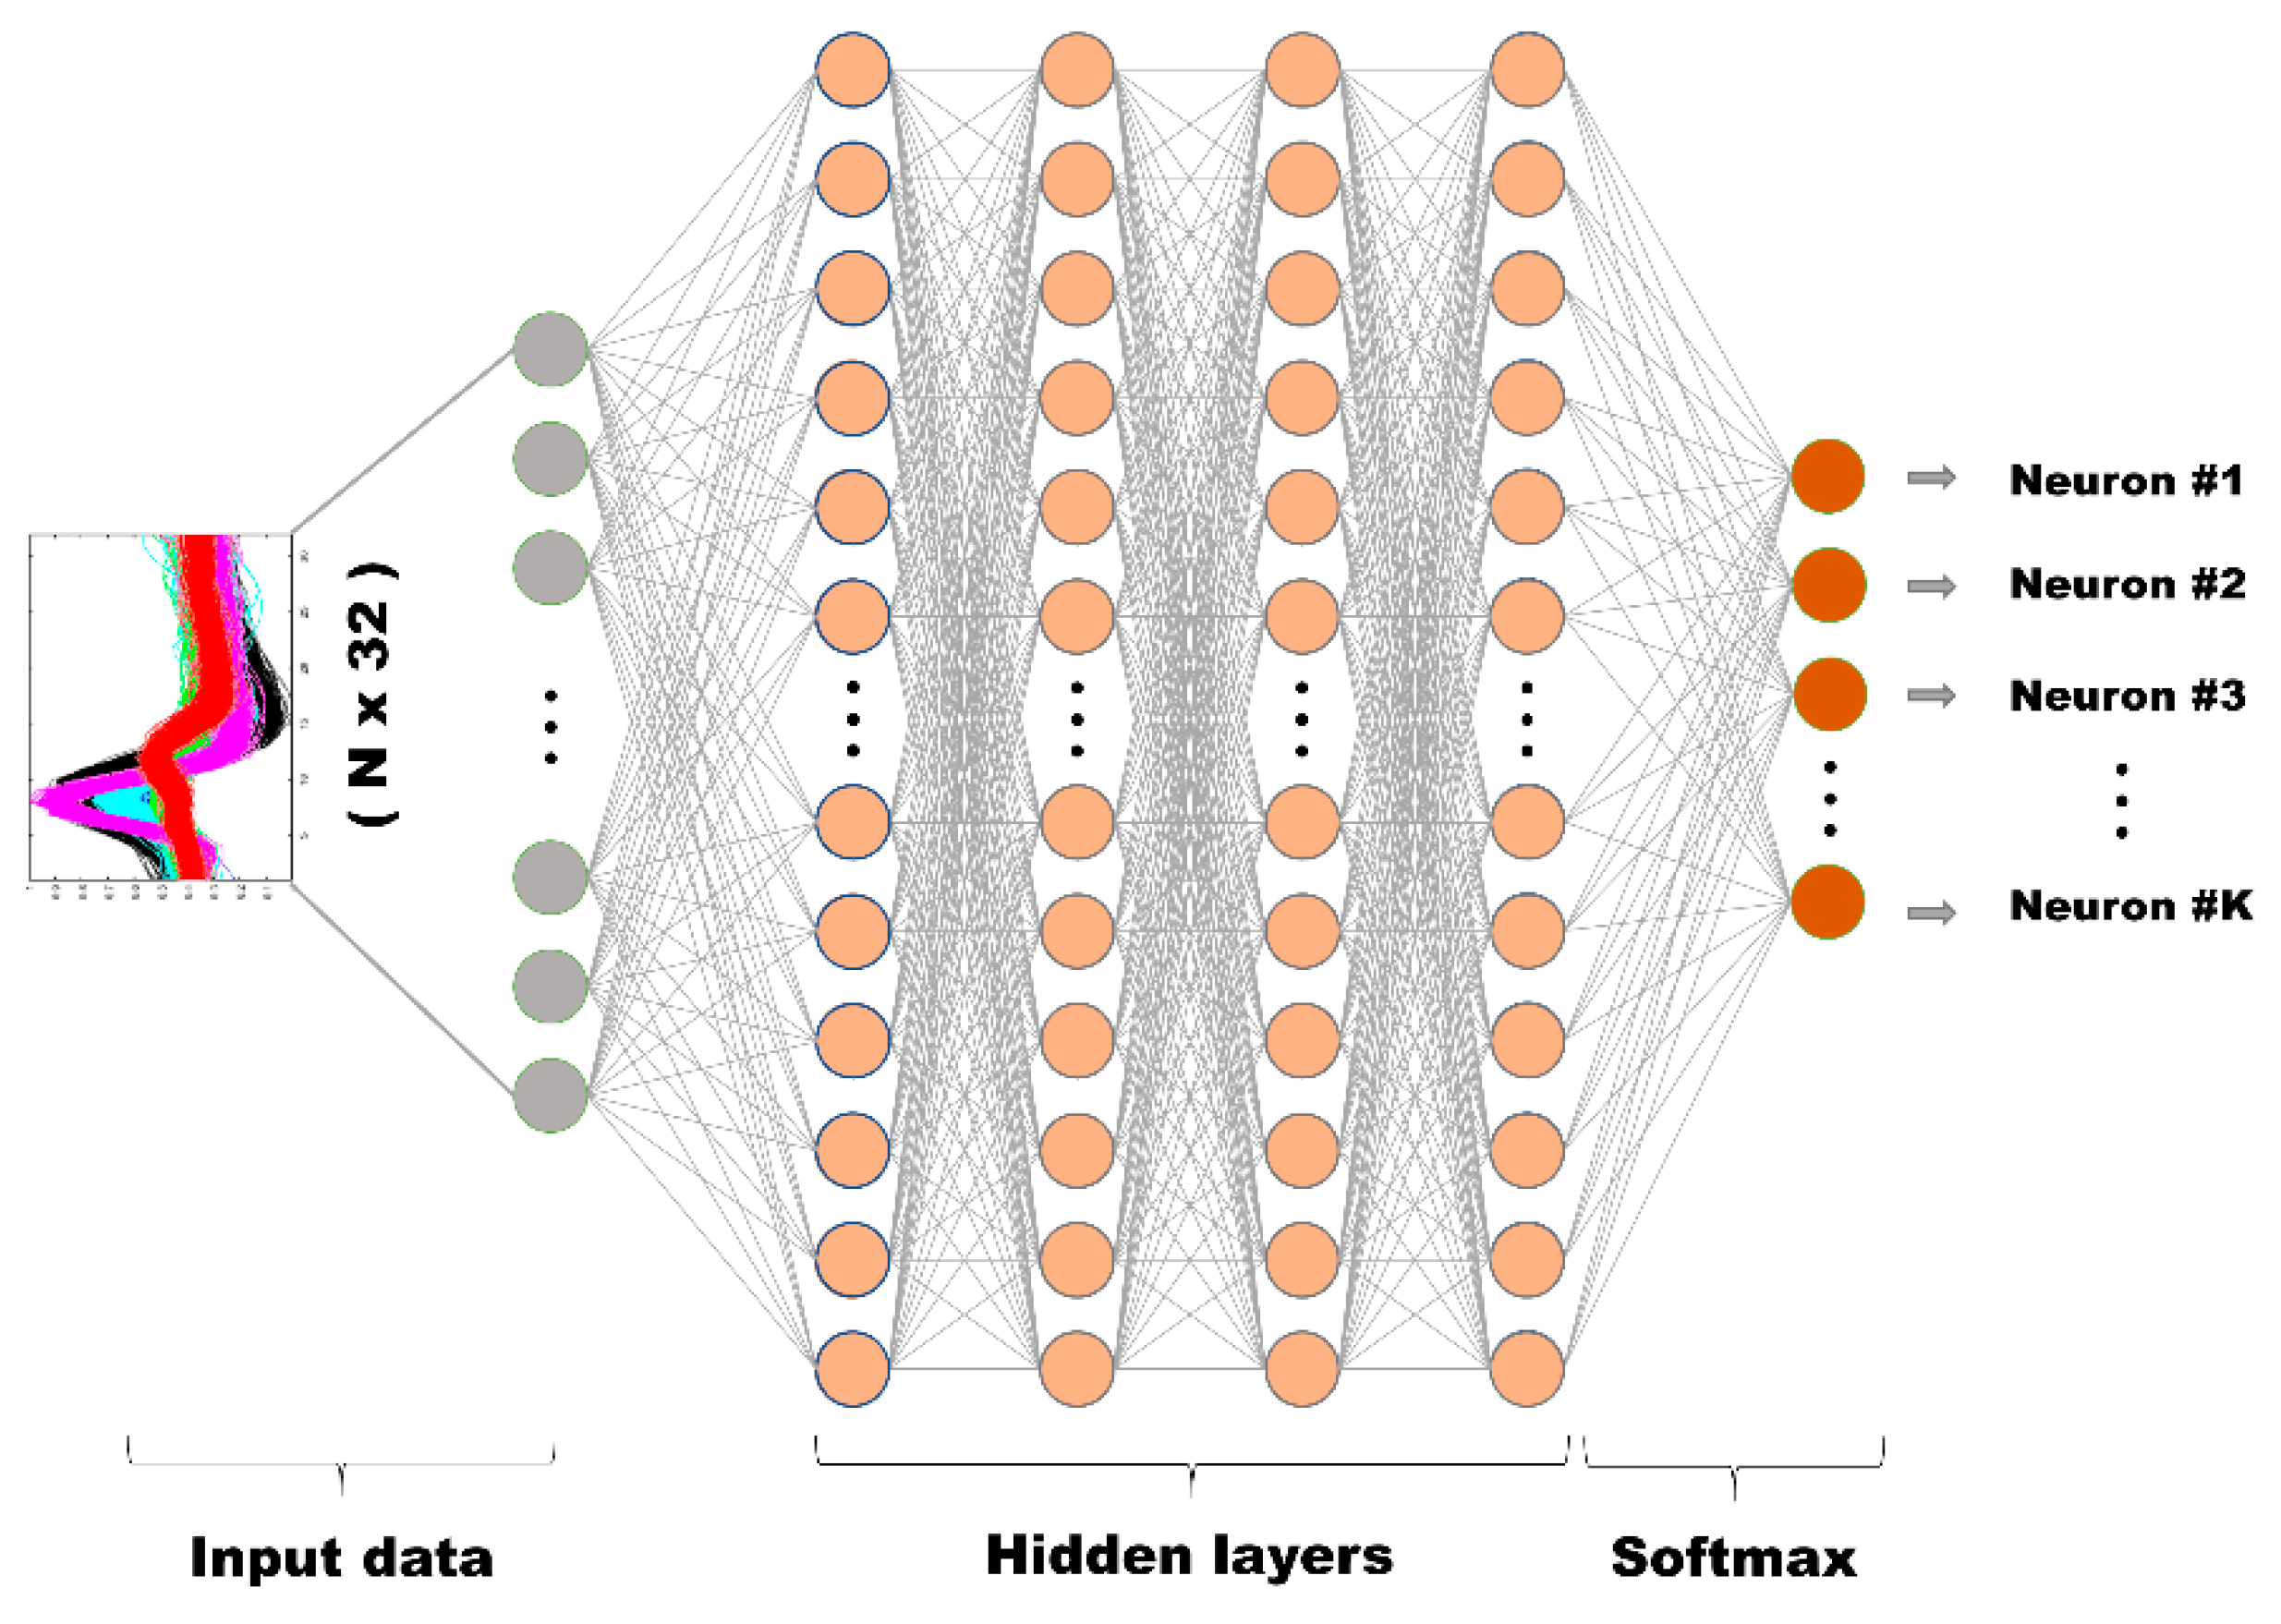
2.2. Deep Learning Model

The multiplayer perceptron (MLP) is a widely-used neural network architecture for classification tasks; its low computational cost, structure simplicity, and comparably small dependence on the training data size make it a readily applicable neural network algorithm for classification [34]. In general, MLP is composed of three main components: The input layer, the hidden layers, and the output layer. Each layer is composed of nodes which receives the outputs from the previous layer as their input, referred to as activation values, s i . The activation values are multiplied by the respective weights w i j and summed at consecutive layer nodes, followed by a chosen activation function f. The output of each nodes y j at layer l is described by the following equation:
y j = f ( i = 1 K l 1 w i j s i )
where K l is the number of nodes at the lth layer.
While training, w i j are adjusted to minimize the cross-entropy loss function described as the following:
E = log ( e s a n s j = 1 K l e s j )
where s a n s is the output probability of correct classification.
For our model, the input layer is a 32-dimensional layer where each dimension corresponds to the 32 sampling points of the data. As for the hidden layers, four cascades of layers each with 256 nodes were used. The number of layers and nodes for each layer were chosen heuristically since there are no known analytical methods for obtaining such parameters [35]. As for the activation function, we have used hyperbolic tangent function for the hidden layers, while for the output layer, which reduces dimension to equal classification categories and gives classification probability of each classification category, Softmax (1) activation function is applied so that the probability sum is equals to 1:
σ i ( s ) =   e s i j = 1 K l e s j
where K l is the number of nodes in the output layer. For our experiment, K l is equal to the number of neural signal types. For the training data, α% of the PCA + K-means clustered data nearest to the cluster centers were used under the assumption that data near centers of cluster have lower probability of being misclassified; α was set to 10 for our model. The methodology of PCA and k-means is further explained in Section 2.3.3. Figure 1 outlines the overall structures of the proposed model, and Figure 2 shows the structure of the MLP used in the model.
The proposed spike sorting algorithm was written in Python and implement with Keras using a Tensorflow backend. When performed on a dataset with 3526 spikes using an Intel Xeon E5-1620 CPU equipped with a Nvidia Titan X GPU and 96 GB RAM, the model took approximately 9 s for training and 3 s for testing.

2.3. Conventional Methods

2.3.1. Mean Squared Error-Based Template Matching

A basic template matching method for spike classification is mean square error (MSE)-based template matching [18]. By using the cluster center waveform of each PCA + K-means clustered data as the template waveforms, MSE between each test data signal and the template waveforms were obtained. Test signals were then assigned to the corresponding template cluster which resulted in the smallest MSE.

2.3.2. Cross-Correlation

Cross-correlation is a readily utilized method for signal analysis. It allows a measure of association between signals, thus can be used to give a critical altered perspective of signal data and serve as a basis for many advanced signal-processing methods [20,21]. This is especially true for brain signal analysis of EEG, where many reports have been made utilizing cross-correlation values in various tasks such as classification of motor imagery, mental imagery, and epilepsy signals [34,36]. Therefore, we speculate its effectiveness on our extracellular recordings as well and have applied it as a means for comparison.
For signal classification, each signal is classified to the corresponding signal cluster with the template signal which resulted in the highest Pearson correlation coefficient.

2.3.3. PCA K-Means Clustering
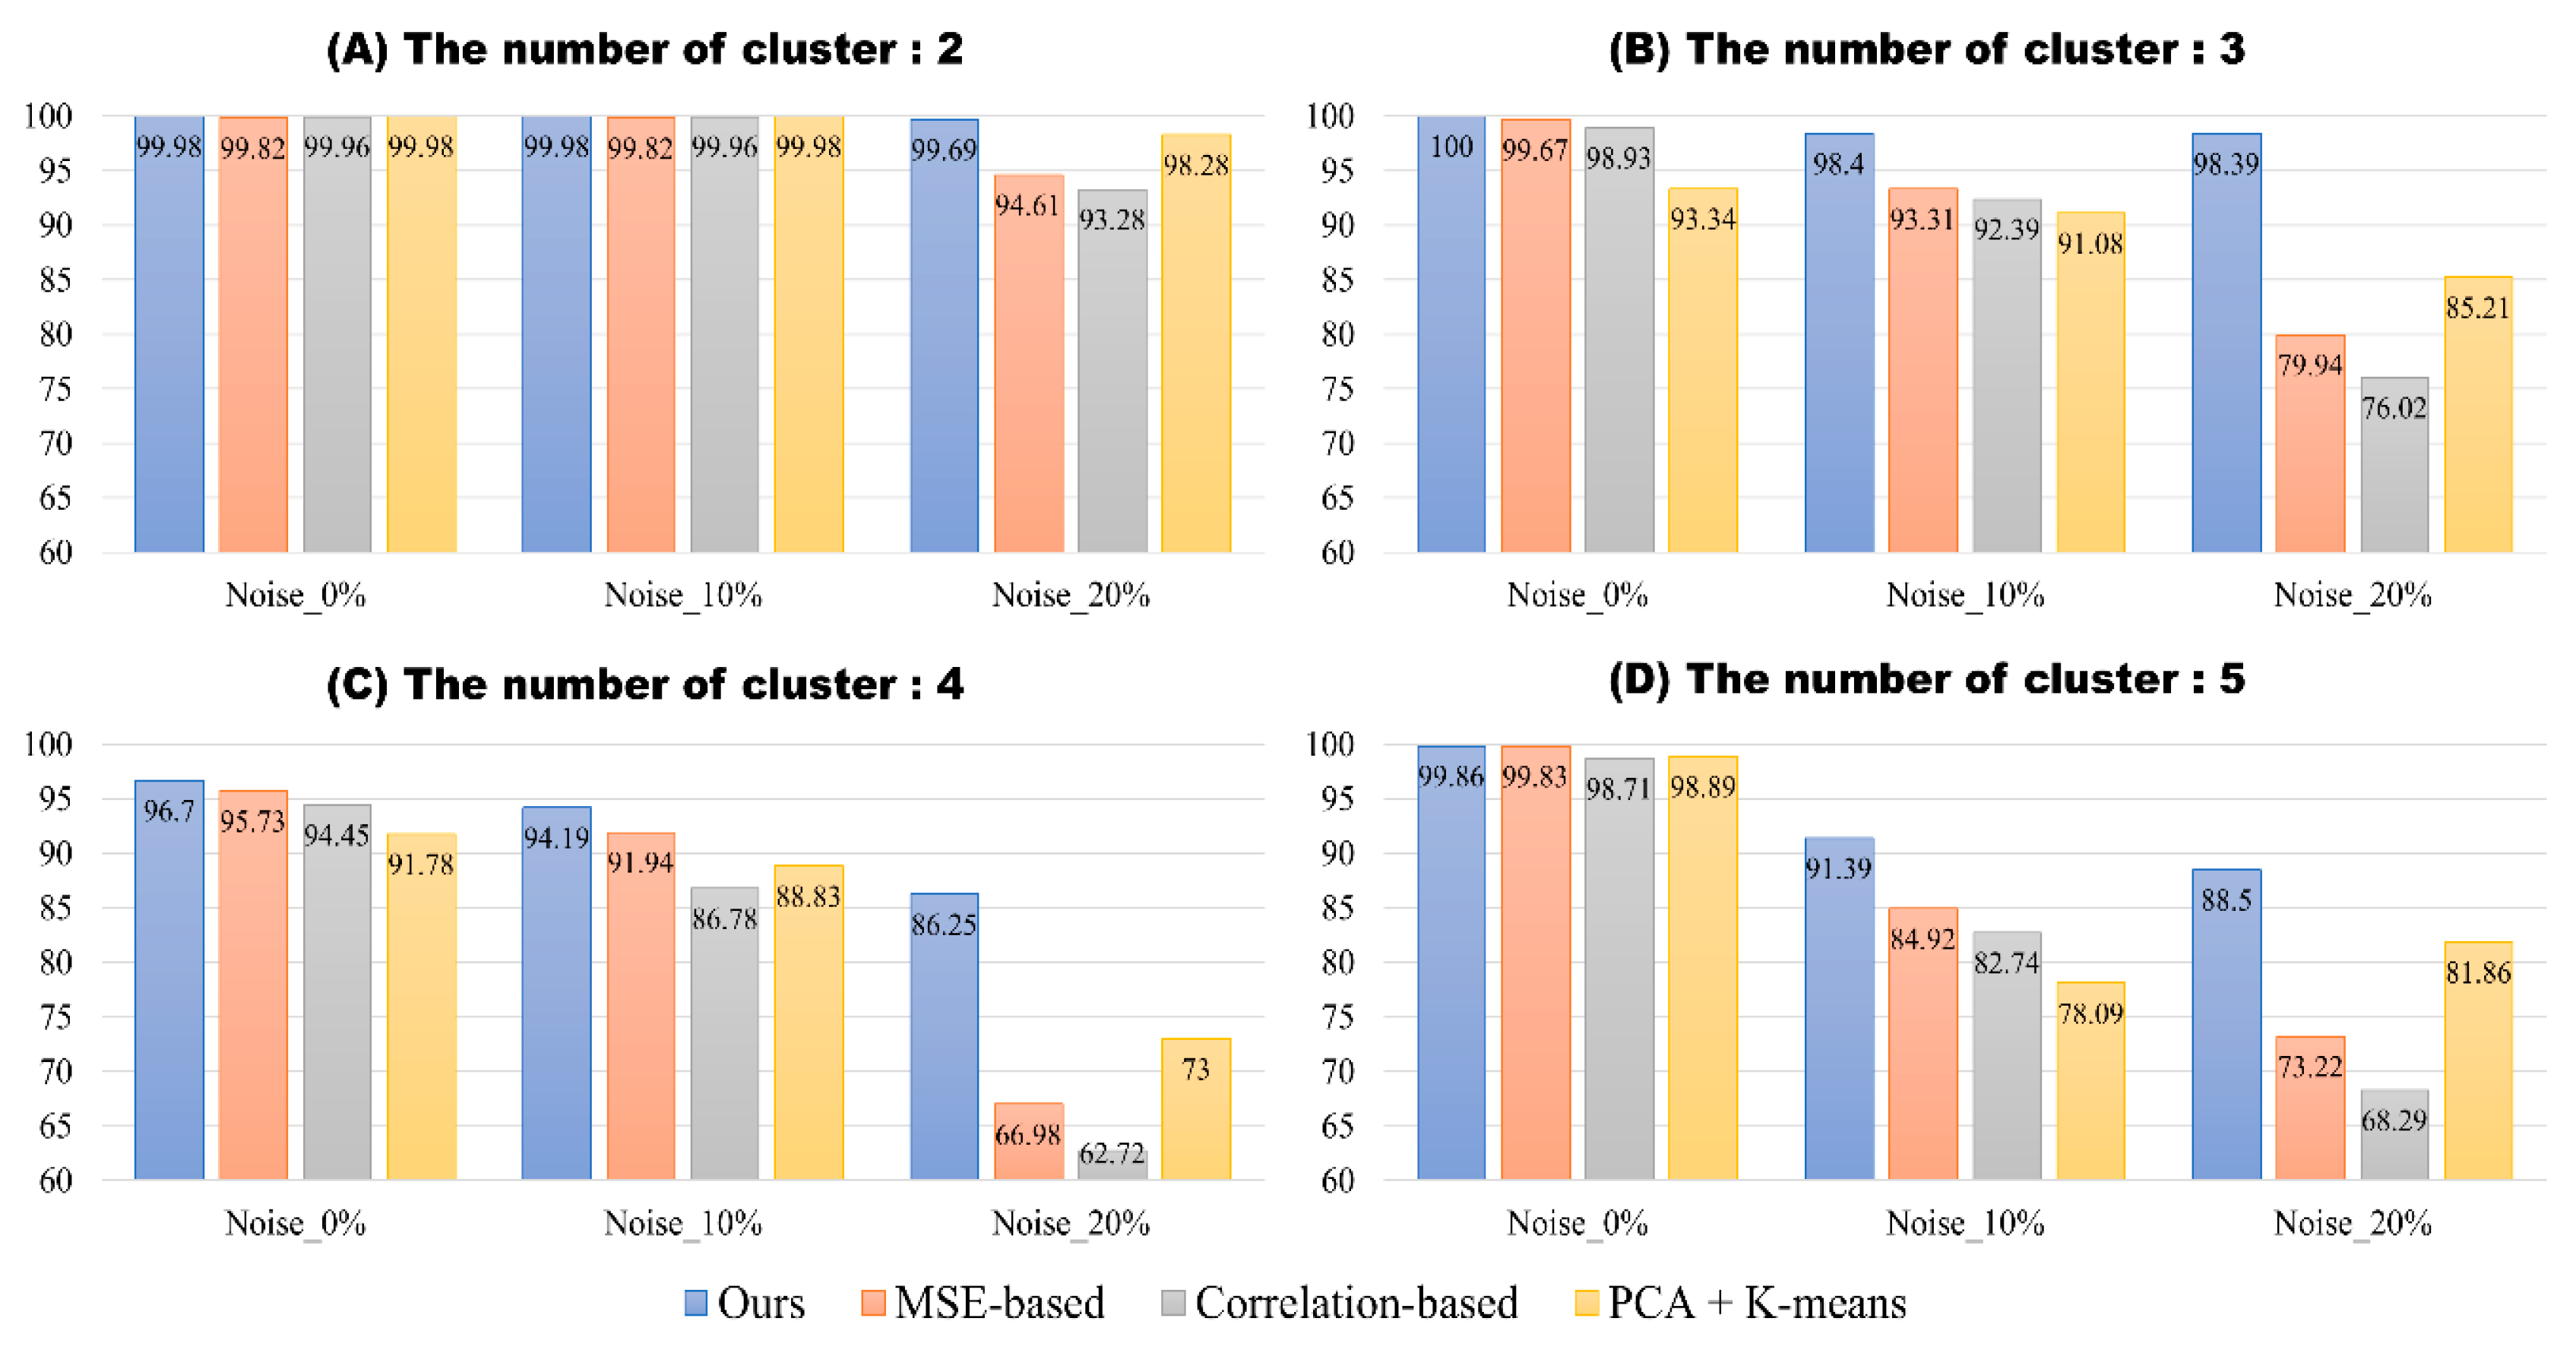
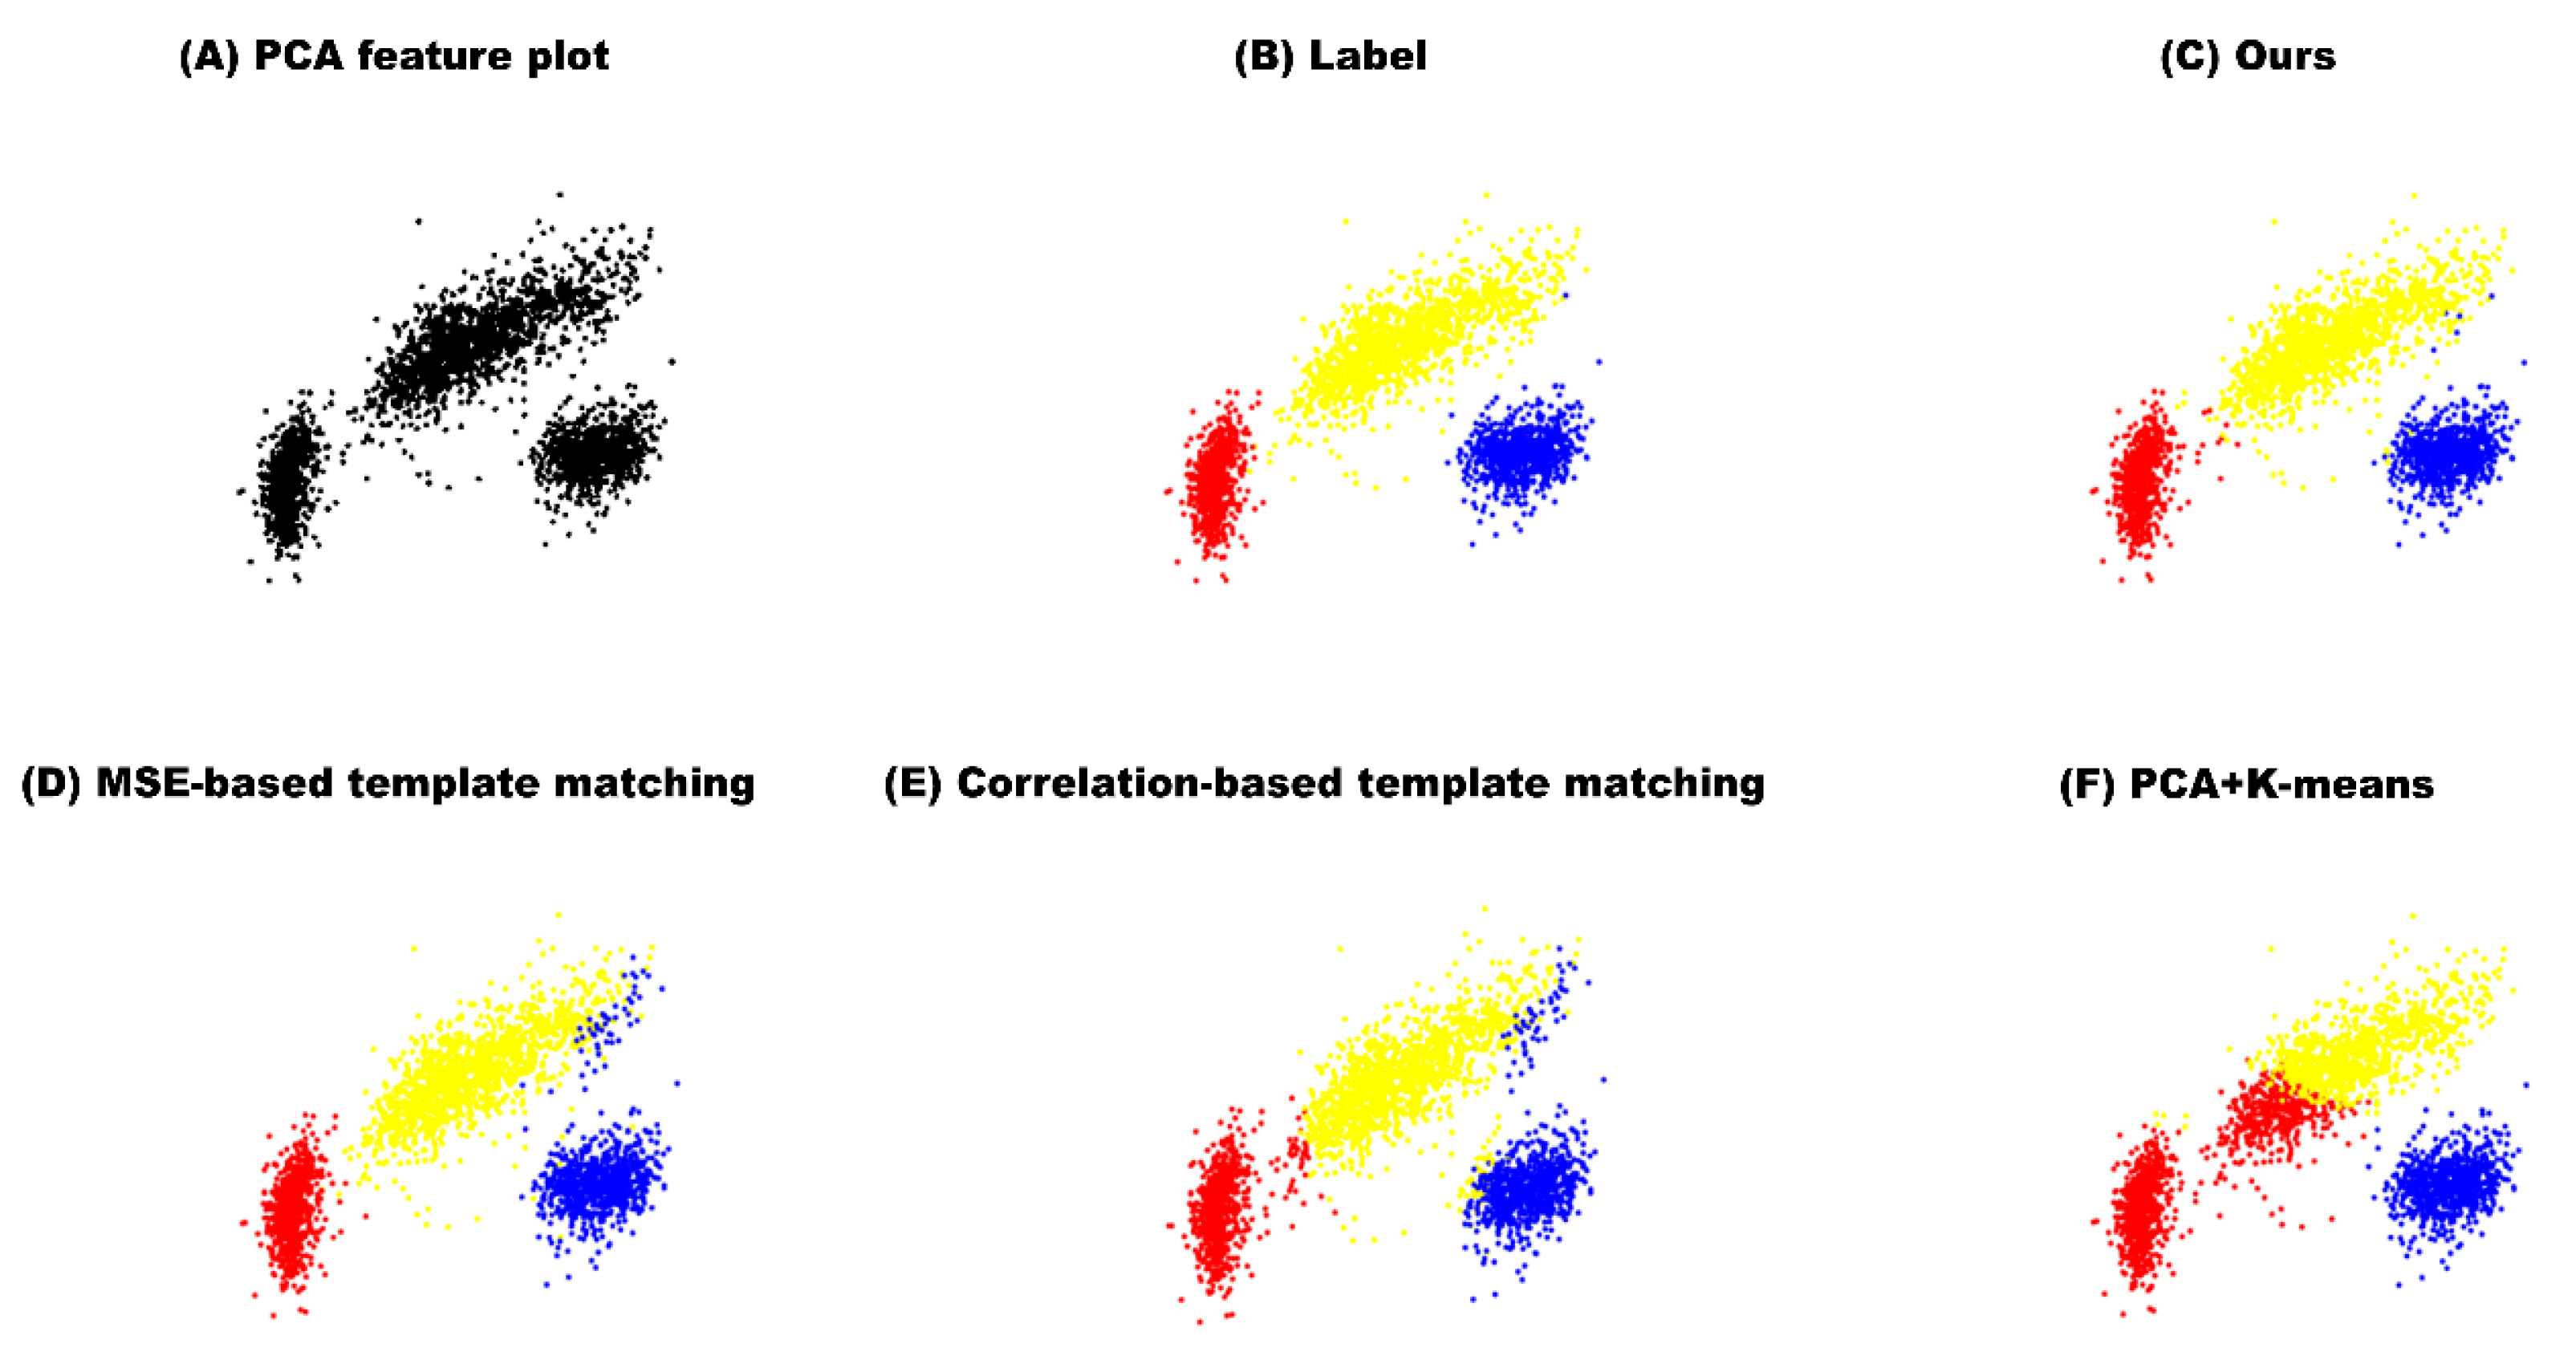
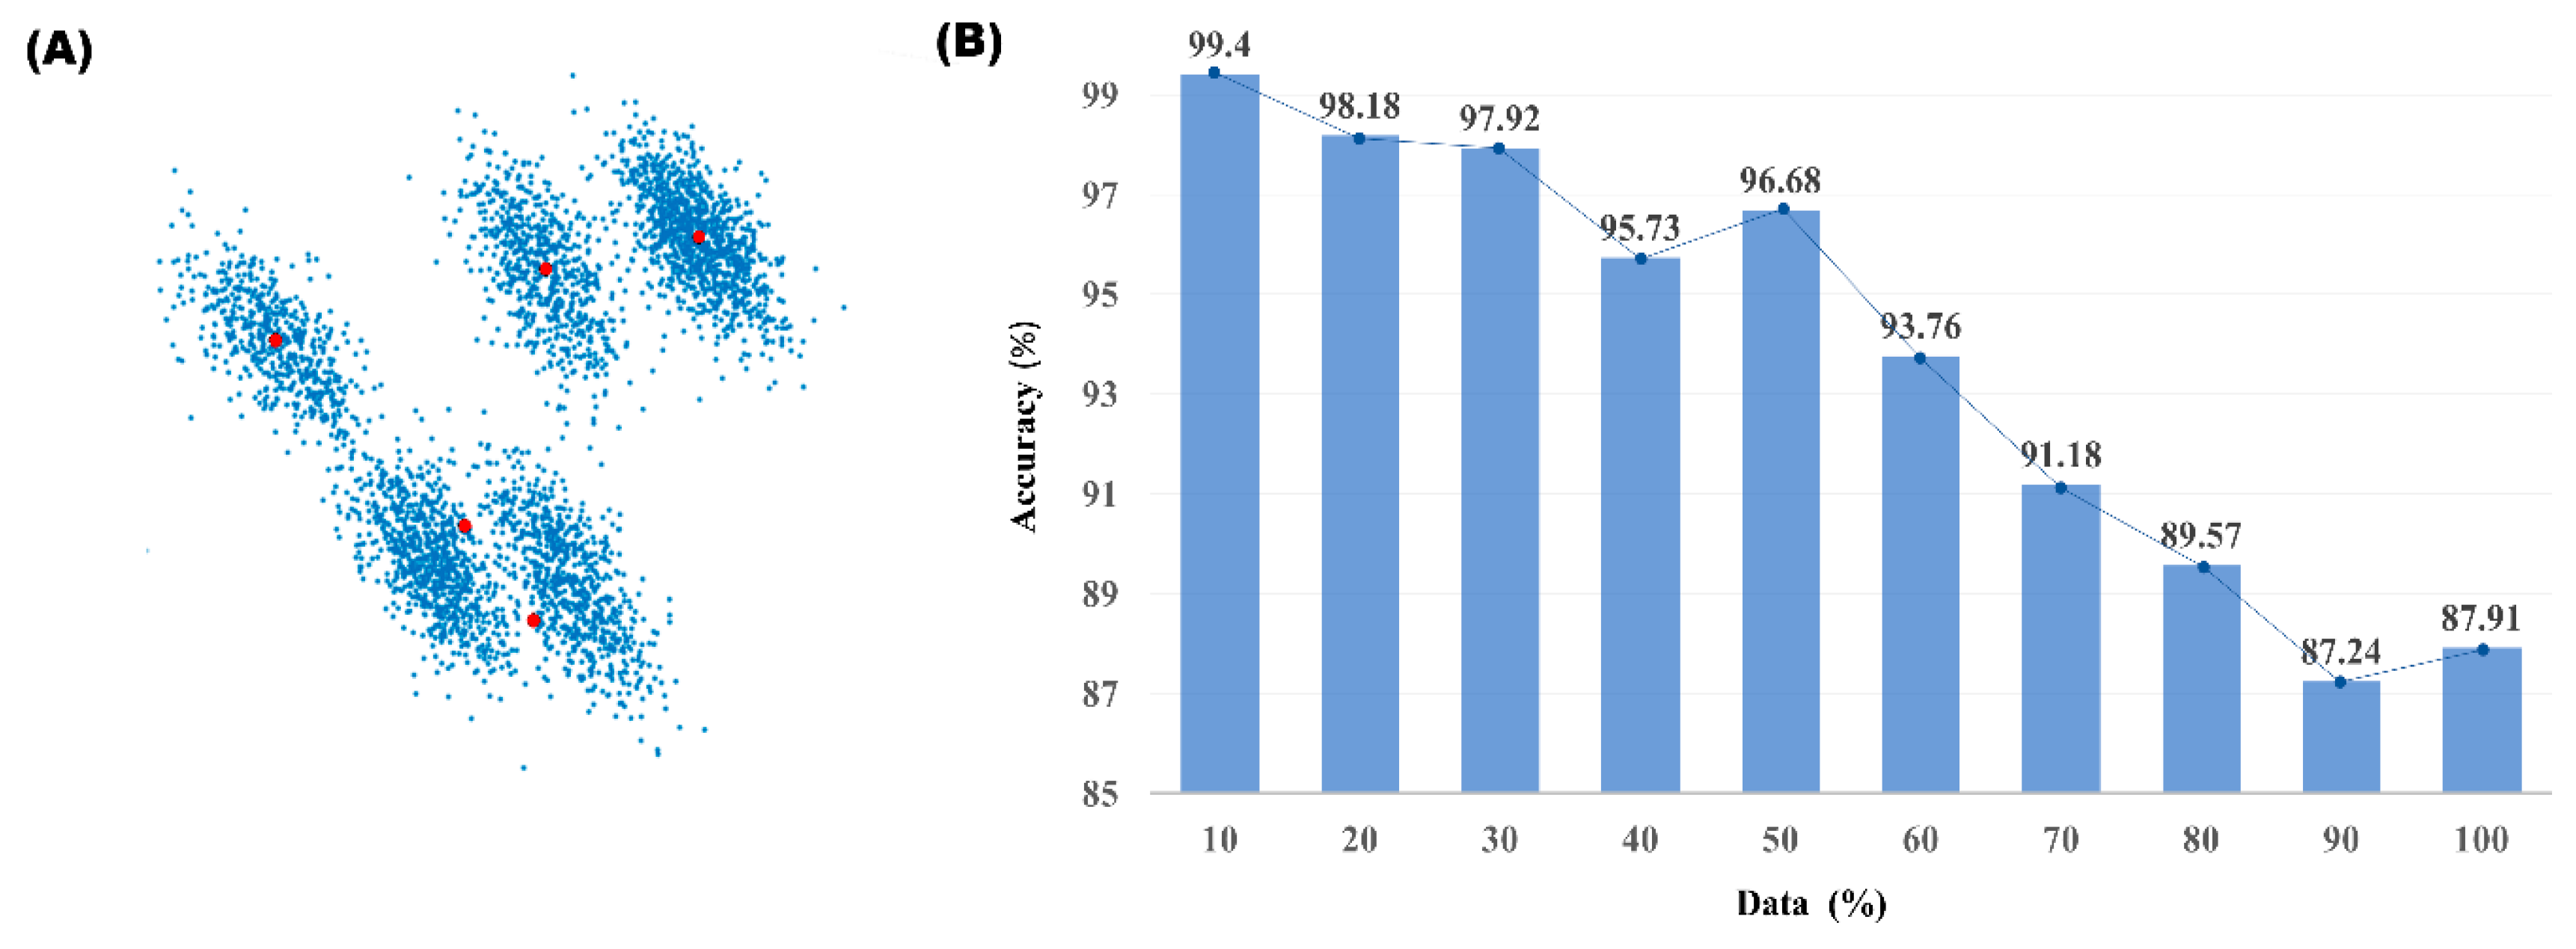
There exist immense number of clustering algorithms. Few popular algorithms are fuzzy C-means clustering [37], subtractive clustering [38], Density-based clustering [39], and K-means [15]. For our model, we have chosen K-means as our clustering method as it is one of the most popular clustering algorithms used in literature [40]. K-means clustering is an iterative clustering method which represents each of k clusters C i , where i = {1, …, k}, by their mean, i.e., the centroid c i . As such, each data points are classified to the cluster C i which results in the smallest Euclidean distance (1) between the corresponding c i and the point.
K-means, however, is sensitive to the dimensionality of the data where its accuracy drops and susceptibility to outliers rises with increasing dimensions [41]. Therefore, we have implemented a classical dimensionality reduction technique, namely PCA, that is commonly used before applying K-means [14]. PCA reduces dimensionality of data while conserving the correlation structure of the variables and capturing the variability in the data. Given X is the original data matrix and Y = ( y 1 , , y n ) , y i = x i x ¯ where x ¯ =   i = 0 n x i n , the covariance matrix becomes Y Y T = 1 n i = 0 n ( x i x ¯ ) ( x i x ¯ ) T . The principal components can be obtained through taking the eigenvectors of the covariance matrix where the eigenvalues rank the eigenvectors in the order of variance explained [14]. For our experiment, the data was reduced to 3-dimensions using three principal components with the highest principal directions, and the number of clusters, k, was determined through manual inspection of the data projected on the three principal components.

3. Results

We tested our model and compared the results with the presented contemporary models on both the single channel simulation datasets and the in-vivo dataset. When recording from a single electrode, signals from multiple neurons are detected. These neurons fire independently, and more than one neural signal types may be recorded at the same time resulting in overlapping signals. Such overlapping signals are considered either as outliers or more challenging data to classify.
Table 1 shows the tested classification results as the ratio between the correctly classified spikes and the total number of spikes with and without overlapping spikes on Simulation dataset 1. Our method gives high accuracy overall in both cases where overlapping spikes are included and excluded. There exist few cases where our model scored sub-optimally on data with less than 10% noise. However, in all such cases, our model showed over 98% accuracy, and the difference between the best performing model was miniscule with less than 0.32%. On the contrary, for the Difficult data with high noise level, our model outperformed other methods consistently with noticeable gap. On Difficult 2 data with 20% noise, our model showed 71.15% accuracy on data without overlapping spikes and 51.55% accuracy on data with overlapping spikes. These results when compared to the second-best performing correlation-based template matching are 3.4% and 18.31% higher and compared to the lowest performing MSE-based template matching are 8.43% and 19.55% higher.
Figure 3 shows classification results on simulation dataset 2. Overall, even in cases of varying cluster count and noise levels, our model showed high classification accuracy. In cases where noise did not exist, MSE-based template matching method and our proposed method both showed best performance independent of cluster count. However, with the addition of noise, the accuracy of the compared methods began to drop. When cluster count was 2, all models showed high classification accuracy of above 99.8% with the addition of 10% noise. But with the addition of 20% noise, MSE-based template matching, correlation-based template matching, and PCA + K-means dropped in accuracy by 5.21%, 6.68%, and 1.7%, respectively. The proposed method showed drop of mere 0.29% in accuracy. When cluster count was 3, addition of 10% noise resulted in accuracy drop of 6.36%, 6.54%, and 2.28% for MSE-based template matching, correlation-based template matching, and PCA + K-means. The addition of 20% noise resulted in additional accuracy drop of 13.37%, 16.37%, and 5.87% for MSE-based template matching, correlation-based template matching, and PCA + K-means. The proposed method dropped in accuracy by 1.6% for the addition of 10% noise and 1.61% for the addition of 20% noise. When cluster count was 4, overall performance dropped with the accuracy of 96.70%, 95.73%, 94.45%, and 91.78% for the proposed model, MSE, correlation, and PCA + K-means, respectively. It showed accuracy drop of 2.51%, 3.79%, 7.67%, 2.95% with 10% noise and additional drop of 7.94%, 24.96%, 24.06%, 15.83% with 20% noise. When cluster count was 5, it showed accuracy drop of 8.47%, 14.91%, 15.97%, 20.15% with 10% noise. The addition of 20% noise resulted in additional accuracy drop of 2.89%, 11.6%, 14.45% for the proposed method, MSE-based template matching, and correlation-based template matching method, respectively, but showed increase in accuracy of 3.12% for PCA + K-means.
Our method showed the best performance in in-vivo dataset as well. Figure 4 shows the classification results of spikes from in-vivo in 3-dimensional PCA feature domain. Compared to the manual classification results, our method showed the highest accuracy of 99.39%, and MSE-based template matching, correlation-based template matching, and PCA + K-means resulted in accuracy of 97.73%, 94.90%, and 83.02%, respectively. As seen in Figure 4, all four methods were successful at classifying the red and the blue clusters. However, for the yellow cluster, compared to our method, the other models were highly inaccurate in classifying the spikes on the boundary.

4. Discussion

Detection and classification of action potentials from extracellular recording is essential for analysis of single neural signal activity. The template matching method is a classic spike sorting method that can resolve many of the issues that comes along with it. It classifies by measuring the similarities between each spike and the templates, and it shows high performance depending on the quality of extracted templates. We propose an unsupervised deep learning-based classification model that can learn spike waveforms without labels and classify each spike. Our model learned the characteristics of spike clusters by using the representative spikes of the cluster as the training data and showed superior classification performance compared to other template matching methods. Our proposed method showed higher classification accuracy in both simulation data and in-vivo data especially under high levels of noise. Because MSE and cross-correlation sums all the sampling points of a signal individually, it is susceptible to noise. This is apparent in both Simulation dataset 1 and Dataset 2. On Simulation dataset 1, our method showed the highest performance on the most challenging Difficult 2 with noise level of 0.20 data and had the least amount of performance drop with the addition of noise on simulation dataset 2 independent of cluster count. However, using a deep learning model does have higher computational cost compared to other machine learning algorithms. For our model, due to the simple structure of the model, the classification of 3526 spikes required approximately only 12 s.
With increasing number of clusters, probability of similarly shaped waveforms appearing rises and the distance between each cluster in PCA feature domain may decrease, making spike classification more difficult. For Simulation dataset 2 without noise, although all methods showed high accuracy of above 99.8% when the cluster count was two, none were able to score over 97% when the cluster count rose to four. This, however, does not mean that classification accuracy always drops with increasing number of clusters. On Simulation dataset 2 with cluster count of five, all methods showed accuracy of above 98.5%. This shows that data with four clusters contained comparatively more challenging data for classification.
The performance of the deep learning classification model heavily depends on the goodness of the training data. And because PCA + K-means clustered data, used as the pseudo-label for our model, is not a perfect clustering algorithm where error rates increase for data points near the cluster boundaries, increasing the amount of training data also increases the risk of using mislabeled training data. Moreover, the cluster centers chosen by the K-means clustering may fail to correctly find true cluster centers. As shown in Figure 5A, when oval shaped clusters are closely located to each other, the cluster centers may be positioned at the boundary of the clusters. In such cases, using large number of spikes for the training data increases the risk of using misclassified spikes as the training data even more. According to our results shown in Figure 5B, using 10% of the data nearest to the cluster centers as the training data showed the highest performance for such data. For well PCA + K-means clustered data, there were nearly no differences in the performance when more than 10% of the data was used for training. Therefore, our experiment was performed using 10% of data nearest to cluster centers for training.
When proceeding with the general K-means clustering, when two clusters are closely located or when cluster shape differs from the spherical shape, it fails to accurately distinguish the cluster boundaries [42]. Therefore, there needs further refinement of the K-means clustering results for good clustering performance. In this research, we have shown that a deep learning-based method can successfully improve the limited spike sorting results from K-means clustering.
As shown in Table 1, although our model compared to other methods shows superior classification performance, it still shows an unsatisfactory accuracy of 71% on Difficult 2 with a noise level of 0.2. This can be explained by the structural similarity of the waveforms and high noise levels as seen in Figure 6A,B. Not only does this make the clustering process more difficult, it also makes template extracting process challenging, which is where our model struggled most on. As shown in Figure 6C, template extraction method through PCA + K-means method fails even with human inspection. However, when given 10% of the data with labels as the training data, our MLP model shows near perfect classification accuracy even on Difficult 2 with noise level of 0.2 with and without overlapping spikes with score of 99.55% and 99.70%, respectively. This shows that if clustering techniques more advanced than PCA + K-means is utilized and the accuracy of training data increase, classification performance of our model can be expected to rise.
For further work, we plan to modify the model and perform spike sorting on extracellular recordings using MEAs where the spatial information is utilized to further increase classification performance. The model performance will also be tested on other dimensionality reduction techniques as utilizing different domains can increase performance of models [43]. Moreover, different clustering algorithms, such as density-based clustering algorithms, will be implemented to further improve classification accuracy and make the procedure fully automatic.

5. Conclusions

Accurate spike classification is an essential procedure in signal analysis of extracellular recordings. In this paper, we propose a unsupervised deep learning-based template matching spike sorting method. The results demonstrate that in 1-dimensional spike data analysis, our deep learning-based MLP model successfully improves on PCA + K-means clustering for higher classification performance and robustness to noise compared to other conventional methods.

Author Contributions

J.E. and H.J. proposed the idea and performed algorithm construction. Y.H. and S.P. contributed to data acquisition and performed manual segmentation. I.Y.P. and S.K. contributed to performing data analysis and writing the article. D.H. technically supported the algorithm and evaluation and also professionally reviewed and edited the paper. All authors have read and agreed to the published version of the manuscript.

Funding

This research was supported by the Brain Research Program through the National Research Foundation of Korea (NRF) funded by the Ministry of Science, ICT & Future Planning (2018M3C7A1024734, 2018M3C7A1024736, 2015M3C7A1028392).

Conflicts of Interest

The authors declare no conflict of interest.

References

  1. Camuñas-Mesa, L.A.; Quiroga, R.Q. A detailed and fast model of extracellular recordings. Neural Comput. 2013, 25, 1191–1212. [Google Scholar] [CrossRef]
  2. Gold, C.; Henze, D.A.; Koch, C.; Buzsaki, G. On the origin of the extracellular action potential waveform: A modeling study. J. Neurophysiol. 2006, 95, 3113–3128. [Google Scholar] [CrossRef]
  3. Harris, K.D.; Quiroga, R.Q.; Freeman, J.; Smith, S.L. Improving data quality in neuronal population recordings. Nat. Neurosci. 2016, 19, 1165. [Google Scholar] [CrossRef] [Green Version]
  4. Dey, D.; Chaudhuri, S.; Munshi, S. Obstructive sleep apnoea detection using convolutional neural network based deep learning framework. Biomed. Eng. Lett. 2018, 8, 95–100. [Google Scholar] [CrossRef]
  5. Schmitzer-Torbert, N.L.; Jackson, J.; Henze, D.; Harris, K.; Redish, A.D. Quantitative measures of cluster quality for use in extracellular recordings. Neuroscience 2005, 131, 1–11. [Google Scholar] [CrossRef]
  6. Shoham, S.; Fellows, M.R.; Normann, R.A. Robust, automatic spike sorting using mixtures of multivariate t-distributions. J. Neurosci. Methods 2003, 127, 111–122. [Google Scholar] [CrossRef]
  7. Yger, P.; Spampinato, G.L.; Esposito, E.; Lefebvre, B.; Deny, S.; Gardella, C.; Stimberg, M.; Jetter, F.; Zeck, G.; Picaud, S.; et al. A spike sorting toolbox for up to thousands of electrodes validated with ground truth recordings In Vitro and In Vivo. eLife 2018, 7, e34518. [Google Scholar] [CrossRef]
  8. Souza, B.C.; Lopes-dos-Santos, V.; Bacelo, J.; Tort, A.B. Spike sorting with Gaussian mixture models. Sci. Rep. 2019, 9, 3627. [Google Scholar] [CrossRef] [PubMed] [Green Version]
  9. Rey, H.G.; Pedreira, C.; Quiroga, R.Q. Past, present and future of spike sorting techniques. Brain Res. Bull. 2015, 119, 106–117. [Google Scholar] [CrossRef] [PubMed] [Green Version]
  10. Fee, M.S.; Mitra, P.P.; Kleinfeld, D. Automatic sorting of multiple unit neuronal signals in the presence of anisotropic and non-Gaussian variability. J. Neurosci. Methods 1996, 69, 175–188. [Google Scholar] [CrossRef]
  11. Sahani, M. Latent Variable Models for Neural Data Analysis; California Institute of Technology: Pasadena, CA, USA, 1999. [Google Scholar]
  12. Franke, F.; Quiroga, R.Q.; Hierlemann, A.; Obermayer, K. Bayes optimal template matching for spike sorting–combining fisher discriminant analysis with optimal filtering. J. Comput. Neurosci. 2015, 38, 439–459. [Google Scholar] [CrossRef] [PubMed]
  13. Jain, A.K.; Duin, R.P.W.; Mao, J. Statistical pattern recognition: A review. IEEE Trans. Pattern Anal. Mach. Intell. 2000, 22, 4–37. [Google Scholar] [CrossRef] [Green Version]
  14. Wold, S.; Esbensen, K.; Geladi, P. Principal component analysis. Chemom. Intell. Lab. Syst. 1987, 2, 37–52. [Google Scholar] [CrossRef]
  15. Hartigan, J.A.; Wong, M.A. Algorithm AS 136: A k-means clustering algorithm. J. R. Stat. Soc. Ser. C Appl. Stat. 1979, 28, 100–108. [Google Scholar] [CrossRef]
  16. Zhang, P.M.; Wu, J.Y.; Zhou, Y.; Liang, P.J.; Yuan, J.Q. Spike sorting based on automatic template reconstruction with a partial solution to the overlapping problem. J. Neurosci. Methods 2004, 135, 55–65. [Google Scholar] [CrossRef] [PubMed]
  17. Sato, T.; Suzuki, T.; Mabuchi, K. Fast Automatic Template Matching for Spike Sorting Based on Davies-Bouldin Validation Indices. In Proceedings of the 2007 29th Annual International Conference of the IEEE Engineering in Medicine and Biology Society 2007, Lyon, France, 22–26 August 2007; pp. 3200–3203. [Google Scholar]
  18. Bankman, I.N.; Johnson, K.O.; Schneider, W. Optimal detection, classification, and superposition resolution in neural waveform recordings. IEEE Trans. Biomed. Eng. 1993, 40, 836–841. [Google Scholar] [CrossRef]
  19. Jansen, R.F.; Ter Maat, A. Automatic wave form classification of extracellular multineuron recordings. J. Neurosci. Methods 1992, 41, 123–132. [Google Scholar] [CrossRef]
  20. Kaneko, H.; Suzuki, S.S.; Okada, J.; Akamatsu, M. Multineuronal spike classification based on multisite electrode recording, whole-waveform analysis, and hierarchical clustering. IEEE Trans. Biomed. Eng. 1999, 46, 280–290. [Google Scholar] [CrossRef]
  21. Gozani, S.N.; Miller, J.P. Optimal discrimination and classification of neuronal action potential waveforms from multiunit, multichannel recordings using software-based linear filters. IEEE Trans. Biomed. Eng. 1994, 41, 358–372. [Google Scholar] [CrossRef]
  22. Krizhevsky, A.; Sutskever, I.; Hinton, G.E. Imagenet classification with deep convolutional neural networks. In Advances in Neural Information Processing Systems; The MIT Press: Cambridge, CA, USA, 2012; pp. 1097–1105. [Google Scholar]
  23. Metcalfe, B.W.; Nielsen, T.N.; Donaldson, N.D.N.; Hunter, A.J.; Taylor, J.T. First demonstration of velocity selective recording from the pig vagus using a nerve cuff shows respiration afferents. Biomed. Eng. Lett. 2018, 8, 127–136. [Google Scholar] [CrossRef] [Green Version]
  24. Saif-ur-Rehman, M.; Lienkämper, R.; Parpaley, Y.; Wellmer, J.; Liu, C.; Lee, B.; Klaes, C. SpikeDeeptector: A deep-learning based method for detection of neural spiking activity. J. Neural Eng. 2019, 16, 056003. [Google Scholar] [CrossRef] [PubMed] [Green Version]
  25. Rácz, M.; Liber, C.; Németh, E.; Fiáth, R.; Rokai, J.; Harmati, I.; Márton, G. Spike detection and sorting with deep learning. J. Neural Eng. 2019. [Google Scholar] [CrossRef] [PubMed]
  26. Eom, J.; Kim, S.; Jang, H.; Shin, H.; Hwang, J.H.; Park, S.; Huh, Y.; Choi, H.J.; Hwang, D. Neural spike classification via deep neural network. IBRO Rep. 2019, 6, S139–S140. [Google Scholar] [CrossRef]
  27. Quiroga, R.Q.; Nadasdy, Z.; Ben-Shaul, Y. Unsupervised spike detection and sorting with wavelets and superparamagnetic clustering. Neural Comput. 2004, 16, 1661–1687. [Google Scholar] [CrossRef] [Green Version]
  28. Keshtkaran, M.R.; Yang, Z. Noise-robust unsupervised spike sorting based on discriminative subspace learning with outlier handling. J. Neural Eng. 2017, 14, 036003. [Google Scholar] [CrossRef]
  29. Pedreira, C.; Martinez, J.; Ison, M.J.; Quiroga, R.Q. How many neurons can we see with current spike sorting algorithms? J. Neurosci. Methods 2012, 211, 58–65. [Google Scholar] [CrossRef] [Green Version]
  30. Huh, Y.; Cho, J. Differential responses of thalamic reticular neurons to nociception in freely behaving mice. Front. Behav. Neurosci. 2016, 10, 223. [Google Scholar] [CrossRef] [Green Version]
  31. Huh, Y.; Cho, J. Discrete pattern of burst stimulation in the ventrobasal thalamus for anti-nociception. PLoS ONE 2013, 8, e67655. [Google Scholar] [CrossRef]
  32. Huh, Y.; Bhatt, R.; Jung, D.; Shin, H.S.; Cho, J. Interactive responses of a thalamic neuron to formalin induced lasting pain in behaving mice. PLoS ONE 2012, 7, e30699. [Google Scholar] [CrossRef] [Green Version]
  33. Liu, X.; Wan, H.; Shi, L. Quality Metrics of Spike Sorting Using Neighborhood Components Analysis. Open Biomed. Eng. J. 2014, 8, 60. [Google Scholar] [CrossRef] [Green Version]
  34. Jahankhani, P.; Kodogiannis, V.; Revett, K. EEG Signal Classification Using Wavelet Feature Extraction and Neural Networks. In Proceedings of the IEEE John Vincent Atanasoff 2006 International Symposium on Modern Computing (JVA’06), Sofia, Bulgaria, 3–6 October 2006; pp. 120–124. [Google Scholar]
  35. Oğulata, S.N.; Şahin, C.; Erol, R. Neural network-based computer-aided diagnosis in classification of primary generalized epilepsy by EEG signals. J. Med. Syst. 2009, 33, 107–112. [Google Scholar] [CrossRef] [PubMed]
  36. Chandaka, S.; Chatterjee, A.; Munshi, S. Cross-correlation aided support vector machine classifier for classification of EEG signals. Expert Syst. Appl. 2009, 36, 1329–1336. [Google Scholar] [CrossRef]
  37. Bezdek, J.C. Pattern Recognition with Fuzzy Objective Function Algorithms; Springer Science & Business Media: Berlin/Heidelberg, Germany, 2013. [Google Scholar]
  38. Chiu, S.L. Fuzzy model identification based on cluster estimation. J. Intell. Fuzzy Syst. 1994, 2, 2–267. [Google Scholar] [CrossRef]
  39. Rai, P.; Singh, S. A survey of clustering techniques. Int. J. Comput. Appl. 2010, 7, 1–5. [Google Scholar] [CrossRef]
  40. Güneş, S.; Polat, K.; Yosunkaya, Ş. Efficient sleep stage recognition system based on EEG signal using k-means clustering based feature weighting. Expert Syst. Appl. 2010, 37, 7922–7928. [Google Scholar] [CrossRef]
  41. Prabhu, P.; Anbazhagan, N. Improving the performance of k-means clustering for high dimensional data set. Int. J. Comput. Sci. Eng. 2011, 3, 2317–2322. [Google Scholar]
  42. Raykov, Y.P.; Boukouvalas, A.; Baig, F.; Little, M.A. What to do when k-means clustering fails: A simple yet principled alternative algorithm. PLoS ONE 2016, 11, e0162259. [Google Scholar] [CrossRef]
  43. Eo, T.; Jun, Y.; Kim, T.; Jang, J.; Lee, H.J.; Hwang, D. KIKI-net: cross-domain convolutional neural networks for reconstructing undersampled magnetic resonance images. Magn. Reson. Med. 2018, 80, 2188–2201. [Google Scholar]
Figure 1. Overall framework of our proposed method.
Applsci 10 00301 g001
Figure 2. The overall structure of our training model.
Applsci 10 00301 g002
Figure 3. The results of four spike classification methods for simulation dataset 2.
Applsci 10 00301 g003
Figure 4. In-vivo result in the PCA feature domain. (A) PCA feature plot of in-vivo data (B) manually labeled data by expert (C) The result of our proposed method (D) The result of MSE-based template matching (E) The result of correlation-based template matching (F) The result of PCA + K-means.
Applsci 10 00301 g004
Figure 5. The accuracy of the proposed model depending on amount of training data (A) PCA feature plot of 5 cluster data with the case of two closely located clusters. The red dots represent the cluster centers calculated by K-means. (B) Change in accuracy depending on the amount of training data.
Applsci 10 00301 g005
Figure 6. Spikes and PCA features of the Difficult 2 in the simulation dataset 1 with 20% noise. (A) The overlapped spikes. (B) The averaged spikes from three labeled clusters. (C) Three labeled clusters in PCA feature domain.
Applsci 10 00301 g006
Table 1. Classification result for the simulation dataset 1 with and without overlapping spikes. The numbers in parenthesis correspond to the results on data with overlapping spikes.
DataNoiseOursMSE-Based Template MatchingCorrelation-Based Template MatchingPCA + K-Means Clustering
Easy10.05100 (99.26)100 (99.30)100 (99.14)100 (99.40)
0.1100 (99.43)100 (95.51)100 (99.34)100 (99.65)
0.15100 (99.25)100 (99.11)100 (99.10)100 (99.48)
0.2100 (99.19)100 (99.00)99.88 (98.76)100 (99.51)
Easy20.05100 (98.68)100 (98.41)100 (98.79)99.96 (98.21)
0.199.85 (98.49)95.54 (97.31)94.91 (98.89)99.96 (98.18)
0.1597.99 (97.19)89.53 (88.82)94.86 (94.25)98.79 (96.77)
0.296.50 (95.20)93.50 (87.44)93.37 (90.35)95.46 (93.84)
Difficult10.05100 (98.78)100 (98.80)100 (98.98)100 (98.84)
0.199.96 (98.93)99.34 (95.12)99.48 (98.84)100 (98.93)
0.1599.77 (97.55)90.15 (84.82)98.55 (96.83)99.77 (97.32)
0.298.08 (96.62)81.99 (92.10))97.22 (93.75)95.69 (92.95)
Difficult20.0599.61 (98.49)98.08 (97.52)91.62 (93.76)86.04 (87.28)
0.196.62 (94.66)92.34 (68.51)90.56 (88.54)84.11 (83.90)
0.1583.23 (82.20)83.03 (73.61)80.82 (74.36)74.43 (72.63)
0.271.15 (51.55)62.72 (32.00)67.75 (33.24)65.92 (32.22)
Total 96.42 (94.09)92.89 (87.96)94.32 (91.06)93.76 (90.57)

