Article

A One-Pot Ultrasound-Assisted Almond Skin Separation/Polyphenols Extraction and its Effects on Structure, Polyphenols, Lipids, and Proteins Quality

1
Department of Biology, Faculty of Science Dhar El-Mahraz, University Sidi Mohammed Ben Abdellah, P.O. Box 1796, Fez 30050, Morocco
2
INRAE, Avignon University, UMR 408, Green Extraction Team, F-84000 Avignon, France
3
College of Food Science and Technology, Nanjing Agricultural University, Nanjing 210095, China
4
INRAE, Avignon University, UMR408, Sécurité et Qualité des Produits d’Origine Végétale, F-84914 Avignon, France
5
INRAE, Unité de Pathologie Végétale, F-84140 Avignon, France
*
Authors to whom correspondence should be addressed.
Submission received: 9 May 2020 / Revised: 19 May 2020 / Accepted: 20 May 2020 / Published: 24 May 2020
(This article belongs to the Collection Ultrasound in Extraction Processing)

Abstract

:

Featured Application

In the 21st century, we have to meet the challenges of green food processing to secure food production, reduce by-products, and protect both the environment and consumers. Ultrasound has been used as a non-thermal processing technique at the same time for processing (skin separation) and extraction (polyphenol extract). This new process to obtain peeled almonds reduces by-products and produces high value extract rich in polyphenols. The results of this investigation pave the way for the set-up of an industrial application of ultrasound to almond processing but also open up the way for combined utilization of ultrasound.

Abstract

Almond skin is an important by-product in the almond processing industry, rich in potentially health-promoting phenolic compounds. The objective of this present study is to separate the skin from the almond and extract its polyphenol contents using Ultrasound-Assisted Extraction (UAE) at room temperature. Optimization was performed according to a two-variable central composite design (CCD), and the optimum combination of ultrasonic intensity and extraction temperature was obtained through multi-response optimization: ultrasonic intensity (UI), 9.47 W.cm−2; and temperature, 20 °C for an extraction time of 20 min. Under the above-mentioned conditions, total phenolic content was 258% higher with UAE than silent experiment. Mathematic modelling and microscopic investigations were achieved to enable understanding physical and structural effects of ultrasound on almond skins and comprehension of the mechanism behind the enhancement of mass transfer phenomena. Scanning Electron Microscopy (SEM) showed different acoustic cavitation impacts including fragmentation, sonoporation, and erosion. Extracts were analyzed by ultra-performance liquid chromatography coupled with mass spectrometry (UPLC-MS), identifying a combination of flavanols, flavanones and non-flavonoids. UAE shows no negative effect on almond proteins and lipids when compared to natural almonds (NS).

Graphical Abstract

1. Introduction

Almond (Prunus dulcis, Rosaceae family) is one of the most consumed drupes in the world, appreciated for its pleasant taste and its abundance in nutritional compounds (proteins, polyphenols, omega 6, omega 9), and known for its hypercholesterolemia reduction [1,2]. The United States of America, especially California, dominates the global production of almonds, followed by the European Union, Maghreb countries, and Japan. Almond fruits are dehiscent drupes. The ovary wall becomes a pericarp with a leathery mesocarp (also called hull), a woody endocarp (shell) that contains and protects almonds (kernels) covered by a brown skin [3]. During industrial food processing, kernels are separated from skins by blanching [4] and then discarded. Almond skin represents an average of 4% of the total almond weight but covers 70-100% total polyphenols present in the drupe [5,6]. By-products derived from the almond processing (skins, shells, hulls, blanching water) are generally used for livestock feed and raw material for energy production [7]. Nevertheless, over the past years, research had been led to assess the possible use of these by-products as sources of extracts rich in polyphenols which can be used as an ingredient for food, pharmaceutical, and cosmetic applications [7,8,9,10,11].
According to Mandalari et al. 2010 [12], blanching at water boiling point has a negative impact on polyphenols initially present in natural almond skin. This blanching technique is used worldwide but involves a decrease of almond polyphenols, a large consumption of energy (heating), and a denaturation of almond proteins. As reported by Chemat et al. 2016 [13], ultrasound technique is a key-technology in achieving the objective of sustainable “green” chemistry and extraction. By using ultrasound, full extractions can be completed in minutes with high reproducibility, reducing the consumption of solvent, simplifying manipulation and work-up, giving higher purity of the final product. It also allows the damage of the cell wall, thus releasing bioactive compounds in the aqueous solution. The efficiency of ultrasound has already been proven in the extraction of substances of interest such as polyphenols and can be considered as an alternative to the conventional methods [14]. Ultrasound mechanisms can be explained as follows: cavitation phenomena lead to high shear forces in the media, causing the implosion of cavitation bubbles on a product’s surface and releasing micro-jetting which generates several effects such as surface peeling, erosion and particle breakdown. Furthermore, implosion of cavitation bubbles in a liquid media leads to macro-turbulences and to a micro mixing [15].
The aim of this study is to use ultrasound to combine almond skin separation and polyphenol extraction. Our purpose is to obtain a rapid, environmentally friendly process for a scale-up involving skin separation and requiring a cell breakdown to improve intracellular compounds extraction efficiency using Ultrasonic Assisted Extraction (UAE). Extracts will be analyzed to quantify polyphenol composition in ultrasonicated almonds and compared with natural almonds, blanched almonds, and non-ultrasonicated almonds. Another purpose of this paper is to explore ultrasound effect on almond skin cells integrity with SEM observations, and finally to evaluate its action on skinless almond proteins and lipids (Figure 1).

2. Materials and Methods

2.1. Polyphenols in Almond Skin

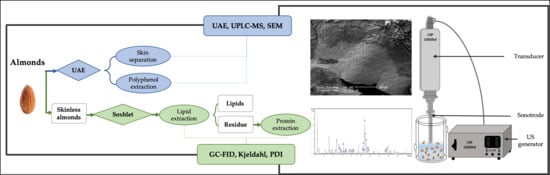
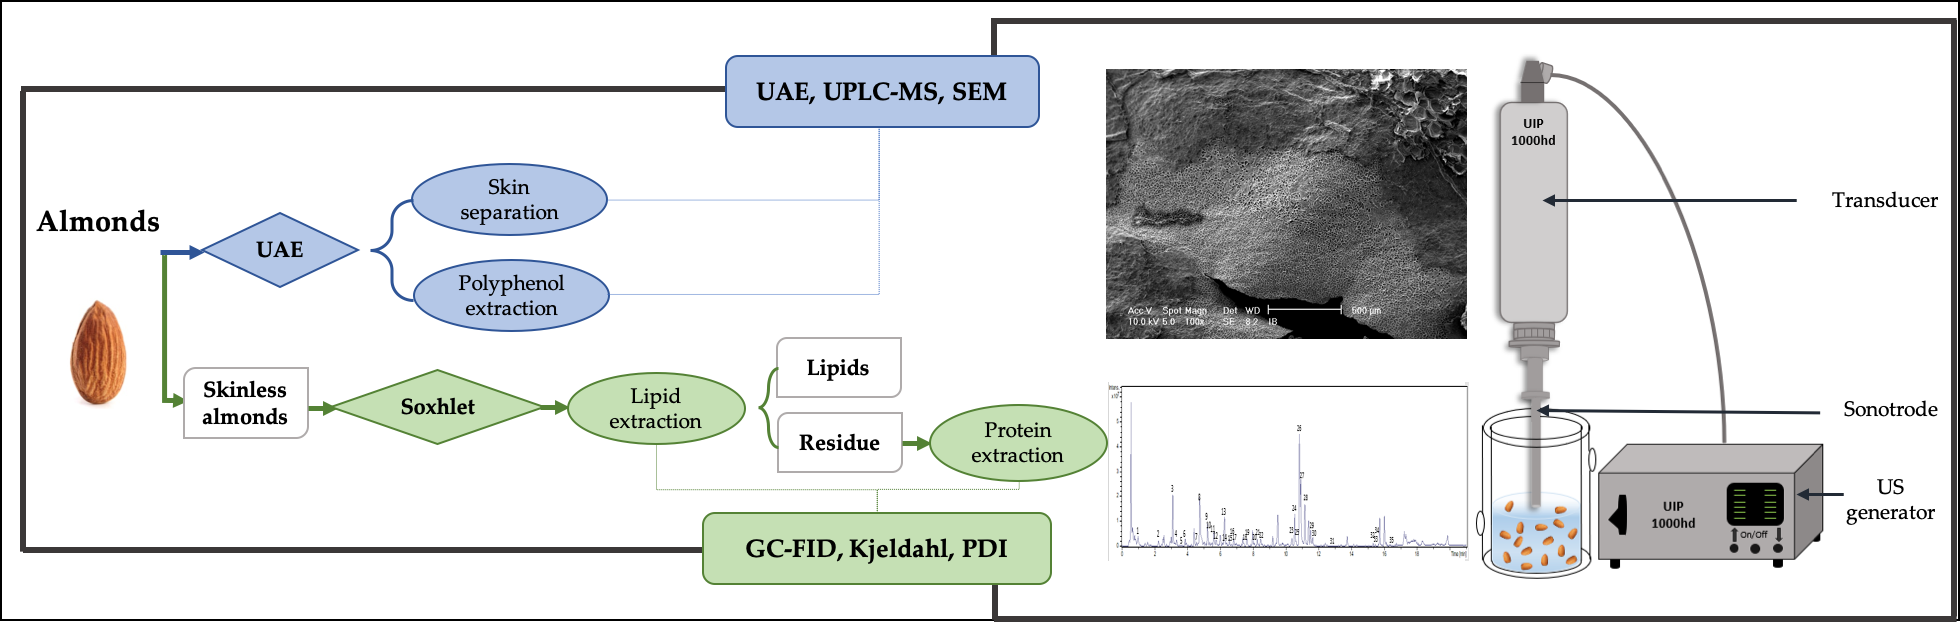
2.1.1. Extraction Procedures—UAE, Blanching

Californian almond kernels (Prunus dulcis) were provided by the supply service of GREEN laboratory (Avignon University, France). They were stored in sealed plastic packages and sheltered from light. Almonds used in all experiments were the Mission variety. Two main extraction processes were carried out: Ultrasound-Assisted Extraction (UAE) and Almond Blanching as the conventional process. UAE parameters (Ultrasound Intensity UI and Temperature T°) were determined based on the results provided by an experimental design (central composite design CCD). UAE was performed at low frequencies (20 kHz) with a 1000 W ultrasonic processor (UIP1000hd, Hielscher Ultrasonics, GmbH, Germany) equipped with an Ultrasound Generator and sealing to titanium sonotrode BS4d18 (length 125 mm, diameter 18 mm) (Figure 1).
In order to consider the power fraction converted to heat dissipated to the medium, calorimetric measurements were carried out to evaluate the real ultrasound power. The values of power were then calculated using Equation (1) [16]:
P = m   C p   d T d t
where m is the mass of solvent (g), Cp is the heat capacity of the solvent at constant pressure (J·g −1 K−1), and dT/dt is the temperature variation according to time. The applied ultrasonic power was then determined using the calculated power as given in the Equation (2) [16]:
U I = 4   P   D 2
where UI is the ultrasonic intensity (W·cm−2), P is the ultrasound power (W) calculated by Equation (1), and D is the diameter (cm) of the ultrasound horn.
Twenty grams of whole almond kernels were immersed in 100 mL of distilled water (1/5: w/v) and introduced in a double mantle reactor for twenty minutes. The desired temperature was maintained by a cooling system (Huber, Germany). For the blanching process, the same ratio 1/5 (w/v) was used. Following this, 100 mL of boiled distilled water and twenty grams of almonds were put into the reaction for five minutes. These two processes were compared to Non-Ultrasonicated Almonds (NUA) where the same ratio was used without stirring and without ultrasound and at the same temperature as for ultrasonicated almonds.
After treatment, almonds were kept apart for other uses at room temperature sheltered from light. The aqueous extracts were transferred in shaded glass flasks, freeze-dried for polyphenol analysis using freeze dryer (COSMOS – 80 °C/6 L + EDWARDS RV5 PUMP) and stored at +4 °C.

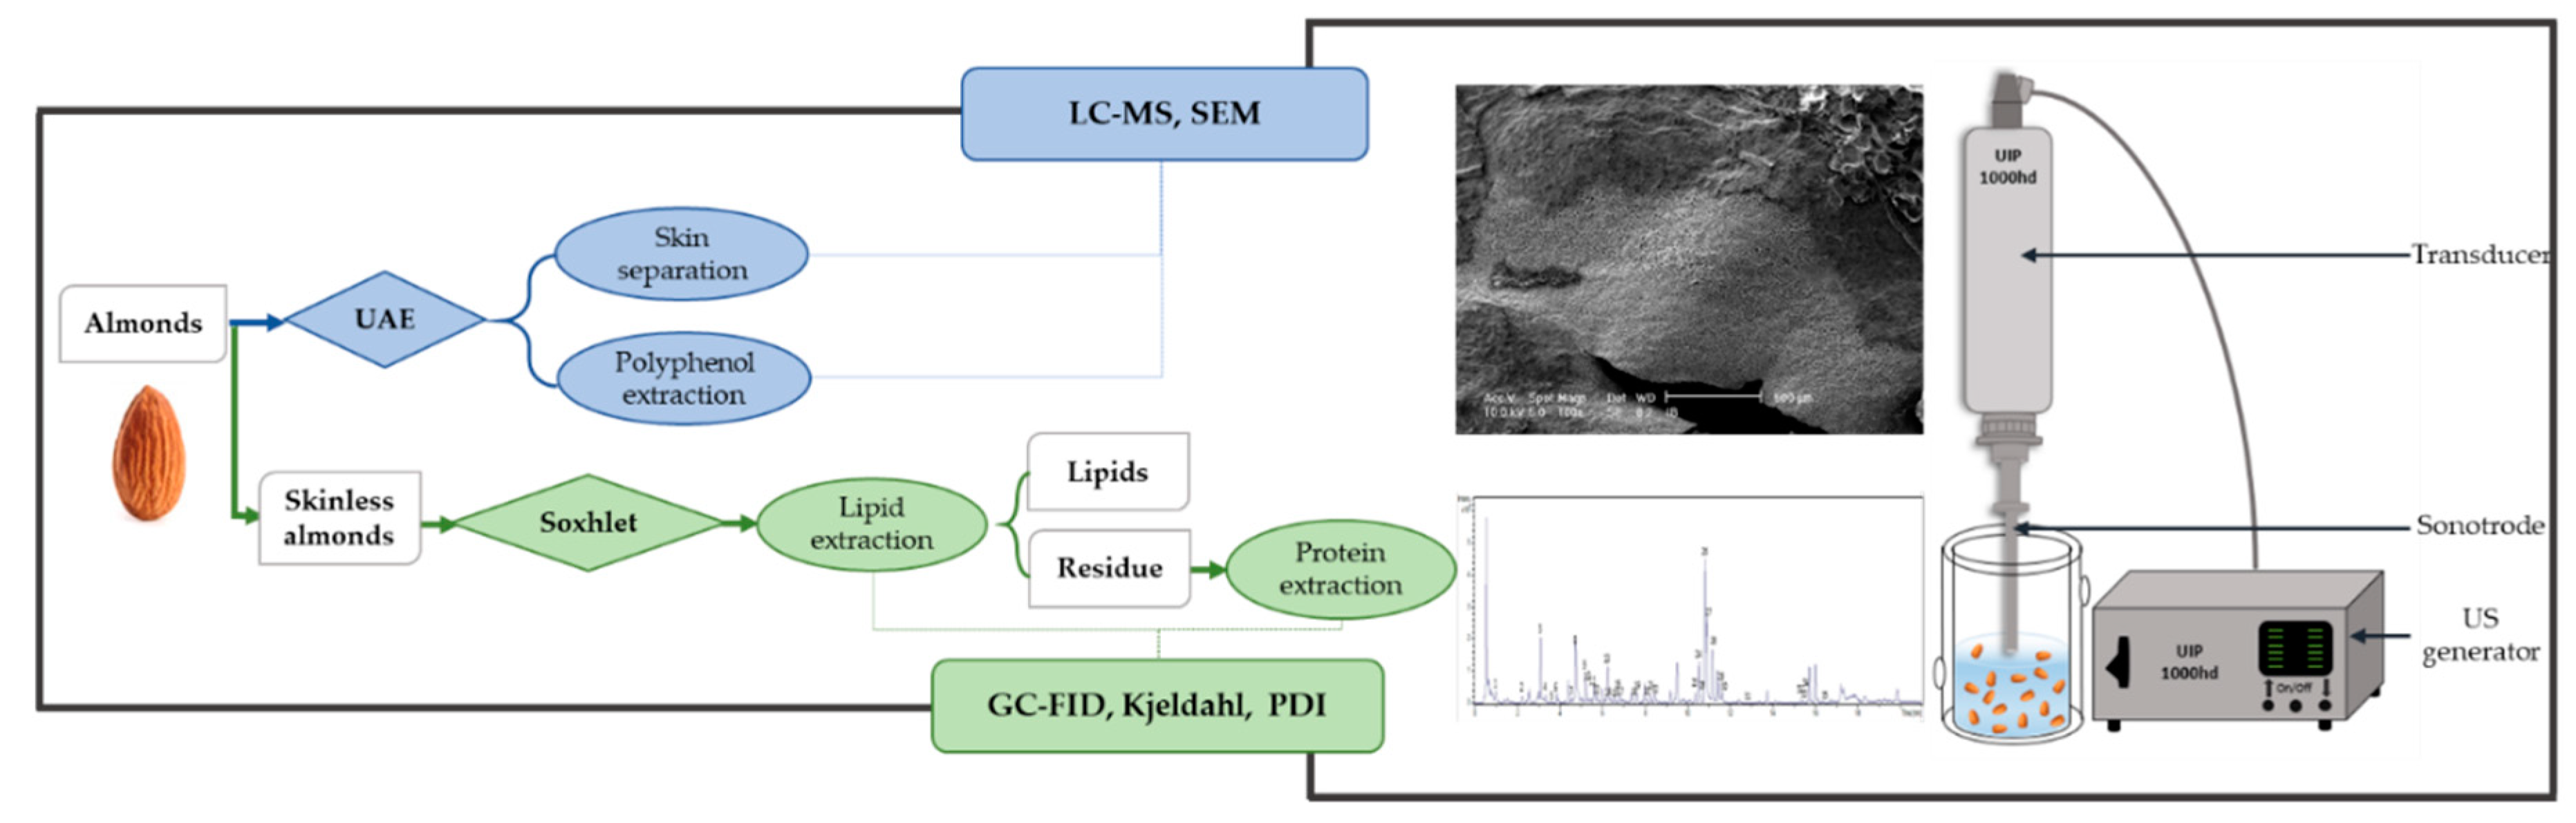
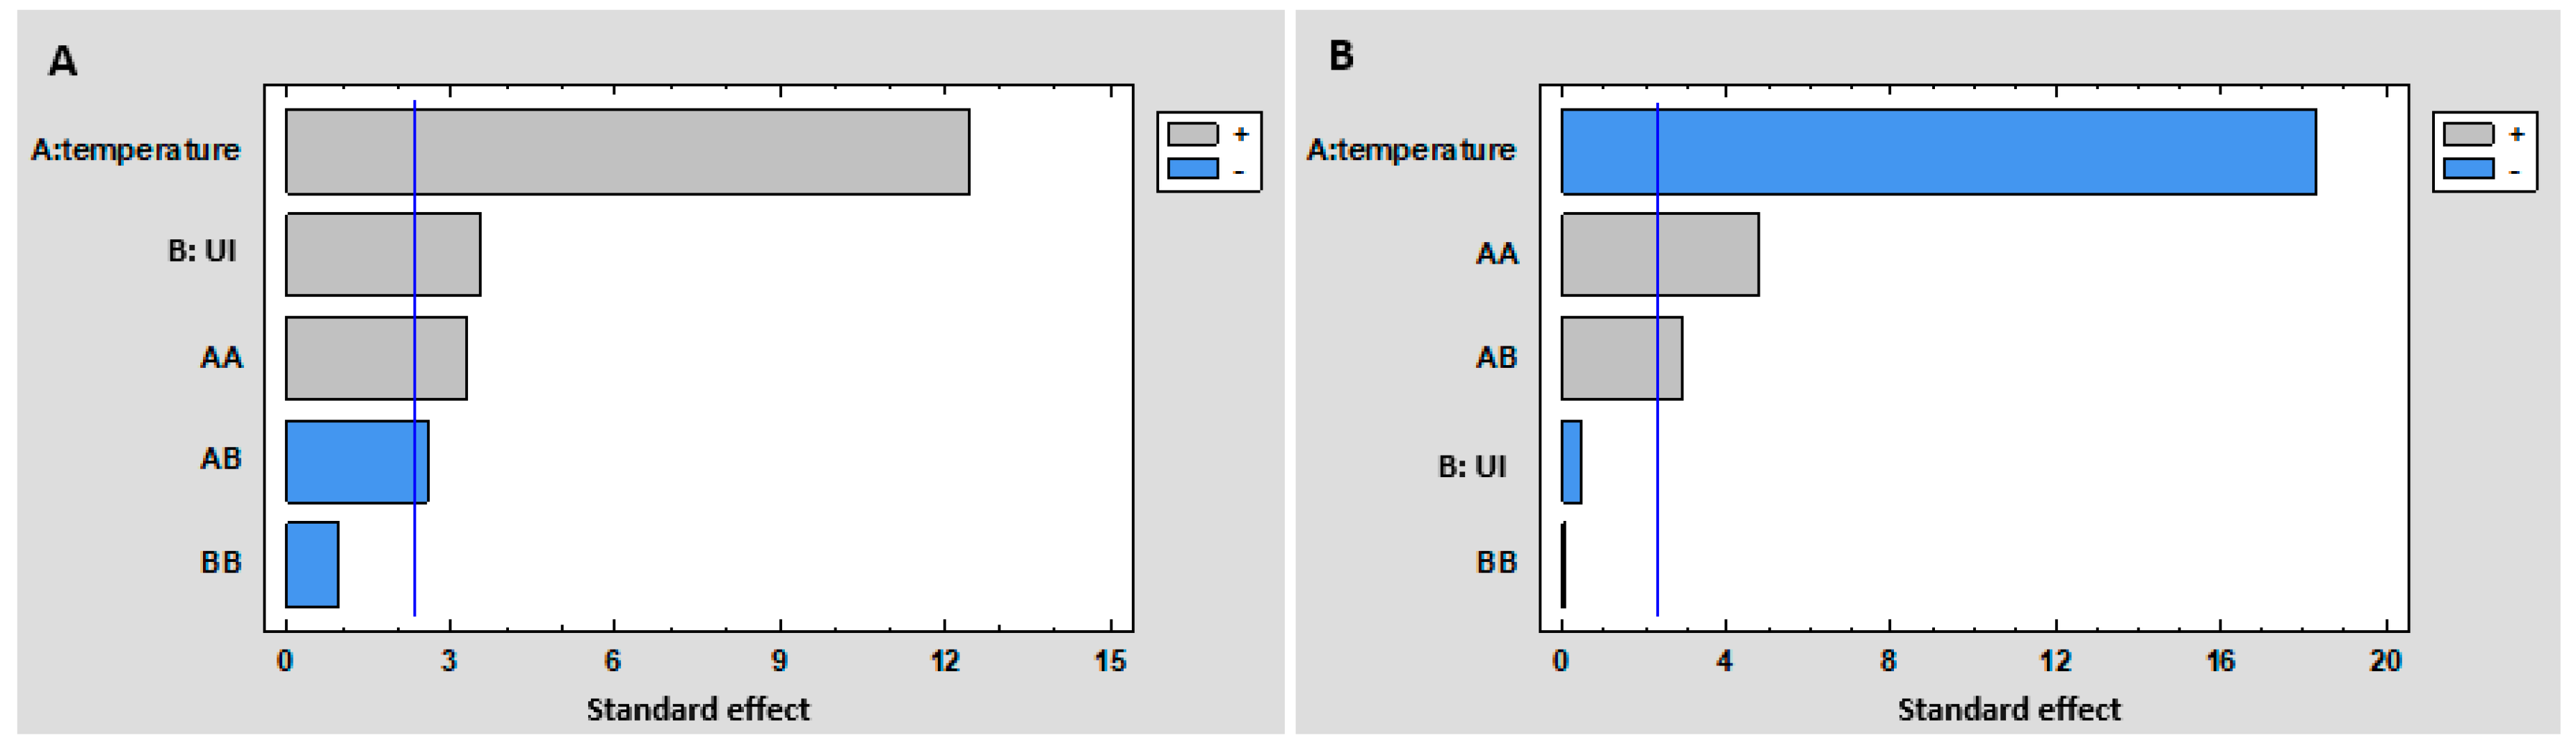
2.1.2. Central Composite Design (CCD)

Central Composite Design (CCD), also called Box-Wilson design, was used to evaluate the relevance of two controlled parameters in extraction process (ultrasonic intensity and temperature) and to assess interactions between variables. CCD was also performed to find responses for the highest polyphenol extract concentrations and optimum skin separation time. This study provides an exploration of the experimental domain studied using a two-level full factorial design (coded ±1), superimposed by central points (coded 0) and “start points” (coded ±α = 1.414), permitting a shortened number of experiments. Start points allow estimation of curvature. If the distance between the central points to a factorial point is ±1, the distance from the center of the design space to a star point is |α| > 1. The value of α depends on the number of experimental runs in the factorial portion of the central composite design. Limit values were chosen as a function of ultrasonic apparatus limitations (high ultrasound intensity damage the probe and reduce its efficiency) and protein extraction temperature (degradation above 55 °C). A range from 5.84 to 8.94 W.cm−2 was chosen to fit the limits of the ultrasonic device.

2.1.3. Kinetics

Kinetics study was performed at the CCD-selected parameters with ultrasound (ultrasonic intensity and temperature) and without ultrasound with the same solid/liquid ratio (1/5: w/v) using distilled water. The evolution of total polyphenol content (TPC) was analyzed every 30 s for the first two and a half minutes, then every 2.5 min for twenty minutes. All the samples were freeze-dried, stored at +4 °C. For analysis, they were mixed with 500 µL of an 80/20 solution of methanol/water (v/v).

2.1.4. Total Polyphenol Content (TPC)

The estimation of TPC was assayed by the ability to reduce Folin-Ciocalteu (F-C) reagent. All extracts from BA (Blanched Almonds), UA (Ultrasonicated Almonds, including CCD assays) and NUA were freeze-dried, then dissolved in 35 mL of an 80/20 solution of methanol/water (v/v). The method suggested by Singleton et al. 1999 [17] was used with some minor modifications: 50 µL of every sample extract, Naringenin standards and blank were put into reaction with 1250 µL of a 1/5 diluted solution of F-C reaction and 1000 µL of 10% Na2CO3. Solutions were incubated at room temperature (22 °C) for 30 min, sheltered from light. Absorbances were measured at 760 nm using a UV-spectrophotometer (UV-1800, Shimadzu, Japan). Results were expressed in equivalent mg Naringenin per gram of almonds. As for NA (Natural Almonds), skins were recovered as described by Mandalari et al. with some modifications [12]. Almonds were immersed in liquid nitrogen for 20–30 min twice and allowed to thaw at room temperature. The skins were then removed by hand and milled using IKA A11 basic miller with liquid nitrogen and stored at −20 °C prior to analysis.

2.1.5. Localized sonication—Scanning Electron Microscopy (SEM)

To assess precisely the impact of ultrasound on plant material, untreated almonds, immersed in distilled water, were individually exposed to an ultrasound probe at the optimum conditions provided by the CCD for twenty minutes. Half an almond kernel was fixed in a perforated disk with a central opening diameter of 1 cm. The disk containing the almond kernel was introduced in a double mantle reactor connected to a cooling system to maintain temperature at 20 ± 1 °C. The same volume of water and intensity were used. The distance separating almond skins to the ultrasonic probe was 0.2 cm. The same experimental process was used without ultrasound to achieve conventional procedure. All experiments were carried out in triplicate. Non-sonicated and sonicated almond kernels were studied using scanning electron microscopy (SEM).
The progressive effect of ultrasound on almond skin layers was assessed by Scanning Electron Microscopy (SEM, XL30, FEI Philips, France.). Samples were fixed on metal supports, stuck using carbon adhesive and covered with gold atoms. Almond skin samples were then observed using SEM.
All experiments were done in triplicate.

2.1.6. Ultra-High-Performance Liquid Chromatography—Mass Spectrometry

Polyphenol extracts were analyzed by Ultra-Performance Liquid Chromatography (UPLC) using an ACQUITY UPLC® system (Waters Corp., Milford, MA, USA) linked simultaneously to both a diode array detector 190–800 nm (UPLC DAD, Waters, Milford, MA, USA) and a Bruker Daltonics HCT (High Capacity Ion Traps) Ultra Ion Trap Mass equipped with an electrospray ion source (UPLC DAD/ESI-MSn). Analysis was carried out using an ACQUITY UPLC® BEH C18 column (100 mm × 2.1 mm, i.d, 1.7 µm; Waters Corp., Milford, MA, USA). The column temperature was set at 35 °C. The injection volume was fixed at 5 µL. The mobile phase was water containing 0.1% formic acid (solvent A) and Acetonitrile (solvent B) at the flow rate of 0.4 mL/min. Gradient conditions were as following: A, 99–75%, 0–14 min; A, 75–20%, 14–18 min; A, 20–0%, 18–19 min; A, 099%, 19–19.5 min.
The ion trap was operated in the Ultra Scan mode from m/z 100 to 1500. The ICC target was set to 100,000 with a maximum accumulation time of 50 ms. Nitrogen (99.99% purity) was used as the desolvation gas. The ionization was achieved using an ESI source in negative. The ionization source parameters were set as followed: dry temperature 365 °C, nebulizer pressure 50 psi, dry gas flow 9 L\min −1, capillary voltage −2 kV.
The chromatographic peaks were tentatively identified by their MS and MS2 mass spectra and when this was possible, by injection of standard. Quantification was performed with UV signal on the basis of the calibration curve of catechin, epicatechin, and vanillic acid at 280 nm, chlorogenic acid at 330 nm, isorhamnetin, kaempferol, and naringenin at 360 nm. Other compounds for which standards were not available (procyanidins, heterosides) are expressed as equivalent of the injected standards.
Polyphenols content: 15 ± 1 mg of ultrasonicated almond UA, non-sonicated almonds NUA and natural skin NS freeze-dried extracts were mixed with 0.6 mL of MeOH–0.2% of formic acid. The mixtures were put in small tubes, vortexed and sonicated for 5 min each. After centrifugation, supernatants were injected for analysis. Samples from blanched almond extracts BA were mixed with 0.8 mL of MeOH–0.2% of formic acid and were diluted twice before injection.
Procyanidins content: procyanidins in the four extracts were quantified as described by Kennedy et al. 2011 [18] with some modifications. The following protocole was used: first, A solution of 0.2 N HCl in MeOH, containing 50 g/L phloroglucinol and 10 g/L ascorbic acid was prepared. Second, 15 ± 1 mg of lyophilized extracts (blanched almonds BA, ultasonicated almonds UA and non-ultrasonicated almonds NUA) and natural almond skin (NS) were mixed with 400 µL of the previous solution. The procyanidin of interest was reacted in this solution at 50 °C for 20 min. The reaction was then stopped with 400 µL of ammonium formate solution (12.6 g/L). After stirring and centrifuging, the supernatant was diluted twice and injected for analysis.
Procyanidin concentration (PC) in almond skin was calculated as shown in the following equations [19]:
PC = ([upper and extension units]M + [end units]M)
PC = ([cat P] − [cat C]) + ([epicat P] − [epicat C]) + [Phloroglucinol–cat/epicat]
where [cat p] and [epicat p] are the concentrations of catechin and epicatechin after phloroglucynolysis, [cat C] and [epicat C] are the concentrations of crude catechin and epicatechin before treatment, and [Phloroglucinol–cat/epicat] is the concentration of phloroglucinol-catechin + phloroglucinol-epicatechin.
In addition to the concentration of procyanidins, this reaction allows to determine the mean degree of polymerization (mDP), the average number of units in the polymer. Mean DP of procyanidins in the four extracts was calculated according to Equation (5) [19]:
m D P = [ upper   and   extension   units ] M   + [ end   units ] M [ end   units ] M  

2.2. Almond Oil

Oil extraction: Almond oil was extracted from 15 g of almond flour (natural almonds, blanched almonds and ultrasonicated almonds) using 170 mL of hexane (VWR). The extraction lasted 8 h and was performed using Büchi Extraction System B-811 (automatic Soxhlet, Büchi, Germany). Hexane was evaporated and the extracts were stored at +4 °C sheltered from light.
Preparation of Fatty Acid Methyl Esters (FAMEs)—Transesterification: FAMEs were prepared according to Breil et al. 2016 [20] method. Then, 12 to 15 mg of every oil sample were added to 1 mL of methanolic sulfuric acid (5%). The mixture was heated in a heating bloc for 90 min at 85 °C to facilitate transmethylation. After reaching room temperature, 1.5 mL of sodium chloride solution (0.9%) and 1 mL of n-hexane were added. The solution was then stirred for 30 s and the organic layer was collected for GC analysis. Triheptadecanoin (C17:0; TAG) was used as an internal standard and Supelco 37 Component FAME Mix was used to calibrate the system.
GC-FID Analysis: Transesterified oil samples extracted from natural almonds NA, blanched almonds BA and ultrasonicated almonds UA were analyzed by Gas Chromatography coupled with a flame ionization detector (GC-FID) system. The system was equipped with a BD-EN14103 capillary column with dimensions 30 m × 320 µm × 0.25 µm. The carrier gas (He) velocity was set at 33 cm.s−1. The sample injection volume was 2 µL and two washes with n-hexane were executed to avoid carryovers after every sample run. The detection was enabled in split mode (split ratio 1:20), the injection temperature was set at 250 °C. The oven temperature gradient was initially 50 °C for 1 min, then increased at a constant rate of 20 °C/min from 50 °C to 180 °C, and then raised from 180 °C to 220 °C at a rate of 2 °C/min. Once it reached 230 °C the temperature was maintained for a period of 10 min and the fatty acids methyl esters were identified based on retention time and standards used for calibration.

2.3. Almond Proteins

In order to understand UAE effect on almond proteins, the remaining almonds from the previous extractions were recovered and their proteins were extracted.
Protein extraction: pure protein extracts from almonds were extracted according to Janssen et al. 2017 [21] with some modifications from the defatted almond flour (obtained after Soxhlet extraction, dried at room temperature). Thus, 10 g of each sample was mixed with 100 mL of phosphate buffer (pH 7.4) and stirred with a magnetic stirrer for one hour. The mixture was centrifuged at 9000 rpm for 20 min and filtrated using a Büchner filter. The filtrate was put in dialysis membranes for 48 h then for 3 h to remove molecules (including proteins) with an atomic mass unit below 10 kDa. The samples were afterwards put in the freeze-dryer to get purified proteins for electrophoresis analysis.
Electrophoresis: To determine the molecular weight distribution of soluble proteins, Sodium Dodecyl Sulfate-Polyacrylamide Gel Electrophoresis (SDS-PAGE) was used. Molecular weight distribution of almond proteins of NA, UA and BA was evaluated under reducing (with 2-mercaptoethanol) and non-reducing conditions (without 2-mercaptoethanol). This was executed to evaluate the impact of initial treatment or processing on the almond protein profile. Under reducing conditions, the soluble protein 2 mg/mL in milli-Q water was denatured by addition of equal volume of Laemmli sample buffer (65.8 mM Tris-HCl at pH 6.8, 26.3% (w/v) glycerol, 2.1% SDS, 0.01% bromophenol blue, 5% 2-mercaptoethanol) at 90 °C for 5 min. The electrophoresis was run in a Bio-Rad mini-PROTEAN system using TGX pre227 cast gels (4–15%). The same protocol was adopted without 2-mercaptoethanol for non-reducing conditions.
Protein Dispersibility Index: PDI determines the dispersible protein in soybean products under the conditions of the test. It is a means of comparing the solubility of a protein in water.
Total protein: nitrogen content in almond samples (%total protein) was analyzed by Kjeldahl (Büchi speed digester K-425 system) and the protein content in liquid fractions (%water dispersible protein) was calculated by Lowry method with BSA as standard. The defatted almond flour protein quality was evaluated according to the quality analyses manual for soybean products in the feed industry [22] where the Protein Dispersibility Index (PDI) was calculated:
P D I = %   w a t e r   d i s p e r s i b l e   p r o t e i n × 100 %   t o t a l   p r o t e i n  

2.4. Diffusion Model

The diffusional theory on the basis of Fick’s second law was utilized to model the extraction kinetics of phenolics from almond skin. Prior to modeling, several assumptions were made as follows:
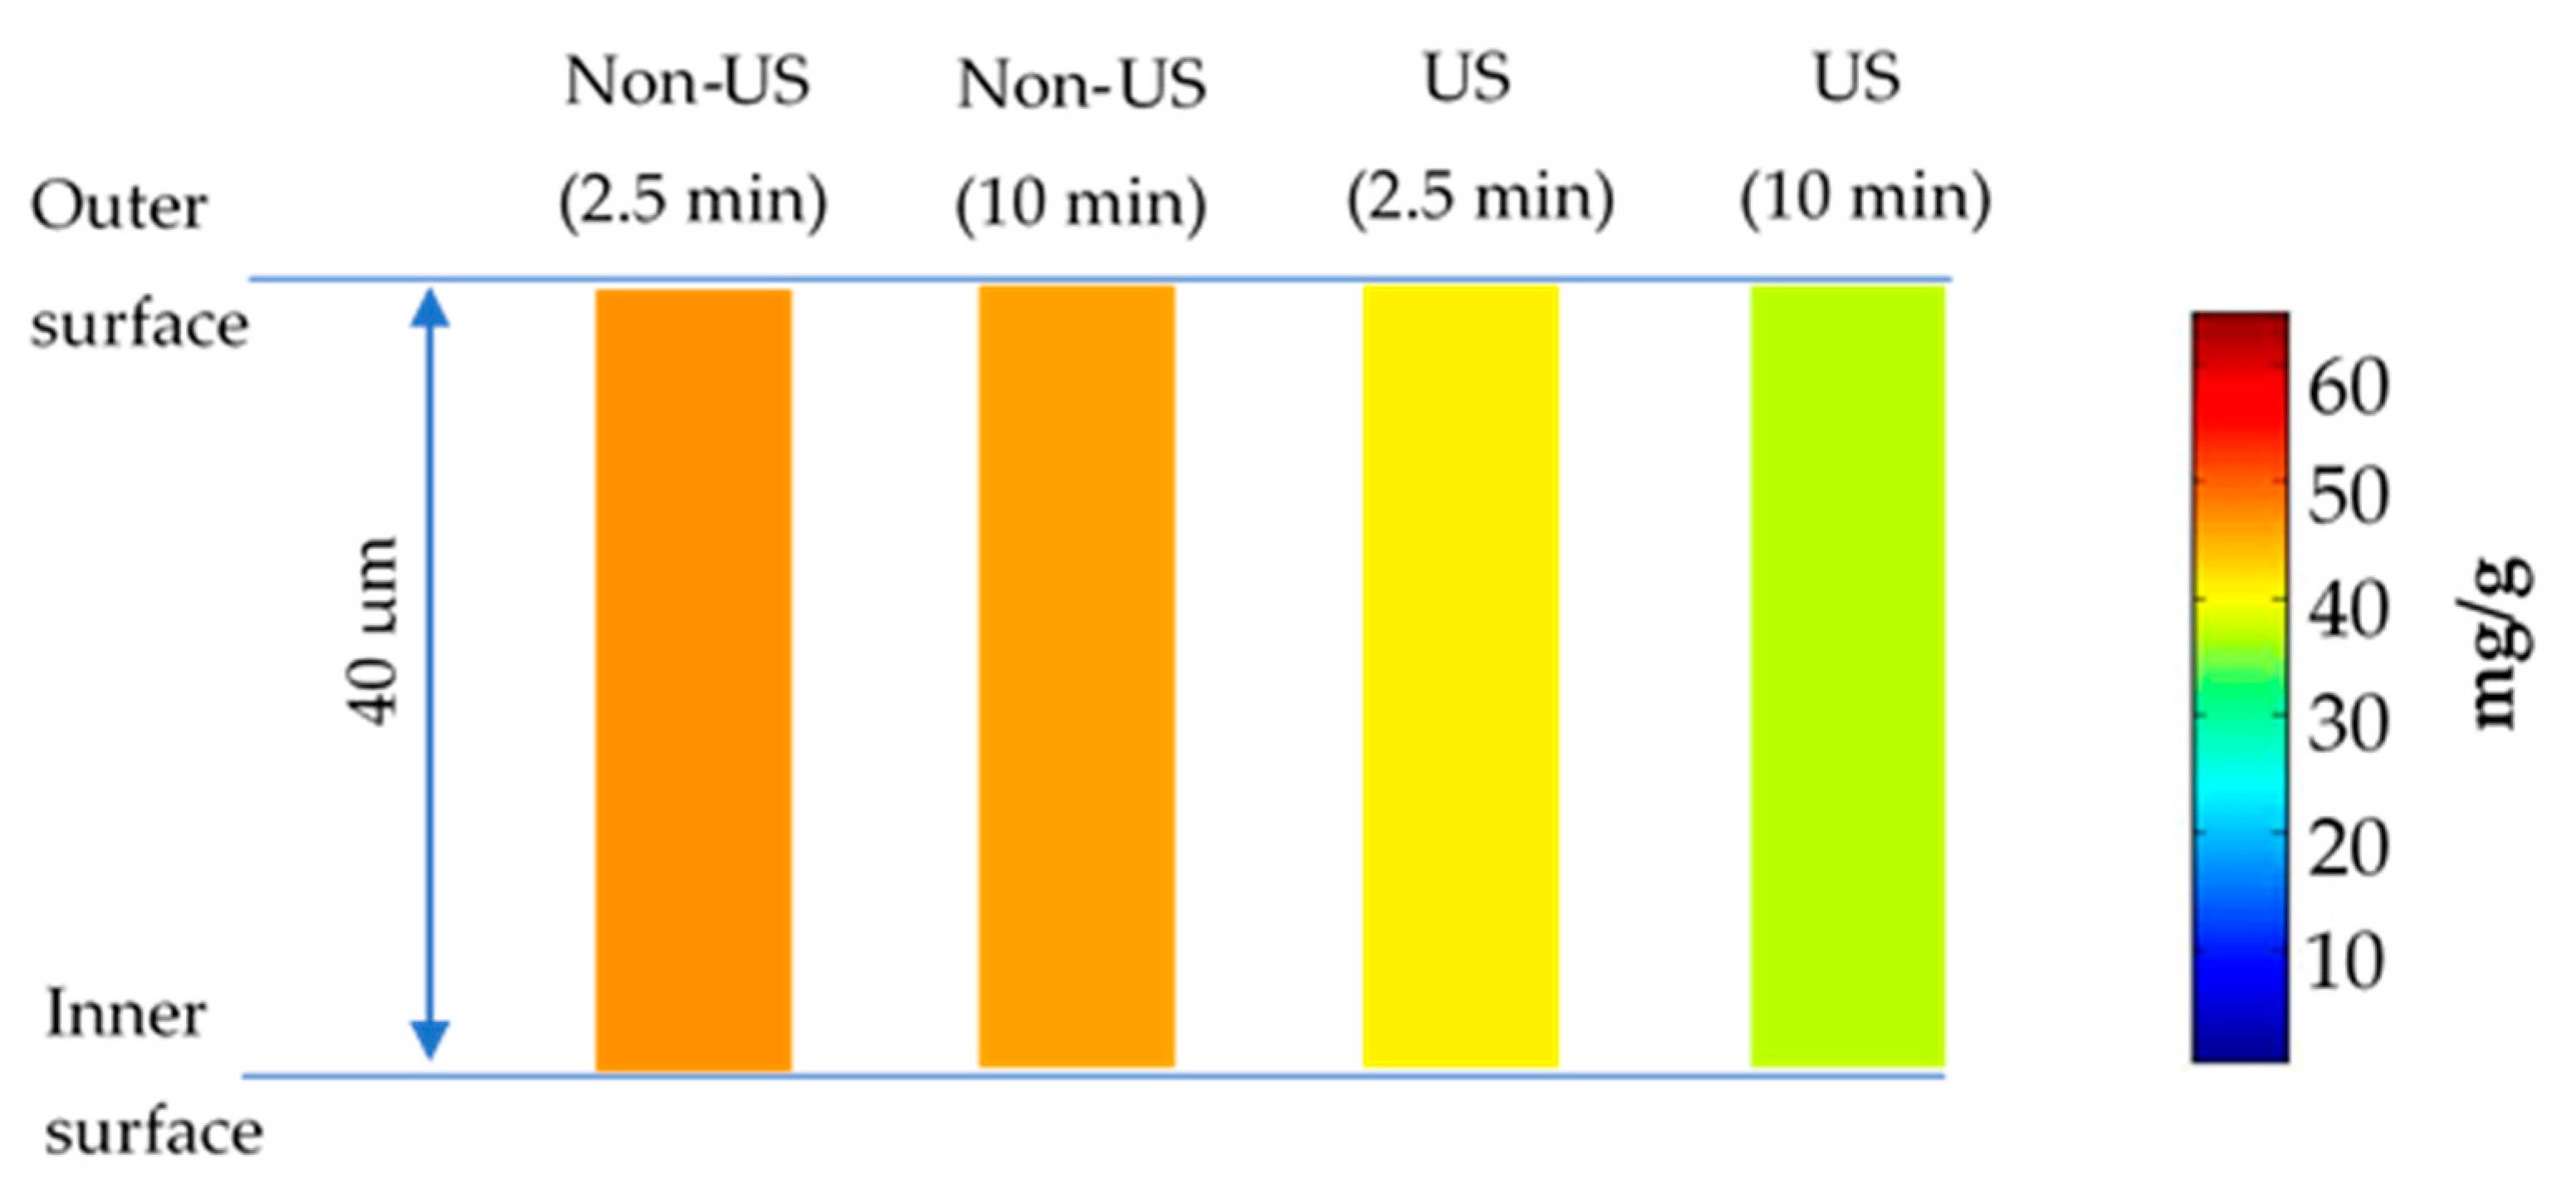
  • Almond skin was considered as slab geometry due to the low thickness value (40 μm on average measured by a vernier caliper). Phenolic transfer within almond skin took place in one direction from the inner surface to the outer surface, and the thickness value of almond skin referred to the mass transfer distance [23];
  • Phenolics were distributed homogeneously within almond skins before extraction;
  • Phenolic diffusivity kept constant during extraction, and phenolic content in almond skin varied with position and time;
  • External mass transfer resistance was neglected due to sonication or periodic stirring at each sampling time.
Accordingly, the governing equation and initial and boundary conditions for the diffusional model specifying slab geometry are written as:
C s t = D e C s 2 x 2
Cs = CsCL = 0 t = 0
C s x | x = 0 = 0
D e A C s ( x , t ) x | x = L l = V d C L ( t ) d t
where Cs is the total phenolic content in almond skin (mg/g), Cs,o is the initial phenolic content in almond skin, being 40 mg/g almond skins, t is time (min), De is effective diffusivity of phenolics (m2/s), x is the mass transfer distance (m), CL is the total phenolic content in the solution (mg/L), A is the surface area of almond samples used for each extraction (m2), L is the thickness value of almond skin, V is the volume of solvent used for each extraction (mL). The partial differential equations were solved using pdepe function in Matlab. For this purpose, the De value was changed iteratively to minimize the root mean square error (RMSE) between experimental and predicted contents of total phenolics in almond skin [24]:
R M S E ( m g g ) = 1 n i = 1 n [ C S , p ( t ) C S , e ( t ) ] 2
where CS,e and CS,p is the experimental and calculated values of total phenolic content in almond skin (mg/g), respectively. n refers to the number of experimental data.
To further validate the accuracy of diffusional model, R2 (coefficient of determination), RMSE and mean relative deviation modulus (%) were calculated based on the data about extraction yield after the optimization of De [25]:
R 2 = 1 i = 1 n ( Y e Y p ) 2 i = 1 n ( Y e Y m ) 2
R M S E ( m g g ) = 1 n i = 1 n [ Y p ( t ) Y e ( t ) ] 2
E   ( % ) = [ i = 1 n ( | Y e Y p | ) / Y e n ] × 100
where Ye and Yp are the experimental and predicted extraction yields of total phenolics (mg/g). Ym is the average extraction yield of total phenolics determined experimentally (mg/g). Then, the distribution of phenolics within almond skin during extraction were visualized by program coding in Matlab.

3. Results and Discussions

3.1. Polyphenols

3.1.1. Experimental Design
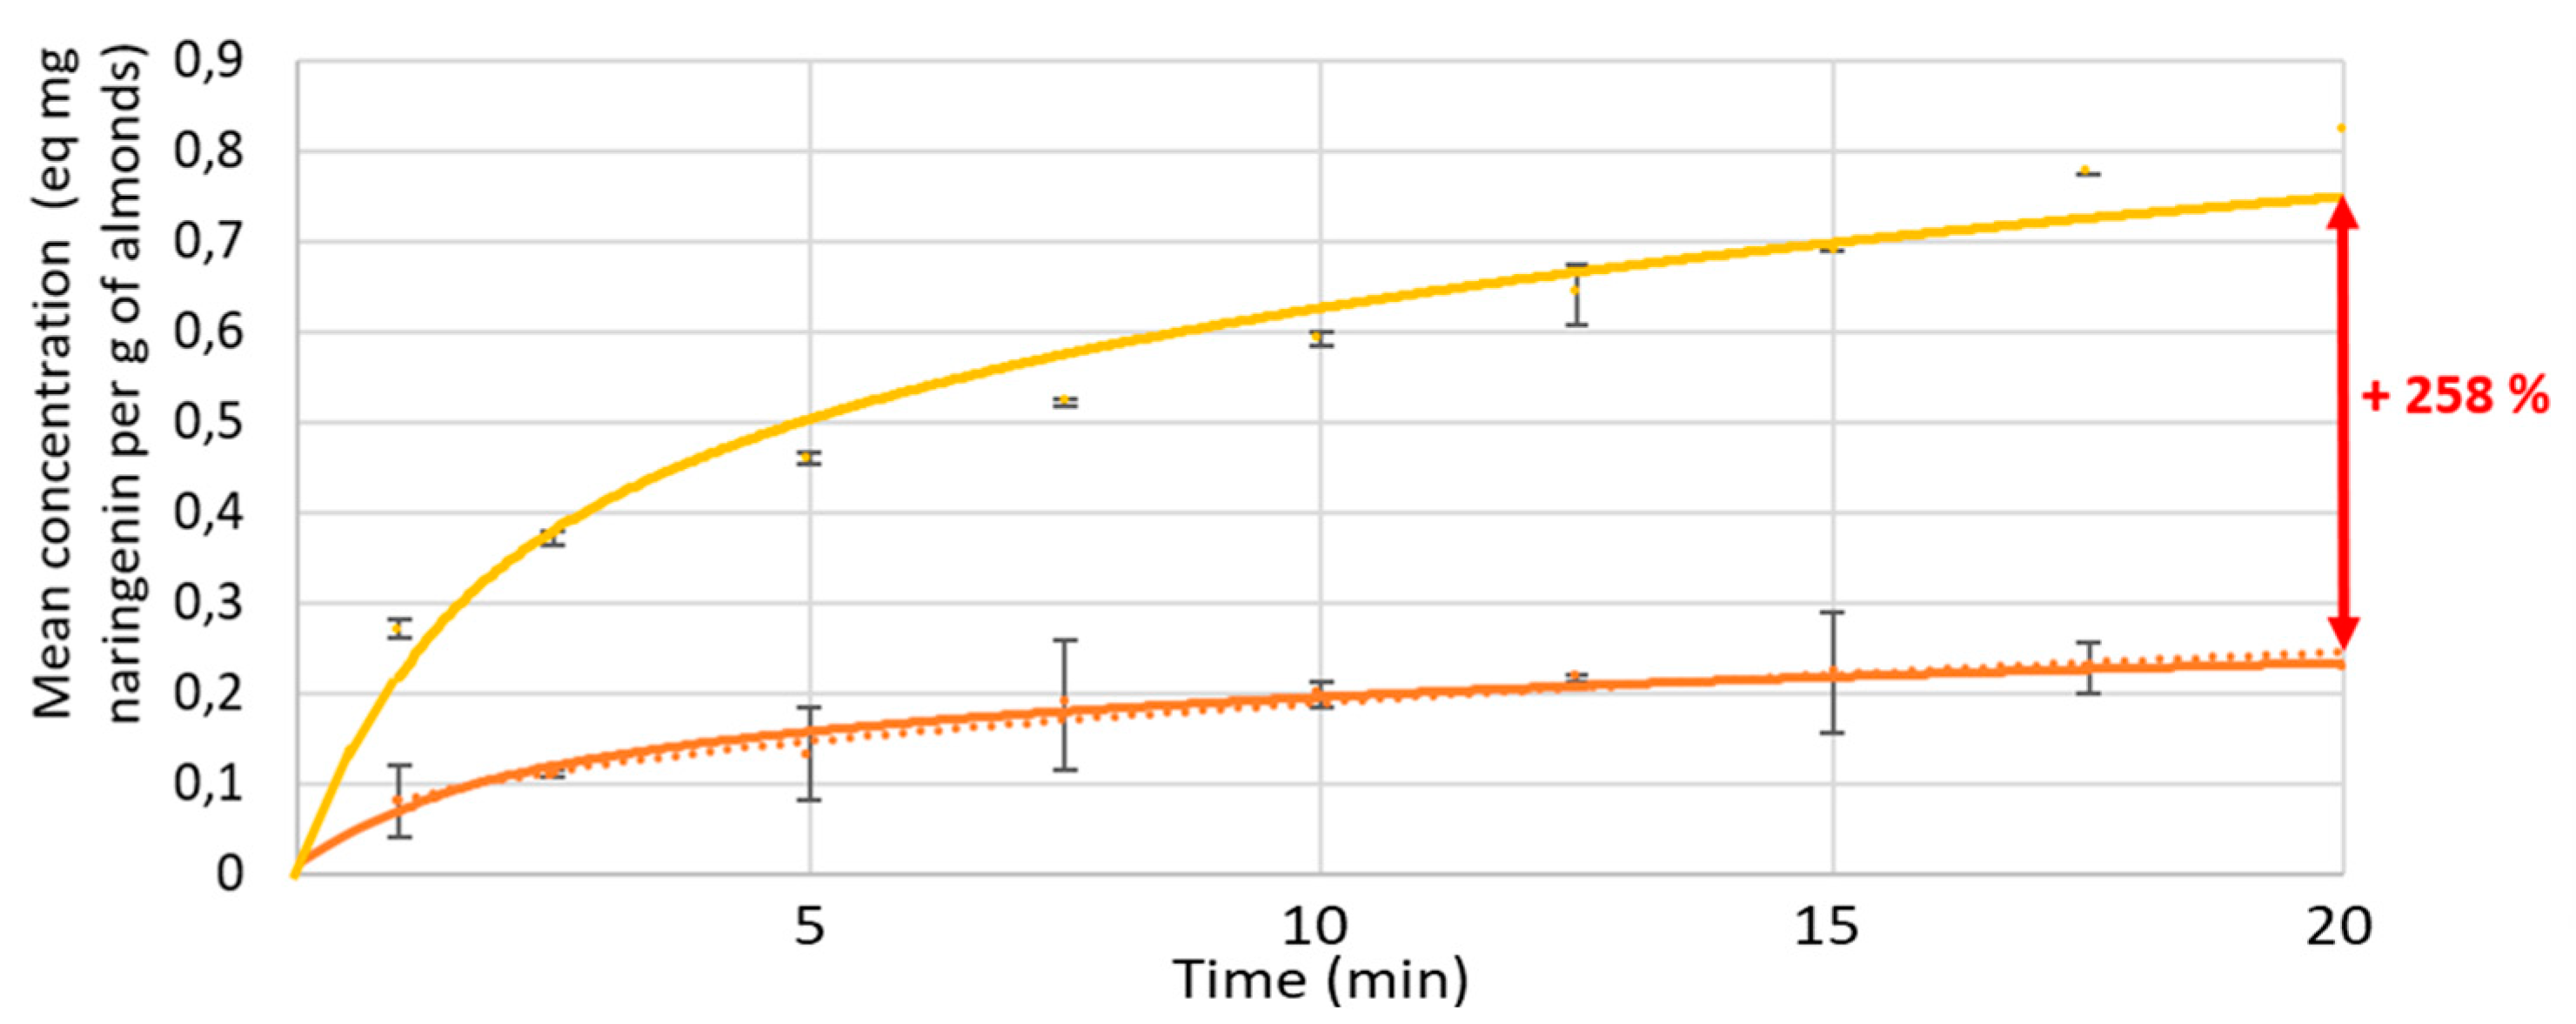
Ultrasonic power and temperature are the variables involved in the CCD that could potentially affect polyphenol extraction efficiency in order to evaluate and optimize ultrasound extraction of polyphenols (TPC) and almond skin separation time (SST). According to CCD experiments provided by STATGRAPHICS, experiments were performed at maximum UI 9.47 W.cm−2 to fit the limits of the ultrasonic device, and at temperatures between 18 °C and 61 °C. In fact, relatively low temperatures were a necessity to avoid the destruction of organic compounds (such as proteins) and to allow future applications in the pilot scale. Finally, at the lowest temperature and intensity, skin separation starts at 20 ± 3 min of reaction. In doing so, ultrasonication duration of experiments was fixed at 20 min.
In order to explore the influence of the operating parameters required during the extraction, a CCD was used to analyze the total polyphenol content (TPC) and the skin separation time (SST).
Fully coded experiments and responses obtained for each run of the CCD are represented in Table 1. Responses vary according to the system variables (from 0.024 to 0.063 of mg naringenin equivalent for a gram of almond, and from five to twenty minutes of skin separation time). Similar results for experiments 2, 4, 7 to 9 and 13 (central points) are indicators of data quality and statistical reliability of key variables.
Significance and suitability of the design were studied using an analysis of variance (ANOVA). The statistical significance of each effect (including interaction terms, linear, and quadratic effects) was determined using the probability p (p-value) given in Table S1.
CCD responses were optimized to get optimum conditions for experimentation. Higher TPC and optimum SST (calculated by STATGRAPHICS—multi-response optimization) were achieved with 9.47 W.cm−2 at 18.8 °C. Temperature was rounded to 20 °C.
Pareto graphics are represented below (Figure 2) to visualize the significant relationship linking levels of variables and responses obtained (TPC and SST). Results displayed in Figure 2A have shown that the temperature of the system had a positive and highly significant effect on polyphenol extraction, which is far more effective than the UI. The lack of significance of the cross-product terms (BB: UI2) suggests the absence of interactions between variables. As for Figure 2B, temperature indicated a significant yet negative effect on SST. UI has no significant effect in this case, in addition to its cross-product, implying the absence of interaction between them.
A coefficient of determination (R2) of 95.88% for TPC and 97.87% for SST implied this polynomial model was fully competent to predict the response.

3.1.2. Kinetics

To evaluate the influence of ultrasound-assisted extraction in optimized conditions (9.47 W.cm−2 and 20 °C) obtained from the response surface method, a comparison study was carried out between ultrasonic and non-ultrasonic extractions.
From Figure 3, it is possible to observe that TPC yield increased in both cases, more for sonicated almonds than for non-sonicated almonds. As stated by these results, TPC yield was 258% higher with UAE (0.820 ± 0.028 Eq mg Naringenin per g of almonds) than the control without ultrasound (0.228 ± 3.4 × 10 −17 Eq mg Naringenin per g of almonds) after 20 min of extraction. This comparison reveals a clear improvement of the extraction, which is mainly attributed to ultrasonic cavitation, since the treatment has been achieved at room temperature (25 °C).

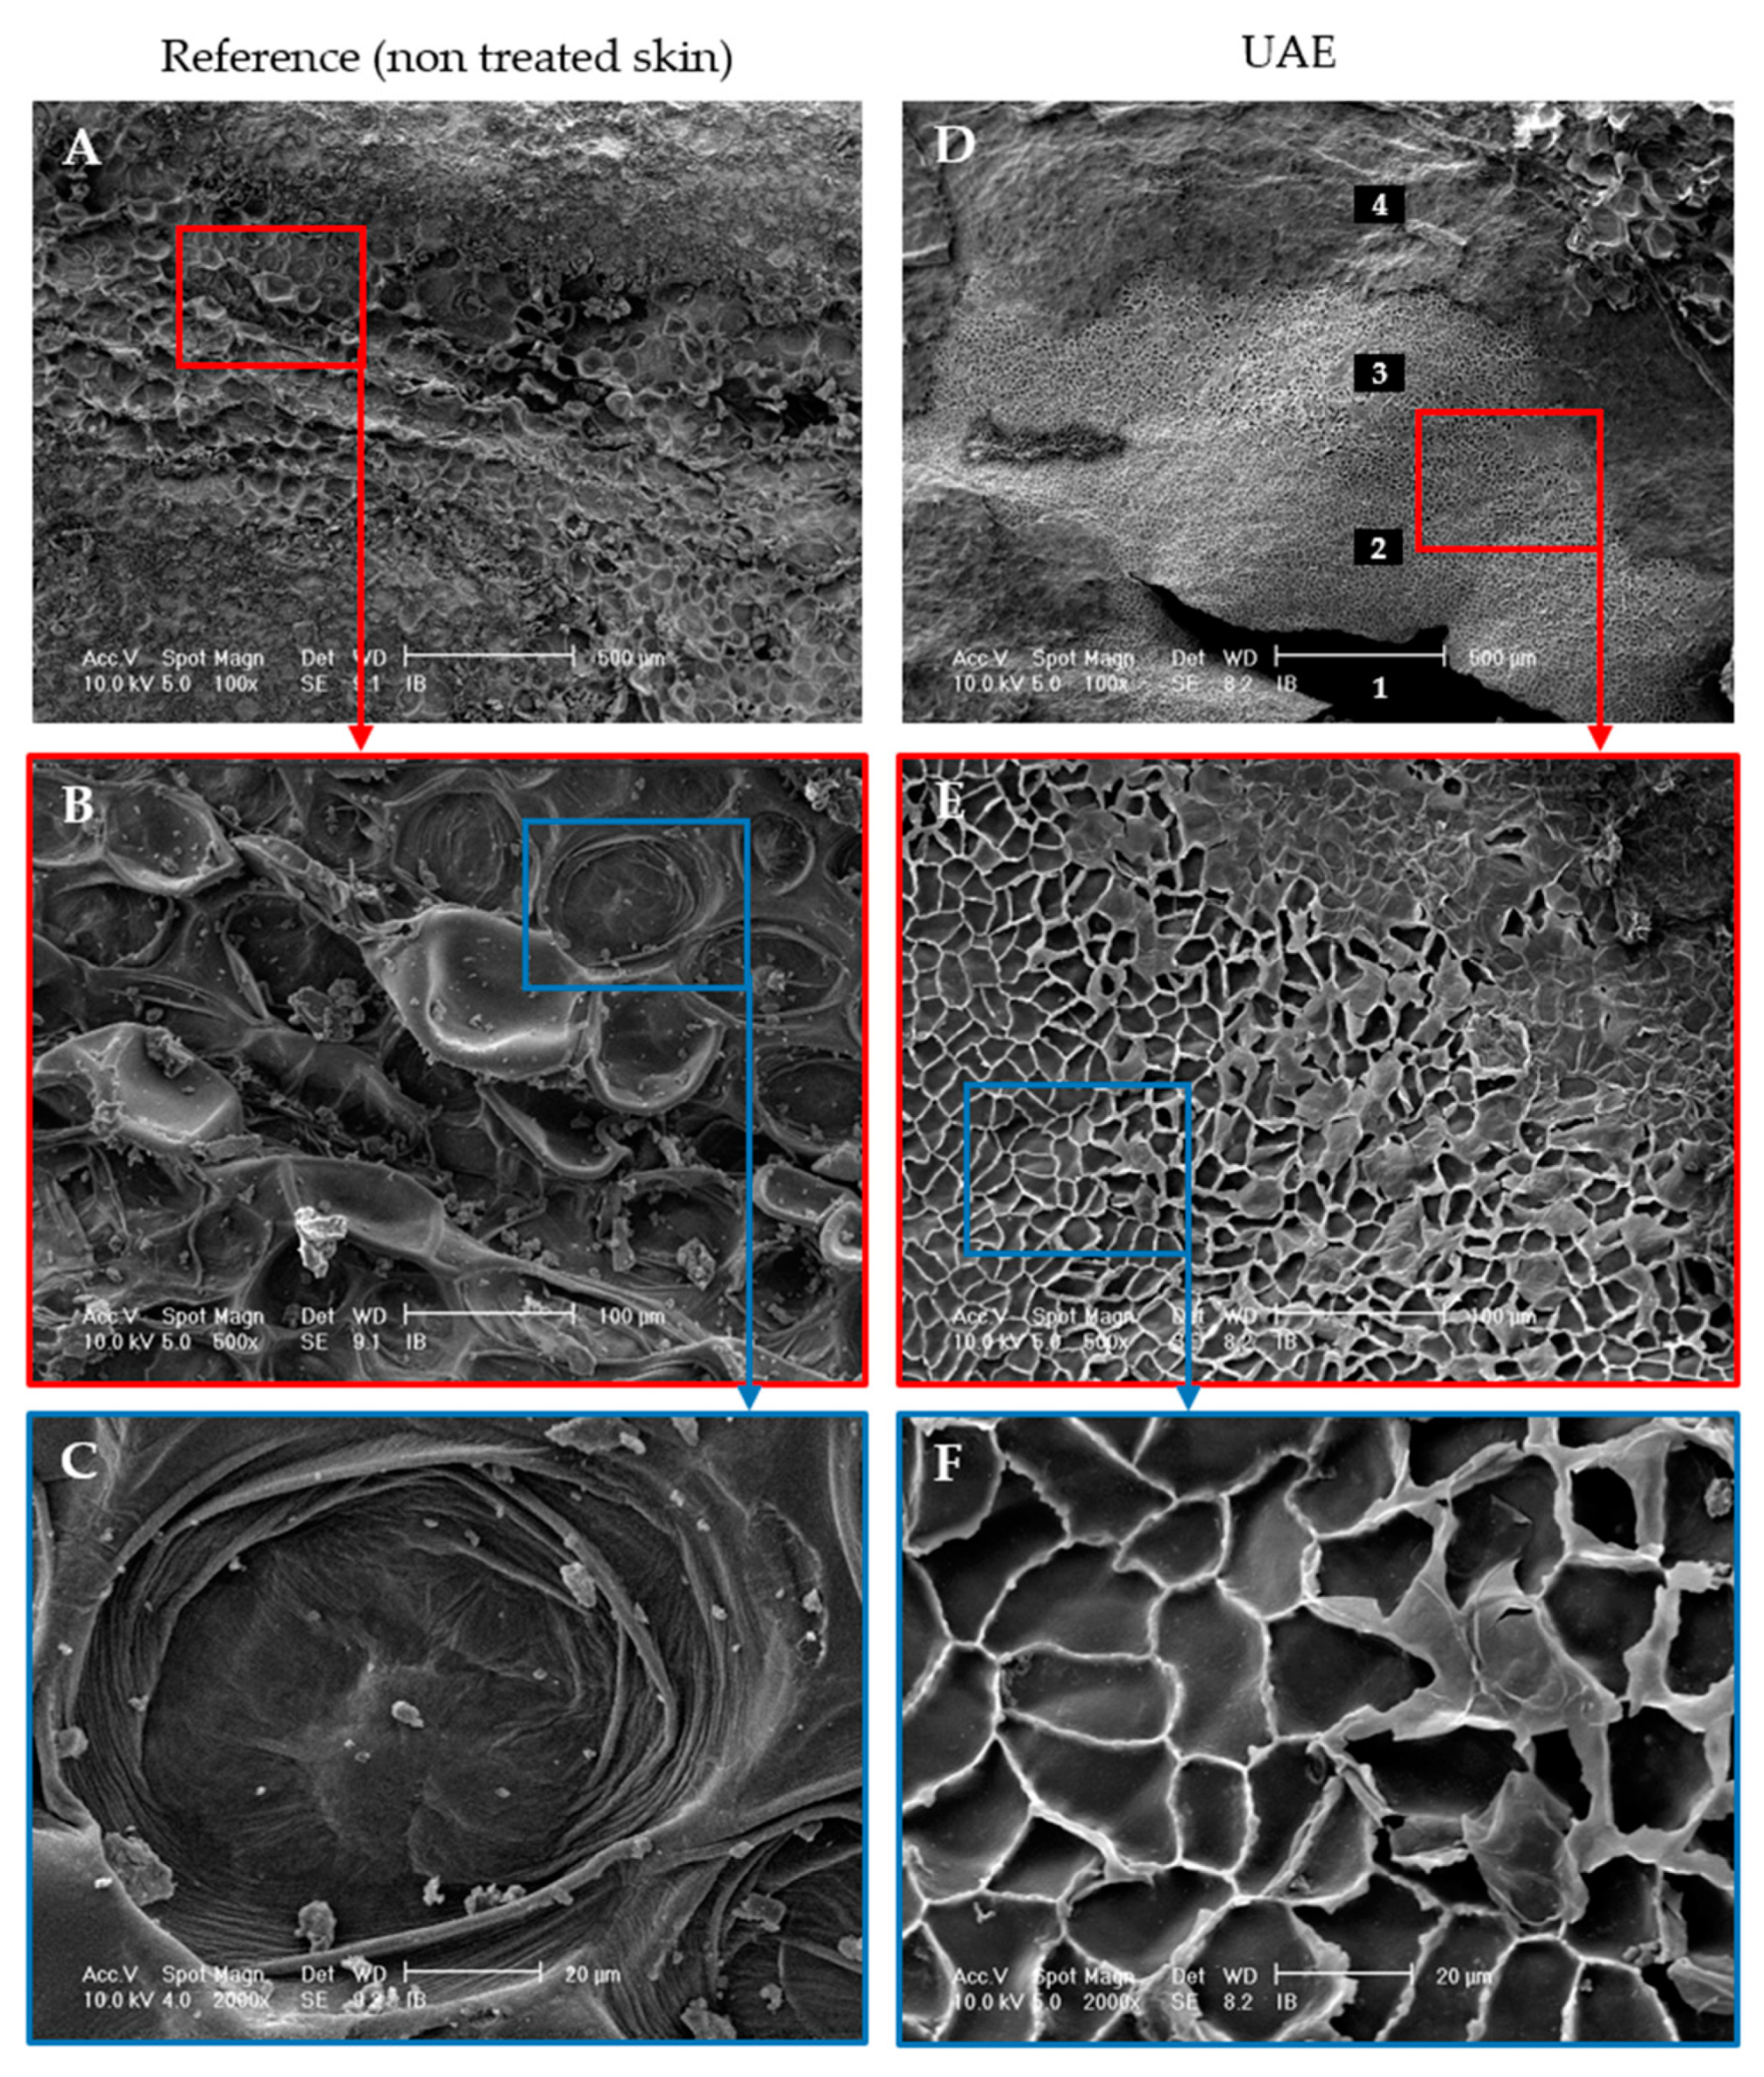
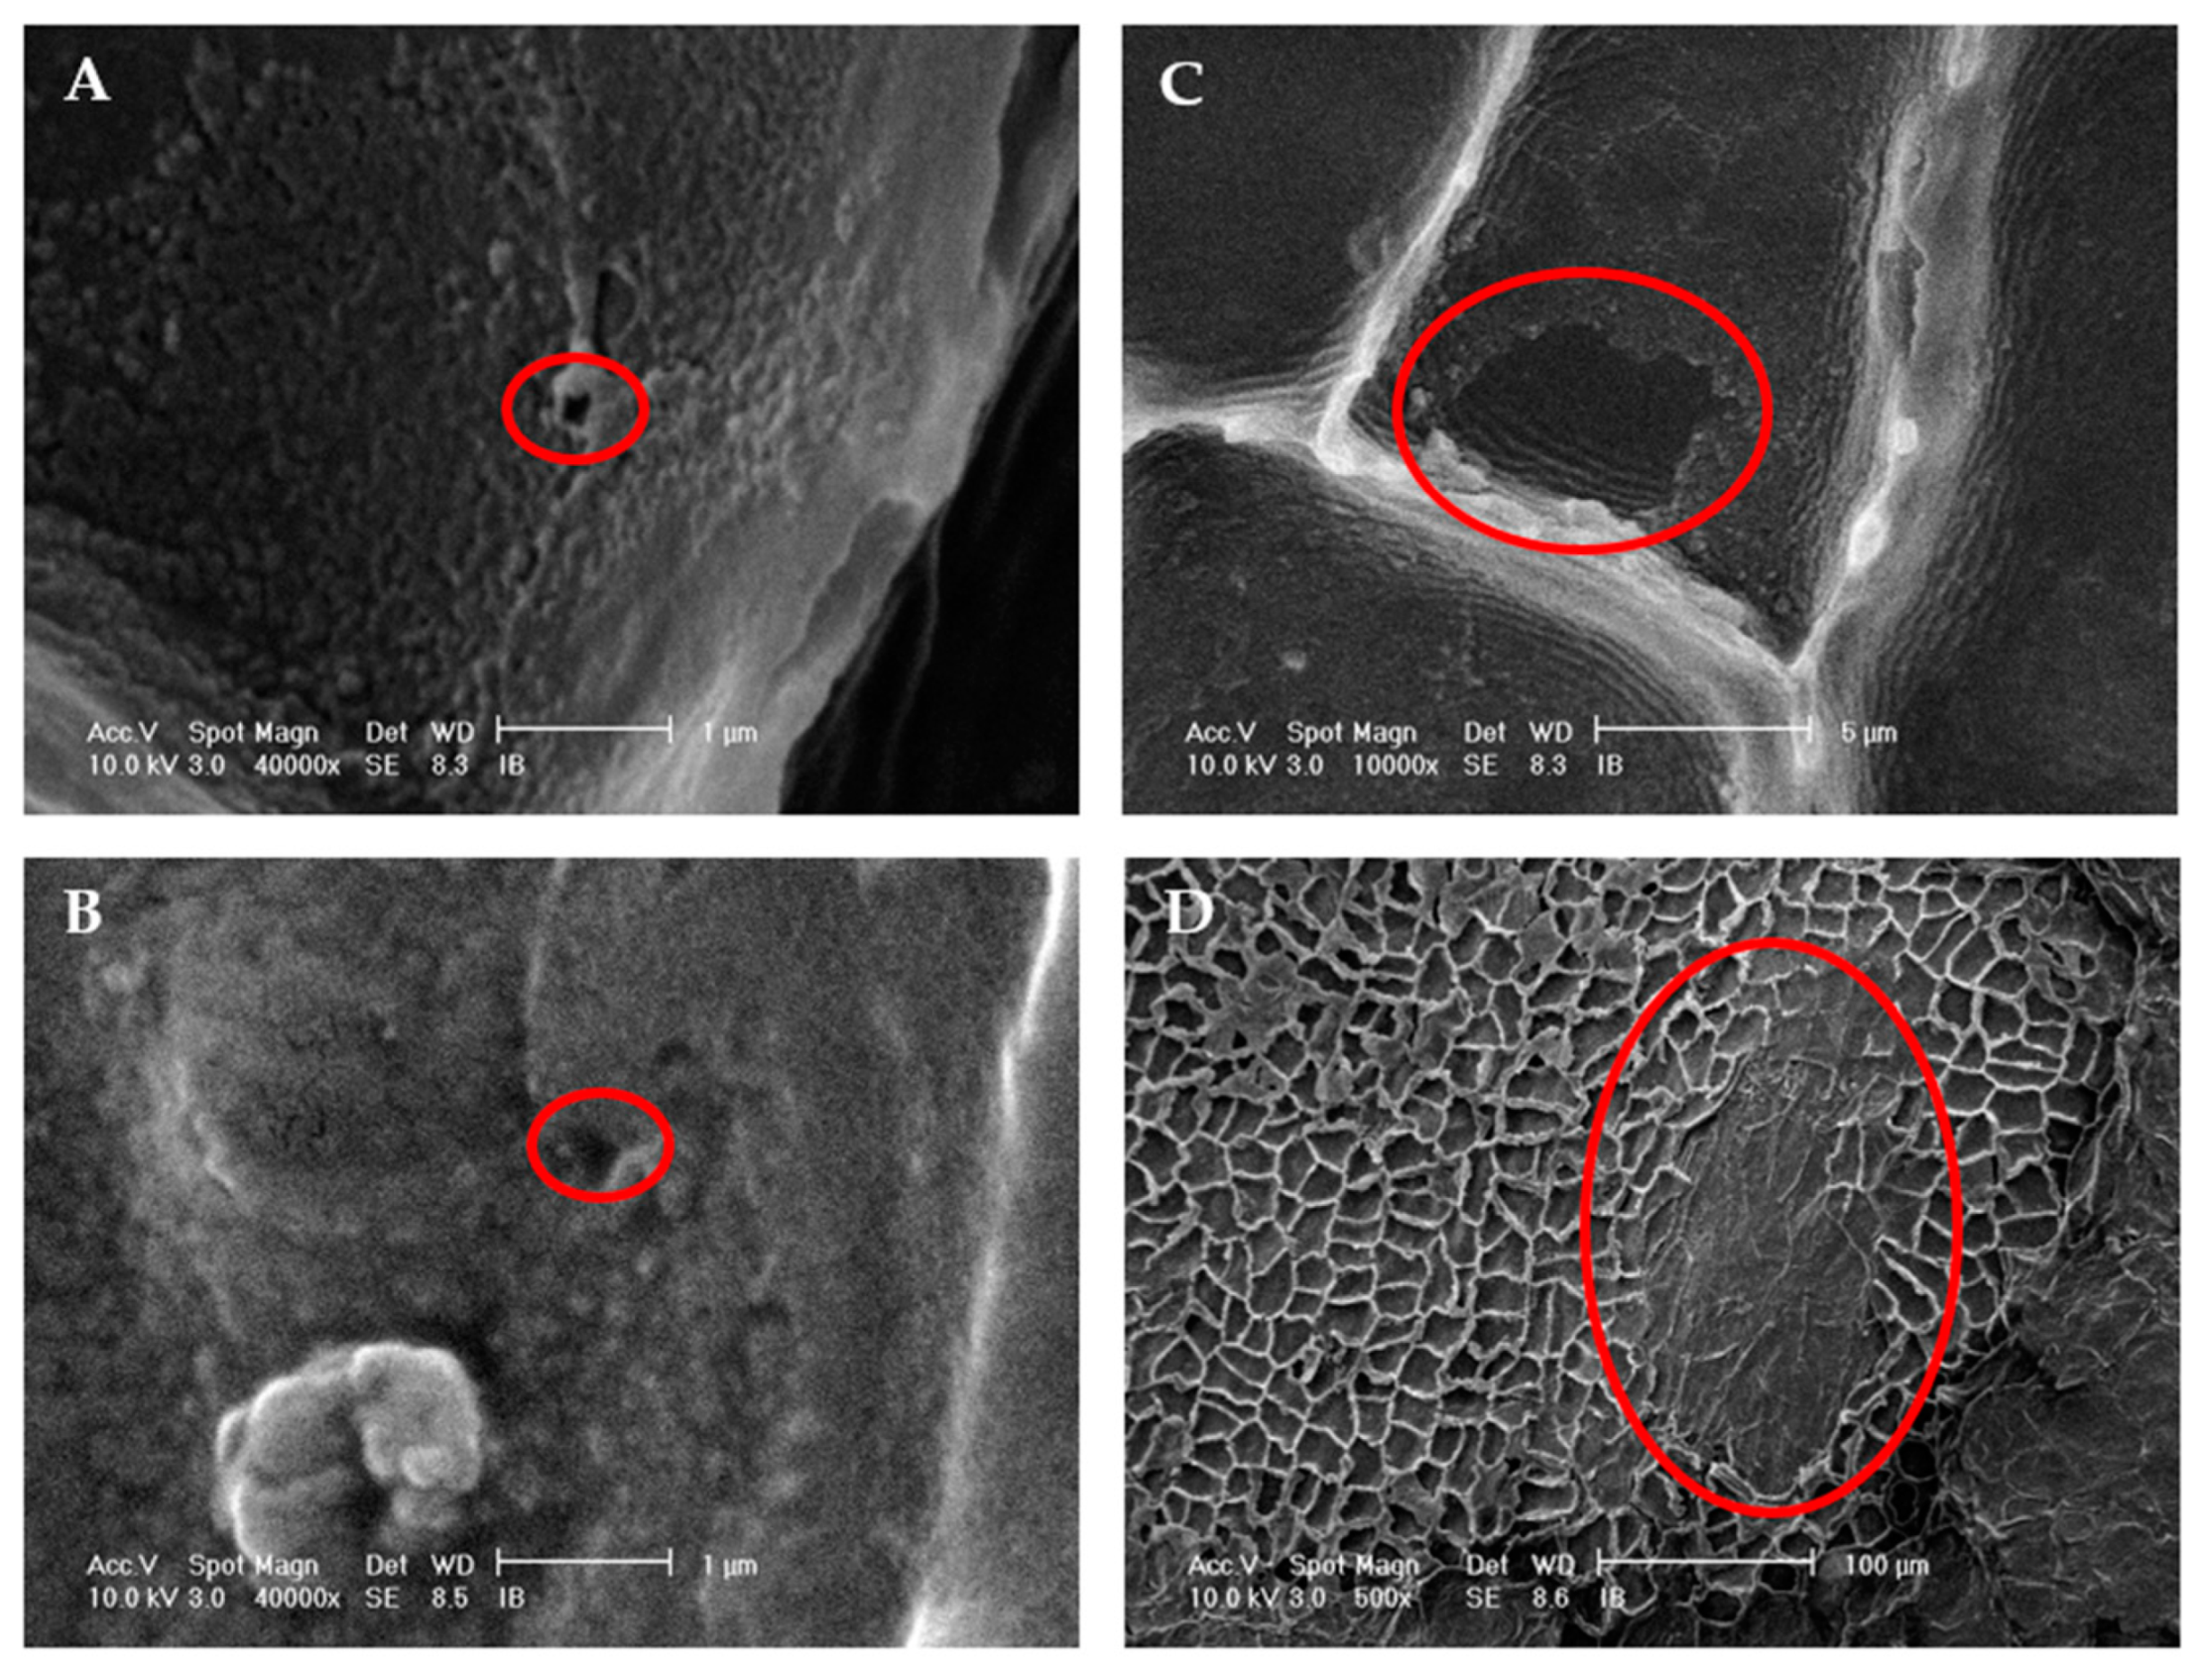
3.1.3. Ultrasound Effect on Almond Skins Microstructure

Almond skin microstructure after ultrasonication was investigated using SEM (Figure 4 and Figure 5). As revealed in Figure 4, SEM observations provided information about the destruction of skin layers. Figure 4D showed that ultrasound effects are progressive. Thus, two main ones were detected: fragmentation and cell erosion. These effects are as follows: (1) fragmentation of all almond skin layers, (2) cell erosion: elimination of parenchyma cells, cuticle & upper aleurone cell walls, (3) cell erosion: elimination of parenchyma cells and cuticle + partial elimination of upper aleurone cell walls, (4) Cell erosion and elimination of parenchyma cells; almond skin layers are described in Mandalari et al. 2010 paper [12]. Further SEM images are illustrated in Figure 5 showing primary (< 0.5 µm) and secondary effects (> 1 µm), also called sonoporation, in addition to erosion of cell walls after 20 min of sonication. In fact, the primary effects constitute zones of nucleation, acting by themselves as nucleation sites, facilitating the formation of bubbles, and hence promoting the erosion of the surface. The formation of new bubbles increases as a function of time. Fleeting bubbles then collapse at one “acoustic cycle distance” from the nucleation site and create an accumulation of impact areas. These effects lead to the interconnection of cracks constituting the bigger damaged zones [26,27].
As a result, the alterations caused by ultrasound on the almond skin cells explain the presence of cellular content (polyphenols) that have been extracted. Increasing treatment time effects positively TPC extraction yields. Theses latter were investigated and analyzed using Ultra-High-Performance Liquid Chromatography (UPLC).

3.1.4. Quantification of Phenolic Compounds in Almond Skin

Flavanols occurred as monomers, oligomers, and polymers, the latter also called procyanidins (A-type and B-type dimers, trimers, tetramers and pentamers), which are the main compounds in almond skin. Monomeric units include mainly Catechin and Epicatechin. Various procyanidins were identified despite the Ultra Scan mode with m/z 1500 as a maximum. Procyanidin quantification was performed after phloroglucinolysis. In addition to the concentration of procyanidins, this reaction allows to determine the mean degree of polymerization (mDP). Catechin and Epicatechin were also observed linked to hexoses [10]. Small amounts of non-flavonoids such as vanillic acid and chlorogenic acid were identified. Vanillic acid was linked to two hexoses, probably glucose and/or galactose. Flavonols are either linked or not linked to sugars (glucose and/or rhamnose and/or galactose). Two main flavonols were quantified: isorhamnetin and kaempferol. Compounds identified belonging to flavanones include Naringenin its 7-O-glucoside. Table 2 summarizes the content of phenolic compounds in (µg/100 g of almond) identified in natural skin (NS), non-Ultrasonicated almonds (NUA), Ultrasonicated almonds (UA) and blanched almonds (BA) extracts. Procyanidins content in the four samples is remarkably the highest, followed by Isorhamnetin-3-O-rutinoside.
Analysis of the products formed in the presence of phloroglucinol revealed that three major products were formed: phloroglucinol-catechin + phloroglucinol-epicatechin (A), catechin (Cat) (B), and epicatechin (epicat) (C) (Figure S3). Procyanidin concentration (PC) in almond skin was calculated as shown in the Equations (3) and (4) [19].
Considering NS as a reference, UAE is the most efficient technique to extract phenolic compounds (33.45%) comparing to other extractions (4.1% and 8.3% for NUA and BA, respectively). Using solvents (methanol in this case for natural skins) appears to be more efficient for polyphenol extraction compared to ultrasonication, but this latter is certainly eco-friendlier and better environmentally speaking since water was used as a solvent, and no heating is necessary. UAE could be a very interesting substitute for polyphenol use in cosmetic and pharmaceutical industries.
For almond blanching, we have noticed that the amount of polyphenols extracted is low compared to natural almonds. Results in Mandalari et al. paper [12] presented that blanched skin is rich in polyphenols compared to blanching water. This can be explained by the low diffusion of polyphenols, since heat does not affect their stability [28]. Another statement in Boussetta et al. paper [29] showed that heat appears to be an effective method for polyphenol extraction. The low diffusion can be explained by the short-time exposure to the high temperature (5 min), leading to a low concentration of polyphenols extracted. The percentage of phenolic compounds extracted with the reference method is negligible (4.08%) due to low temperature (20 °C) and the absence of stirring, thus low diffusion.
These previous results can be supported by mDP. For NS, NUA, UA and BA, mDPs were 8, 7, 7 and 5, respectively. It could be noted from these results that high temperature used for blanching depolymerized procyanidins and reduced the mean polymerization degree from 8 to 5. Clearly, procyanidins amount in almond skin is the highest among other compounds, in addition to flavanols in their aglycone forms. As a matter of fact, procyanidins represent 90.50%, 83.71%, 87.91% and 67.47% of total polyphenols extracted for each almond skin extracts (in NA, NUA, UA, and BA, respectively). Flavonol glucosides were also abundant and represented the second most important phenolic compound in the four extracts.

3.2. UAE Effect on Almond Oil

In order to understand ultrasound effect on almond oil, the remaining almonds from UA, BA, and NA were recovered and used up with their fat using automatic Soxhlet extraction with n-hexane. Yields and fatty acid profile were then compared.
According to Table 3, heat treatments do not alter almond oils. Visibly, the yield of extracted oils between conventional and ultrasonic system comparing to natural almonds remained stable with an average of 53% of total almond oil extracted. Fatty acid (FA) profile was constant as well; oleic acid (C18:1 n9) was the most abundant FA in the samples studied with 71%, followed by linoleic acid (C18:2 n6) with ~20%, palmitic acid (C16) with ~6%, stearic acid (C18) with ~1.1%, and palmitoleic acid (C16:1) with ~0.5%. Across all previous research articles that probed the fatty acid profile of almonds, oleic acid was found to be the major FA with 57.54% to 73.94% [30,31]. Considering these results, UAE presents the advantage of being a non-destructive extraction technique since it does not damage essential fatty acids which could be used for its numerous health benefits [32].

3.3. UAE Effect on Almond Protein

Analysis of protein in treated and non-treated almonds was performed by comparing their total protein content and their amino-acid profile. Results of protein content from NA, BA and UA samples are illustrated in Table 4. As can be seen, protein yields in the three sample are similar with an average of 25.5%. According to previous research articles about protein content in almonds, these molecules ranges were 20–23% [33] which supports the present results.
As regards PDI, results observed in Table 4 point to a difference of protein solubility in water for blanched extracts. In fact, heat denatured proteins which explains the low solubility (39.26%). In contrast, PDI percentage for UA is nearly the same as that of natural almond extracts. These two results combined (protein content and PDI) proved that ultrasound has no negative effect on almond proteins, since there was no increase in temperature. Thus, the proteins in almonds treated by ultrasound are soluble in water and are also digestible.
The following electrophoresis was performed to illustrate the difference between amino-acid profiles of NA, BA and UA (Figure S1). Molecular weight distribution of almond proteins was evaluated by SDS-PAGE under reducing (with 2-marceptoethanol) and non-reducing conditions (without 2-marceptoethanol) (Figure S1). This was executed to evaluate the impact of initial treatment or processing on the almond protein profile. Evidently, no difference of the protein profiles in the blanched almond have been observed under reducing and non-reducing conditions, proving a high denaturation of proteins [34], whereas in case of ultrasonicated almonds and natural almonds, the protein profile was different under non-reducing conditions compared to reduced conditions. We can see an aggregation of proteins at ~30 kDa similar to the protein profile of BA. Hence, these results show that UA proteins are more soluble and more digestible than the BA proteins. Therefore, ultrasonication has minimal impact on the protein quality when compared to that of blanching. Nowadays, there is a rising drive toward green and eco-friendly alternatives for the industrial field. Commercial treatments, including blanching, are used when skin removal is required, such as for almond powder, flaked almonds, almond milk [35], confectionery, etc. UAE could be introduced to the production line, avoiding high temperature heating, thus protein denaturation and aggregation [36,37], and allowing the preservation of their nutritional quality and digestibility.

3.4. Diffusion Modelling and Numerical Simulation for Polyphenol Extraction

The predicted extraction yields were compared with the experimentally determined extraction yields and plotted in Figure S2. It can be seen that despite of some divergences in extraction kinetic curves, especially in the latter stage of ultrasound-assisted extraction, the diffusional model can satisfactorily describe the evolution of total phenolic yield during extraction with and without sonication. Similar results were also reported in the studies of Tao et al. (2017) [24] and Ravi et al. (2019) [38]. The low values of RMSE and E% (lower than 10%) and high R2 value (higher than 0.93) listed in Table S2 all demonstrate the considerably high accuracy of diffusional modeling results.
The De value derived from diffusional modeling for ultrasound-assisted extraction was 7.17 × 10⁻¹⁰ m2.s−1, and the corresponding value for non-ultrasound incorporated extraction was 1.83 × 10⁻¹⁰ m2.s−1. Both De values were in the similar range to that of phenolics during ultrasound-assisted extraction from chokeberry [24]. The higher diffusivity of phenolics for ultrasound-assisted extraction was consistent with the kinetic results, verifying that ultrasound can intensify the diffusion of phenolics within almond skins.
Based on the numerical results, the distributions of phenolics within almond skin at different stages of extraction are visualized in Figure 6. As can be seen, the concentration gradient of phenolics within almond skin during extraction can be ignored due to the low thickness value. At the same time point, a lower retention of phenolics within almond skins under sonication was observed, which denoted to the higher extraction yield.

4. Conclusions and Future Trends

Ultrasound Assisted Extraction (UAE) enabled combined polyphenol extraction and almond skin separation with an efficiency up to +258% comparing to silent extraction. Microscopic study of treated almond skins showed noticeable impact of ultrasound on skin cells, acting through chain de-texturation mechanism respecting the following steps: local erosion, shear forces, sonoporation, and fragmentation. Polyphenol analysis indicated that extracts from almond skins have a high concentration in procyanidins (up to 87%) and isorhamnetin glucosides mainly. Lipid analysis results revealed that ultrasound has no negative effect on almond oils since yields in NA and UA are equal. Electrophoresis and PDI showed a slight difference between amino-acid profile of UA and NA and protein solubility in water. Overall, the results indicated that UAE is an innovative and sustainable process allowing an efficient extraction of polyphenols and skin separation, without any negative effect on almonds proteins and lipids. As a perspective, Ultrasound Assisted Extraction (UAE) could be introduced to the production line, allowing skin separation at room temperature, and leading to a re-use of blanching water, preservation of proteins and oils quality towards eco-friendlier and green industries such as cosmetics, agriculture and pharmacy. In this article, we give an example of potential success story in food processing which could respond to these challenges of this 21st century for enhancing nutritional quality, to reduce energy and unit operations for processing, eliminating wastes and by-products, reduction of water use, and more important, eliminating hunger, food insecurity, and malnutrition worldwide.

Supplementary Materials

The following are available online at https://0-www-mdpi-com.brum.beds.ac.uk/2076-3417/10/10/3628/s1, Figure S1: Comparison between SDS-PAGE protein profiles of NA, BA and UA under non-reduced conditions and reduced conditions. Figure S2: Experimental versus predicted extraction kinetics of phenolics from almonds. sonication; non-sonication. The solid line denoted to the diffusional model. Figure S3. UPLC chromatograms of the compounds resulting from the phloroglucynolysis of UA, NUA, BA and NA extracts. A: Phloroglucinol-Catechin + Phloroglucinol-Epicatechin; B: Catechin; C: Epicatechin. Table S1: p-values* for the effects (A: temperature; B: Ultrasonic Intensity). Table S2: De value for phenolics during extraction and fitness of diffusional model.

Author Contributions

Conceptualization, M.T., A.R., and F.C.; methodology, M.T., Y.T., C.G., I.B., N.R., A.R., and F.C.; software, M.T., Y.T., C.G., I.B., N.R., A.R., and F.C.; validation, M.T., Y.T., C.G., I.B., N.R., A.R., and F.C.; formal analysis, M.T., Y.T., C.G., I.B., N.R., A.R., and F.C.; investigation M.T., Y.T., C.G., I.B., N.R., A.R., and F.C.; resources M.T., Y.T., C.G., I.B., N.R., A.R., and F.C.; data curation, M.T., Y.T., C.G., I.B., N.R., A.R., and F.C.; writing—original draft preparation, M.T., Y.T., C.G., I.B., N.R., A.R., and F.C.; writing—review and editing, M.T., Y.T., C.G., I.B., N.R., A.R., and F.C.; visualization, M.T., Y.T., C.G., I.B., N.R., A.R., and F.C.; supervision, A.R., and F.C.; project administration, A.R., and F.C.; funding acquisition, A.R. and F.C. All authors have read and agreed to the published version of the manuscript.

Funding

This research received no external funding.

Acknowledgments

Part of this work was supported by the microscopy facilities of the Platform 3A, funded by the European Regional Development Fund, the French Ministry of Research, Higher Education and Innovation, the Provence-Alpes-Côte d’Azur region, the Departmental Council of Vaucluse and the Urban Community of Avignon.

Conflicts of Interest

The authors declare no conflicts of interest.

References

  1. Chen, C.Y.; Lapsley, K.; Blumberg, J. Perspective A nutrition and health perspective on almonds. Sci. Food Agric. 2006, 86, 2245–2250. [Google Scholar] [CrossRef]
  2. Jenkins, D.J.A.; Kendall, C.W.C.; Marchie, A.; Faulkner, D.; Vidgen, E.; Lapsley, K.G.; Trautwein, A.A.; Parker, T.L.; Josse, R.G.; Leiter, L.A.; et al. The Effect of Combining Plant Sterols, Soy Protein, Viscous Fibers, and Almonds in Treating Hypercholesterolemia. Metabolism 2013, 52, 1478–1483. [Google Scholar] [CrossRef]
  3. Almond Board of California. Waste not; Soil health research utilizing almond coproducts, document # 2017IR0202; Almond Board of California: Modesto, CA, USA, 2017. [Google Scholar]
  4. Vargas, F.J. Árboles productores de frutos secos: Origen, descripción, distribución y producción. In Frutos Secos, Salud Y Culturas Mediterraneas; Salas-Salvadó, J., Ros, E., Sabaté, J., Eds.; Editorial Glosa: Barcelona, Spain, 2005; p. 21. [Google Scholar]
  5. Milbury, P.E.; Chen, C.Y.; Dolnikowski, G.G.; Blumberg, J.B. Determination of Flavonoids and Phenolics and Their Distribution in Almonds. J. Agric. Food Chem. 2006, 54, 5027–5033. [Google Scholar] [CrossRef] [PubMed]
  6. Chen, P.; Yanling, C.; Shaobo, D.; Xiangyang, L.; Guangwei, H.; Ruan, R. Utilization of almond residues. Int. J. Agric. Biol. Eng. 2010, 3, 1–18. [Google Scholar]
  7. Mandalari, G.; Bisignano, C.; D’Arrigo, M.; Ginestra, G.; Arena, A.; Tomaino, A.; Wickham, M.S.J. Antimicrobial potential of polyphenols extracted from almond skin. Lett. Appl. Microbiol. 2010, 51, 81–89. [Google Scholar] [CrossRef]
  8. Bolling, B.W. Almond Polyphenols: Methods of Analysis, Contribution to Food Quality, and Health Promotion. Comprehensive Reviews in Food Science and Food Safety 2017, 16, 346–368. [Google Scholar] [CrossRef] [Green Version]
  9. Siriwardhana, S.K.W.S.; Shahidi, F. Antiradical, Activity of Extracts of Almond and Its By-products. J. Am. Oil Chem. Soc. 2002, 79, 903–908. [Google Scholar] [CrossRef]
  10. Monagas, M.; Garrido, I.; Lebrón-Aguilar, R.; Bartolome, B.; Gómez-Cordovés, C. Almond (Prunus dulcis (Mill.) D.A. Webb) Skins as a Potential Source of Bioactive Polyphenols. J. Agric. Food Chem. 2007, 55, 8498–8507. [Google Scholar] [CrossRef]
  11. Amarowicz, R.; Troszyńska, A.; Shahidi, F. Antioxidant activity of almond seed extract and its fractions. J. Food Lipids 2005, 12, 344–358. [Google Scholar] [CrossRef]
  12. Mandalari, G.; Tomaino, A.; Arcoraci, T.; Martorana, M.; Lo Turco, V.; Cacciola, F.; Rich, G.T.; Bisignano, C.; Saija, A.; Dugo, P.; et al. Characterization of polyphenols, lipids and dietary fiber from almond skins (Amygdalus communis L.). J. Food Compos. Anal. 2010, 23, 166–174. [Google Scholar] [CrossRef]
  13. Chemat, F.; Rombaut, N.; Sicaire, A.-G.; Meullemiestre, A.; Fabiano-Tixier, A.-S.; Abert Vian, M. Ultrasound assisted extraction of food and natural products: Mechanisms, techniques, combinations, protocols and applications. A Review. Ultrason. Sonochem. 2016, 34, 540–560. [Google Scholar] [CrossRef] [PubMed]
  14. Gunathilake, K.D.P.P.; Somathilaka Ranaweera, K.K.D.; Vasantha Rupasinghe, H.P. Effect of Different Cooking Methods on Polyphenols, Carotenoids and Antioxidant Activities of Selected Edible Leaves. Antioxidants 2018, 7, 117. [Google Scholar] [CrossRef] [PubMed] [Green Version]
  15. Bhosle, D.; Janghel, A.; Deo, S.; Raut, P.; Verma, C.; Kumar, S.S.; Agrawal, M.; Amit, N.; Sharma, M.; Giri, T.; et al. Emerging ultrasound assisted extraction (UAE) Techniques as Innovative Green Technologies for the effective extraction of the active phytopharmaceuticals. Res. J. Pharm. Tech. 2015, 8, 14. [Google Scholar] [CrossRef]
  16. Boukroufa, M.; Sicaire, A.G.; Fine, F.; Larré, C.; Le Goff, A.; Solé Jamault, V.; Rakotomanomana, N.; Chemat, F. Green Sonoextraction of Protein from Oleaginous Press Rapeseed Cake. Molecules 2017, 22, 80. [Google Scholar] [CrossRef] [Green Version]
  17. Singleton, V.L.; Orthofer, R.; Lamuela-Raventós, R.M. Analysis of total phenols and other oxidation substrates and antioxidants by means of Folin-Ciocalteu reagent. Methods Enzymol. 1999, 299, 152–178. [Google Scholar]
  18. Kennedy, J.A.; Jones, G.P. Analysis of Proanthocyanidin Cleavage Products Following Acid-Catalysis in the Presence of Excess Phloroglucinol. J. Agric. Food Chem. 2001, 49, 1740–1746. [Google Scholar] [CrossRef]
  19. Cheynier, V.; Labarbe, B.; Moutounet, M. Estimation of Procyanidin Chain Length. Methods Enzymol. 2001, 335, 87–88. [Google Scholar]
  20. Breil, C.; Meullemiestre, A.; Vian, M.; Chemat, F. Bio-based solvents for green extraction of lipids from oleaginous yeast biomass for sustainable aviation biofuel. Molecules 2016, 21, 196. [Google Scholar] [CrossRef] [Green Version]
  21. Janssen, R.H.; Vincken, J.-P.; Van Den Broek, L.-A.M.; Fogliano, V.; Lakemond, C.M.M. Nitrogen-to-Protein conversion factors for three edible insects: Tenebrio molitor, Alphitobius diaperinus, and Hermetia illucens. J. Agric. Food Chem. 2017, 65, 2275–2278. [Google Scholar] [CrossRef]
  22. Van Eys, J.E. Manual of Quality Analyses for Soybean Products in the Feed Industry, 2nd ed.; Soybean Export Council: Fourqueux, France, 2012; pp. 8–9.
  23. Tao, Y.; Zhang, J.; Jiang, S.; Xu, Y.; Show, P.-L.; Han, Y.; Ye, X.; Ye, M. Contacting ultrasound enhanced hot-air convective drying of garlic slices: Mass transfer modeling and quality evaluation. J. Food Eng. 2018, 235, 79–88. [Google Scholar] [CrossRef]
  24. Tao, Y.; Wang, Y.; Pan, M.; Zhong, S.; Wu, Y.; Yang, R.; Han, Y.; Zhou, J. Combined ANFIS and numerical methods to simulate ultrasound-assisted extraction of phenolics from chokeberry cultivated in China and analysis of phenolic composition. Sep. Purif. Technol. 2017, 178, 178–188. [Google Scholar] [CrossRef]
  25. Tao, Y.; Wu, Y.; Han, Y.; Chemat, F.; Li, D.; Show, P.L. Insight into mass transfer during ultrasound-enhanced adsorption/desorption of blueberry anthocyanins on macroporous resins by numerical simulation considering ultrasonic influence on resin properties. Chem. Eng. J. 2020, 380, 122530. [Google Scholar] [CrossRef]
  26. Dular, M.; Osterman, A. Pit clustering in cavitation erosion. Wear 2008, 265, 811–820. [Google Scholar] [CrossRef]
  27. Dular, M.; Bacherta, B.; Stoffela, B.; Sirok, B. Relationship between cavitation structures and cavitation damage. Wear 2004, 257, 1176–1184. [Google Scholar] [CrossRef]
  28. Volf, I.; Ignat, I.; Neamtu, M.; Popa, V.I. Thermal stability, antioxidant activity, and photo-oxidation of natural polyphenols. Chem. Pap. 2014, 68, 121–129. [Google Scholar] [CrossRef]
  29. Boussetta, N.; Turc, M.; De Taeye, C.; Larondelle, Y.; Lanoisellé, J.L.; Vorobiev, E. Effect of high voltage electrical discharges, heating and ethanol concentration on the extraction of total polyphenols and lignans from flaxseed cake. Ind. Crop. Prod. 2013, 49, 690–696. [Google Scholar] [CrossRef]
  30. Sathe, S.K.; Seeram, N.P.; Kshirsagar, H.H.; Heber, D.; Lapsley, K.A. Fatty Acid Composition of California Grown Almonds. J. Food Sci. 2008, 73, C607–C614. [Google Scholar] [CrossRef]
  31. Özcana, M.M.; Ünver, A.; Erkanb, E.; Arslan, D. Characteristics of some almond kernel and oils. Sci. Hortic. 2011, 127, 330–333. [Google Scholar] [CrossRef]
  32. Ahmad, Z. The uses and properties of almond oil. Complement. Ther. Clin. Pract. 2010, 16, 10–12. [Google Scholar] [CrossRef]
  33. Ahrens, S.; Venkatachalam, M.; Mistry, A.M.; Karen Lapsley, K.; Sathe, S.K. Almond (Prunus dulcis L.) Protein Quality. Plant Foods Hum. Nutr. 2005, 60, 123–128. [Google Scholar] [CrossRef]
  34. Zhang, Y.; Jieqiong Zhang, J.; Sheng, W.; Wang, S.; Fu, T.J. Effects of heat and high-pressure treatments on the solubility and immunoreactivity of almond proteins. Food Chem. 2016, 199, 856–861. [Google Scholar] [CrossRef] [PubMed]
  35. Berger, J. Procédé De Préparation D’un Lait D’amandes, Et Produits Obtenus. Brevet EU n ° EP 0 776 165 B1, 7 January 1999. [Google Scholar]
  36. Sathe, S.K.; Sze, K.W.C. Thermal aggregation of almond protein isolate. Food Chem. 1997, 59, 95–99. [Google Scholar] [CrossRef]
  37. Venkatachalam, M.; Teuber, S.S.; Roux, K.H.; Sathe, S.K. Effects of Roasting, Blanching, Autoclaving, and Microwave Heating on Antigenicity of Almond (Prunus dulcis L.) Proteins. J. Agric. Food Chem. 2002, 50, 3544–3548. [Google Scholar] [CrossRef] [PubMed]
  38. Ravi, H.K.; Vian, M.; Tao, Y.; Degrou, A.; Costil, J.; Trespeuch, C.; Chemat, F. Alternative solvents for lipid extraction and their effect on protein quality in black soldier fly larvae. J. Clean. Prod. 2019, 238, 117861. [Google Scholar] [CrossRef]
Figure 1. Graphical illustration of the experiment’s design.
Applsci 10 03628 g001
Figure 2. (A) Pareto graphic for TPC; (B) Pareto graphic SST.
Applsci 10 03628 g002
Figure 3. TPC (expressed as eq mg Naringenin/g almonds) kinetics with and without ultrasound. Data are the means ± SD, n = 3. Ultrasound (yellow) versus silent (orange).
Applsci 10 03628 g003
Figure 4. SEM observation of almond skin before (AC) and after (DF) localized sonication.
Applsci 10 03628 g004
Figure 5. Primary effects (A,B), Secondary effects (C) and erosion after 20 min of sonication at 3 mm distance from the ultrasonic probe. (A,B): 40,000×; (C): 10,000×; (D): 600×.
Applsci 10 03628 g005
Figure 6. Distribution of phenolics within almond skins during extraction.
Applsci 10 03628 g006
Table 1. Fully coded Central Composite Design (CCD) and responses obtained for Total Polyphenol Content (TPC; eq mg naringenin/g almonds) and Skin Separation Time (SST; min).
No.UITemperature TPC (eq mg Naringenin/g Almonds)SST (min)
1−1+10.0615
2000.03910
30−α0.03010
4000.04111
5+1−10.03517
600.0636
7000.04110
8000.04111
9000.04210
1000.04610
11−α00.03120
12+1+10.0577
13000.04010
14−1−10.02420
Table 2. Content (µg/100 g of almond) of phenolic compounds in NS, NUA, UA, and BA extracts.
SampleNS (µg/100 g of Almond)NUA (µg/100 g of Almond)UA (µg/100 g of Almond)BA (µg/100 g of Almond)
Vanillic acid di-hexoside 1078.8 ± 34.966.5 ± 5.4423.5 ± 49.4245.0 ± 13.7
Catechin 648.6 ± 13.872.7 ± 21.5493,0 ± 245,1335,9 ± 24.1
Epicatechin 263.9 ± 18.237.6 ± 10.4152,7 ± 44,7220.0 ± 4.0
(Epi)Catechin-hexoside198.4 ± 19.911.0 ± 3.1136.4 ± 19.9146.9 ± 44.1
Chlorogenic acid34.413 ± 2.15.2 ± 1.533.3 ± 6.812.7 ± 0.5
Isorhamnetin 262.3 ± 2.49.1 ± 2.060.7 ± 0.7528.3 ± 2.2
Isorhamnetin-3-O-rutinoside2399.9 ± 118.0161.5 ± 36.4957.4 ± 66.7522.5 ± 20.8
Isorhamnetin-3-O-glucoside 1571.9 ± 62.9487.1 ± 19.9487.3 ± 32.0317.0 ± 15.0
Kaempferol-3-O-glucoside 72.0 ± 3.55.9 ± 1.429.5 ± 3.423.1 ±1.4
Kaempferol-3-O-rutinoside228.9 ± 23.516.3 ± 3.1105.1 ± 6.561.6 ± 3.4
Naringenin 23.8 ± 0.21.6 ± 0.210.7 ± 1.513.2 ± 1.0
Procyanidins 64636.8 ± 2670.1 2438.4 ± 617.421003.5 ± 3086.23994.0 ±77.2
Total 71419.82912.923893.05920.0
100.0%4.1%33.5%8.3%
Table 3. Relative percentages of NA, BA and UA oil – GC analysis and oil yields – Soxhlet extraction.
NA (%)BA (%)UA (%)
C16:06.069 ± 0.0116.055 ± 0.0685.903 ± 0.007
C16:1 n70.494 ± 0.0010.522 ± 0.0090.434 ± 0.001
C18:01.131 ± 0.0091.158 ± 0.0001.206 ± 0.000
C18:1 n971.475 ± 0.00971.903 ± 0.59672.065 ± 0.012
C18:2 n620.490 ± 0.01020.590 ± 0.18920.060 ± 0.001
Fresh matter yield (%)52.050 ± 0.01552.500 ± 0.00251.680 ± 0.024
Table 4. Protein content (%) and Protein Dispersibility Index in for NA, BA and UA.
SampleProtein Content (%)PDI (%)
NA26.127 ± 0.08149.239 ± 0.517
BA25.734 ± 0.29839.260 ± 0.579
UA25.396 ± 0.15545.804 ± 1.055

