The Effect of Air Pollution on the Healthy Growth of Cities: An Empirical Study of the Beijing-Tianjin-Hebei Region

1
Key Laboratory of Land Surface Pattern and Simulation, Institute of Geographic Sciences and Natural Resources Research, Chinese Academy of Sciences, Beijing 100101, China
2
Center for Chinese Agricultural Policy, Chinese Academy of Sciences, Beijing 100101, China
3
College of Geography and Environment, Shandong Normal University, Jinan 250358, China
4
School of economics and management, Southwest Forestry University, Kunming 650224, China
*
Author to whom correspondence should be addressed.
Appl. Sci. 2020, 10(11), 3699; https://0-doi-org.brum.beds.ac.uk/10.3390/app10113699
Submission received: 5 May 2020
/
Revised: 19 May 2020
/
Accepted: 25 May 2020
/
Published: 27 May 2020
(This article belongs to the Special Issue Air Pollution—Measurement Methods, Exposure, and Health Determinants)
Abstract
:In the context of sustainable development, air pollution poses challenges to the adjustment of the industrial structure in the Beijing-Tianjin-Hebei region. In order to explore the relationship between air pollution and urban industrial development, this paper uses a simultaneous equation model to empirically analyze the relationship between PM2.5 concentration and industrial development based on panel data from 2000 to 2017 on the Beijing-Tianjin-Hebei region. The empirical results show that there is a two-way causal relationship between industrial development and air pollution. Secondary industry upgrades to tertiary industry, which will help improve the air quality in the Beijing-Tianjin-Hebei region. At the same time, air pollution has a significant adverse effect on the development of secondary industry and tertiary industry. An average increase of 1% in PM2.5 concentration will cause the proportion of secondary industry to increase by about 0.08% to 0.28%, and the proportion of tertiary industry to decrease by about 0.13% to 0.31%. Based on the results of the empirical model, this paper puts forward policy recommendations for environmental governance in the Beijing-Tianjin-Hebei region, aiming to achieving healthy development of the Beijing-Tianjin-Hebei region.

1. Introduction
With the continuous development of industrialization and urbanization, the air pollution issue has become increasingly prominent in the whole world. Large-scale and persistent haze weather frequently occurs, especially in countries that have not completed industrialization and with concentrated air pollutant emissions. Sustained haze weather is increasing, and yet economic growth depends on energy consumption, which will not change fundamentally for some time to come [1,2]. The World Health Organization [3] used satellite measurement and atmospheric transport models to monitor data from more than 100 countries and more than 3000 urban and rural sites in the world. 92% of the world’s population lives in areas with excessive PM2.5 levels. Currently, more than 50% of the world’s population lives in cities, and it is expected that by 2030 the proportion of people living in cities will rise to two thirds [4]. As a huge gathering place for people and an important centre for people’s work and life, cities have a direct impact on the development and health of the environment in terms of their economic [5], environmental [6], and social [7] aspects.
In the process of rapid global economic growth, economic growth-oriented urban construction and development have led to increasingly serious urban pollution problems. The main manifestations are that the total amount of pollutant emissions far exceeds the environmental capacity, major air pollution accidents occur frequently, and point source pollution and non-point source pollution are intertwined. Industrial pollution and domestic pollution coexist and urban industrial structure adjustment, transformation and upgrading have become common problems that the urban economy needs to face when it develops to a certain stage [8]. The contradiction between air pollution and urban industrial structure adjustment and transformation has become the main factor restricting the stable growth and healthy development of the urban economy. More and more evidence shows that air pollution will directly or indirectly affect the urban industrial structure, for example, the industrial center of Essen, Germany has changed to become the green capital of Europe [9]; the development of emerging industries in Houston have promoted urban industrial transformation [10]. The impact of air pollution on the urban industrial structure has become a topic of general concern to national policymakers and a major issue that needs to be resolved.
In many studies on industrial structure and air pollution, researchers have different perspectives and emphases, which can be roughly summarized into three types. The first view holds that there is a significant correlation between industrial structure and air pollution, and there is a positive correlation between the added value of secondary industry and air pollution, and a negative correlation between the added value of primary, secondary and tertiary industry and air pollution [9]. The second view is that there is no significant relationship between industrial structure and air pollution [10]. There is also the third view that there is an inverted "U" relationship between industrial structure and air pollution [11]. These three views differ from place to place and each view has its own characteristics. In addition, some scholars have conducted in-depth studies on the spatial distribution characteristics of industries and the impact of industrial structure adjustment on air pollution [12,13]. For studies on the relationship between industrial structure and air pollution, the research methods mainly include logarithmic average Dirichlet index [14], time-varying parameter vector autoregression [15], gray correlation analysis [16], input-output model [17], and geographic information spatial analysis technology [18]. Lin and Zhu [19] discussed the relationship between the industrial structure, economic status and air quality of 282 cities in China based on the panel data model, revealing that the proportion of secondary industries is the main factor leading to urban air pollution, and speeding up the urbanization process should be based on continuously optimizing the industrial structure. Based on the air pollutant data sets of 18 cities in Henan Province in the past two years, Liu et al. [20] found that cities in southern Henan are mainly polluted, and Zhengzhou is the city with the most serious air pollution. Liu et al. [21] studied the relationship between industrial structure, air pollution and economic growth in the Beijing-Tianjin-Hebei region based on the spatial panel structure vector autoregressive model, and proposed specific recommendations in terms of regional haze management and PM emission reduction from the perspective of industrial structure adjustment.
In summary, there is a substantial literature that studies the impact of industrial structure on air pollution and, conversely, few studies of the impact of air pollution on urban industrial structure. As China’s tertiary economic growth pole, the economic development of the Beijing-Tianjin-Hebei region is rapid and it has a high level of urbanization. The proposal of the Beijing-Tianjin-Hebei regional coordinated development strategy aims to create an international city cluster with stable economic development, reasonable industrial structure, and good ecological environment on the premise of decreasing the non-capital function of Beijing. However, heavy chemical industry in the Beijing-Tianjin-Hebei region accounts for a relatively large amount. The issues of unbalanced and unmatched urban industrial structure are prominent. The air pollution phenomenon is becoming more and more serious, which has become a major obstacle to the healthy development of Beijing-Tianjin-Hebei cities [22]. Accelerating the resolution of the contradiction between air pollution in the Beijing-Tianjin-Hebei region and urban industrial structure and promoting the healthy development of the region are important issues that need to be urgently resolved in the current Beijing-Tianjin-Hebei coordinated development strategy.
This study aims to explore the relationship between air pollution and urban industrial structure and the related mechanism by which air pollution affects urban industrial structure. The innovation of this paper is reflected in the following two aspects: first, the PM2.5 concentration data collected from the Beijing-Tianjin-Hebei urban agglomeration verifies that the migration and diffusion of air pollutants will affect the air quality of the surrounding provinces and cities, and will affect the urban industrial structure. The sample coverage is wider, breaking through the limitation that the existing research only involves a single province or city. Second, unlike existing studies that use a single equation model, this study uses the simultaneous equation model to explore the relationship between air pollution and urban industrial structure in Beijing-Tianjin-Hebei region, which is beneficial in solving problems to a certain extent.
2. Economic Development and Air Pollution in the Beijing-Tianjin-Hebei Region
2.1. Status of Economic Development in the Beijing-Tianjin-Hebei Region
The Beijing-Tianjin-Hebei region is at the stage of accelerated urbanization and modern industrialization. In the past five years, the economic development of the Beijing-Tianjin-Hebei region has been steadily improving. GDP (Gross Domestic Product) refers to the final results of the production activities of all resident units of a country (or region) calculated in accordance with the national market price within a certain period of time. It is often identified as the best indicator to measure the economic status of a country (or region). In 2018, the GDP of the Beijing-Tianjin-Hebei region reached 8.5 trillion yuan, an average annual increase of 6.6% over five years. In 2018, the urbanization rate of Beijing-Tianjin-Hebei region was 65.8%, an increase of 4.7% from 2014. The per capita disposable income of residents in Beijing, Tianjin and Hebei was 62,361 yuan, 39,506 yuan, and 23,446 yuan, respectively. The average annual growth rate was 8.8%, 8.2% and 8.9%. The economic quality of Beijing, Tianjin and Hebei has continuously improved, they are increasingly developing, and the conversion of development momentum has accelerated, laying a good foundation for achieving high-quality development. The rapid economic development in the Beijing-Tianjin-Hebei economic region has also brought about problems such as energy consumption, exhaust emissions from industrial enterprises, and increased emissions from automobile exhausts, which in turn affects air quality and the layout of the urban industrial structure [23]. At the same time, the acceleration of the urbanization process has led to increased environmental protection investment, improved greening coverage, and improved air pollutant control and governance capabilities brought about by technological advances, which will also reduce the air pollution [24]. There is a close relationship between industrial structure and air pollution. On the one hand, industrial structure upgrades, technological progress, and labor upgrades will help improve air quality. On the other hand, if resource utilization is ignored during this process, it will cause air pollution to occur again.
2.2. Air Pollution and Urban Industrial Structure in the Beijing-Tianjin-Hebei Region
The existing industrial structure in the Beijing-Tianjin-Hebei region has gradually highlighted the constraints on the environmental carrying capacity of major cities. In recent years, with the continuous increase of urban population and the continuous expansion of urban areas, natural resources pollution, such as of air and water sources, has intensified, and the improvement of the socio-economic level has been severely restricted [25,26]. The high-end and low-end industries in urban manufacturing are unevenly distributed. The long-term existence of "two high-end and one low-end" industries is an important cause of air pollution in the Beijing-Tianjin-Hebei region. Since 2012, the excessive particulate matter and reduced visibility in the air has appeared in many places in China. Among them, it is most prominent in the three regions of Beijing, Tianjin and Hebei. Of the 74 cities that apply the new air standard, 8 out of 10 cities with relatively poor air quality are located in the Beijing-Tianjin-Hebei region. In 2015, the average air quality compliance days in Beijing-Tianjin-Hebei region accounted for 52.4%, far lower than the 71.2% of compliance days in 74 key cities nationwide. Among them, Hengshui, Baoding, Xingtai, Handan, Tangshan and Shijiazhuang accounted for less than 50% of the air quality compliance days, with PM2.5 as the primary pollutant accounting for 68.4% of the over-standard days.
Air pollution in the Beijing-Tianjin-Hebei region is closely related to its industrial structure. The industrial structure of Beijing has changed rapidly, and the proportion of the three industries has changed from 5:71:24 in 1978 to 0.4: 18.6: 81.0 in 2018. At present, the proportion of primary industry is relatively low, and the focus of the industry is shifting from secondary industry to tertiary industry. The overall development trend of the industrial structure in Tianjin is similar to that of Beijing. The proportion of primary industry in Tianjin is relatively low. The center of the industry has shifted from the secondary industry to tertiary industry, but the transfer rate is significantly slower than that of Beijing. In 2014, the proportion of tertiary industry in Tianjin surpassed that of secondary industry, which was about 20 years later than in Beijing. The proportion of the three industries changed from 6: 70: 24 in 1978 to 0.9: 40.5: 58.6 in 2018. Secondary industry is still predominant in Hebei Province. Until 2018, the proportion of service industry surpassed secondary industry, and the ratio of the structure of the three industries changed from 29: 50: 21 in 1978 to 9.3: 44.5: 46.2 in 2018. Compared with the overall structure of the country, secondary industries in Tianjin and Hebei account for a relatively high proportion, resulting in serious air pollution in this region.
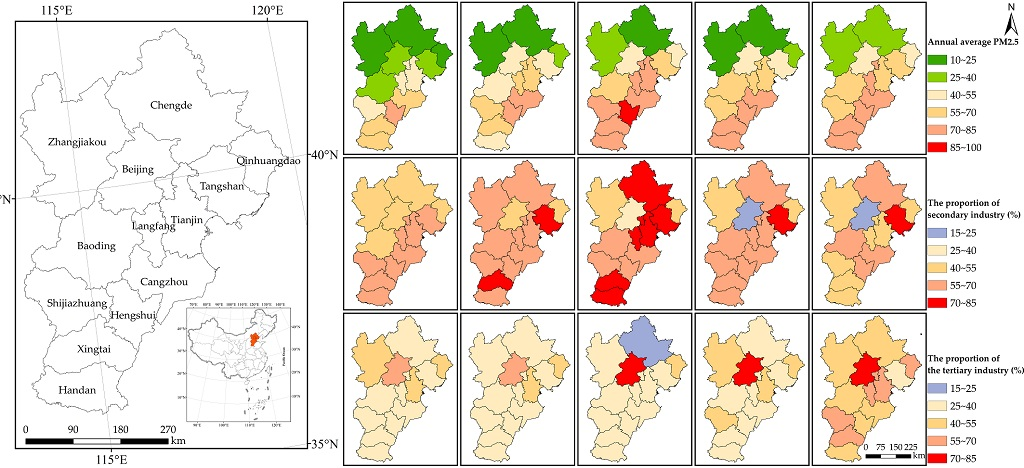
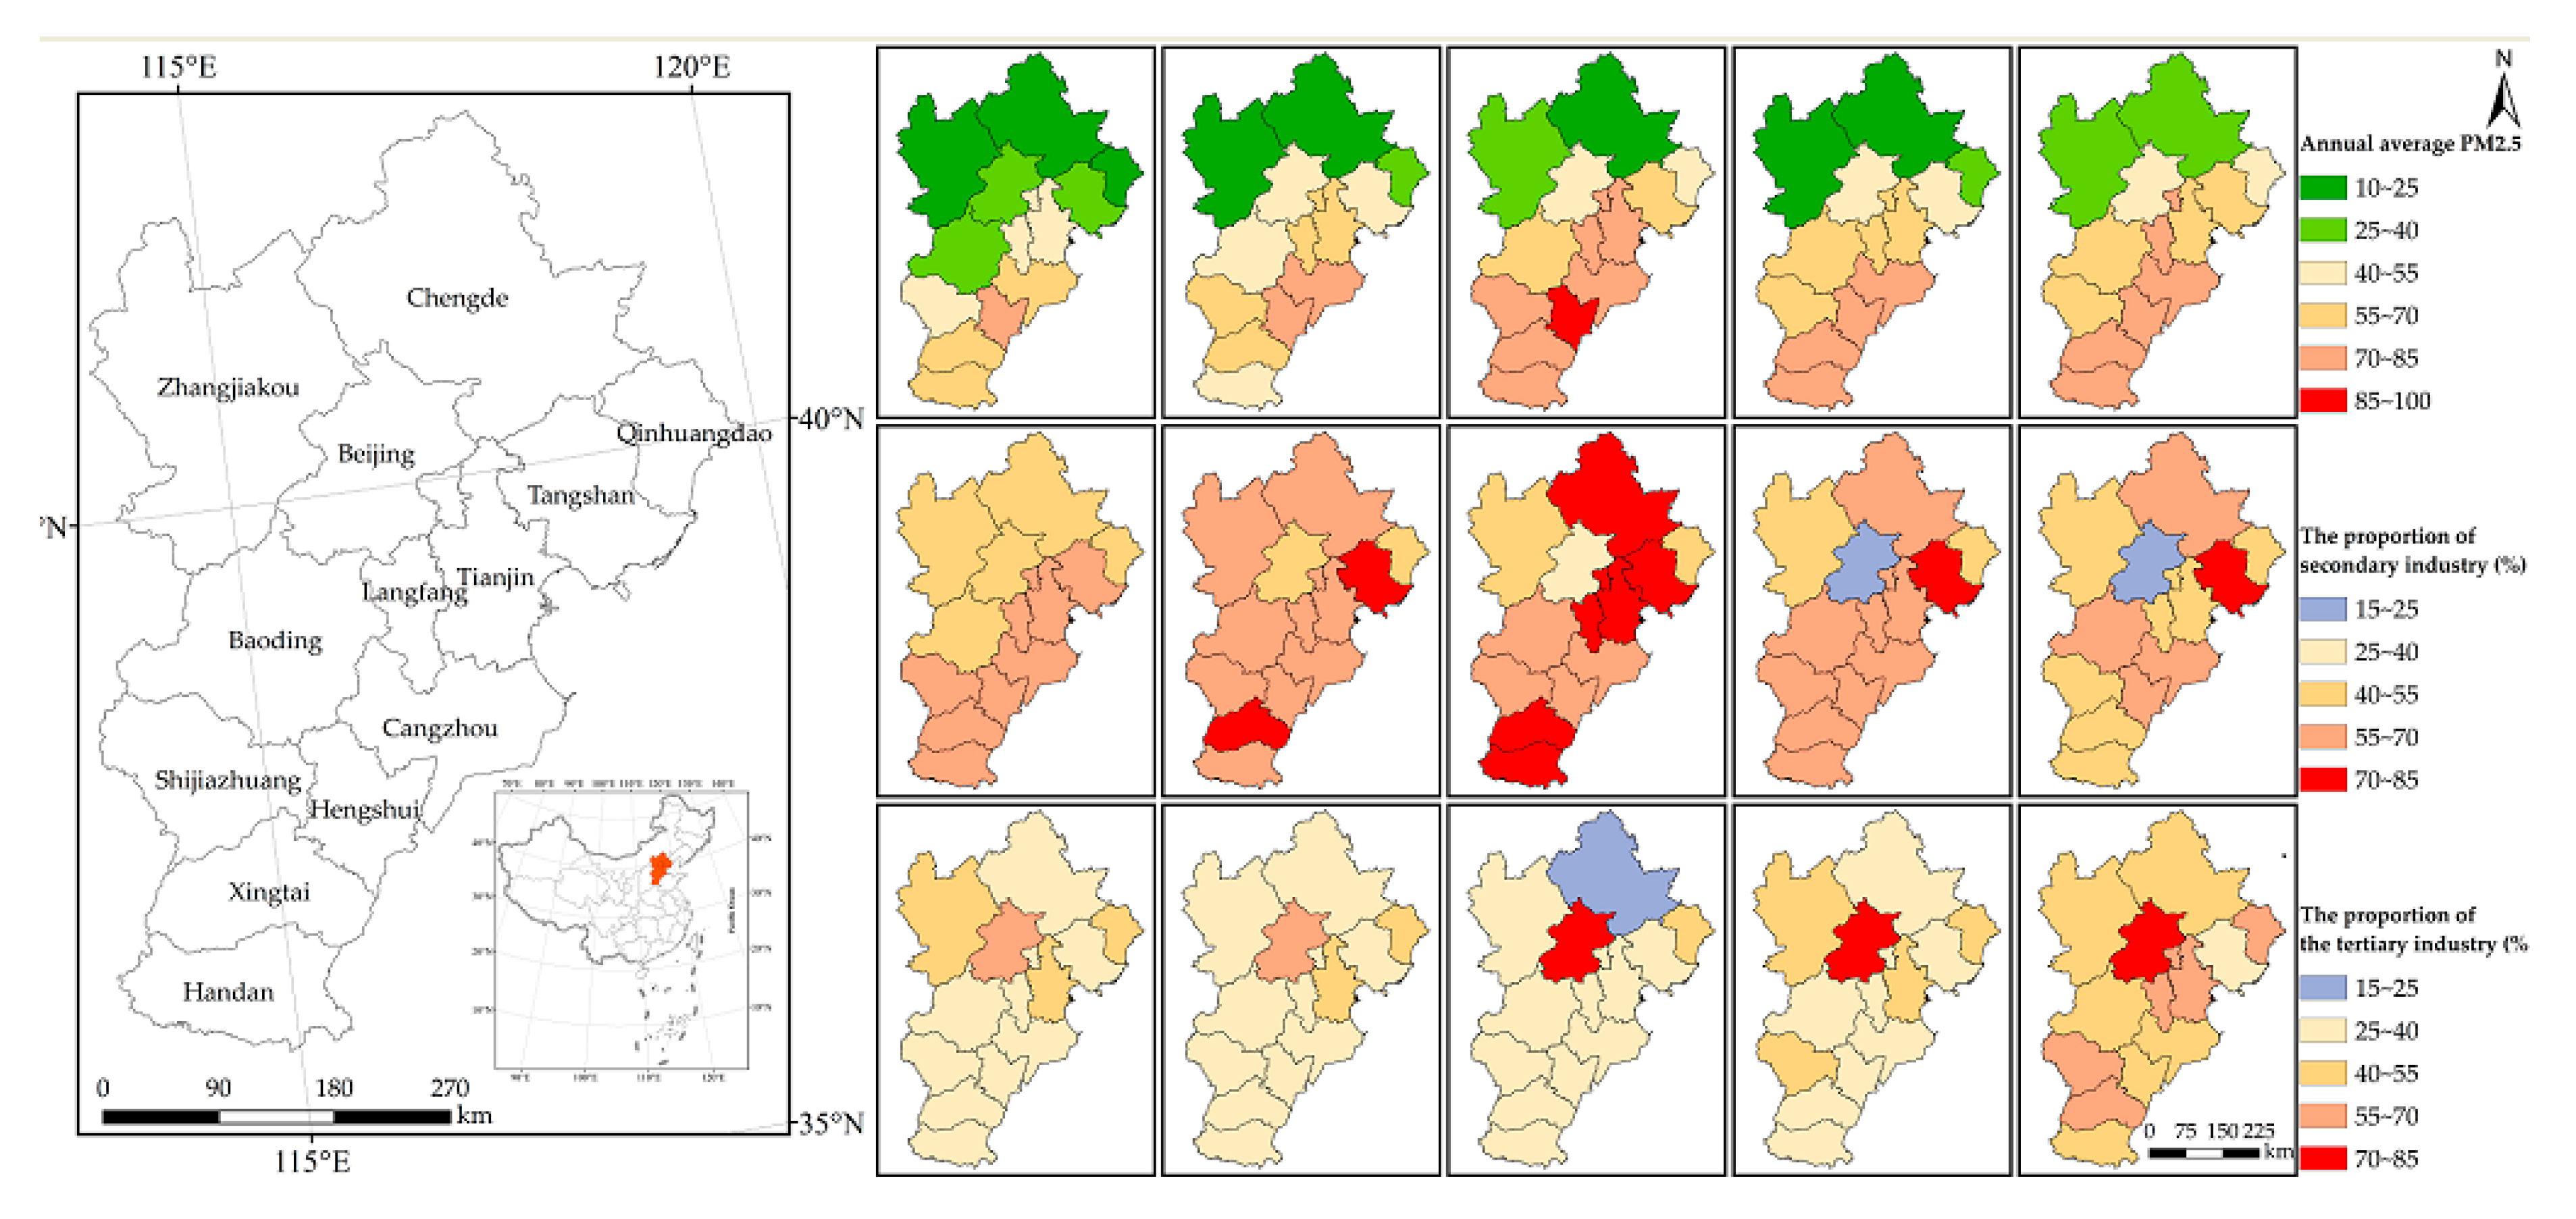
Figure 1 shows the air quality and industrial development of the Beijing-Tianjin-Hebei region during the study period. There are obvious spatial differences in the industrial structure of the Beijing-Tianjin-Hebei region. The cities transformation to the "tertiary industry-secondary industry-primary industry" type and the "secondary industry-tertiary industry-primary industry" type is also a manifestation of advanced industrial structure. Industrial structure adjustment is an effective means to promote pollution reduction, but due to the previous air pollution prevention and control policy, it is difficult to clarify the task requirements of industrial structure optimization and adjustment, especially the pollution reduction goals that the work in this field needs to strive to achieve, leading to inter-regional industrial structure adjustment. The intensity varies greatly, and the effects of pollution reduction have not been fully exerted. Based on the need to improve the quality of the atmospheric environment and reduce the intensity of pollutant emissions per unit of output, the industrial structure adjustment strategy has been studied, and the task requirements and suggestions for industrial structure adjustment are put forward to achieve sustainable development.
3. Methodology and Data Preparation
3.1. Model for Industry Development
In order to assess the impact of air pollution on the development of the secondary and tertiary industries in the Beijing-Tianjin-Hebei region, this paper builds an industrial development model. In this paper, PM2.5 is used to characterize the level of air pollution [16]. At the same time, in order to control the interference of other factors, three control variables in the model are fixed, including asset investment, technological innovation and opening to the outside world [27] to reflect the engine of industrial development. The industrial development regression model constructed in this paper is as follows:
In the formula, 2S and 3S are the proportion of the secondary and tertiary industries in the city, which is used to measure the level of industrial development, and PM2.5 is the concentration of PM2.5, which is used to measure the degree of air pollution. FA stands for fixed asset investment, measured by the amount of fixed asset investment, Innovation stands for technological innovation, measured by the number of micro-invention patents authorized, and Open stands for opening to the outside world, measured by the actual foreign investment as a percentage of GDP. β0 is a constant term, β1–β4 are regression coefficients, and ε is a residual term. In this paper, i covers 13 prefecture-level cities in the Beijing-Tianjin-Hebei region, and the t is from 2000 to 2017.
3.2. Model for Air Pollution
In order to evaluate the impact of industrial development on air pollution, this paper builds an air pollution model. In addition to industrial variables, it introduces population density [28], foreign direct investment [29], transportation [30], greening level [31], opening to the outside world, urbanization level [32], energy intensity [33] and other control variables that may affect PM2.5 concentration. Finally, the air pollution regression model constructed in this paper is as follows:
The definitions of PM2.5, 2S, 3S and Open in formula (2) are the same as those of formula (1). In addition, Pop stands for population density, measured by the number of people per unit area, FDI stands for foreign direct investment, measured by the actual use of foreign investment, Trans is the traffic conditions, measured by the number of private cars owned per unit of highway mileage, Enviro represents the greening level, measured by the green area coverage of the built-up area, UL represents the urbanization level, measured by the proportion of urban population to the total population, and CEI stands for carbon emission intensity. Carbon emission intensity refers to the amount of carbon emissions generated as GDP increases, measured by carbon emissions per unit of GDP. It cannot be ignored that carbon emissions may increase the local temperature, thereby affecting the diffusion process of fine particulate matter. Based on this conjecture, this paper considers the effect of carbon emission intensity on urban air pollution. ρ0 is a constant term, ρ1–ρ8 are regression coefficients, and μ is a residual term.
3.3. Data
This paper focuses on the air quality and socioeconomic data if the Beijing-Tianjin-Hebei urban agglomeration (Table 1). This paper is based on the original data released by the Atmospheric Composition Analysis Group of Dalhousie University [34] and it is analyzed by ArcGIS 10.5 to obtain PM2.5 concentration data. It is worth mentioning that the data released by Columbia University and Dalhousie University are processed using NASA satellites, but the data released by the former before 2014 is the average of data during three years, and the data released by the latter is the average of one year and it uses ground monitoring data to assist satellite data, which is more in line with the research requirements of this paper in terms of data accuracy and time span. In this paper, the ArcGIS 10.5 platform is used to perform basic spatial correction on raster data about the average annual concentration of PM2.5. After vectorizing the administrative divisions of cities, this paper further uses this as the mask based on the “Extract by Mask” tool to extract the annual average PM2.5 concentration data, and zonal statistics for the average annual PM2.5 concentration of each city. The socio-economic data comes from the “China City Statistical Yearbook” from 2001 to 2018 [35] and the provincial and municipal statistical yearbooks.
4. Results and Analysis
4.1. Results of Single Equation Estimation
This paper first adopts a single equation model to measure the interaction between industrial development and air pollution, and the estimation results can be compared with that of the simultaneous equation model. The regression analysis on panel data generally considers fixed-effect models and random-effect models. Table 2 and Table 3 show the single-equation estimation results of the development of secondary and tertiary industries and air pollution, respectively. The results show that PM2.5 concentration has positive and negative effects on the secondary and tertiary industries, respectively. In turn, the proportion of secondary industry and tertiary industry also has a significant impact on PM2.5 concentration.
It is worth noting that the estimation results of the single equation indicate that there is a clear two-way causal relationship between industrial development and air pollution. Further, this two-way causal relationship makes it impossible to effectively solve the endogenous problem, and ultimately may cause the single equation estimation result to be inaccurate, so it is necessary to measure the relationship between air quality and industrial development more accurately based on the simultaneous equation model evaluation.
4.2. Results of Simultaneous Equations Model
Specifically, the simultaneous equation model in this part consists of equations (1) and (2). This paper selects the three-stage least squares estimation method (3SLS). Table 4 and Table 5 are the results of the simultaneous equation model estimated using the 3SLS method. Consistent with expectations, the estimation results of the simultaneous equation model are more accurate than the estimation results of the single equation model in terms of statistical significance and rationality of the estimated coefficients. In order to ensure the robustness of the estimation results, six different specifications are used in this paper, and the corresponding results are labeled as models (1)–(6). Specifically, the model (6) is a benchmark estimation model, including all control variables in the two equations. (1)–(5) include some control variables in the model.
For equation (1) in the simultaneous equation model, in models (1) to (6) the positive and negative coefficients of the PM2.5 concentration remain stable and in models (3) to (6) are significant at 1% since. This shows that after fully considering the endogeneity of the two-way causal relationship between air pollution and industrial development, PM2.5 concentration does have a significant impact on the proportion of secondary and tertiary industries.
4.2.1. Impact of Industrial Structure on Air Pollution
Considering the results of the baseline estimates, the PM2.5 concentration will increase by about 0.50% for every 1% increase in the proportion of secondary industry. At the same time, for every 1% increase in the proportion of tertiary industry, the PM2.5 concentration will drop by about 0.43%, which shows that upgrading secondary industry to tertiary industry in the Beijing-Tianjin-Hebei region will help improve local air quality.
For the control variables that explain air pollution, the population density coefficient is estimated to be positive and significant at the 1% level, indicating that the negative impact of population concentration on the environment is greater than the positive impact, which may be due to the fact that population-intensive cities have a large amount of labor to support the development of high energy-consuming industries and low-end manufacturing. The coefficient of foreign direct investment is significantly positive, which shows that the large inflow of FDI has caused a negative impact. Under the conditions of trade liberalization, pollution-intensive enterprises will enter cities with lower environmental standards, and cities with lower environmental standards have become "refuges" for highly polluting enterprises. The transportation coefficient is significantly positive, indicating that vehicle exhaust emissions are one of the important causes of air pollution. It is obvious that the improvement of the greening level is beneficial to alleviate air pollution. At the same time, the estimated result of opening up to the world is negative and significant. This paper speculates that international cooperation in the Beijing-Tianjin-Hebei region has brought advanced technology to the local area, thereby allowing the processing and manufacturing processes to become cleaner. At the same time, urbanization can increase the utilization rate of public facilities and public transportation, form industrial agglomeration, and thereby reduce energy consumption and pollution treatment costs, which is conducive to reducing pollution emissions. Interestingly, the energy intensity coefficient is also significantly negative, which shows that the carbon dioxide reduction measures issued by the government have not played a role in reducing air pollution levels, but caused the situation to be worse, indicating that the Beijing-Tianjin-Hebei region urgently needs to expand and improve the existing environmental regulations.
4.2.2. Impact of Air Pollution on Industrial Structure
Investigating the industrial development of air pollution in the Beijing-Tianjin-Hebei region is a matter of particular concern in this paper. The results of the simultaneous equations show that, under the same conditions, every increase in PM2.5 concentration will increase the proportion of secondary industry by about 0.08%–0.28%. Comparing the coefficient estimation results (0.08%–0.28%) of the simultaneous equations in Table 4 with the coefficient estimation results (0.09%–0.21%) of the single equation, it can be found that the 3SLS estimate for the PM2.5 concentration in the simultaneous equation model has a larger range of variation compared with the estimation result of the single equation model, indicating that the impact of the air pollution assessment on secondary industry is uncertain. The results of the simultaneous equations for the development of tertiary industry and air pollution indicate that, under the same conditions, for every 1% increase in PM2.5 concentration, the proportion of tertiary industry will decrease by about 0.13% to 0.31%. Comparing the coefficient estimation results (0.13%–0.31%) of the simultaneous equations in Table 5 with the coefficient estimation results (0.08%–0.22%) of the single equations, it can be found that compared with the estimation results of the single equation models, the estimated value of 3SLS for PM2.5 concentration is higher and more significant, which indicates that the single-equation model underestimates the negative impact of increased PM2.5 concentration on the development of tertiary industry. To sum up, PM2.5 concentration can have a significant impact on the regional industrial structure. The specific performance lies in the fact that reducing PM2.5 concentration can promote a decrease in the proportion of secondary industry and increase the proportion of tertiary industry, thereby achieving industrial upgrading.
For the control variables that explain industrial development in the simultaneous equation model, the estimation results of the coefficients are in line with expectations. Fixed asset investment, technological innovation, and opening up to the world indeed play an irreplaceable role in the industrial development of the Beijing-Tianjin-Hebei region, but it has a different impact on secondary industry and tertiary industry. Specifically, the increase in fixed asset investment and opening up to the world has played a positive role in the development of secondary industry, and technological innovation has promoted the development of tertiary industry.
5. Conclusions and Implications
5.1. Main Conclusions
Based on the PM2.5 concentration and industrial development data on Beijing-Tianjin-Hebei region from 2000 to 2017, this paper uses the simultaneous equation model and 3SLS estimation method to study the interaction between air pollution and industrial development. According to the empirical results, the following conclusions can be drawn.
First, there is a significant two-way causal relationship between industrial development and air pollution in the Beijing-Tianjin-Hebei region. Compared with the simultaneous equations, traditional single-equation panel data underestimate the impact of air pollution on industrial development.
Second, the estimation results of the air pollution model show that the proportion of secondary industry and increase the proportion of tertiary industry is conducive to improving air quality. In addition, population density, foreign direct investment, and high level development of transportation have brought environmental pressure to the Beijing-Tianjin-Hebei region.
Third, the estimation results of the industrial development model show that air pollution has a significant positive impact on the development of urban secondary industry and, at the same time, it has a significant negative impact on the development of tertiary industry, which hinders the industrial structure upgrade to a certain extent. Under the same conditions, every increase in PM2.5 concentration will increase the proportion of secondary industry by approximately 0.08% to 0.28%, and decrease the proportion of secondary industry by approximately 0.13% to 0.31%.
5.2. Policy Implications
Based on the above conclusions, this paper attempts to propose the following suggestions.
First, strengthen green technology learning and innovation. On the one hand, government departments should regularly and promptly organize professional teams to learn advanced international monitoring techniques related to atmospheric pollutants and improve the monitoring of pollutant emissions. On the other hand, the government should encourage enterprises to increase the level of pollution control technology by strengthening science and technology expenditures and building a market-oriented green technology innovation system.
Second, increase investment in environmental protection. Considering the significant negative impact of air pollution on the industrial upgrading in Beijing-Tianjin-Hebei region, central and local governments need to provide more policy support and capital investment in the treatment of air pollution, which is conducive to industrial upgrading and promoting the booming development of local public health and environmentally friendly industries in the long run.
Third, establish a green production legal system. The Beijing-Tianjin-Hebei region should formulate a long-term and stable environmental regulatory mechanism. Municipal governments should formulate local environmental laws and regulations according to the conditions, and determine the minimum standards for environmental governance according to the nature of the enterprise, effectively monitoring and managing the pollution behavior conducted by the enterprise, formulating reasonable incentive measures, and encouraging enterprises to carry out environmental technology research and development.
Author Contributions
Writing—review and editing, F.Z.; data collection and analyzing data, writing—original draft preparation, N.X.; review of draft manuscript, L.W. and Q.T. All authors have read and agreed to the published version of the manuscript.
Funding
This research was financially supported by the research funds from the state key program of National Natural Science Foundation of China (Grant No. 71533004) and the National Key Research and Development Program of China (grant number 2016YFA0602502).
Conflicts of Interest
The authors declare no conflict of interests.
References
- Nathaniel, S.P.; Iheonu, C. Carbon dioxide abatement in Africa: The role of renewable and non-renewable energy consumption. Sci. Total Environ. 2019, 679, 337–345. [Google Scholar] [CrossRef] [PubMed]
- Lv, Z.; Xu, T. Trade openness, urbanization and CO2 emissions: Dynamic panel data analysis of middle-income countries. J. Int. Trade Econ. Dev. 2019, 28, 1–14. [Google Scholar] [CrossRef]
- WHO. WHO Releases Country Estimates on Air Pollution Exposure and Health Impact. Available online: https://www.who.int/en/news-room/detail/27-09-2016-who-releases-country-estimates-on-air-pollution-exposure-and-health-impact (accessed on 12 March 2020).
- Matz, C.J.; Egyed, M.; Xi, G.L.; Racine, J.; Pavlovic, R.; Rittmaster, R.; Henderson, S.B.; Stieb, D.M. Health impact analysis of PM2.5 from wildfire smoke in Canada (2013–2015, 2017–2018). Sci. Total Environ. 2020, 8, 156–166. [Google Scholar] [CrossRef] [PubMed]
- Alattar, N.; Yousif, J. Evaluating Particulate Matter (PM2.5 and PM10) Impact on Human Health in Oman Based on a Hybrid Artificial Neural Network and Mathematical Models. In Proceedings of the 2019 International Conference on Control, Artificial Intelligence, Robotics & Optimization (ICCAIRO), Majorca Island, Spain, 6 April 2020; pp. 129–135. [Google Scholar]
- Huang, Y.S.; Ji, Y.X.; Zhu, Z.M.; Zhang, T.H.; Gong, W.; Xia, X.H.; Sun, H.; Zhong, X.; Zhou, X.Y.; Chen, D.Q. Satellite-based spatiotemporal trends of ambient PM2.5 concentrations and influential factors in Hubei, Central China. Atmos. Res. 2020. [Google Scholar] [CrossRef]
- Harvey, D. From managerialism to entrepreneurialism: The transformation in urban governance in late capitalism. Geogr. Ann. Ser. B Hum. Geogr. 1989, 71, 3–17. [Google Scholar] [CrossRef]
- Fleischmann, A.; Feagin, J.R. The politics of growth-oriented urban alliances: Comparing old industrial and new Sunbelt cities. Urban. Aff. Q. 1987, 23, 207–232. [Google Scholar] [CrossRef]
- Ron, M.; Peter, S.; Ben, G.; Emil, E.; Peter, T. The city dimension of the productivity growth puzzle: The relative role of structural change and within-sector slowdown. J. Econ. Geogr. 2018, 18, 539–570. [Google Scholar]
- Ye, Z. A research on dynamic relationship between OFDI and industrial structure optimization—A case study of Guangdong province. Mod. Econ. 2016, 7, 55–63. [Google Scholar] [CrossRef] [Green Version]
- Hong, Y.; Zhou, Y.; Abbaspour, K.C. An analysis of economic growth and industrial wastewater pollution relations in China. Cons. J. Sustain. Dev. 2016, 4, 60–79. [Google Scholar]
- Chen, M.S.; Gu, Y.L. The mechanism and measures of adjustment of industrial organization Structure: The perspective of energy saving and emission reduction. Energy Procedia 2011, 5, 2562–2567. [Google Scholar]
- Mi, Z.F.; Pan, S.Y.; Yu, H.; Wei, Y.M. Potential impacts of industrial structure on energy consumption and CO2 emission: A case study of Beijing. J. Clean. Prod. 2015, 103, 455–462. [Google Scholar] [CrossRef] [Green Version]
- Liu, G.Y.; Hao, Y.; Zhou, Y.; Yang, Z.F.; Zhang, Y.; Su, M.R. China’s low-carbon industrial transformation assessment based on Logarithmic Mean Divisia Index model. Resour. Conserv. Recycl. 2016, 108, 156–170. [Google Scholar] [CrossRef]
- Hao, Y.; Liu, Y.M. The influential factors of urban PM2.5 concentrations in China: A spatial econometric analysis. J. Clean. Prod. 2016, 112, 1443–1453. [Google Scholar] [CrossRef]
- Fu, B.; Gao, X.H.; Wu, L.F. Grey relational analysis for the AQI of Beijing, Tianjin, and Shijiazhuang and related countermeasures. Grey Syst. Theory Appl. 2018, 8, 156–166. [Google Scholar] [CrossRef]
- Wang, Y.; Liu, H.W.; Mao, G.Z.; Zuo, J.; Ma, J.L. Inter-regional and sectoral linkage analysis of air pollution in Beijing–Tianjin–Hebei (Jing-Jin-Ji) urban agglomeration of China. J. Clean. Prod. 2017, 165, 1436–1444. [Google Scholar] [CrossRef]
- Wang, W.C.; Chen, C. A quantitative analysis on spatial distribution of the pollutants in the urban air and their impact factors based on geostatistics and gis: A case study of hangzhou city. Geogr. Res. 2008, 27, 241–250. [Google Scholar]
- Lin, B.Q.; Zhu, J.P. Changes in urban air quality during urbanization in China. J. Clean. Prod. 2018, 188, 312–321. [Google Scholar] [CrossRef]
- Liu, S.H.; Hua, S.B.; Wang, K.; Qiu, P.P.; Liu, H.J.; Wu, B.B.; Shao, P.Y.; Liu, X.Y.; Wu, Y.M.; Xue, Y.F.; et al. Spatial-temporal variation characteristics of air pollution in Henan of China: Localized emission inventory, WRF/Chem simulations and potential source contribution analysis. Sci. Total Environ. 2018, 624, 396–406. [Google Scholar] [CrossRef]
- Liu, G.Y.; Yang, Z.F.; Chen, B.; Zhang, Y.; Su, M.R.; Ulgiati, S. Prevention and control policy analysis for energy-related regional pollution management in China. Appl. Energy 2016, 166, 292–300. [Google Scholar] [CrossRef]
- Wang, Y.; Wang, J.Y.; Zhang, M.; Shi, L. Spatial Correlation Analysis of Energy Consumption and Air Pollution in Beijing-Tianjin-Hebei Region. Energy Procedia 2019, 158, 4280–4285. [Google Scholar]
- Zhu, L.; Gan, Q.; Liu, Y.; Yan, Z. The impact of foreign direct investment on SO2, emissions in the Beijing-Tianjin-Hebei region: A spatial econometric analysis. J. Clean. Prod. 2017, 166, 189–196. [Google Scholar] [CrossRef]
- Zheng, D.; Shi, M. Multiple environmental policies and pollution haven hypothesis: Evidence from China’s polluting industries. J. Clean. Prod. 2017, 141, 295–304. [Google Scholar] [CrossRef]
- Sun, L.; Pan, B.L.; Gu, A.L.; Lu, H.; Wang, W. Energy–water nexus analysis in the Beijing–Tianjin–Hebei region: Case of electricity sector. Renew. Sustain. Energy Rev. 2018, 93, 27–34. [Google Scholar] [CrossRef]
- Fang, C.L.; Cui, X.G.; Li, G.D.; Bao, C.; Wang, Z.B.; Ma, H.T.; Sun, S.A.; Liu, H.M.; Luo, K.; Ren, Y.F. Modeling regional sustainable development scenarios using the Urbanization and Eco-environment Coupler: Case study of Beijing-Tianjin-Hebei urban agglomeration, China. Sci. Total Environ. 2019, 689, 820–830. [Google Scholar] [CrossRef]
- Zhao, Q.; Niu, M.Y. Influence Analysis of FDI on China’s Industrial Structure Optimization. Procedia Comput. Sci. 2013, 17, 1015–1022. [Google Scholar]
- Li, J.M.; Han, X.L.; Jin, M.J.; Zhang, X.X.; Wang, S.X. Globally analysing spatiotemporal trends of anthropogenic PM2.5 concentration and population’s PM2.5 exposure from 1998 to 2016. Environ. Int. 2019, 128, 46–62. [Google Scholar] [CrossRef] [PubMed]
- Hille, K.; Shahbaz, M.; Moosa, I. The impact of FDI on regional air pollution in the Republic of Korea: A way ahead to achieve the green growth strategy? Energy Econ. 2019, 81, 308–326. [Google Scholar] [CrossRef] [Green Version]
- Wan, Y.; Li, Y.H.; Liu, C.H.; Li, Z.Q. Is traffic accident related to air pollution? A case report from an island of Taihu Lake, China. Atmos. Pollut. Res. 2020, 11, 1028–1033. [Google Scholar] [CrossRef]
- Laurent, O.; Benmarhnia, T.; Milesi, C.; Hu, J.L.; Kleeman, M.J.; Cockburn, M.; Wu, J. Relationships between greenness and low birth weight: Investigating the interaction and mediation effects of air pollution. Environ. Res. 2019, 175, 124–132. [Google Scholar] [CrossRef]
- Liu, J.K.; Yan, G.X.; Wu, Y.N.; Wang, Y.; Zhang, Z.M.; Zhang, M.X. Wetlands with greater degree of urbanization improve PM2.5 removal efficiency. Chemosphere 2018, 207, 601–611. [Google Scholar] [CrossRef]
- Wang, X.C.; Klemeš, J.J.; Dong, X.B.; Fan, W.G.; Xu, Z.H.; Wang, Y.T.; Varbanov, P.S. Air pollution terrain nexus: A review considering energy generation and consumption. Renew. Sustain. Energy Rev. 2019, 205, 71–85. [Google Scholar] [CrossRef]
- Atmospheric Composition Analysis Group. Available online: http://fizz.phys.dal.ca/~atmos/martin/?page_id=140 (accessed on 5 March 2020).
- Department of Urban Socioeconomic Investigation, National Bureau of Statistics. Available online: http://data.cnki.net/yearbook/Single/N2019070173 (accessed on 10 March 2020).
Figure 1.
Geographic location, air quality and industrial development status of the Beijing-Tianjin-Hebei region.
Figure 1.
Geographic location, air quality and industrial development status of the Beijing-Tianjin-Hebei region.


Table 1.
Statistical characteristics and units of variables.
| Variable Name | Description | Unit | Sample Size | Mean | Std. Dev. | Min | Max |
|---|---|---|---|---|---|---|---|
| PM2.5 | PM2.5 concentration | – | 234 | 58.86 | 21.15 | 14 | 108 |
| 2S | The proportion of secondary industry | % | 234 | 47.71 | 8.37 | 19.01 | 62.1 |
| 3S | The proportion of the tertiary industry | % | 234 | 40.24 | 11.49 | 24.44 | 80.56 |
| FA | Fixed asset investment | Ten thousand yuan | 234 | 1.79 × 10⁷ | 2.33 × 10⁷ | 338,434 | 1.30 × 10⁸ |
| Innovation | Micro invention patent | – | 234 | 4883.39 | 14,455.83 | 36 | 106,948 |
| Open | Actual use of foreign investment as a percentage of GDP | % | 234 | 2.42 | 2.50 | 0.07 | 15.36 |
| Pop | The population density | People / km2 | 234 | 2971.22 | 2148.00 | 614 | 11,880 |
| FDI | Actual use of foreign investment | Ten thousand yuan | 234 | 1,122,386 | 2,648,440 | 3799 | 2.05 × 10⁷ |
| Trans | Private car ownership per unit of highway mileage | – | 234 | 39.86 | 41.55 | 3 | 209.94 |
| Enviro | Green area coverage in built-up area | % | 234 | 39.33 | 7.62 | 23.34 | 92.87 |
| UL | Urban population as a proportion of total population | % | 234 | 43.45 | 14.81 | 20 | 84 |
| CEI | CO2 emissions per unit of GDP | Ton / million | 234 | 3.43 | 1.86 | 0.38 | 9.36 |
Table 2.
Single equation estimation results of secondary industry and air pollution.
| OLS | FE | RE | OLS | FE | RE | ||
|---|---|---|---|---|---|---|---|
| 2S | PM2.5 | ||||||
| PM2.5 | 0.205 *** | 0.088 *** | 0.111 *** | 2S | 0.877 *** | 0.434 *** | 0.478 *** |
| (11.09) | (2.87) | (4.00) | (6.37) | (2.94) | (3.29) | ||
| FA (ln) | 3.712 *** | 1.668 *** | 1.714 *** | Pop (ln) | 5.336 *** | −0.530 | −0.226 |
| (7.27) | (3.98) | (4.18) | (4.11) | (−0.42) | (−0.18) | ||
| Innovation (ln) | −5.873 *** | −3.394 *** | −3.573 *** | FDI (ln) | 2.951 ** | 1.035 | 1.192 |
| (−12.64) | (−7.57) | (−8.27) | (2.04) | (1.01) | (1.15) | ||
| Open | 0.680 *** | 0.291 | 0.289 * | Trans (ln) | 18.799 *** | 5.317 ** | 6.194 *** |
| (3.81) | (1.58) | (1.64) | (6.97) | (2.50) | (2.90) | ||
| Enviro | −0.432 *** | 0.056 | 0.039 | ||||
| (−2.96) | (0.54) | (0.37) | |||||
| Open | −1.639 *** | −1.162 ** | −1.214 *** | ||||
| (−2.91) | (−2.51) | (−2.64) | |||||
| UL | −0.968 *** | −0.060 | −0.154 | ||||
| (−5.96) | (−0.36) | (−0.93) | |||||
| CEI | −2.692 *** | −1.009 | −1.255 | ||||
| (−3.84) | (−1.27) | (−1.62) | |||||
| _cons | 15.187 *** | 38.564 *** | 37.688 *** | −50.046 *** | 18.698 | 15.137 | |
| (2.61) | (9.60) | (8.92) | (−2.80) | (0.96) | (0.78) | ||
| R-sq | 0.556 | 0.507 | 0.525 | 0.595 | 0.384 | 0.449 | |
| N | 234 | 234 | 234 | 234 | 234 | 234 | |
| Prob > F | 0.0000 | 0.0000 | |||||
| Prob > chibar2 | 0.0000 | 0.0000 | |||||
| Hausman test | −4.27 | 304.65 *** |
Note: The numbers in brackets are t statistics; ***, **, and * represent their significance at 1%, 5%, and 10% levels, respectively.
Table 3.
Single equation estimation results of tertiary industry and air pollution.
| OLS | FE | RE | OLS | FE | RE | ||
|---|---|---|---|---|---|---|---|
| 3S | PM2.5 | ||||||
| PM2.5 | −0.217 *** | −0.078 * | −0.117 *** | 3S | −0.700 *** | −0.176 | −0.213 * |
| (−10.00) | (−1.84) | (−3.18) | (−5.52) | (−1.56) | (−1.89) | ||
| FA (ln) | −2.958 *** | −0.899 | −1.076 * | Pop (ln) | 5.314 *** | −0.226 | 0.132 |
| (−4.94) | (−1.55) | (−1.92) | (4.01) | (−0.18) | (0.10) | ||
| Innovation (ln) | 7.493 *** | 4.377 *** | 4.922 *** | FDI (ln) | 3.136 ** | 0.550 | 0.720 |
| (13.74) | (7.04) | (8.42) | (2.13) | (0.54) | (0.69) | ||
| Open | −0.036 | −0.210 | −0.060 | Trans (ln) | 21.148 *** | 6.669 *** | 7.726 *** |
| (−0.17) | (−0.83) | (−0.25) | (7.93) | (3.20) | (3.67) | ||
| Enviro | −0.578 *** | 0.030 | 0.003 | ||||
| (−3.97) | (0.28) | (0.03) | |||||
| Open | −1.347 ** | −0.973 ** | −1.024 ** | ||||
| (−2.33) | (−2.10) | (−2.22) | |||||
| UL | −0.922 *** | −0.113 | −0.208 | ||||
| (−5.25) | (−0.63) | (−1.18) | |||||
| CEI | −2.337 *** | −1.097 | −1.324 * | ||||
| (−3.30) | (−1.35) | (−1.67) | |||||
| _cons | 48.756 *** | 29.605 *** | 30.582 *** | −50.046 *** | 18.698 | 15.137 | |
| (7.14) | (5.32) | (5.31) | (−2.80) | (0.96) | (0.78) | ||
| R-sq | 0.676 | 0.615 | 0.648 | 0.595 | 0.384 | 0.449 | |
| N | 234 | 234 | 234 | 234 | 234 | 234 | |
| Prob > F | 0.0000 | 0.0000 | |||||
| Prob > chibar2 | 0.0000 | 0.0000 | |||||
| Hausman test | −11.51 | 304.65 *** |
Note: The numbers in brackets are t statistics; ***, **, and * represent their significance at 1%, 5%, and 10% levels, respectively.
Table 4.
Estimated results of the simultaneous equations for secondary industry and air pollution.
| (1) | (2) | (3) | (4) | (5) | (6) | |
|---|---|---|---|---|---|---|
| 2S | ||||||
| PM2.5 | 0.092 | 0.075 | 0.155 *** | 0.141 *** | 0.284 *** | 0.264 *** |
| (1.22) | (0.99) | (4.22) | (4.02) | (10.26) | (9.76) | |
| FA (ln) | −1.437 *** | −1.364 *** | 3.250 *** | 3.348 *** | 3.490 *** | 3.501 *** |
| (−2.97) | (−2.79) | (6.34) | (6.52) | (6.65) | (6.78) | |
| Innovation (ln) | −4.937 *** | −4.948 *** | −5.886 *** | −5.862 *** | ||
| (−12.00) | (−11.96) | (−12.30) | (−12.44) | |||
| Open | 0.762 *** | 0.741 *** | ||||
| (4.09) | (4.03) | |||||
| _cons | 65.214 *** | 65.056 *** | 20.690 *** | 20.063 *** | 13.941 ** | 14.858 ** |
| (11.20) | (11.04) | (3.57) | (3.44) | (2.33) | (2.52) | |
| PM2.5 | ||||||
| 2S | −3.288 * | 12.657 *** | 0.484 * | 0.339 | 0.466 ** | 0.501 ** |
| (−1.90) | (5.96) | (1.89) | (1.30) | (1.99) | (2.21) | |
| Pop (ln) | 11.978 *** | 3.290 | 8.172 *** | 8.013 *** | 3.484 *** | 3.677 *** |
| (3.23) | (1.08) | (5.56) | (5.43) | (2.84) | (2.97) | |
| FDI (ln) | 20.786 *** | −3.406 *** | −0.615 | 3.642 *** | 3.940 *** | |
| (4.76) | (−2.83) | (−0.38) | (2.70) | (2.86) | ||
| Trans (ln) | 15.874 *** | 13.752 *** | 24.422 *** | 22.722 *** | ||
| (7.85) | (6.15) | (9.38) | (7.93) | |||
| Enviro | −0.644 *** | −0.717 *** | −0.677 *** | −0.636 *** | ||
| (−3.65) | (−3.93) | (−4.71) | (−4.36) | |||
| Open | −1.841 *** | −1.680 *** | −1.821 *** | |||
| (−2.81) | (−3.04) | (−3.29) | ||||
| UL | −1.233 *** | −1.255 *** | ||||
| (−6.22) | (−6.58) | |||||
| CEI | −1.401 ** | |||||
| (−2.05) | ||||||
| _cons | 123.130 | −831.274 *** | −10.890 | −23.566 | −31.028 | −27.949 |
| (1.54) | (−5.66) | (−0.44) | (−0.94) | (−1.51) | (−1.41) | |
| R-sq | −2.516 | −18.023 | 0.426 | 0.415 | 0.550 | 0.573 |
| N | 234 | 234 | 234 | 234 | 234 | 234 |
Note: The numbers in brackets are t statistics; ***, **, and * represent their significance at 1%, 5%, and 10% levels, respectively.
Table 5.
Estimated results of the simultaneous equations for tertiary industry and air pollution.
| (1) | (2) | (3) | (4) | (5) | (6) | |
|---|---|---|---|---|---|---|
| 3S | ||||||
| PM2.5 | −0.180 * | −0.148 | −0.131 *** | −0.149 *** | −0.307 *** | −0.290 *** |
| (−1.91) | (−1.56) | (−3.05) | (−3.73) | (−9.46) | (−9.11) | |
| FA (ln) | 4.396 *** | 4.259 *** | −3.268 *** | −3.201 *** | −2.776 *** | −2.761 *** |
| (7.25) | (6.99) | (−5.48) | (−5.45) | (−4.52) | (−4.54) | |
| Innovation (ln) | 7.400 *** | 7.416 *** | 7.555 *** | 7.516 *** | ||
| (15.44) | (15.67) | (13.45) | (13.53) | |||
| Open | −0.135 | −0.114 | ||||
| (−0.62) | (−0.53) | |||||
| _cons | −19.261 *** | −18.959 *** | 49.172 *** | 49.108 *** | 50.961 *** | 49.941 *** |
| (−2.64) | (−2.58) | (7.29) | (7.36) | (7.28) | (7.21) | |
| PM2.5 | ||||||
| 3S | 0.969 *** | −423.210 *** | −0.467 ** | −0.436 * | −0.385 | −0.425 * |
| (3.04) | (−5.09) | (−2.08) | (−1.89) | (−1.63) | (−1.85) | |
| Pop (ln) | 10.804 *** | −311.644 *** | 8.021 *** | 7.693 *** | 4.100 *** | 3.959 *** |
| (4.79) | (−4.82) | (5.52) | (5.31) | (3.28) | (3.17) | |
| FDI (ln) | 1880.267 *** | −2.806 ** | −0.293 | 3.984 *** | 4.462 *** | |
| (5.25) | (−2.16) | (−0.18) | (2.91) | (3.23) | ||
| Trans (ln) | 17.185 *** | 15.340 *** | 24.773 *** | 22.647 *** | ||
| (8.00) | (6.50) | (9.89) | (8.36) | |||
| Enviro | −0.680 *** | −0.771 *** | −0.622 *** | −0.601 *** | ||
| (−4.21) | (−4.46) | (−4.52) | (−4.36) | |||
| Open | −1.492 ** | −1.450 ** | −1.644 *** | |||
| (−2.23) | (−2.50) | (−2.86) | ||||
| UL | −1.235 *** | −1.248 *** | ||||
| (−5.25) | (−5.47) | |||||
| CEI | −1.646 ** | |||||
| (−2.45) | ||||||
| _cons | −63.662 *** | −4094.03 *** | 21.775 | 4.761 | −6.153 | 3.316 |
| (−2.81) | (−5.91) | (1.32) | (0.26) | (−0.39) | (0.20) | |
| R-sq | −0.379 | 375e+04 | 0.441 | 0.449 | 0.544 | 0.564 |
| N | 234 | 234 | 234 | 234 | 234 | 234 |
Note: The numbers in brackets are t statistics; ***, **, and * represent their significance at 1%, 5%, and 10% levels, respectively.
© 2020 by the authors. Licensee MDPI, Basel, Switzerland. This article is an open access article distributed under the terms and conditions of the Creative Commons Attribution (CC BY) license (http://creativecommons.org/licenses/by/4.0/).
Share and Cite
MDPI and ACS Style
Zhang, F.; Xu, N.; Wang, L.; Tan, Q. The Effect of Air Pollution on the Healthy Growth of Cities: An Empirical Study of the Beijing-Tianjin-Hebei Region. Appl. Sci. 2020, 10, 3699. https://0-doi-org.brum.beds.ac.uk/10.3390/app10113699
AMA Style
Zhang F, Xu N, Wang L, Tan Q. The Effect of Air Pollution on the Healthy Growth of Cities: An Empirical Study of the Beijing-Tianjin-Hebei Region. Applied Sciences. 2020; 10(11):3699. https://0-doi-org.brum.beds.ac.uk/10.3390/app10113699
Chicago/Turabian StyleZhang, Fan, Ning Xu, Lishuang Wang, and Qiu Tan. 2020. "The Effect of Air Pollution on the Healthy Growth of Cities: An Empirical Study of the Beijing-Tianjin-Hebei Region" Applied Sciences 10, no. 11: 3699. https://0-doi-org.brum.beds.ac.uk/10.3390/app10113699
Note that from the first issue of 2016, this journal uses article numbers instead of page numbers. See further details here.