Semi-Automatic Cloud-Native Video Annotation for Autonomous Driving


Department of Intelligent Transport Systems and Engineering, Vicomtech, Paseo Mikeletegi 57, 20009 Donostia/San Sebastián, Spain
*
Author to whom correspondence should be addressed.
Appl. Sci. 2020, 10(12), 4301; https://0-doi-org.brum.beds.ac.uk/10.3390/app10124301
Submission received: 23 April 2020
/
Revised: 20 June 2020
/
Accepted: 22 June 2020
/
Published: 23 June 2020
(This article belongs to the Special Issue Innovative Applications of Big Data and Cloud Computing)
Abstract
:An innovative solution named Annotation as a Service (AaaS) has been specifically designed to integrate heterogeneous video annotation workflows into containers and take advantage of a cloud native highly scalable and reliable design based on Kubernetes workloads. Using the AaaS as a foundation, the execution of automatic video annotation workflows is addressed in the broader context of a semi-automatic video annotation business logic for ground truth generation for Autonomous Driving (AD) and Advanced Driver Assistance Systems (ADAS). The document presents design decisions, innovative developments, and tests conducted to provide scalability to this cloud-native ecosystem for semi-automatic annotation. The solution has proven to be efficient and resilient on an AD/ADAS scale, specifically in an experiment with 25 TB of input data to annotate, 4000 concurrent annotation jobs, and 32 worker nodes forming a high performance computing cluster with a total of 512 cores, and 2048 GB of RAM. Automatic pre-annotations with the proposed strategy reduce the time of human participation in the annotation up to 80% maximum and 60% on average.
1. Introduction
Automated Driving (AD) and Advanced Driver Assistance Systems (ADAS) are migrating the automotive sector from purely mechanical and electrical engineering to a broader realm of disciplines, including computer science, information technology (IT), and artificial intelligence (AI) [1,2]. Generally speaking, two main aspects define the concept of AD: (i) Computerized driving, that makes reference to the control of the vehicle’s functions (acceleration, steering, etc.) and (ii) navigation, which refers to the motion planning and to the knowledge of the car’s environment. These two aspects lean on ADAS as gas and breaking control, lane departure warning, cruise control, or traction control among others. Likewise, ADAS use different data sources retrieved from sensors to describe the current state of the surroundings and the vehicle itself as Light Detection and Ranging (LIDAR) [3], radar, or cameras [4,5], as well as networking (from a car to other vehicles or infrastructures as road IoT (Internet of Things) devices, public, or private clouds etc.).
In order to manage the large amount of data from these sensors and the complexity of real road scenarios, ADAS have to rely on high quality machine learning analytics [6] (during this paper the term machine learning will generically refer to both machine learning and deep learning techniques). The performance of ADAS based on video analysis machine learning modules is inherently restricted by the quality and quantity of training and validation data available. A key bottleneck in achieving improvements in any application domain is the availability of ADAS datasets in real driving situations, with sufficient reliability (ground-truth), complexity, and coverage. Advanced approaches consist on Hardware-in-the-Loop (HWiL) simulation, making use of simulated data to feed the ADAS component under test, in order to early identify and fix errors [7]. However, all the approaches must integrate human interactions (Human-in-the-Loop, HiL) to create annotations that can be considered as ground truth. Video annotation is an intense task due to the amount of information they contain. In addition to the large amount of information contained in a single image, in videos we must consider the temporal component, changes in the perspective of the scene, and the relationships of objects between frames. Because of this, each hour of collected video data requires more than 500 h of human intervention to annotate the images separately [8]. There is a wide variety of annotation tools that boost HiL, with different characteristics depending on how they operate and the functionality they provide [9,10]. Some tools are designed with an orientation towards individual annotation [11,12,13], while others orient towards group annotation or even crowdsourcing [14]. There are tools that, as manual annotation is performed, complement them with automatic annotations (interactive annotation) [14,15]. Among the most common annotations, available in almost all tools, for example is the ability to easily draw a rectangle or an ellipse. Some tools allow one to annotate a polygon when it is convenient (e.g., 3D objects) [16], keypoints (e.g., human pose [17]), temporal events [18], or the association of objects between frames of the video [12,17]. Semi-automatic approaches exist to optimize the annotation process by reducing human interactions e.g, with recognition of human activity [19], detection of objects and segmentation throughout a video [20,21,22], as well as methods based on single frame detection such as [23,24,25]. Semi-automatic means they still need HiL interacting in some part of the annotation process. Despite the extensive diversity of the annotation tools described, there is still a need for new custom semi-automatic annotation algorithms and strategies to efficiently address video annotation that meets the computational complexity, data scale, and security requirements inherent in the automotive industry. In this scenario, our contributions can be summarized as follows:
- An innovative architecture to integrate annotation workflows as containerized applications for Annotation as a Service (AaaS). It is comprised of multiple Kubernetes workloads to manage and run containers at scale in an agnostic Kubernetes cluster;
- Obtaining the optimal scaling strategy of the Kubernetes cluster for the execution of automatic annotation processes, through a rationale based on systematic experiments;
- The AaaS implementation for the AD/ADAS semi-automatic annotation use case. It has been demonstrated for the scale of data generated by a highly equipped car during an all-day recording stage that it has an efficient use of computing resources, has optimal runtime, and low cost for each of the automatic annotation jobs and for the annotation process as a whole;
- Up to 80% reduction in manual annotation time when using the proposed automated annotation solution to generate the ground truth in complex AD/ADAS annotation pipelines.
2. Annotation as a Service (AaaS) for ADAS/AD
In the proposed approach of this paper, semi-automatic annotation stands for a collaborative flow in which the annotation steps can be manual or automatic, and are executed in the correct order as previously defined according to a business logic. Labeling objects, events and scenes of road traffic is critical for training and testing ADAS HWiL simulation techniques. These labels can be produced by automated processes, thanks to the unprecedented capabilities of machine learning based techniques, which can produce human-level labels (e.g., object presence and positions in images or 3D point clouds, class and instance-level recognition, pixel-wise segmentation, 3D lane geometry, etc.). When reviewed by human operators, these labels can be declared as ground-truth, and thus, used to evaluate the performance of ADAS/AD functions (e.g., a pedestrian detection system, or a lane keeping assistant) developed [20].
For the ground truth data annotation for AD/ADAS, the business logic of Figure 1 is proposed, which is based on Annotation as a Service (AaaS). AaaS are end-to-end workflows, they serve specific annotation tasks and output annotated data towards a new annotation step. The characteristics of the workflows depend on the annotation case and can be individual processes or pipelines that accumulate several processes. The annotation steps, whether manual or automatic, are executed in the specific order previously defined by an administrator operator. This logic is foreign to the AaaS, and the steps are requested to the system through its API, reporting the case of the annotation, the nature of the annotation (manual or automatic), and the location of the data to be annotated.
There are two main users of the proposed system during the annotation process: (i) The annotators are the operators who perform manual annotation tasks through a Graphical User Interface (GUI), such as definition of the pedestrian pose keypoints, pixel-wise semantic segmentation, definition of objects in a image by means of polygons (2D and 3D), relation of objects between frames (tracking), definition of time lapses between recognized actions, among others; and (ii) Administrator, who may be experienced annotators, data scientists, machine learning engineers, or others who play the role of stakeholders and therefore have a vision of the annotation business case as an end product in a broader context. They can update new recordings in the system to be annotated, define required features and labels, create and monitor annotation steps, and end an annotation business case by defining the recording as ground truth.
3. AaaS Architecture
We propose an AaaS solution to integrate heterogeneous annotation steps as containerized applications. A highly scalable and reliable Kubernetes application is used, agnostic of cloud providers. It is composed by several Kubernetes objects (Pods, Services, Deployments, Volumes, and Jobs) for managing and running the container workloads at scale on Kubernetes clusters, backbone of the semi-automatic annotation business logic. This design follows the microservices philosophy, it is product based (not-project), decentralized, with multiple individually deployable components, composed via services, and designed for failure. Its architecture is presented in Figure 2 and its parts and functionalities are detailed below.
On top of the AaaS, a Kubernetes service provides a load balanced external IP endpoint to expose different endpoints for each running AaaS instance.
It consists of a first layer that serves the API of the AaaS for remote access to the service through HTTP calls, using a containerized Apache Tomcat Web Server (https://tomcat.apache.org/). Another containerized file puller is used to download and integrate the AaaS API. This strategy enables the update and version management of the annotation workflows natively. A third container proxies to the Kubernetes API server from the Pod. This layer is managed by a stateless Kubernetes deployment workload, with the three sidecar containers, providing high availability, status feedback, scalability for replicas, and automatic updates, among others. The deployment mounts and internal non-persistent Kubernetes volume for file sharing between the inner containers.
At starting the file puller container (C1) downloads the RESTful definition of the AaaS API in the file sharing non-persistent volume. When a request to execute a new annotation workflow is received through the external API endpoint and sent to the AaaS RESTful API (C3), the AaaS uses its inner Kubernetes Proxy (C2) container to create the new annotation workflow:
- A Kubernetes job, a workload object to ensure that a specified number of Pods successfully terminate. As Pods successfully complete, the job tracks the successful completions. They are used to execute atomic annotation processes, such as data pre-processing or the execution of an inference with a machine learning model;
- An argo pipeline (https://argoproj.github.io/), a native workflow engine for Kubernetes supporting step based workflows. They are used to execute complex and interdependent processes, ensuring that everything runs according to the defined flow and with the reliability and scalability of Kubernetes;
- A Kubernetes deployment, maintains the desired state for a process in a Pod. Used to serve the backend of the web application for the manual annotation workflow. The implementation of this web application has been previously published in [20] and its implementation details are beyond the scope of this work.
The implemented annotation workflow mounts Kubernetes persistent volumes (abstract storage resources) to provide storage persistence beyond the lifetime of the Pod. In particular, two external volumes are mounted, for sharing the stored data to annotate (input data) and for persistence of the new annotations (output data).
All the images of the containerized application used for the AaaS process are hosted in an Docker container registry that is private, secured, and remotely accessible.
4. Implementation of Automatic Annotation Workflows as AaaS
The main challenge for the proposed AaaS is to perform efficient, resilient, and cost-effective annotation workloads using available resources. It means computational clusters to run the steps of data preparation and annotation, bandwidth, and storage infrastructure to manage the huge volumes of data and intensive human work to validate the ground truth. Next, we propose an implementation of automatic annotation workflows to evaluate these dimensions with different tests specifically designed for the proposed AaaS.
4.1. Analytics
The data is recorded in vehicles equipped with sensors. Back in the garage, this data is uploaded to a cloud storage system from the car, making it available for annotation.
For the purpose of AaaS assessment, we describe a representative generic automatic annotation process, consisting of two fundamental individual annotation steps: (i) A video transcoder which extracts data from raw data containers (RTMaps (https://intempora.com/products/rtmaps.html)) into a mp4 video format, and (ii) an off-the-shelf deep learning based Convolution Neural Network (CNN) detector that produces 2D object detection from videos. For evaluation purposes, these two functional steps are developed as isolated and independent containerized applications, and they are deployed at scale as AaaS.
It is not our intention to contribute scientifically with new detection models or video processing algorithms, but rather in its deployment. Consequently, well-established existing solutions have been chosen to represent the annotation steps. Furthermore, they are challenging processes because they have high computing requirements. The raw video data to be transcoded is in packets ranging in size from 20 GB to over 500 GB. Transcoding jobs, based on ffmpeg (https://ffmpeg.org/), is challenging as it requires large CPU and memory resources. After transcoding, 30-second segments of the original video are obtained in mp4 format. As a CNN detector, we use a MobileNet SSD v1 model trained in the COCO dataset [26]. It retrieves pre-annotations of the most relevant objects for the mp4 videos. Unlike trancoding, it is challenging due to its large CPU resources requirements compared to memory requirement.
4.2. Infrastructure Layer
The general idea in the annotation context of the current work is to have the recordings from a car’s sensors stored on a NAS organized as a filesystem and accessible as http fileserver (URL available in the resources). Furthermore, there is a database with basic information about the recordings stored as a SQL database on PostgreSQL (https://www.postgresql.org/). Finally, to store the annotated results there is an independent document-based database deployed in MongoDB (https://www.mongodb.com/).
The system was initially hosted and tested on the IBM Cloud (formerly known as SoftLayer (http://softlayer.com/)), which provides IaaS through Amsterdam and Frankfurt data centers. Finally a special effort has been made to validate the approach to be cloud agnostic not only in the IBM Cloud but has also been deployed at Amazon Web Service (AWS) using EC2 autoscaled clusters and EFS File Systems for recordings storage. This way validates the agnosticity of the proposed approach. The Kubernetes layer was obtained from the hosted Kubernetes offerings of each of the cited providers, IBM Kubernetes Service, and AWS Elastic Kubernetes Service (EKS) respectively.
The aim is for a pure computing study, that is, as isolated as possible from other effects and bottlenecks. The data is stored in the same location as the computing clusters (Fra05, Frankfurt, Germany). For the same purpose, the output results are saved, without permanence, to the temporary file system on each Pod.
5. AaaS Performance Evaluation
The evaluation focus on the systematic deployment as AaaS of the two containerized applications for transcoding and object detection based on CNN (previously described in Section 4.1). We aim to study how the system manages different scaling strategies in increasing load scenarios, with two questions in focus:
- Given a fixed computing cluster infrastructure how does it handle an increasing workload requirement of multiple simultaneous automatic annotation workflows, even when the computational requirement reaches the limits of the cluster?
- Given a fixed batch of automatic annotation workflows to what extent do they increase their performance in time and cost by adding or improving the computing resources of the cluster?
A single instance of the two individual annotation steps (CNN object detection and transcoding) has been deployed in a single node cluster with 16 cores and 64 GB of RAM. These cluster resources are more than enough to run one instance of each job without reaching the limits of the cluster. Therefore, we obtain without interference an estimate of the resources required by each of the steps separately. Table 1 shows the results of these experiment.
5.1. Low to Medium Scale Video Analysis
Three clusters with different computing resources have been defined for the execution of the experiments. A base cluster is defined as a reference, which serves as a smaller-scale reference. Based on the characteristics of this base cluster, two others are defined that duplicate its computing resources but with two different scaling strategies. The vertical scaling strategy doubles the CPU cores and memory, without increasing the number of worker nodes. In contrast, the horizontal scaling strategy doubles the number of worker nodes with identical characteristics as the base cluster. The specifications of these clusters are in Table 2 and are defined in the context of the scale study, doubling resources vertically and horizontally with respect to a baseline cluster.
5.1.1. CPU-Intensive Job Scaling (CNN Object Detector)
Different concurrences of batch jobs were tested for each of the clusters. Specifically batches of 16, 32, 64, 128, and 256 concurrent jobs. The analysis was carried out using a replica of the same video of a real driving scene on the road, so that the execution of all jobs could be compared. From the point of view of this study, the video content is not relevant since what we are looking for is the study of the management of the workload generated in its processing and analysis. For transcoding a video of 25 GB in size was used, so the studied concurrences were equivalent to video processing from 400 GB to approximately 6.5 TB. For CNN detection, a 6.25 GB mp4 video was used. Each of the different simultaneous batch execution experiments were deployed sequentially that is, a new concurrency test did not start until after 5 min from the time the previous test was completed, and thus guarantee that the system had released the resources from the previous test and was in a standby state.
Figure 3 shows the average CPU load (average per minute) for each worker node in the Kubernetes cluster compared to the time of the entire experiment. The results in plots [a] and [b] are for the base cluster (4 working nodes and 64 cores in total) and for the horizontally scaled cluster (8 working nodes and 128 cores in total) respectively. The hill-like elevations in the graphs represent the workload in each of the different batch concurrency experiments run sequentially (16, 32, 64, 128, and 256). In both graphs [a] and [b], an average CPU load value greater than the number of cores per worker node, which means that traffic in the cluster is queued. The scheduling of a Pod is based on the request values defined for each job. Therefore, the execution of a Pod will be scheduled towards a worker node, only if it has enough available CPU resources to satisfy this requested CPU value. Thus the results show how the system is actually capable of handling (orchestrating) compute requests that are greater than the cluster’s capacity and successfully complete all jobs. The plots [c] and [d] in Figure 3 show, for the two clusters compared, the same analysis of load per worker node, now stacked at 100%. In this way, it is shown how the system balances (orchestrates) the load between the worker nodes throughout the duration of the experiment.
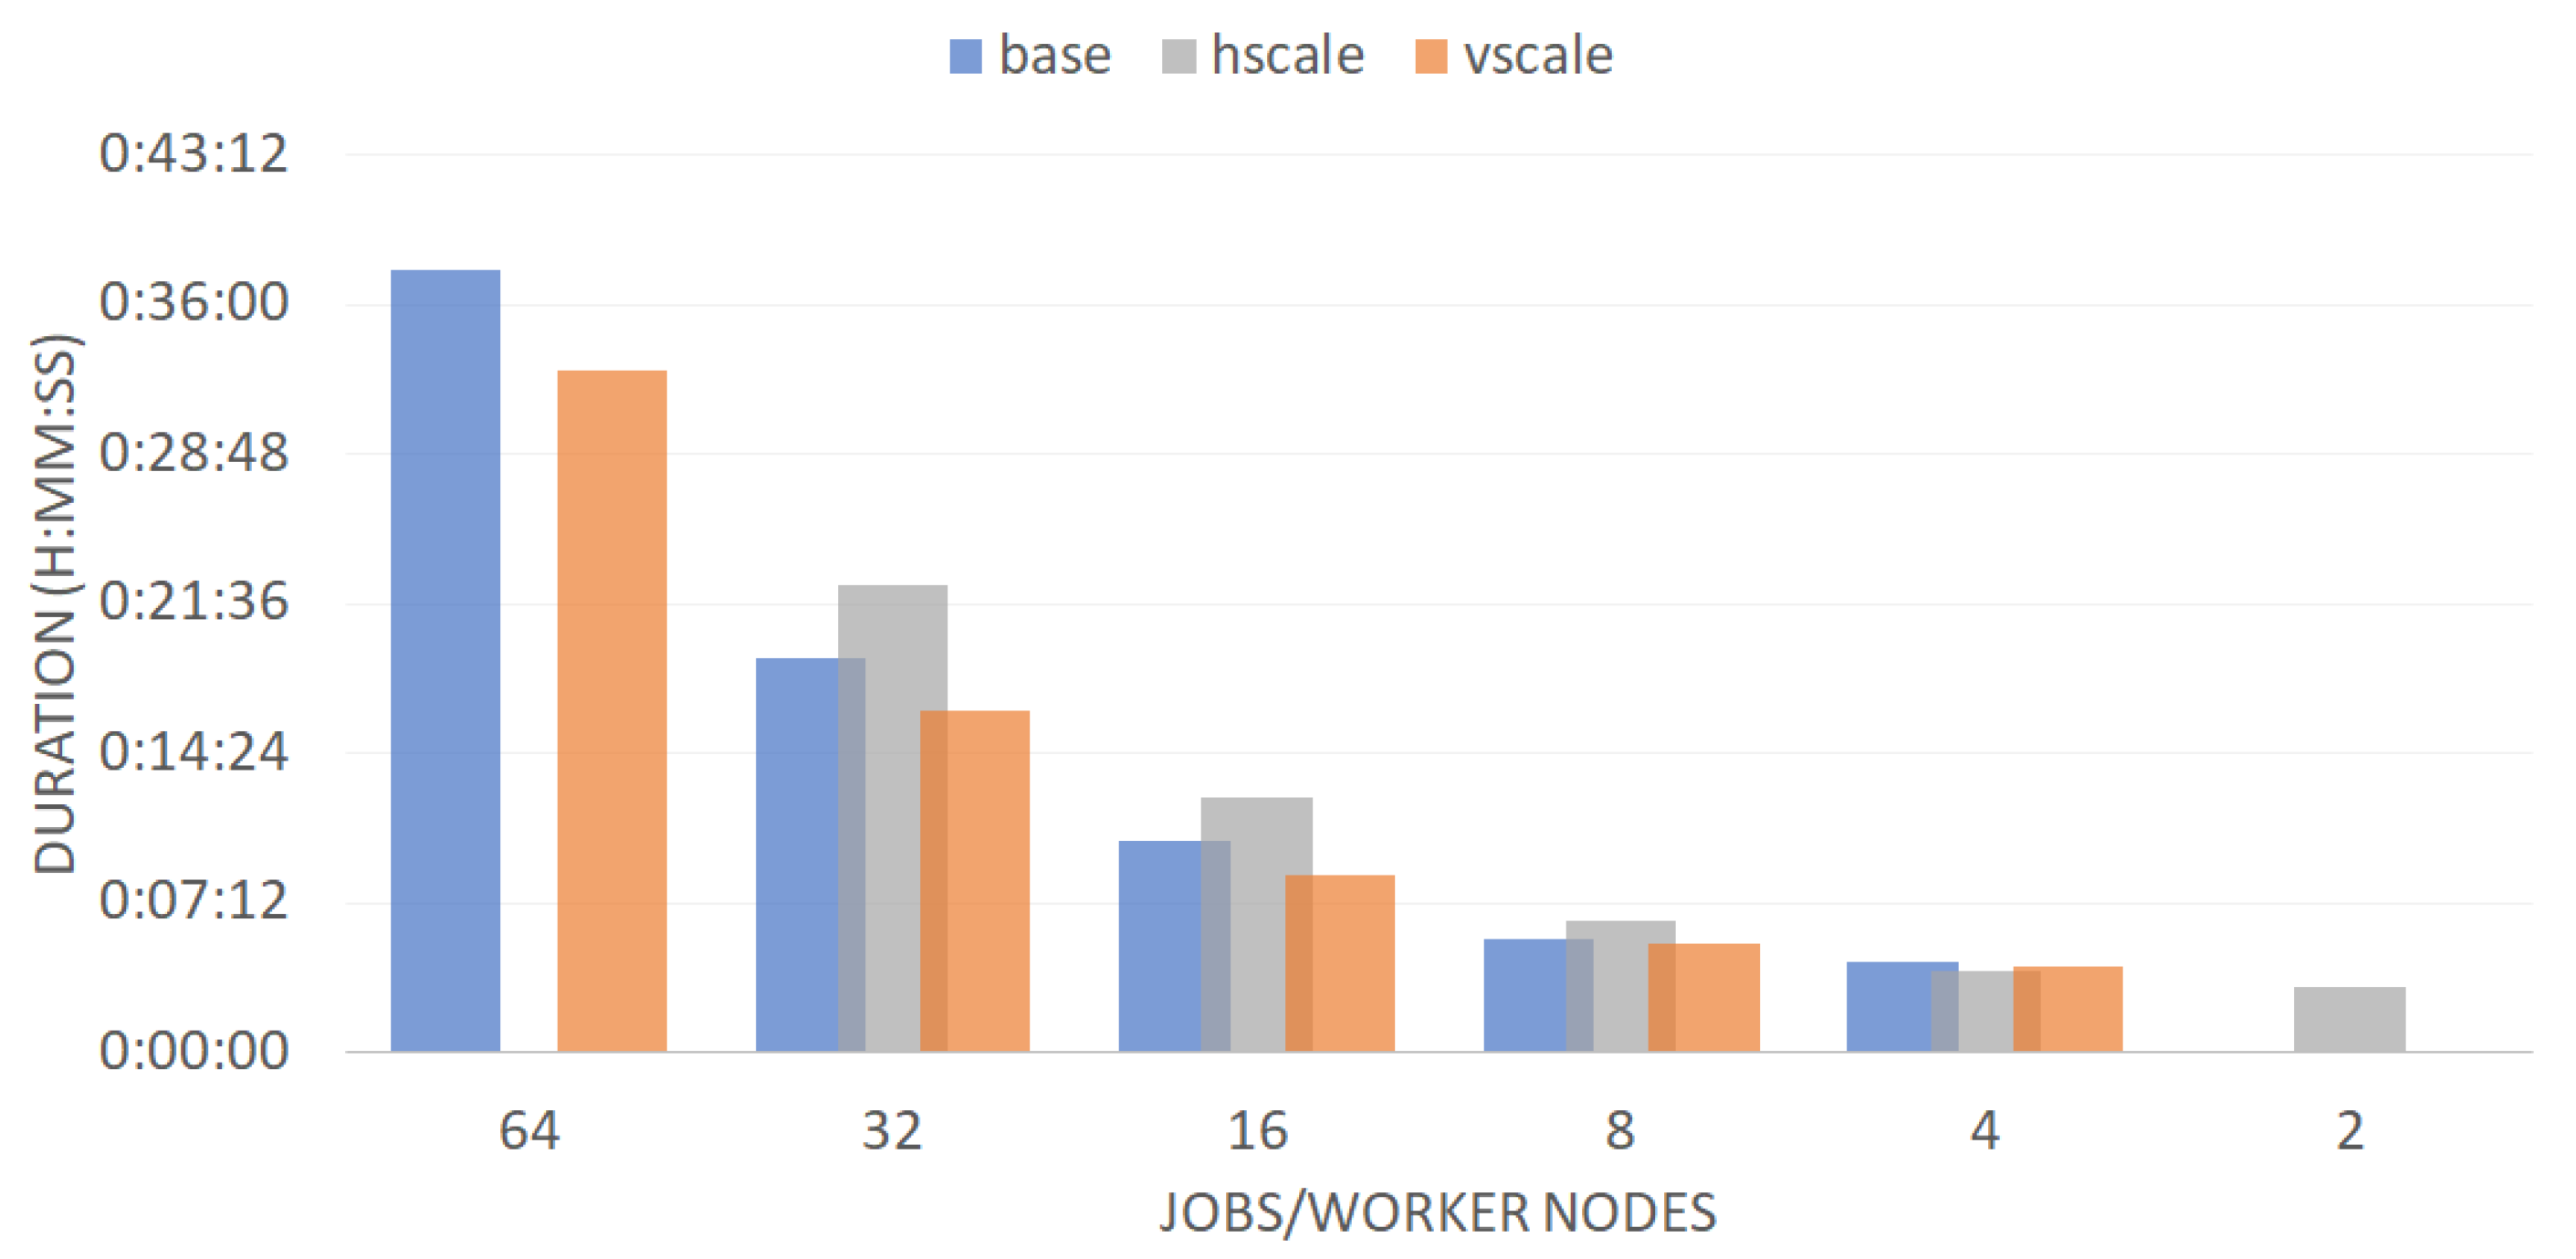
Figure 4 shows the total duration of each complete batch experiment vs. concurrency per worker node (concurrency job/cluster job nodes) for the three deployed clusters (the reference base, horizontally scaled, and vertically scaled). As expected, qualitatively from the graph we can confirm that the duration of the experiment is shorter for scaled clusters, with more resources. More interestingly, we can also observe that the relationship between the cluster resources and the duration of batch processing is not linear. It is observed that doubling the scale of the cluster does not provide half of the processing time. Nor is there a similar behavior between the two cluster scaling strategies. These non-linearities suggest a strong dependence on the efficiency of Kubernetes to manage the orchestration based on the architecture of the cluster, which translates into the different processing times for each experiment.
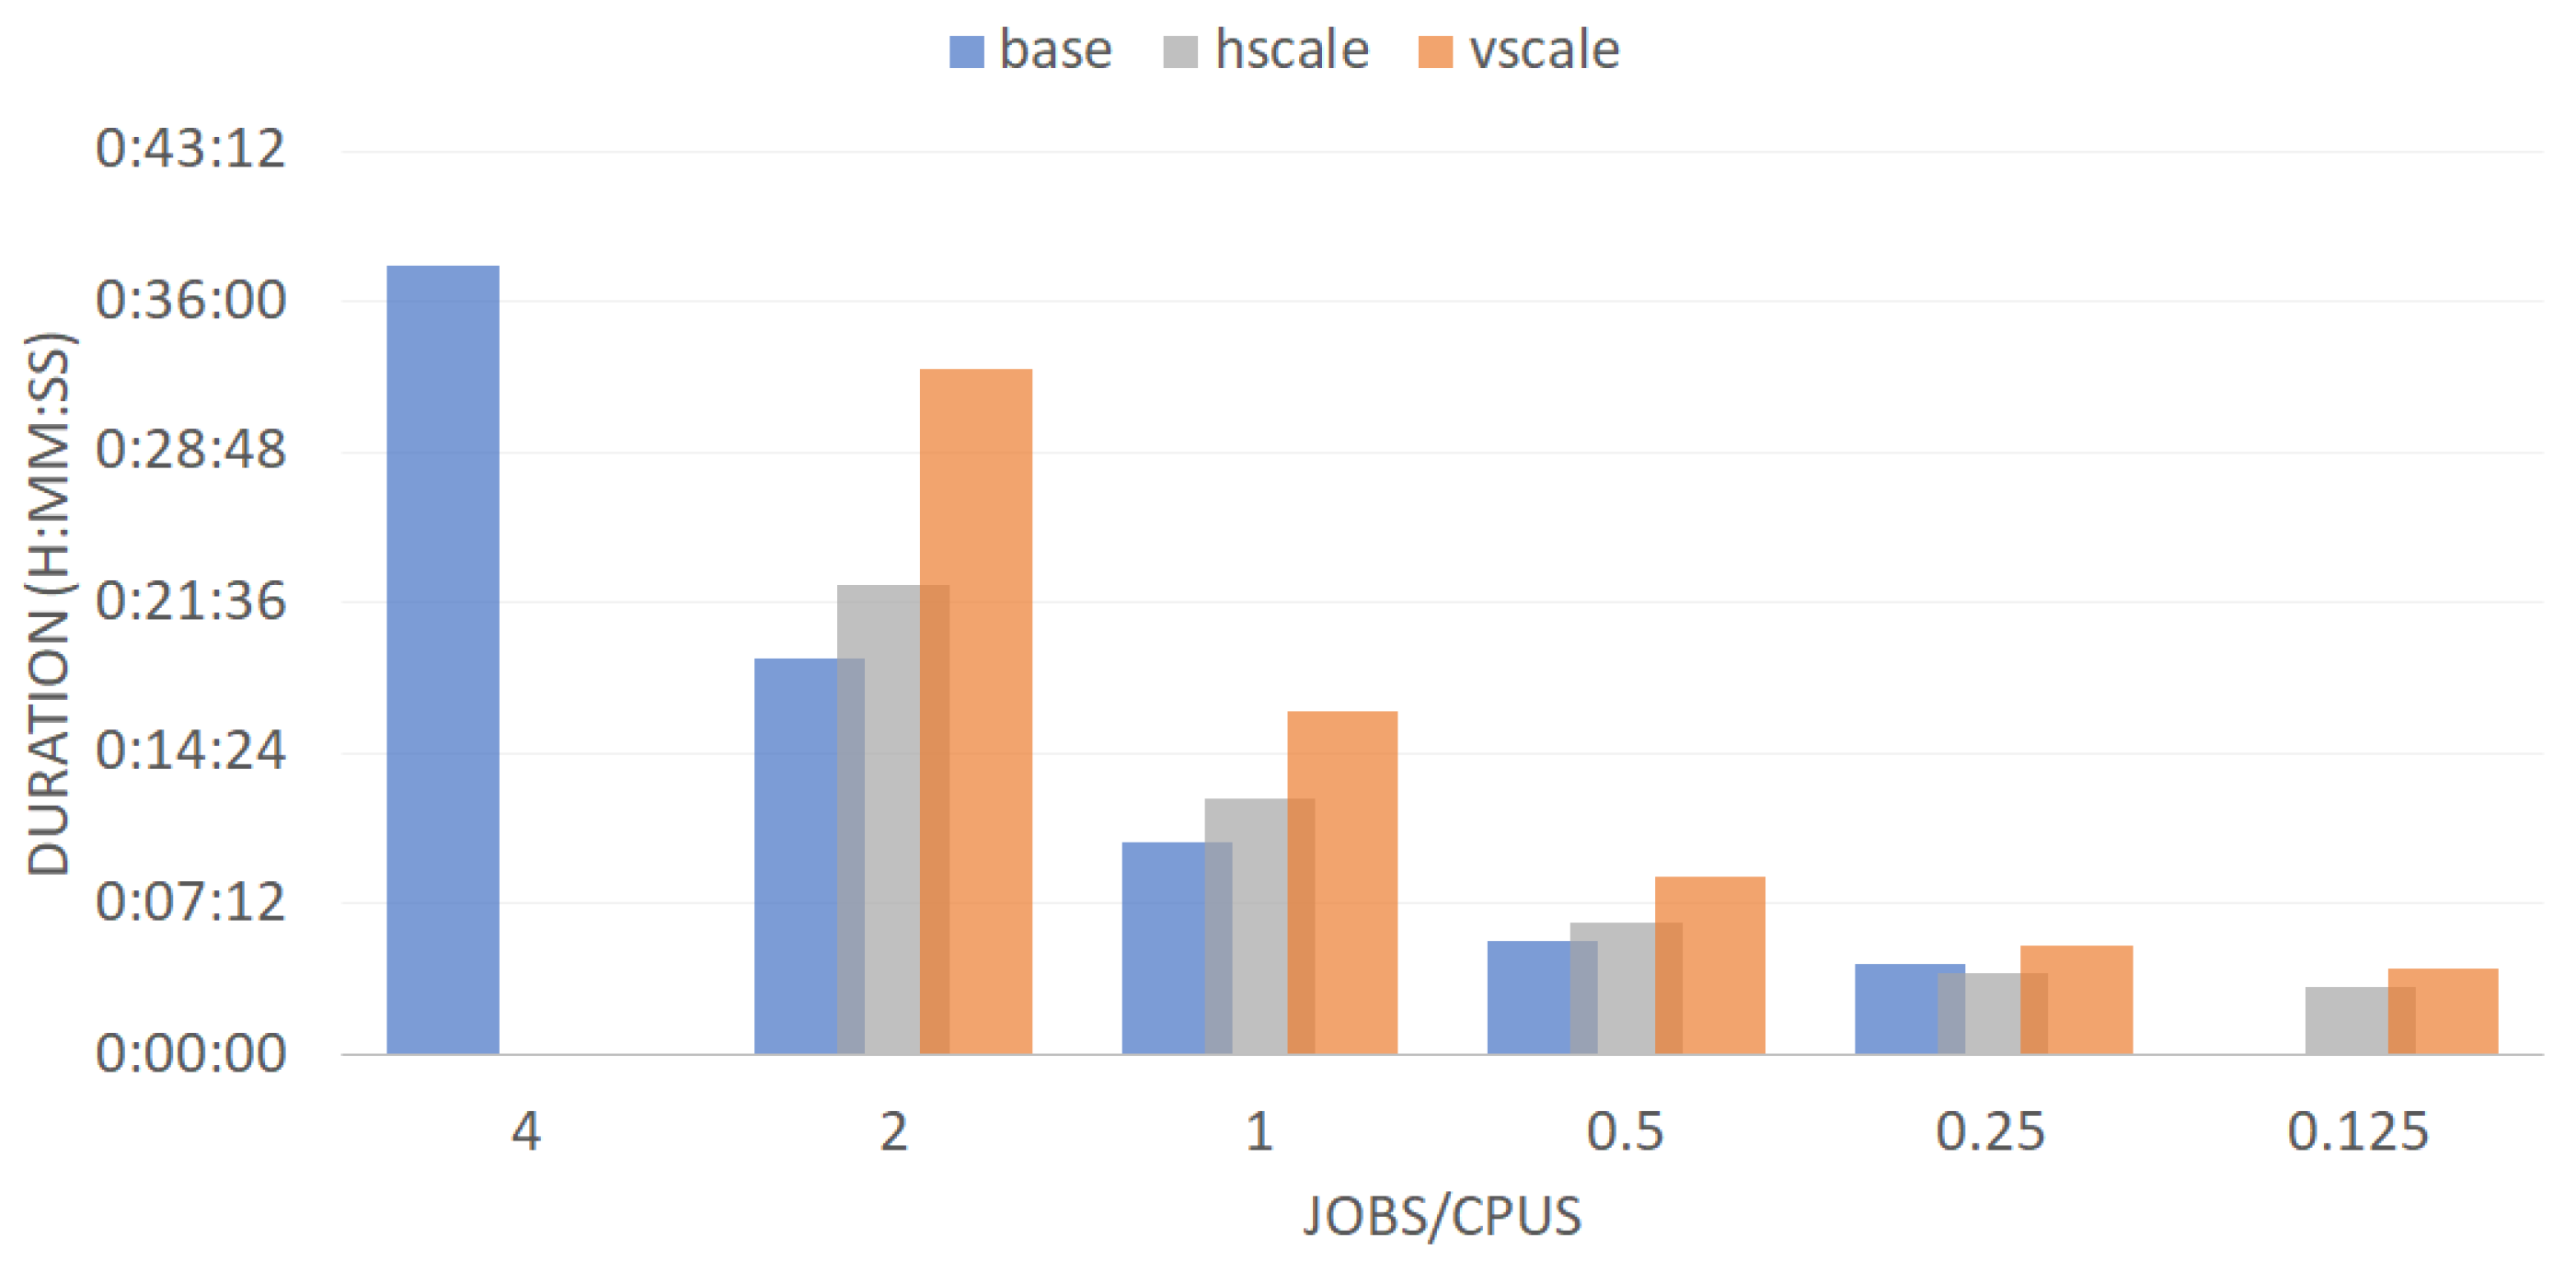
To clarify this last analysis, the average duration of the jobs deployed in each batch experiment is analyzed in relation to the concurrency per core in the cluster (illustrated in Figure 5). It is observed that the end-to-end execution of the average job in the base cluster was always faster than in the scaled clusters. This difference decreased with increasing concurrency. On the other hand, the horizontally scaled cluster showed better performance than the vertically scaled.
From the analysis of the results presented during this Section and specifically in Figure 3, Figure 4 and Figure 5, we can deduce that scaling the resources of a cluster managed by Kubernetes:
- Improved the performance of the overall process, which showed that the higher the concurrency of processes, the better the performance of running those processes;
- More complex cluster architectures (vertical scale) had a lower performance per job, and therefore horizontal scaling was the most effective strategy for the type of jobs considered.
In any case, Kubernetes showed to be able to handle load request peaks above the full capacity of the cluster and ended up completing all tasks. Even if it meant temporarily evicting some tasks and rescheduling them when resources were freed.
5.1.2. CPU and Memory-Intensive Job Scaling (Transcoding)
Containerized analytics in a Kubernetes Pod that consume a lot of memory (such as the Transcoder job defined in Section 4.1), are problematic for the orchestrator when the available resources get saturated, compared to those consuming CPU. If the node still has available memory, the Pod may exceed its initial memory request. However, if the memory that the Pod tries to allocate exceeds its defined limit, the Pod ends. However, in this case, the advantage of using Kubernetes is that the Pod is restarted just like with any other type of runtime failure.
During batch experiments with different concurrency of transcoding jobs (16, 32, 64, 128, and 256), evicted jobs were detected in the base cluster. It was due to a lack of memory resources in the cluster. However, it has been verified that the system was able to restart them and complete all jobs successfully. Jobs evicted are undesirable, and we have forced their appearance only for the sake of this reliability study.
Figure 6 shows how the batch duration of transcoding jobs (high CPU consumption, but mostly stuck for high memory consumption) varies for the different concurrency experienced and for the two scaled clusters (vertically and horizontally). The trend of both clusters is similar. It can be concluded that memory expansion was not related so much to the speed of the calculation of each job, but rather to the reliability of the process (avoiding failed jobs) and the ability to deal with concurrent jobs.
5.1.3. Cost Analysis
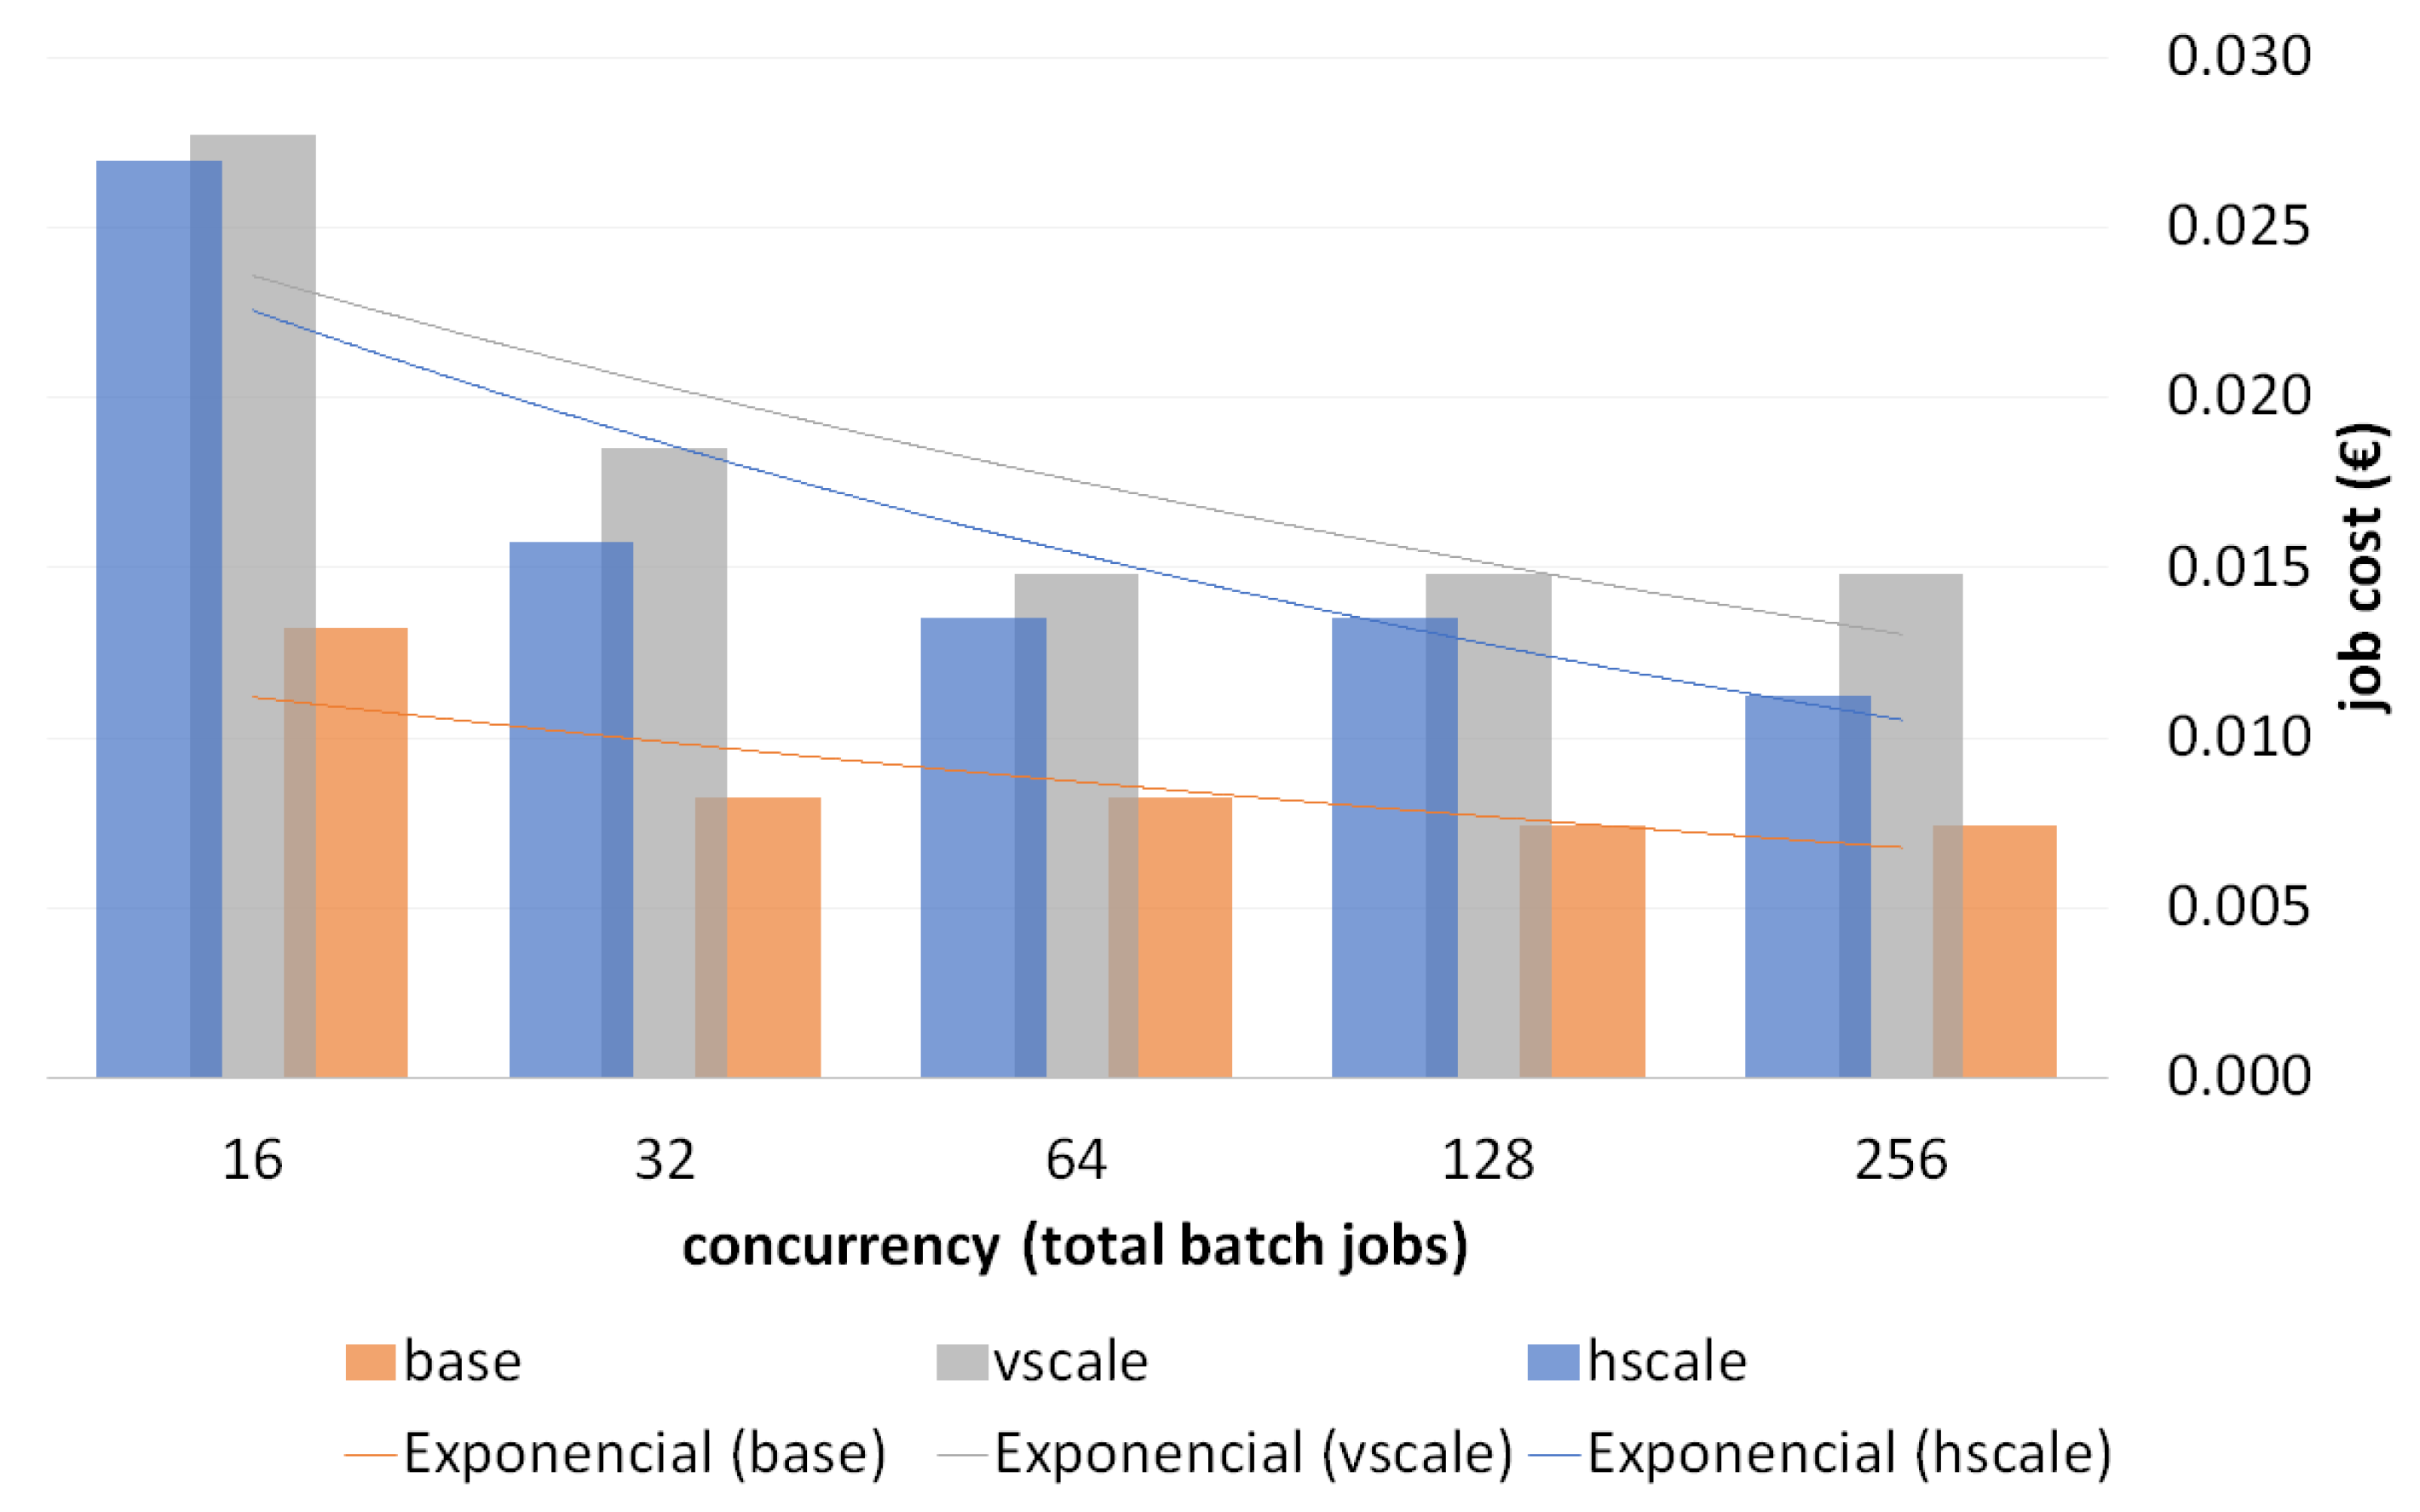
Figure 7 shows the cost-per-job (€). It was calculated based on the effective computation time to complete the execution of a job for each experiment (total duration of the batch divided by jobs per batch) and cost of the cluster (€/second). As expected, scaling up resources means higher costs. However, it can also be observed from the trend lines in the graph that the cost-per-job gap between the base cluster and scaled clusters decreased as concurrency increased.
Taking the results of the experiments in this section, it is concluded that the horizontal scale strategy optimized the runtime and cost per job.
6. Video Annotation at AD/ADAS Scale
The proposed system ingests raw data from vehicle sensors (i.e., videos from internal and external cameras, sequences of 3D point-cloud maps from LIDAR, etc.), plus files with calibration data, odometry, and label-type metadata. The raw data was processed for formatting, standardization, or testing data compliance (e.g., transform into ISO 8855, or extraction from multi-sensor containers such as RTMaps, ADTF, or ROS), as well as to automatically pre-label content using automatic machine learning analytics.
The volume of raw data from in-vehicle sensors may reach up to 40 TB per car per day, depending on the equipment. As an example, a typical instrument is the Velodyne LIDAR model HDL-64E, which produces ∼ 2,000,000 points per second and its throughput is Mbps to Mbps, which means MB per minute and GB per hour. More importantly, a 2-Megapixel camera (24 bpp) operating at 30 fps generates 1440 Mbps, GB per hour; a setup with 4 of those cameras placed in the car’s roof need to be considered to get a 360 view, which generate more than 2.5 TB per hour. A typical recording trip lasts between 4 and 8 h. Therefore, up to 40 TB of data can be recorded at the end of a recording day taking into account LIDAR and external cameras. Data are kept uncompressed for the HWiL process, in order to stream native sensor data to the ECU (Electronic Control Unit) or Function Under Test (FUT) in a simulation environment.
The following experiment focuses on analyzing the performance of running highly concurrent COCO SSD MobileNet v1 as AaaS jobs for a video volume equivalent to that retrieved by an equipped car during the one-day recording stage. All the video volume for the experiment was obtained from the replica of the same video, so that the execution of all the tasks was comparable. A 6.25 GB video replicated for 4000 concurrent jobs was used to reproduce the order of magnitude of the video processing sought, extending the test to 25 TB of total video processing.
Following the conclusions of the previous section, a horizontal scale strategy was chosen since it optimizes the execution of concurrent processes. Therefore, we define a High-Performance Computing (HPC) cluster equipped with 32 worker nodes with 16 computing cores and 64 GB of RAM each (which makes a total of 512 cores and 2048 GB of RAM).
The whole experiment took 1:32:22 (H:MM:SS). Each individual job took on average to finish its execution 0:20:33 (H:MM:SS), and the standard deviation was 0:02:24 (H:MM:SS). The maximum and minimum execution time for a job were 0:22:56 (H:MM:SS) and 0:09:58 (H:MM:SS). Considering the 4000 jobs running in parallel between the nodes, the effective time per job was 1.39 s. The cost of this cluster on the IBM Kubernetes Service was per month. Therefore, the cost per job was per job. So the total cost of the whole process was approximately 48e.
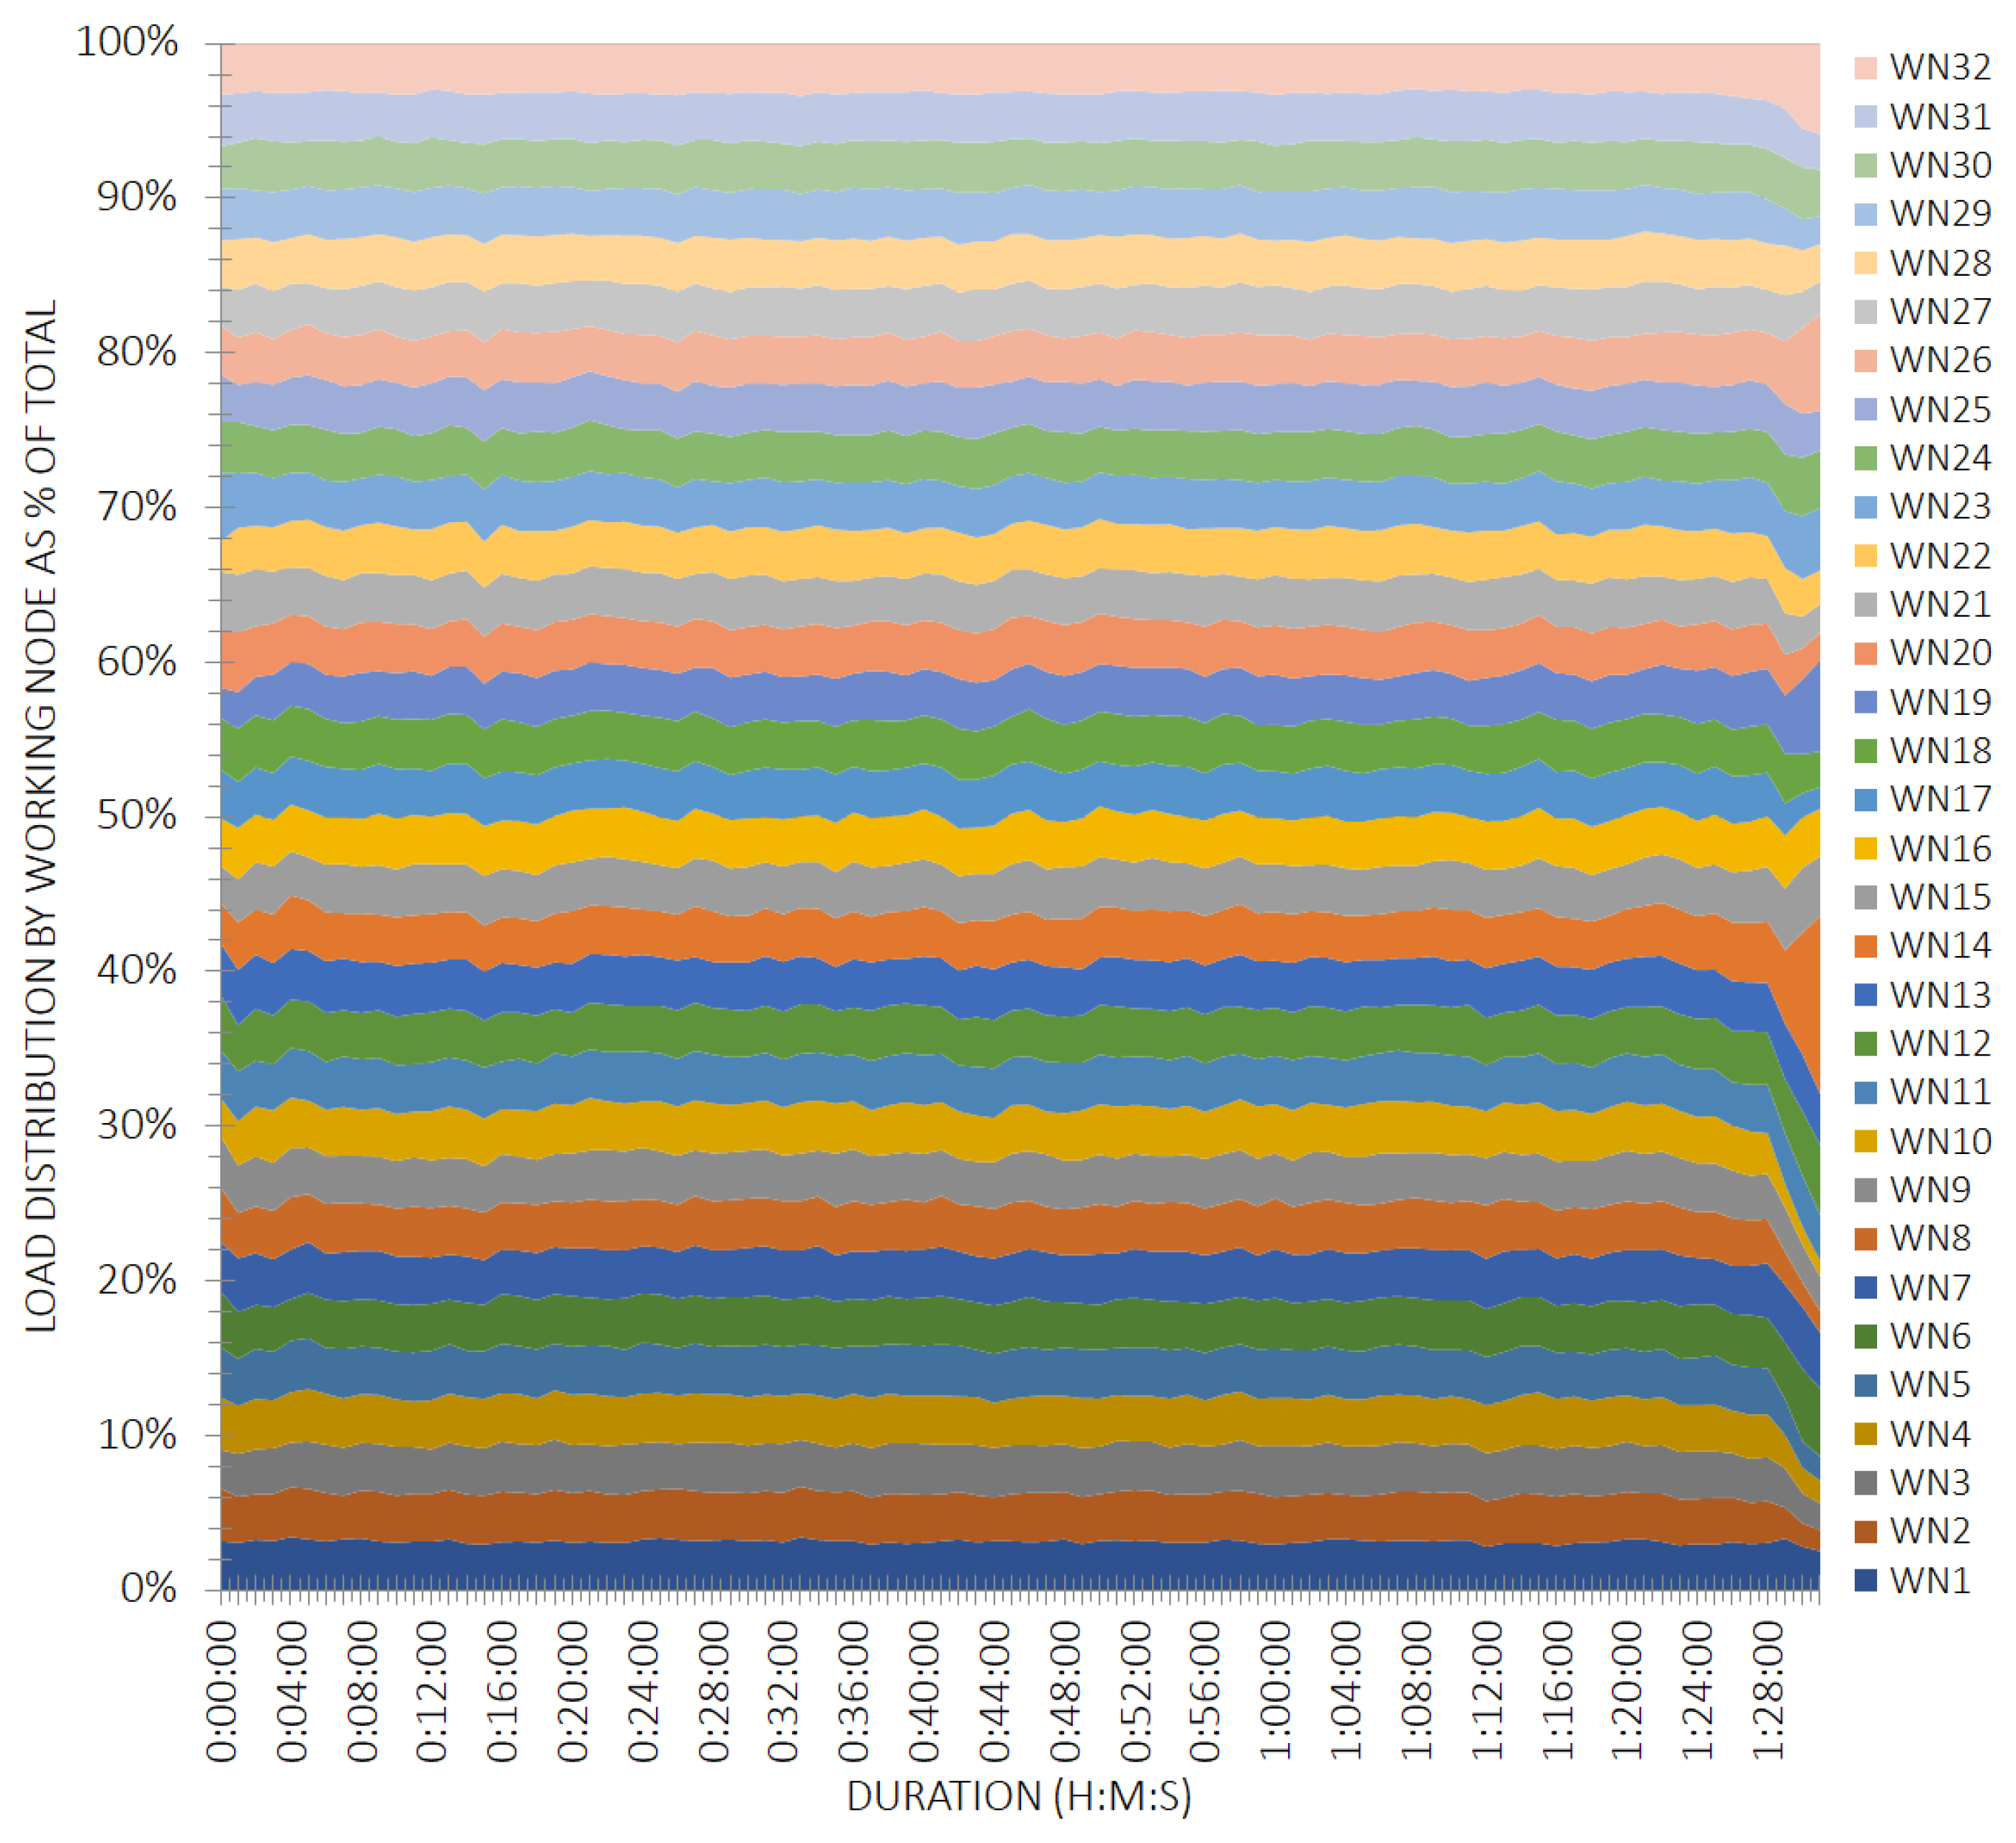
Figure 8 shows the distribution of the processing load among the 32 nodes in the cluster during the large-scale experiment. The graph is limited to 100% of the total load at each moment, but it does not have to do with the absolute load, which at times exceeds 100% of the total computing capacity of the cluster. It is observed how throughout the experiment the load was evenly balanced between the worker nodes. So it could be considered that the computing capabilities of the cluster were exploited optimally. Some load imbalances were observed during the beginning and end of the experiment, which could be considered normal behavior since the load was not stable in these transients.
Impact on the Semi-Automatic Annotation Process
The previous experiments demonstrate that the proposed AaaS solution could efficiently use the computing capabilities of a HPC-cluster, serving the scale required for AD/ADAS while keeping cost ratios limited even for very large volumes of data. As a direct consequence, the proposed approach could be used within semi-automatic annotation pipelines, executing data preparation steps (e.g., transcoding) and pre-annotation (e.g., object detectors, segmentation, action recognition), against all incoming data from instrumented vehicles. Human review is still essential to obtain ground truth and therefore manual annotation can be activated, making use of as many human resources as necessary. However, it is desirable to reduce this manual participation where the human level intelligence really adds value, eliminating from its obligations costly tasks that increase the time to obtain the ground truth, its cost, and even its final quality.
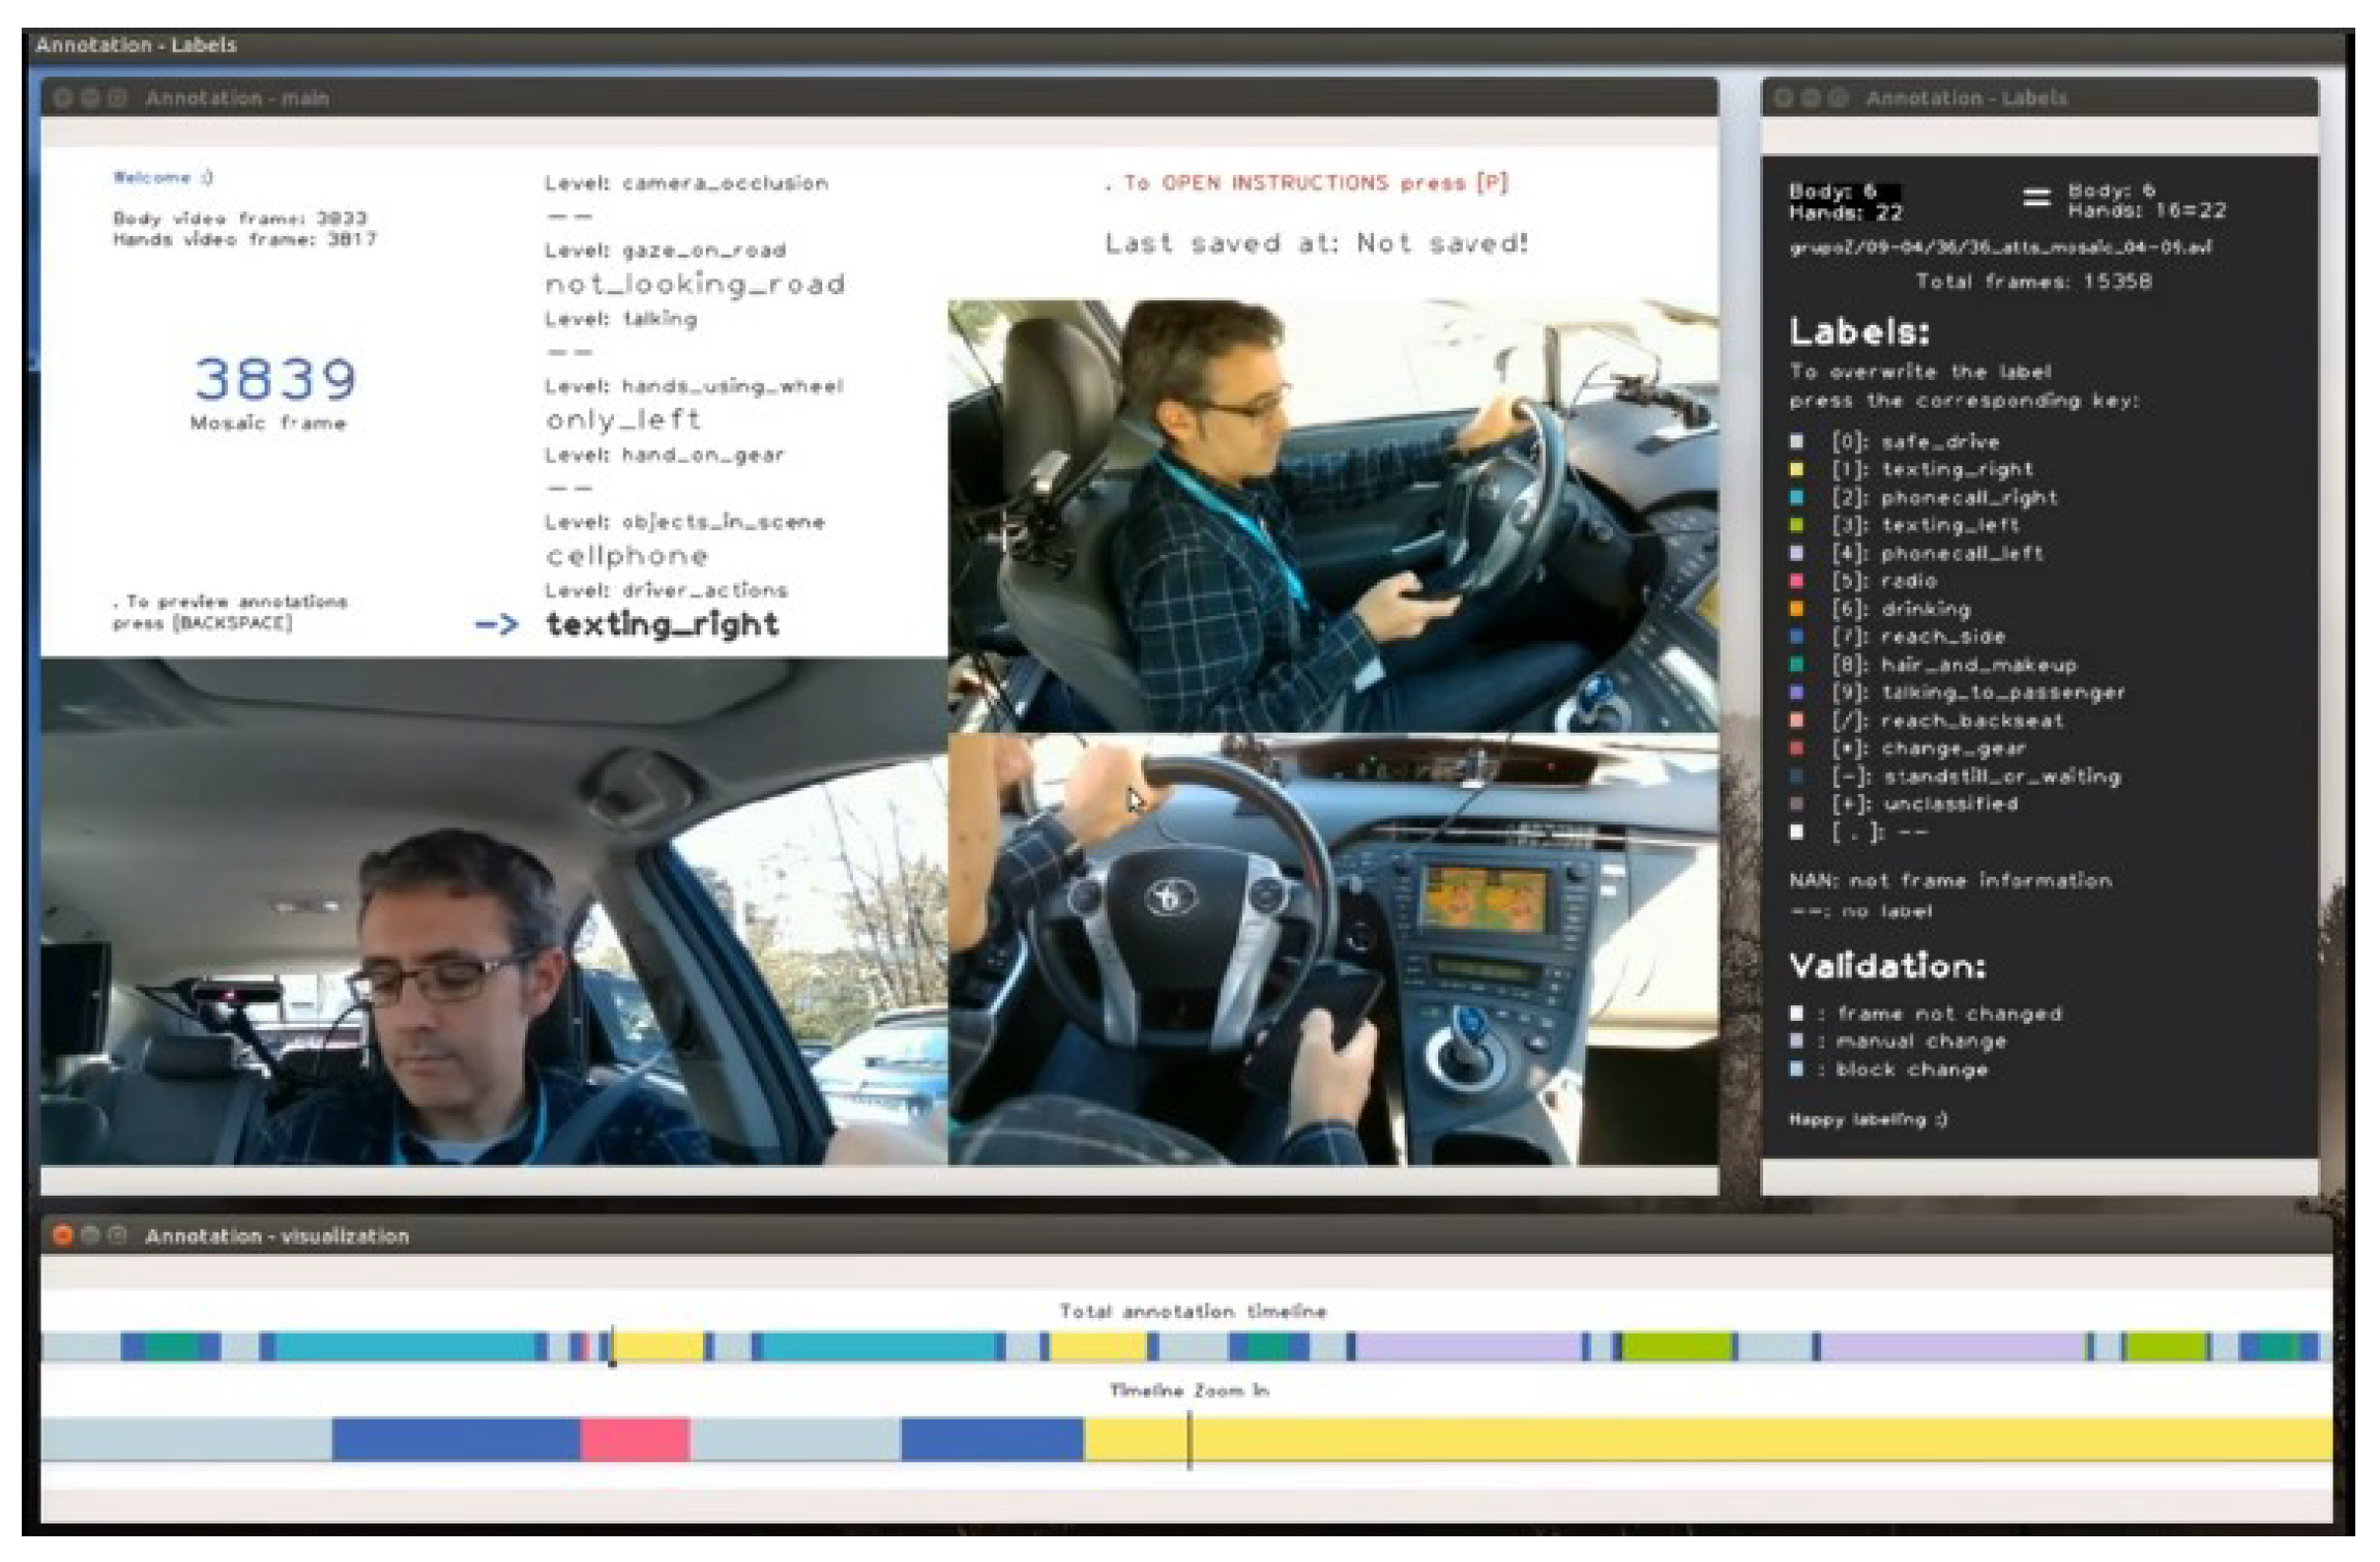
The annotation time (and costs) saving using pre-annotation depends on the feature to be annotated (e.g., 2D or 3D bounding boxes, polylines, pixel-wise masks), the complexity of the scene (e.g., with many objects and interactions), the annotation tool, and many other practical aspects. For instance, Table 3 shows the time taken by human operators to complete different annotation tasks versus time of the annotated video sequence. We observe average reductions of 60% of manual annotation time using pre-detected lane markings in point cloud sequences (from 39:1 min to 16:1 min of annotation time vs. sequence time), 28% pixel-wise semantic segmentation (from 97:1 min to 70:1 min performed on a single image rather than a video), and 63% for driver action recognition (from 93:1 min to 70:1 min). The latter case is particularly relevant as we collected a massive driver action dataset (the DMD, Driver Monitoring Dataset, (http://dmd.vicomtech.org)), with more than 40 h of video (in the form of 25 TB of raw recordings, with 3 cameras that produce Full-HD RGB, Infrared and Depth streams). The DMD was annotated with multiple levels of driver actions, using automatic pre-annotations of all videos and a manual annotation tool for human operators to review and correct annotations (see Figure 9).
7. Conclusions
An innovative solution named Annotation as a Service (AaaS) has been designed specifically to integrate heterogeneous video annotation workflows into containers and take advantage of a highly scalable and reliable design based on Kubernetes workloads. The AaaS was systematically tested in Kubernetes clusters at different scales of computing resources. It scaled efficiently in large situations. Specifically it was tested in an experiment with 25 TB of input data to be annotated, 4000 concurrent annotation jobs, and a HPC-cluster of 32 worker nodes with a total of 512 cores and 2048 GB of RAM. This experiment demonstrated that the AaaS is a robust and resilient solution. On the cost side, the increasing volumes of workloads showed a reduction in the effective cost per task in the scaled-up solutions. A bottleneck for any annotation solution with the scale of data that we have discussed, is in the available bandwidth for the transmission of large amounts of data to the cloud and its cost. A hybrid edge-cloud and multi-zone cloud solution is presented as the best design option for an ADAS data annotation tool so that data is logged, at least in the initial automatic stages, close to where it is created. The heterogeneity and agnosticism of the proposed AaaS make it suitable to be deployed in this type of hybrid system towards a computing continuum context. The latter is considered one of the essential contributions of this research to a state of the art of annotation tools not designed to scale in this context. The main limitations to achieve the ubiquitous and hybrid deployment aforementioned for the AaaS were in the configuration and implementation of the specific services of each PaaS, as well as in the compliance with the different restrictions inherent to IaaS between cloud providers. These challenges are beyond the scope of the current study, but they are the direction of future research.
Finally, the AaaS has been included in a context of semi-automatic annotation processes for AD/ADAS. Generating ground truth, i.e. with humans in the loop, is extremely expensive. With the help of previous annotations from the proposed system, the time of human participation in the annotation could be reduced up to 80% maximum and 60% on average. For reference, annotating lane markings or 3D objects from a 60-second video sequence can take 50–300 min of human labor, depending on the complexity of the scene. Considering that the current need of the automotive industry is to tackle projects with hundreds of hours of video to annotate and large teams of human operators efficiently coordinated to work in parallel. The added value of the AaaS solution is justified to produce annotations on time and on budget.
Author Contributions
Conceptualization, O.O., M.N., and S.S.-C.; methodology, M.N. and S.S.-C.; software, O.S. and S.S.-C.; validation, S.S.-C.; formal analysis, M.N. and S.S.-C.; investigation, M.N., O.S. and S.S.-C.; resources, O.S. and S.S.-C.; data curation, O.S. and S.S.-C.; writing–original draft preparation, S.S.-C.; writing–review and editing, M.N. and S.S.-C.; visualization, S.S.-C.; supervision, M.N.; project administration, O.O. and M.N.; funding acquisition, O.O. All authors have read and agreed to the published version of the manuscript.
Funding
This research was co-funded by the European Union’s Horizon 2020 Research and Innovation Programme under grant No. 688099.
Acknowledgments
The research presented in this paper were carried out as part of the Cloud-LSVA Horizon 2020 Project.
Conflicts of Interest
The authors declare no conflict of interest. The funders had no role in the design of the study; in the collection, analyses, or interpretation of data; in the writing of the manuscript, or in the decision to publish the results.
Abbreviations
The following abbreviations are used in this manuscript:
| ADAS | Advanced Driver-Assistance Systems |
| AD | Automated Driving |
| IaaS | Infrastructure as a Service |
| PaaS | Platform as a Service |
| AaaS | Annotation as a Service |
| HWiL | Hardware in the Loop |
| HiL | Human in the Loop |
| HPC | High Performance Computing |
References
- Fridman, L.; Brown, D.E.; Glazer, M.; Angell, W.; Dodd, S.; Jenik, B.; Terwilliger, J.; Patsekin, A.; Kindelsberger, J.; Ding, L.; et al. MIT advanced vehicle technology study: Large-scale naturalistic driving study of driver behavior and interaction with automation. IEEE Access 2019, 7, 102021–102038. [Google Scholar] [CrossRef]
- Badue, C.; Guidolini, R.; Carneiro, R.V.; Azevedo, P.; Cardoso, V.B.; Forechi, A.; Jesus, L.; Berriel, R.; Paixao, T.; Mutz, F.; et al. Self-driving cars: A survey. arXiv 2019, arXiv:1901.04407. [Google Scholar]
- Chen, X.; Ma, H.; Wan, J.; Li, B.; Xia, T. Multi-view 3d object detection network for autonomous driving. In Proceedings of the IEEE Conference on Computer Vision and Pattern Recognition, Honolulu, HI, USA, 21–26 July 2017; pp. 1907–1915. [Google Scholar]
- Keselman, L.; Iselin Woodfill, J.; Grunnet-Jepsen, A.; Bhowmik, A. Intel realsense stereoscopic depth cameras. In Proceedings of the IEEE Conference on Computer Vision and Pattern Recognition Workshops, Honolulu, HI, USA, 22–25 July 2017; pp. 1–10. [Google Scholar]
- Shin, Y.S.; Park, Y.S.; Kim, A. Direct visual SLAM using sparse depth for camera-lidar system. In Proceedings of the 2018 IEEE International Conference on Robotics and Automation (ICRA), Montreal, QC, Canada, 21–26 May 2018; pp. 1–8. [Google Scholar]
- Janai, J.; Güney, F.; Behl, A.; Geiger, A. Computer Vision for Autonomous Vehicles: Problems, Datasets and State-of-the-Art. arXiv 2017, arXiv:1704.05519. [Google Scholar]
- Bhadani, R.K.; Sprinkle, J.; Bunting, M. The cat vehicle testbed: A simulator with hardware in the loop for autonomous vehicle applications. arXiv 2018, arXiv:1804.04347. [Google Scholar] [CrossRef]
- Kipp, M. ANVIL—A Generic Annotation Tool for Multimodal Dialogue. In Proceedings of the Seventh European Conference on Speech Communication and Technology, Aalborg, Denmark, 3–7 September 2001; pp. 1367–1370. [Google Scholar]
- Gaur, E.; Saxena, V.; Singh, S.K. Video annotation tools: A Review. In Proceedings of the 2018 International Conference on Advances in Computing, Communication Control and Networking (ICACCCN), Noida, India, 12–13 October 2018; pp. 911–914. [Google Scholar]
- Dasiopoulou, S.; Giannakidou, E.; Litos, G.; Malasioti, P.; Kompatsiaris, I. A Survey of Semantic Image and Video Annotation Tools; Springer: Berlin/Heidelberg, Germany, 2011; pp. 196–239. [Google Scholar] [CrossRef] [Green Version]
- Bianco, S.; Ciocca, G.; Napoletano, P.; Schettini, R. An interactive tool for manual, semi-automatic and automatic video annotation. Comput. Vis. Image Underst. 2015, 131, 88–99. [Google Scholar] [CrossRef]
- Biresaw, T.A.; Nawaz, T.; Ferryman, J.; Dell, A.I. ViTBAT: Video tracking and behavior annotation tool. In Proceedings of the 2016 13th IEEE International Conference on Advanced Video and Signal Based Surveillance (AVSS), Colorado Springs, CO, USA, 23–26 August 2016; pp. 295–301. [Google Scholar]
- Shen, A. BeaverDam: Video Annotation Tool for Computer Vision Training Labels. Master’s Thesis, EECS Department, University of California, Berkeley, CA, USA, 2016. [Google Scholar]
- Vondrick, C.; Patterson, D.; Ramanan, D. Efficiently scaling up crowdsourced video annotation. Int. J. Comput. Vis. 2013, 101, 184–204. [Google Scholar] [CrossRef]
- Russell, B.C.; Torralba, A.; Murphy, K.P.; Freeman, W.T. LabelMe: A database and web-based tool for image annotation. Int. J. Comput. Vis. 2008, 77, 157–173. [Google Scholar] [CrossRef]
- Zimmer, W.; Rangesh, A.; Trivedi, M.M. 3D BAT: A Semi-Automatic, Web-based 3D Annotation Toolbox for Full-Surround, Multi-Modal Data Streams. arXiv 2019, arXiv:1905.00525. [Google Scholar]
- Opencv. Computer Vision Annotation Tool (CVAT). Available online: https://github.com/opencv/cvat (accessed on 22 June 2020).
- Huchtkoetter, J.; Reinhardt, A.; Hossain, S. ANNO: A Time Series Annotation Tool to Evaluate Event Detection Algorithms. In International Workshop on Simulation Science; Springer: Berlin/Heidelberg, Germany, 2019; pp. 70–87. [Google Scholar]
- Bota, P.; Silva, J.; Folgado, D.; Gamboa, H. A Semi-Automatic Annotation Approach for Human Activity Recognition. Sensors 2019, 19, 501. [Google Scholar] [CrossRef] [PubMed] [Green Version]
- Mujika, A.; Domínguez, A.; Tamayo, I.; Senderos, O.; Barandiaran, J.; Aranjuelo, N.; Nieto, M.; Otaegui, O. Web-based Video-Assisted Point Cloud Annotation for ADAS validation. In Proceedings of the 24th International Conference on 3D Web Technology, Saint Petersburg, Russia, 1–4 July 2019; pp. 1–9. [Google Scholar]
- Voigtlaender, P.; Krause, M.; Osep, A.; Luiten, J.; Sekar, B.B.G.; Geiger, A.; Leibe, B. MOTS: Multi-object tracking and segmentation. In Proceedings of the IEEE Conference on Computer Vision and Pattern Recognition, Long Beach, CA, USA, 16–20 June 2019; pp. 7942–7951. [Google Scholar]
- Scalabel. A Scalable Open-Sourced Annotation Web Tool Brought by Berkeley DeepDrive. Available online: https://www.scalabel.ai/ (accessed on 22 June 2020).
- Castrejon, L.; Kundu, K.; Urtasun, R.; Fidler, S. Annotating object instances with a polygon-rnn. In Proceedings of the IEEE Conference on Computer Vision and Pattern Recognition, Honolulu, HI, USA, 22–25 July 2017; pp. 5230–5238. [Google Scholar]
- Acuna, D.; Ling, H.; Kar, A.; Fidler, S. Efficient interactive annotation of segmentation datasets with polygon-rnn++. In Proceedings of the IEEE conference on Computer Vision and Pattern Recognition, Salt Lake City, UT, USA, 18–23 June 2018; pp. 859–868. [Google Scholar]
- Qin, X.; He, S.; Zhang, Z.; Dehghan, M.; Jagersand, M. Bylabel: A boundary based semi-automatic image annotation tool. In Proceedings of the 2018 IEEE Winter Conference on Applications of Computer Vision (WACV), Lake Tahoe, NV, USA, 12–15 March 2018; pp. 1804–1813. [Google Scholar]
- Howard, A.G.; Zhu, M.; Chen, B.; Kalenichenko, D.; Wang, W.; Weyand, T.; Andreetto, M.; Adam, H. Mobilenets: Efficient convolutional neural networks for mobile vision applications. arXiv 2017, arXiv:1704.04861. [Google Scholar]
Figure 1.
Business logic for the proposed semi-automatic for AD/ADAS (Autonomous Driving/Advanced Driver Assistance Systems) based Annotation as a Service (AaaS).
Figure 1.
Business logic for the proposed semi-automatic for AD/ADAS (Autonomous Driving/Advanced Driver Assistance Systems) based Annotation as a Service (AaaS).

Figure 2.
Proposed architecture to integrate annotation workflows as containerized applications for AaaS. It is composed by several Kubernetes workloads for managing and running the containers at scale on an agnostic Kubernetes cluster.
Figure 2.
Proposed architecture to integrate annotation workflows as containerized applications for AaaS. It is composed by several Kubernetes workloads for managing and running the containers at scale on an agnostic Kubernetes cluster.

Figure 3.
Results of the scalability study for aCNNimage object detection job with a high computational requirement. Batches of 16, 32, 64, 128, and 256 simultaneous jobs were systematically tested. The charts represent the average CPU load on each worker node for a reference base cluster (4 worker nodes, 16 cores per node) and a horizontally scaled cluster (8 worker nodes, 16 cores per node). (a,b) represent the load in absolute value and (c,d) the value relative to 100% at every time, for the base cluster and the horizontally scaled cluster respectively in both cases.

Figure 4.
Total duration of each complete batch experiment versus the concurrency per worker node (jobs concurrency/worker nodes in cluster) for the three compared clusters.
Figure 4.
Total duration of each complete batch experiment versus the concurrency per worker node (jobs concurrency/worker nodes in cluster) for the three compared clusters.

Figure 5.
Average duration of jobs versus the concurrency per total cores in each one of the three studied clusters.
Figure 5.
Average duration of jobs versus the concurrency per total cores in each one of the three studied clusters.

Figure 6.
Transcoding batch duration (high CPU, high memory) vs. concurrency of jobs, represented for the two scaled clusters. It shows how the increase in memory is not so related to the calculation performance of each job, but rather to the reliability of the process.
Figure 6.
Transcoding batch duration (high CPU, high memory) vs. concurrency of jobs, represented for the two scaled clusters. It shows how the increase in memory is not so related to the calculation performance of each job, but rather to the reliability of the process.

Figure 7.
Cost-per-job (€), from the effective computation time to complete the execution of a job for each experiment and the cluster cost (€/second).
Figure 7.
Cost-per-job (€), from the effective computation time to complete the execution of a job for each experiment and the cluster cost (€/second).

Figure 8.
Load distribution between worker nodes during the execution of the large-scale experiment (32 worker nodes, equivalent to 512 cores, and 2048 GB of RAM). It is observed how throughout the experiment the load was balanced evenly between the job nodes, optimally exploiting the computing capabilities of the cluster (∼ 4000 jobs running parallel).

Figure 9.
Manual annotation tool for driver action recognition (DMD (Driver Monitoring Dataset) dataset), which loads pre-annotation and allows human operators to review/modify them.
Figure 9.
Manual annotation tool for driver action recognition (DMD (Driver Monitoring Dataset) dataset), which loads pre-annotation and allows human operators to review/modify them.


Table 1.
Metrics for running the two individual annotation steps tested (transcoding and Convolution Neural Network (CNN) object detection) in a single node cluster. From these values, an estimate of the resources required for each of the jobs is obtained.
Table 1.
Metrics for running the two individual annotation steps tested (transcoding and Convolution Neural Network (CNN) object detection) in a single node cluster. From these values, an estimate of the resources required for each of the jobs is obtained.
| ffmpeg Transcoding | coco ssd Mobilenet v1 Detection | |
|---|---|---|
| CPU request | 10 % (∼1.6 cores) | 30 % |
| Memory request | 30 GB | 0.7 GB |
| time to complete | 423 s | 95 s |
Table 2.
Specifications of the three clusters with different computational resources used for the scalability tests.
Table 2.
Specifications of the three clusters with different computational resources used for the scalability tests.
| Worker Nodes | CPU Cores | RAM Memory (GB) | |
|---|---|---|---|
| Base cluster | 4 | 16 | 64 |
| Vertically scaled cluster | 4 | 32 | 128 |
| Horizontally scaled cluster | 8 | 16 | 64 |
Table 3.
Time spent by human operators to complete different annotation tasks versus sequence time. Specifically, it is the average time obtained from various human operators who performed the same annotation task, from scratch (fully manual) and from previous annotations (semi-automatic). The number of annotators per task, the length of the video, and the time savings due to the semi-automatic approach are also represented. * Note the pixel-wise annotation task was performed on a single image rather than a video.
| Human Annotation Time [min] (Annotation-Clip Ratio) | |||||
|---|---|---|---|---|---|
| Annotation Task | Num. Annotators | Clip Length [s] | Fully Manual [avg. ± std.] | Semi-Automatic [avg. ± std.] | Time Saving [avg. (max.)] |
| Lane marking | 11 | 30 | 39:1 ± 15:1 | 16:1 ± 8:1 | |
| Driver action recognition | 4 | 180 | 93:1 ± 61:1 | 34:1 ± 23:1 | |
| Pixel-wise semantic segmentation | 4 | single frame * | 97:1 ± 44:1 | 70:1 ± 30:1 | |
© 2020 by the authors. Licensee MDPI, Basel, Switzerland. This article is an open access article distributed under the terms and conditions of the Creative Commons Attribution (CC BY) license (http://creativecommons.org/licenses/by/4.0/).
Share and Cite
MDPI and ACS Style
Sánchez-Carballido, S.; Senderos, O.; Nieto, M.; Otaegui, O. Semi-Automatic Cloud-Native Video Annotation for Autonomous Driving. Appl. Sci. 2020, 10, 4301. https://0-doi-org.brum.beds.ac.uk/10.3390/app10124301
AMA Style
Sánchez-Carballido S, Senderos O, Nieto M, Otaegui O. Semi-Automatic Cloud-Native Video Annotation for Autonomous Driving. Applied Sciences. 2020; 10(12):4301. https://0-doi-org.brum.beds.ac.uk/10.3390/app10124301
Chicago/Turabian StyleSánchez-Carballido, Sergio, Orti Senderos, Marcos Nieto, and Oihana Otaegui. 2020. "Semi-Automatic Cloud-Native Video Annotation for Autonomous Driving" Applied Sciences 10, no. 12: 4301. https://0-doi-org.brum.beds.ac.uk/10.3390/app10124301
Note that from the first issue of 2016, this journal uses article numbers instead of page numbers. See further details here.