Article

Using Costs and Health Benefits to Estimate the Priority of Air Pollution Control Action Plan: A Case Study in Taiwan

1
Department of Green Energy and Environmental Resources, Chang Jung Christian University, Tainan 71101, Taiwan
2
Institute of Environmental Engineering and Management, National Taipei University of Technology, Taipei 10608, Taiwan
3
The Center for Green Economy, Chung-Hua Institution for Economic Research, Taipei 10672, Taiwan
4
Environmental Research and Information Center, Chang Jung Christian University, Tainan 71101, Taiwan
5
Department of Civil and Environmental Engineering, University of Tennessee, Knoxville, TN 37996, USA
*
Author to whom correspondence should be addressed.
Submission received: 27 July 2020 / Revised: 16 August 2020 / Accepted: 27 August 2020 / Published: 28 August 2020

Abstract

:
A comparative analysis was conducted between the costs and health benefits of the Air Pollution Control Action Plan (APCAP), which can be implemented in any country to improve air quality and human health. In this study, air quality modeling was used to simulate several scenarios and implement the Kriging method to describe the PM2.5 reduction concentration instantly. Then, health benefits were estimated using the environmental benefit mapping and analysis program (BenMAP) with results from the air quality modeling and Kriging method. To estimate the priority of APCAP, 14 pollution control measures that cover point, mobile, and area sources of air pollution in Taiwan were analyzed. The results indicate that the health benefits of the Taiwan APCAP (TAPCAP) are generally greater than the technical costs. Thus, the implementation of this strategy may result in net benefits. In addition, the benefit-to-control cost ratio for health for the 14 pollution control measures was calculated. The results provide evidence to prioritize the implementation of air quality policies with a higher benefit-cost ratio.

1. Introduction

Air pollution is internationally recognized as a major threat to human health, as continued human exposure to air pollution exacerbates mortality risks and increases medical costs for treating air pollution-related illnesses [1,2,3,4,5,6,7]. According to a 2015 study conducted by the World Health Organization (WHO), early deaths owing to air pollution cost the European Union 1.43 trillion USD in 2010. Moreover, if associated medical costs are considered, this value increases to 1.58 trillion USD. The Organization for Economic Co-operation and Development (OECD) conducted an empirical study on 41 countries in 2017, which demonstrated that 3.2 million people died in 2015 due to air pollution [8]. The corresponding economic losses were estimated at 5.1 trillion USD. Due to the health and economic impacts of air pollution, the control and prevention of air pollution are now among the most important environmental management issues for many countries.
In the context of air pollution control, it is often instructive to evaluate the benefits of pollution control measures from a monetary perspective in addition to their technical feasibility, as this aids policymakers in understanding the monetary benefits that could be realized by a given pollution control measure. Furthermore, this facilitates the use of cost-benefit analyses, which allow policymakers to determine whether a measure is worth the cost of implementation. When funding is limited, monetized assessments may also improve cost efficiency by determining the priority order of pollution control measures [9,10,11].
This is particularly relevant for countries where the PM2.5 concentration almost meets the national target (15 μg/m3)—such as the Philippines, Singapore, and Taiwan [12]—or for enabling countries to move to the next stage of air quality standard (e.g., the USA). The U.S. Environmental Protection Agency (EPA) revised the National Ambient Air Quality Standards for the annual PM2.5 standard from 15 μg/m3 to 12 μg/m3 in 2012 [13]. They require a decision support system to assist governments in developing control strategies [14], such as the air benefit and cost and attainment assessment system (ABaCAS) [4,15,16]. The system should integrate several cost-benefit assessment models, including emission data, and the cost of control strategies, scenario simulations, and environmental benefits mapping and analysis. ABaCAS has been used in other countries, for example, by Xing et al. [7] in the Yangtze River Delta. Their study assessed six future scenarios designed for two future energy situations. The ABaCAS was applied to the 2010 regulatory Base Case developed by U.S. EPA as part of their analysis for the Clean Air Interstate Rule [17].
Taiwan Environmental Protection Administration (Taiwan EPA) developed ABaCAS-Taiwan which was based on the 2013 ABaCAS framework of the U.S. EPA. The database incorporates local data, including air quality monitoring data, Taiwan emission data, population, inflation data, incidence rates, prevalence rates, and mortality rates.
Air pollution control has always been an important facet of environmental policies, especially in Taiwan. This is evident from Taiwan’s National Ambient Air Quality Standards (NAAQS). For example, the PM2.5 annual standard was set to 15 μg/m3 in 2012 by the Taiwan EPA, after referring to WHO and other international standards. A plan was also formulated to reduce the annual mean PM2.5 concentration for Taiwan to this standard level by the end of 2020. However, according to data published in the Green National Income report from the Directorate-General of Budget, Accounting, and Statistics (DGBAS) for 2013, the annual mean PM2.5 concentration of Taiwan was still 23.6 μg/m3. Although this PM2.5 concentration has decreased annually, it was 18.3 μg/m3 in 2017, which is higher than the Taiwan EPA target. To accelerate the reduction in air pollution levels, the Taiwan EPA officially announced the Air Pollution Control Plan of Action (TAPCAP) in 2017, with a budget exceeding 200 billion new Taiwan dollars (NTD). Under the TAPCAP, a combination of restrictions and incentives will be used to implement 14 major pollution control measures [18].
The primary goal of this study is to use the ABaCAS-Taiwan system to conduct a monetized analysis on the TAPCAP as a whole, as well as for each of the constituent pollution control measures. This study is an ex post facto study and the results reveal whether the implementation of the TAPCAP has been cost-effective. It also serves as a reference for the formulation of future pollution control strategies. The subsequent sections of this study are organized as follows: the second section describes the methodology, and the third section describes the empirical data and technical parameters that were used. The results of the simulations are then presented in the fourth section. Finally, the fifth section presents our conclusions and a discussion on the applications of our findings to policies.

2. Research Methodology: ABaCAS-Taiwan

To conduct the analysis and planning of air pollution control strategies from a monetary perspective, the U.S. EPA began to develop the environmental benefit mapping and analysis program (BenMAP) in 2003. The ABaCAS was subsequently created by improving and integrating several cost-benefit assessment models. This system is based on the “Impact Path Approach” (IPA) [19,20] which is a multidisciplinary assessment framework that links the outcomes of three stage-wise simulations and assessments. The three stages conducted when using the IPA framework to perform a monetized assessment of the effects of air pollutant emissions on human health are: (1) simulating the effects of air pollutant emissions on air pollution concentrations, (2) estimating the health impacts caused by changes in pollution concentration, and (3) monetizing these health impacts. One of the strengths of the IPA framework is its ability to clearly describe impact pathways through which air pollutants are emitted and eventually transferred to affected subjects. In addition, it enables quantitative modeling of the effects of pollutants at each key stage of an impact pathway. The IPA framework is, at present, the most commonly used assessment framework for the analysis of air quality policies. The ABaCAS-Taiwan was jointly developed by the Taiwan EPA, U.S. EPA, and the University of Tennessee. In addition to the intrinsic strengths of the ABaCAS system, the ABaCAS-Taiwan system also includes several technical parameters that have been adapted for local application in Taiwan. Therefore, this system is well-suited for air quality analyses in the Taiwanese context, but can also be adapted for use in other countries.
For example, Wang et al. [3] used Software for Model Attainment Test–Community Edition (SMAT-CE) to identify the pollutant concentrations that must be reduced to achieve the 2020 O3 and PM2.5 targets (75 ppb and 12 μg/m3, respectively) of the U.S. They revealed that anthropogenic NOx, anthropogenic SOx emissions, residential wood combustion PM2.5, and direct PM2.5 emissions from non-electric generating units must be reduced by 25%, 25%, 100%, and 50% over their corresponding 2007 levels, respectively, to meet the 2020 PM2.5 target. Zhu et al. [4] combined the response surface model (RSM)–linear coupled fitting with SMAT-CE to reduce the dimensions required to establish air quality modeling, and used this approach to investigate the contributions of primary emissions to ambient PM2.5 levels in the Yangtze River Delta in January and August 2010. In a study on power plants in the Yangtze River Delta, Sun et al. [5] used a multi-pollutant control cost model to identify viable pollution control measures to achieve China’s air quality targets, as well as their corresponding emission control costs.
The ABaCAS-Taiwan assessment system is based on the standard ABaCAS framework, and it was created by incorporating Taiwanese data to localize the system. The database includes air quality monitoring data, Taiwan emission data, population, inflation data, incidence rates, prevalence rates, and mortality rates. ABaCAS-Taiwan consists of four modules: Taiwan emission control analysis system (TECAS), advance response surface model (RSM), software for model attainment test (SMAT), and environmental benefits mapping and analysis program–community edition (BenMAP-CE). The TECAS module can be used to estimate the technical cost of a pollution control strategy, while RSM can be used to quickly estimate both O3 and PM2.5 levels. Furthermore, RSM can be employed for the rapid calculation of precursor emissions with a minimum number of simulations [6,7,21]. SMAT is used to correct for errors between observed and simulated values, to ensure that the simulated values can be a better fit for the observed values. BenMAP-CE is applied to estimate the health benefits that result from reductions in air pollution, based on the results of the aforementioned simulations [22,23,24,25,26]. As this study required the use of the RSM, SMAT, and BenMAP-CE modules, we have provided a brief description of their technical details in the following subsections.

2.1. RSM

The main purpose of the RSM module is to obtain the maximum number of control scenario assessments from the minimum number of scenario simulations [27], thus allowing policymakers to rapidly obtain accurate simulations. To construct an RSM, the first step is to perform weather simulations using the weather research and forecasting model (WRF) and to validate the simulations using meteorological observatory data. We used the same meteorological conditions for the multiple scenarios and only the emissions were altered in different scenarios. The control variables and control matrix needed for the second step were obtained from the Taiwan Emission Data System, with 2013 as the baseline year. There are many factors in the control matrix, including point, line, and area sources in counties in Taiwan. Community Multi-scale Air Quality model (CMAQ) is a model which could simulate by integrating various pollution issues, including ozone, particulate matter (PM), acid deposition and toxic substances, to create the effect of interaction of simulation among different subjects and allow model stimulation to be in line with atmospheric chemistry phenomena [26]. If there are many scenarios, additional time will be needed when using CMAQ. To calculate the results of reduction scenarios within a reasonable time, an analysis formula was used to build an RSM system based on the results of CMAQ. The RSM experimental design covers a change in the baseline emissions of zero to 400 percent, utilizing a staged Latin Hypercube statistical method [17]. The detail of choosing the RSM control variable and building control matrix have been described in a previous study [26]. A control matrix defines the multi-dimensional experiments consisting of a set of emission control scenarios parameterized by control variables [28].
Many emission reduction scenarios were simulated, but only after the baseline scenario conformed to the requirements of Taiwan’s air quality simulation standards. In the third step, high-dimensional Kriging [28] was used with Equation (1) to construct the air quality modeling database:
y ( x 0 ) = j = 1 d f j ( x ) β j + z ( x ) f 0 T β + γ 0 T R 1 ( Y n F β )
In this equation, y ( x 0 ) is the predicted RSM result; f is a d × 1 vector of the regression functions for Y; β is a d × 1 vector for the unknown regression coefficients; F is an n × d matrix of regression functions for the training data; z(x) is the covariance of a Gaussian stochastic process. In the derivation of z ( x ), R is the n × 1 correlation vector of γ 0 n , and the various functions γ 0 T and Y n are the process simulations of Y x 0 and y n , respectively.

2.2. SMAT

The function of the SMAT module is to calibrate the simulation results. SMAT estimates a future design value (DVF) at a monitoring site using the air quality model data and observation data from the base year to construct the relative response factors (RRFs) [15,28,29]. DVB is the base design value monitored at the monitoring site. The aforementioned algorithm may be summarized as Equation (2):
( D V F ) i = ( D V B ) i × ( R R F ) i   ; R R F i = M o d e l i , f u t u r e M o d e l i , b a s e

2.3. BenMAP

Once the pollutant reductions that result from the implementation of some pollution control measures have been modeled using the aforementioned modules, the BenMAP module of the ABaCAS-Taiwan framework can be used to estimate the consequent health benefits of these improvements in air quality. BenMAP is a mature tool for assessing the health benefits of improvements in air quality, and has been employed in many countries [9,22,23,30,31,32,33,34].
BenMAP is an assessment tool based on the IPA framework [19,20,33]. Three types of technical parameters are required for BenMAP analysis: (1) The results of pollutant dispersal simulations, (2) health impact functions, and (3) monetization functions. In this study, the results of pollutant dispersal simulations were mainly derived from the simulation results of the RSM and SMAT modules. The change in health impact was evaluated using Equation (3), which is based on the BenMAP methodology:
Δ Y = Y 0 ( 1 e β Δ P M ) P o p
In this equation, Δ Y is the expectation value of the change in health events, with Y 0 being the probability of health events in the baseline scenario; β is the literature-derived coefficient of estimation of the health impact function, and it is used to gauge the dependence of health events on pollutant concentrations; Pop is the size of the affected population. Equation (3) can be used to convert changes in pollutant concentration into an expected value of health impact, in units of occurrences. Numerous studies have been conducted to estimate the β value of each health event. In BenMAP, the β values obtained in each study can be unified into a representative β value through a meta-analysis of the pooled data. The unified β may then be used to assess health impacts [20]. In this study, a random-effects meta-analysis was performed to unify the β value.
Finally, the economic cost of pollution can be estimated in BenMAP by monetizing the health impacts using Equation (4). Decreases in pollutant concentration will reduce the expected health impact, which then increases health benefits in the monetized assessment. Conversely, a rise in pollutant concentration will increase health costs:
E c o n o m i c   V a l u e = H e a l t h   I m p a c t V a l u e   o f   H e a l t h   I m p a c t
In Equation (4), Health Impact is the expectation value of changes in the occurrence of a certain health event and is given by Equation (3); Value of Health Impact refers to the monetized metric of this health event. The health impacts of air pollution generally include changes in morbidity and mortality risk. However, Liou [35] noted that reductions in mortality risk accounted for over 98% of the health benefits that resulted from reductions in air pollution, whereas the reduction in medical costs owing to improvements in morbidity only accounted for approximately 2% of these health benefits. Therefore, this study will only focus on mortality risk when considering the health impact of air pollution. Changes in mortality risk were monetized using the value of statistic life (VSL) metric.

3. Empirical Data and Technical Parameters

3.1. Cost of Pollution Control and Effectiveness of Pollution Reduction

The TAPCAP being implemented by the Taiwan EPA incorporates 14 pollution control measures; these include power sector regulations, installation of pollution control devices in factories, and replacement of heavy-oil boilers with gas boilers. Old diesel vehicles will also be retired, while newer vehicles will be equipped with smoke filters. As the implementation of the TAPCAP began only in 2017, its pollution control measures were only expected to be fully implemented in 2019. Therefore, it was expected that the pollution-reducing effects of the TAPCAP would start being realized in 2019. The technical costs and expected pollution reductions of each of the pollution control measures of the TAPCAP are listed in Table 1.
The 14 measures included in the TAPCAP can be categorized as administrative or technical measures. Administrative measures pertain to the use of legal measures or administrative methods to reduce pollution. In this case, pollution reductions are derived from increments in technical efficiency, rather than the incorporation of pollution control technologies. For this reason, administrative measures do not require expenditure on pollution control devices. The measures that fall under this category include (1) regulation of fugitive dust from construction sites and stockpiles of dust-generating materials, (2) control of fugitive dust from riverbeds, (3) elimination of 1 million two-stroke motorcycles, and (4) introduction of new vehicle regulations. Technical measures require the use of various pollution control techniques, which need additional investments on equipment. These investment costs are defined as the technology cost of pollution control measures.

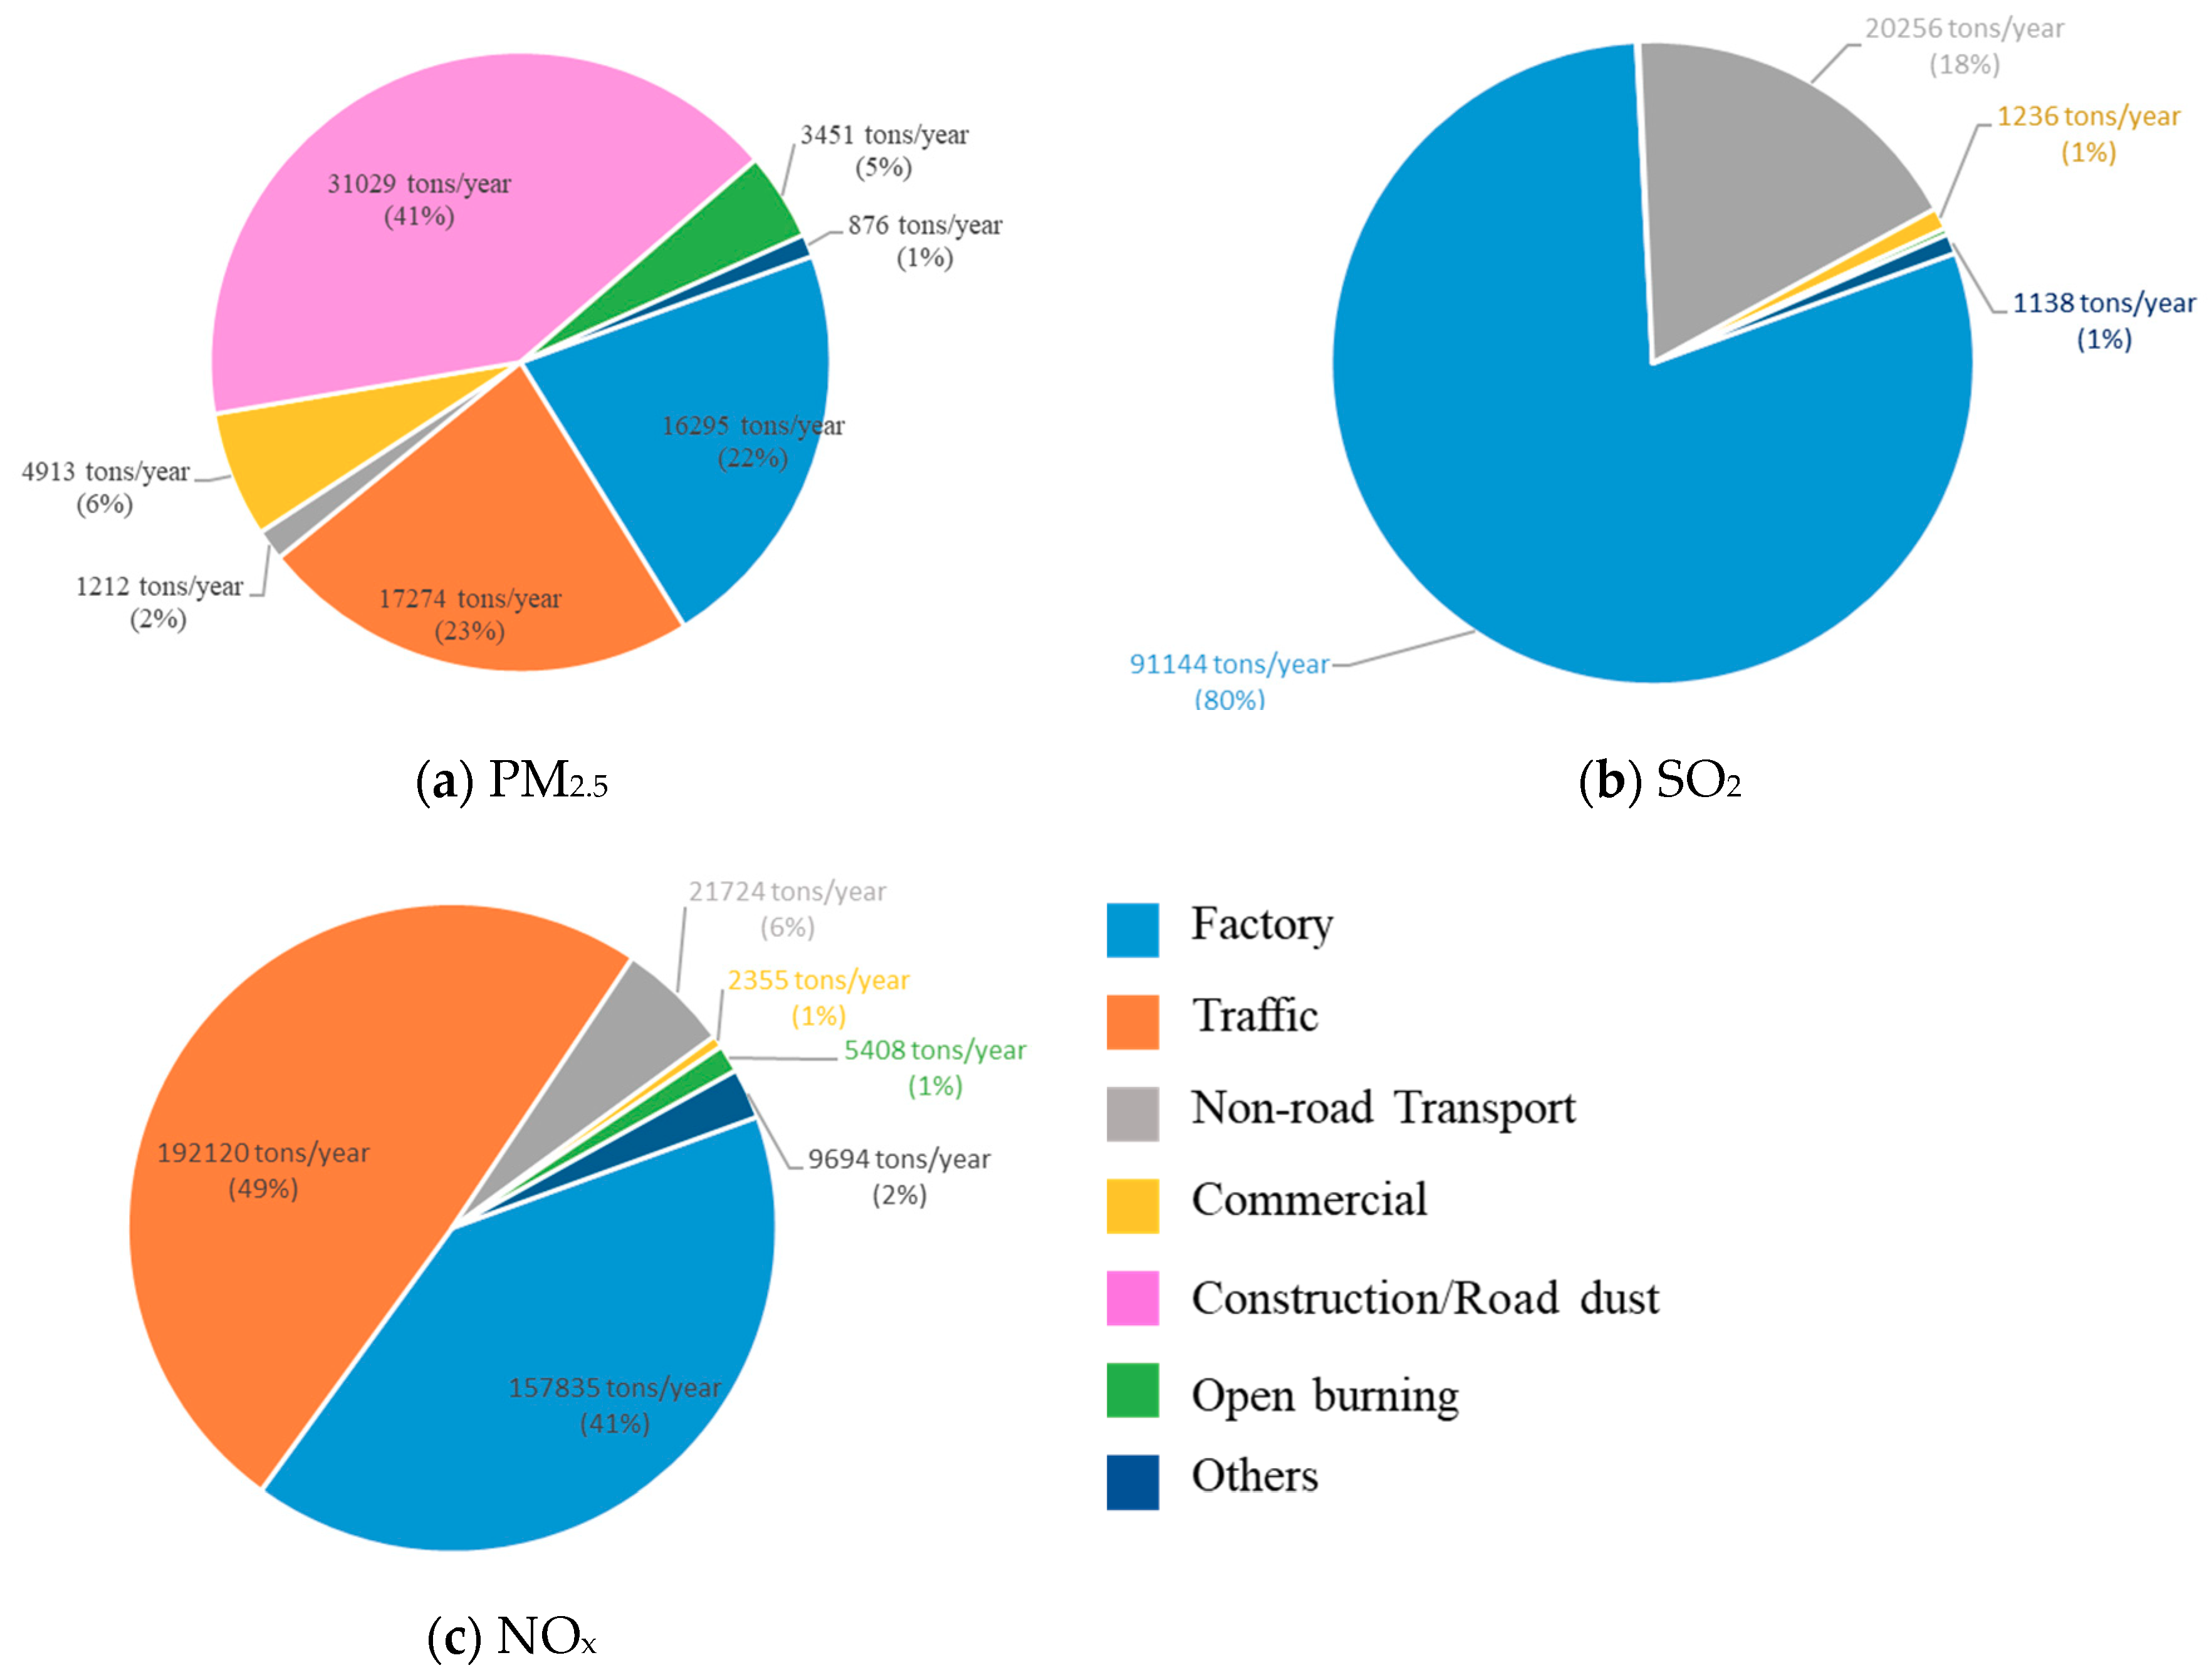
3.2. Dispersion Simulations: Emissions Data

The emission data in this study were obtained from the 9th edition of the Taiwan Emission Data Systems (TEDS), which was published by the Taiwan EPA and uses 2013 as the baseline year. The PM2.5, SOx, and NOx contributions of each source of pollution are presented in Figure 1. It is demonstrated that PM2.5 pollution in Taiwan is primarily caused by construction sites and road dust, which account for 41% of all PM2.5 emissions. SOx pollution is mainly caused by industrial emissions, which account for 80% of all SOx emissions. The largest contributor to NOx pollution is traffic emissions (49%), followed by factory emissions (41%).

3.3. Health Benefits: BenMAP Parameter Data

To estimate the health benefits of each air pollution control measure, the following data were included in the BenMAP database: population data, geographic layers, pollution monitoring data, and mortality rate from the National Health Insurance Research Database [38,39,40,41,42,43,44]. A meta-analysis was then performed to calculate the coefficient of estimation of the health impact function.
The VSL is a fatal risk monetization metric that has been used extensively in health benefit assessment studies [45,46]. The basic concept of VSL suggests that people have a willingness to pay (WTP) for the reduction of a certain percentage of fatal risk; VSL represents the summation of the WTPs in the unit of risk [47].
The estimation of health benefits owing to improvements in air pollution was performed using the value transfer method (VTM) on the VSL derived by Liou [47] for Taiwan in 2014. In the VTM, the value transfers were based on two aspects, the differences in income and consumer prices between the two years. The adjustments for differences in income were performed by substituting the salary income elasticity of the VSL estimated by Liou [47] into Equation (5):
V S L 2019 = V S L 2014 × { 1 + [ w × ( W 2019 W 2014 W 2014 ) ] 100 }
In Equation (5), VSL2019 is the nominal VSL value for 2019, w is the salary income elasticity of the VSL estimated by Liou [47], and W2019 and W2014 are the average monthly salary incomes of Taiwanese workers in 2014 and 2019.
The differences in consumer prices were adjusted using Equation (6):
R V S L 2019 = V S L 2014 × ( C P I 2014 / C P I 2019 )
In this equation, RSVL2019 is the VSL value after consumer price adjustments, while CPI2019 and CPI2014 are the 2019 and 2014 consumer price indices (CPIs), respectively.
The empirical data used in this study and their descriptions are shown in Table 2.

4. Analysis of Simulation Results

4.1. Simulations on the Effectiveness of the Pollution Control Measures

The emissions recorded in January, April, July, and October 2013 were simulated to analyze the seasonal characteristics of air pollution in Taiwan. Based on these results, we then estimated the annual mean of air pollutant concentrations in Taiwan. The simulation included all of Taiwan and East Asia, and the performance of the simulation conformed to the air quality simulation standards established by the Taiwan EPA [50].
By varying the control matrix, the RSM system can be used to adjust various pollutant concentrations simultaneously to provide insight into the effects of pollution control measures on air quality. The performance of the RSM model was validated using the method developed by Ashok et al. [27], i.e., by computing the coefficient of determination (R2) between the RSM and CMAQ models. We applied RSM to the training samples and used four additional CMAQ cases to fit and validate the RSM [14,51]. In this study, the R2 always ranged between 0.998 and 0.99, while mean bias and mean normal bias ranged between 0.03–0.02 and 0.01–0.04, respectively. Therefore, the results of the RSM simulation are exceptionally reliable (Figure 2).
Here, we estimate the changes in PM2.5 concentration that result from each pollution control measure and their corresponding health benefits with the assumption that the meteorological conditions of the target year are equal to those in 2013. The average PM2.5 concentration in Taiwan is 30.5 μg/m3. Figure 3 illustrates that the largest reductions in PM2.5 concentration are due to the TAPCAP that occurred in central and southern Taiwan. Between the various pollution control measures, reductions in the number of diesel trucks resulted in the largest difference in PM2.5 concentration (2 μg/m3 or 6.5%) (Table 3). The next most significant measures are the port area air quality regulations and power sector regulations, which reduced the average PM2.5 concentration of Taiwan by 0.5 μg/m3 and 0.4 μg/m3, respectively. This result is consistent with the findings of Lai et al. [52], which indicated that the control of road traffic emissions is highly effective in reducing PM2.5 concentration and that it is necessary to simultaneously control multiple sources of PM2.5 to maximize reductions in PM2.5 pollution.

4.2. Reduction in Health Risk

In this study, long-term health effects (i.e., changes in mortality risk) were used as the metric for quantifying improvements in health risk. According to the simulation, the population density of Taiwan is 644 people/km2, and the implementation of the 14 air pollution control measures in the TAPCAP will reduce the average PM2.5 concentration of Taiwan by 3.7 μg/m3, thus preventing 26 deaths every 100,000 people. The most beneficial measure is the “retirement of Stage 1 and Stage 2 diesel trucks,” as it is expected to prevent the deaths of 3846 (994–9415) people. The next most beneficial control measures are “the strengthening of port area air pollution regulations” and “power facility regulations,” which are expected to prevent the deaths of 994 (255–2430) and 827 (213–2022) people, respectively. The values presented in the parentheses represent the 90% confidence interval of the expected reduction in deaths.
In the PM2.5 concentration difference map (Figure 3a) and the avoided deaths map (Figure 3b), the largest changes in PM2.5 concentrations are observed in central and southern Taiwan, whereas the most significant improvements in health risks are observed in the northern and southern cities of Taiwan. This implies that the effectiveness of air pollution control strategies also depends on population density, in addition to the magnitude of the changes in pollutant concentration.

4.3. Health Benefits

The health improvements resulting from each measure were monetized based on VSL, and the monetized results are shown in Table 4. The results demonstrate that the 14 measures of the TAPCAP require an investment of 295.4 billion NTD. The implementation of these measures is expected to provide an average of 2570.5 billion NTD/year in health benefits, as compared with the scenario where these measures are not implemented. After the costs of these measures have been deducted, the net benefit is 2275.1 billion NTD. The benefit-cost (B-C) ratio of the TAPCAP is then 8.7, which indicates that each NTD of investment in pollution control creates a benefit of 8.7 NTD. Based on the 2019 Gross Domestic Product (GDP) of Taiwan, the net benefits of the TAPCAP are worth 12% of Taiwan’s GDP. These results show that overall, the advantages of implementing the TAPCAP far outweigh its disadvantages for Taiwan. Therefore, this strategy should be implemented.
In the next step, we will inspect the benefits of each type of measure. The 14 control measures can be classified into two categories based on their attributes; administrative measures and technical measures. There are four administrative measures, denoted as M1–M4 in Table 4, and the health benefits of each of these measures are illustrated in Figure 4. The implementation of these four measures will yield a total benefit of 210.3 billion NTD/year. The tightening of vehicle standards is the most beneficial measure (benefit: 75.8 billion NTD), followed by the control of fugitive dust from riverbeds (benefit: 68.5 billion NTD), control of fugitive dust from construction sites and dust-generating material stockpiles (benefit: 64.2 billion NTD), and promotion of electric vehicles (up to 2100 vehicles) for the transportation of fresh produce (benefit: 1.8 billion NTD).
In the TAPCAP, there are 10 technical measures, denoted as T1–T10 in Table 4, and the benefits of each of these measures are illustrated in Figure 5. The total health benefits of implementing the measures are 2360.1 billion NTD and their net benefit is 2064.8 billion NTD after accounting for costs. The three most beneficial measures are: (1) The retirement of 80,000 Stage 1 and Stage 2 diesel vehicles (benefit: 1401.9 billion NTD), (2) ship speed reductions, ship fuel usage regulations and the promotion of shore power (benefit: 362.3 billion NTD), and (3) power facility regulations (benefit: 301.4 billion NTD). These three measures account for 87.5% of the total health benefit from technical measures. The B-C ratio of the technical measures is almost 87 on average, which indicates that each unit of investment in technical pollution control measures yields 87 units of benefits. In addition, four pollution control measures with B-C ratios greater than 100 exist: (1) Ship speed reductions, ship fuel usage regulations, and promotion of shore power (B-C ratio: 332.4), (2) power facility regulations (B-C ratio: 144.9), (3) control of smoke from restaurants (B-C ratio: 188.1), and reduction of open-air burning by controlling the smoke from agricultural waste burning (B-C ratio: 437.4). As these four measures are remarkably cost-effective, they should be prioritized for future implementation. However, there is one technical measure that has a net benefit lower than 0 (B-C ratio lower than 1). This is the regulation of boiler facilities, where the government seeks to reduce air pollution by providing subsidies to retire 5000 industrial boilers and 1000 commercial boilers. The government has invested 54 billion NTD on this measure, but the expected health benefit is only 41.6 billion NTD. Therefore, this measure could be improved in terms of cost-effectiveness.

5. Summary and Conclusions

The ABaCAS-Taiwan assessment framework was used in this study to perform a comparative analysis between the costs and health benefits of the Taiwan TAPCAP being implemented by the government. Our empirical analysis indicates that the implementation of the TAPCAP has resulted in a net benefit (cost < benefit). Therefore, this ex post facto analysis provides evidence that the TAPCAP is a cost-effective policy. Furthermore, we have calculated the health benefits of each of the 14 pollution control measures that comprise the Air Pollution Control Action Plan (APCAP) and we computed their net benefits and B-C ratios by comparing their costs with the benefits. This was undertaken to demonstrate whether these measures should be implemented (i.e., whether they have a net benefit greater than 0), and allows them to be compared in terms of cost efficiency (by comparing their B-C ratios). These results will serve as a useful reference for policymakers deciding on future pollution control measures. The policy implications of these results include the following points.
All 14 pollution control measures can be categorized into administrative and technical measures. The administrative measures are implemented by strengthening regulations and controls to realize pollution reductions that require administrative rigor. As these measures do not require additional expenditure, they enable pollution reduction to be realized at a relatively low cost. The implementation of these administrative measures will yield a total benefit of 210.3 billion NTD/year. The tightening of vehicle standards is the most beneficial measure (benefit: 75.8 billion NTD), followed by the control of fugitive dust from riverbeds (benefit: 68.5 billion NTD), control of fugitive dust from construction sites and dust-generating material stockpiles (benefit: 64.2 billion NTD), and promotion of electric vehicles (up to 2100 vehicles) for the transportation of fresh produce (benefit: 1.8 billion NTD). Therefore, we suggest that administrative pollution control measures be prioritized for planning and execution.
In terms of technical control measures, the total health benefits of implementing these measures are 2360.1 billion NTD, and the net benefit is 2064.8 billion NTD after accounting for costs. The three most beneficial measures are (1) the retirement of 80,000 Stage 1 and Stage 2 diesel vehicles (benefit: 1401.9 billion NTD), (2) ship speed reductions, ship fuel usage regulations, and the promotion of shore power (benefit: 362.3 billion NTD), and (3) power facility regulations (benefit: 301.4 billion NTD). The relative importance of the technical measures can be decided based on their B-C ratios. The technical measures with higher B-C ratios should generally be prioritized for implementation, as long as there exists an opportunity for the resulting actions to reduce pollution. In the future, policymakers should utilize existing B-C ratio datasets to create budgets and decide on the appropriate combination of measures to maximize the cost-effective of the pollution control strategy. In addition, our findings demonstrate that government-subsidized decommissioning of boilers incurs higher costs than health benefits; this demonstrates that the cost-effectiveness of this measure needs to be improved. We suggest that the subsidies for this measure be adjusted to enable cost-effective pollution reduction to be realized.
Further research should be performed in two directions. First, several international technical parameters that exist in the ABaCAS-Taiwan framework have yet to be localized for Taiwan. Thus, a future study could involve updating the framework with locally appropriate technical parameters to improve the accuracy and rationality of the framework’s estimations. According to previous studies, the reduction of expected deaths caused by air pollution improvement can cause a positive effect on macroeconomics through increased labor force. These positive economic effects can be simulated using macroeconomic models, such as the computable general equilibrium model. Therefore, we propose further study to incorporate the economic models to investigate how air pollution levels could affect the economy as a whole through the labor market.
As the framework includes the ability of reduction benefit estimation, any new control measure could be examined and then implemented or declined. The findings of this study suggest that ex post facto analysis as well as the future APCAP could use ABaCAS as a regular estimation tool. According to air pollution policymaking processes in many countries, the ABaCAS system can be adopted as a powerful tool. The case study of the ABaCAS-Taiwan demonstrates that it can already estimate the impact of air pollution on populations, however, future studies could use economic models to analyze how changes in air pollution affect the overall economy. The methodology used in this study can be extended to countries other than Taiwan, especially for countries that the air quality is closing to the target, they can build up the local datasets including emission inventory, control technology with its cost, and human health benefit at first, then using ABaCAS to evaluate the performance of air quality policy.

Author Contributions

Conceptualization, H.-C.L.; methodology, H.-C.L.; formal analysis, M.-C.H. and J.-L.L.; data curation, J.S.F., L.-W.L., and P.-C.W.; writing—original draft preparation, H.-C.L., M.-C.H., and J.-L.L.; writing—review and editing, H.-C.L. and J.S.F.; visualization, M.-C.H.; All authors have read and agreed to the published version of the manuscript.

Funding

This research was funded by Taiwan EPA (EPA-106-FA18-03-A260).

Acknowledgments

The authors would like to thank Carey Jang who has been involved with the development and improvements of modeling systems. The authors would like to thank the Environmental Protection Administration Taiwan for providing the air quality monitoring data and the information of APCAP cost and reduction emission and funding resources.

Conflicts of Interest

The authors declare no conflict of interest.

References

  1. World Health Organization. Ambient (Outdoor) Air Quality and Health. 2018. Available online: https://www.who.int/news-room/fact-sheets/detail/ambient-(outdoor)-air-quality-and-health (accessed on 13 August 2020).
  2. Fann, N.; Lamson, A.D.; Anenberg, S.C.; Wesson, K.; Risley, D.; Hubbell, B. Estimating the National Public Health Burden Associated with Exposure to Ambient PM2.5 and Ozone. Risk Anal. 2011, 32, 81–95. [Google Scholar] [CrossRef] [PubMed]
  3. Wang, H.; Zhu, Y.; Jang, C.; Lin, C.-J.; Wang, S.; Fu, J.S.; Gao, J.; Deng, S.; Xie, J.; Ding, D.; et al. Design and demonstration of a next-generation air quality attainment assessment system for PM2.5 and O3. J. Environ. Sci. 2015, 29, 178–188. [Google Scholar] [CrossRef] [PubMed]
  4. Zhu, Y.; Lao, Y.; Jang, C.; Lin, C.-J.; Xing, J.; Wang, S.; Fu, J.S.; Deng, S.; Xie, J.; Long, S. Development and case study of a science-based software platform to support policy making on air quality. J. Environ. Sci. 2015, 27, 97–107. [Google Scholar] [CrossRef] [PubMed]
  5. Sun, J.; Schreifels, J.; Wang, J.; Fu, J.S.; Wang, S. Cost estimate of multi-pollutant abatement from the power sector in the Yangtze River Delta region of China. Energy Policy 2014, 69, 478–488. [Google Scholar] [CrossRef]
  6. Wang, S.; Xing, J.; Jang, C.; Zhu, Y.; Fu, J.S.; Hao, J. Impact Assessment of Ammonia Emissions on Inorganic Aerosols in East China Using Response Surface Modeling Technique. Environ. Sci. Technol. 2011, 45, 9293–9300. [Google Scholar] [CrossRef]
  7. Xing, J.; Wang, S.; Jang, C.; Zhu, Y.; Hao, J.M. Nonlinear response of ozone to precursor emission changes in China: A modeling study using response surface methodology. Atmos. Chem. Phys. 2011, 11, 5027–5044. [Google Scholar] [CrossRef] [Green Version]
  8. Roy, R.; Braathen, N.A. The Rising Cost of Ambient Air Pollution thus Far in the 21st Century: Results from the Briics and the Oecd Countries; OECD Publishing: Paris, France, 2017. [Google Scholar]
  9. Bae, H.J.; Park, J. Health Benefits of Improving Air Quality in the Rapidly Aging Korean Society. Sci. Total Environ. 2009, 407, 5971–5977. [Google Scholar] [CrossRef]
  10. Chae, Y.; Park, J. Quantifying Costs and Benefits of Integrated Environmental Strategies of Air Quality Management and Greenhouse Gas Reduction in the Seoul Metropolitan Area. Energy Policy 2011, 39, 5296–5308. [Google Scholar] [CrossRef]
  11. Berman, J.D.; Fann, N.; Hollingsworth, J.W.; Pinkertion, K.E.; Rom, W.N.; Szema, A.M.; Breysse, P.N.; White, R.H.; Curriero, F.C. Health Benefits from Large-Scale Ozone Reduction in the Untied States. Environ. Health Perspect. 2012, 10, 1404–1410. [Google Scholar] [CrossRef]
  12. IQAir. 2019 World Air Quality Report. Available online: https://www.iqair.com/world-most-polluted-cities/world-air-quality-report-2019-en.pdf (accessed on 13 May 2020).
  13. South Coast Air Quality Management District. Final 2012 Air Quality Management Plan; South Coast Air Quality Management District: Diamond Bar, CA, USA, 2016. [Google Scholar]
  14. Xing, J.; Ding, D.; Wang, S.; Zhao, B.; Jang, C.; Wu, W.; Zhang, F.; Zhu, Y.; Hao, J. Quantification of the enhanced effectiveness of no x control from simultaneous reductions of voc and nh 3 for reducing air pollution in the beijing–tianjin–hebei region, china. Atmos. Chem. Phys. 2018, 18, 7799–7814. [Google Scholar] [CrossRef] [Green Version]
  15. Xing, J.; Wang, S.; Jang, C.; Zhu, Y.; Zhao, B.; Ding, D.; Wang, J.; Zhao, L.; Xie, H.; Hao, J. Abacas: An overview of the air pollution control cost-benefit and attainment assessment system and its application in China. Available online: http://pubs.awma.org/flip/EM-Apr-2017/xing.pdf (accessed on 10 July 2020).
  16. ABaCAS Project. Available online: http://www.abacas-dss.com/ (accessed on 10 July 2020).
  17. The Environmental Protection Agency. Technical Support Document for the Proposed Pm NAAQS Rule: Response Surface Modeling; U.S. Environmental Protection Agency Office of Air Quality Planning and Standards: Research Triangle Park, NC, USA, 2006.
  18. Taiwan Environmental Protection Administration. Air Pollution Control Strategies. 2017. Available online: https://www.ey.gov.tw/Page/5A8A0CB5B41DA11E/87903aa6-740f-49ad-b665-9db863a61045 (accessed on 24 April 2017).
  19. European Commission. Extern E, Externalities of Energy: Methodology 2005 Update. Available online: http://www.externe.info/externe_d7/sites/default/files/methup05a.pdf (accessed on 28 November 2005).
  20. United Nations Environmental Protection Agency. BenMAP, Environmental Benefits Mapping and Analysis Program Community Edition, User’s Manual. 2018. Available online: https://www.epa.gov/sites/production/files/2015-04/documents/benmap-ce_user_manual_march_2015.pdf (accessed on 15 July 2020).
  21. Huang, J.; Zhu, Y.; Kelly, J.T.; Jang, C.; Wang, S.; Xing, J.; Chiang, P.C.; Fan, S.; Zhao, X.; Yu, L. Large-Scale Optimization of Multi-Pollutant Control Strategies in the Pearl River Delta Region of China Using a Genetic Algorithm in Machine Learning. Sci. Total Environ. 2020, 722, 137701. [Google Scholar] [CrossRef] [PubMed]
  22. Davidson, K.; Hallberg, A.; McCubbin, D.; Hubbell, B. Analysis of PM2.5 Using the Environmental Benefits Mapping and Analysis Program (BenMAP). J. Toxicol. Environ. Health Part A 2007, 70, 332–346. [Google Scholar] [CrossRef] [PubMed]
  23. Voorhees, A.S.; Wang, J.; Wang, C.; Zhao, B.; Wang, S.; Kan, H. Public Health Benefits of Reducing Air Pollution in Shanghai: A Proof-of-Concept Methodology with Application to BenMAP. Sci. Total Environ. 2014, 485–486, 396–405. [Google Scholar] [CrossRef] [PubMed]
  24. Chen, L.; Shi, M.; Gao, S.; Li, S.; Mao, J.; Zhang, H.; Sun, Y.; Bai, Z.; Wang, Z. Assessment of Population Exposure to PM2.5 for Mortality in china and Its Public Health Benefit Based on BenMAP. Environ. Pollut. 2017, 221, 311–317. [Google Scholar] [CrossRef] [PubMed]
  25. Sacks, J.D.; Lloyd, J.M.; Zhu, Y.; Anderton, J.; Jang, C.J.; Hubbell, B.; Fann, N. The Environmental Benefits Mapping and Analysis Program-Community Edition (BenMAP–CE): A Tool to Estimate the Health and Economic Benefits of Reducing Air Pollution. Environ. Model. Softw. 2018, 104, 118–129. [Google Scholar] [CrossRef]
  26. Lin, W.-Y.; Hsiao, M.-C.; Wu, P.-C.; Fu, J.S.; Lai, L.-W.; Lai, H.-C. Analysis of Air Quality and Health Co-Benefits Regarding Electric Vehicle Promotion Coupled with Power Plant Emissions. J. Clean. Prod. 2020, 247, 119152. [Google Scholar] [CrossRef]
  27. Ashok, A.; Lee, I.H.; Arunachalam, S.; Waitz, I.A.; Yim, S.H.L.; Barrett, S.R.H. Development of a Response Surface Model of Aviation’s Air Quality Impacts in the United States. Atmos. Environ. 2013, 77, 445–452. [Google Scholar] [CrossRef]
  28. Long, S.; Zhu, Y.; Jang, C.; Lin, C.J.; Wang, S.; Zhao, B.; Gao, J.; Deng, S.; Xie, J.; Qiu, X. A Case Study of Development and Application of a Streamlined Control and Response Modeling System for PM2.5 Attainment Assessment in china. J. Environ. Sci. 2016, 41, 69–80. [Google Scholar] [CrossRef]
  29. Kelly, J.T.; Jang, C.J.; Timin, B.; Gantt, B.; Reff, A.; Zhu, Y.; Long, S.; Hanna, A. A System for Developing and Projecting PM2. 5 Spatial Fields to Correspond to Just Meeting National Ambient Air Quality Standards. Atmos. Environ. X 2019, 2, 100019. [Google Scholar] [CrossRef]
  30. Ostro, B.; Chestnut, L. Assessing the Health Benefits of Reducing Particulate Matter Air Pollution in the United States. Environ. Res. 1998, 76, 94–106. [Google Scholar] [CrossRef]
  31. Fann, N.; Baker, K.R.; Fulcher, C.M. Characterizing the PM2.5-Related Health Benefits of Emission Reductions for 17 Industrial, Area and Mobile Emission Sectors Across the U.S. Environ. Int. 2012, 49, 141–151. [Google Scholar] [CrossRef] [PubMed]
  32. Grabow, M.L.; Spak, S.N.; Holloway, T.; Stone, B.; Mednick, A.C.; Patz, J.A. Air Quality and Exercise-Related Health Benefits from Reduced Car Travel in the Midwestern United States. Environ. Health Perspect. 2012, 120, 68–76. [Google Scholar] [CrossRef] [PubMed] [Green Version]
  33. Boldo, E.; Linares, C.; Lumbreras, J.; Borge, R.; Narros, A.; García-Pérez, J.; Fernández-Navarro, P.; Pérez-Gómez, B.; Aragonés, N.; Ramis, R.; et al. Health Impact Assessment of a Reduction in Ambient PM2.5 Levels in Spain. Environ. Int. 2011, 37, 342–348. [Google Scholar] [CrossRef] [PubMed]
  34. Broome, R.A.; Fann, N.; Cristina, T.J.; Fulcher, C.; Duc, H.; Morgan, G.G. The Health Benefits of Reducing Air Pollution in Sydney, Australia. Environ. Res. 2015, 143, 19–25. [Google Scholar] [CrossRef]
  35. Liou, J.L. Estimating the Health Benefit of Particulate Matter Reduction in Taiwan: Application of Benefit per Ton Method; Chung-Hua Institution for Economic Research Publishing: Taipei, Taiwan, 2019. [Google Scholar]
  36. Environmental Protection Administration of Taiwan. Air Pollution Control Action Plan. Available online: https://www.ey.gov.tw/Page/448DE008087A1971/5638596f-c460-4a12-9e62-d623d34f67d1 (accessed on 21 December 2017).
  37. Environmental Protection Administration of Taiwan. Taiwan Emission Data System. Available online: https://teds.epa.gov.tw/TEDS.aspx.2017 (accessed on 1 November 2016).
  38. Pope, C.A., III; Burnett, R.T.; Thun, M.J.; Calle, E.E.; Krewski, D.; Ito, K.; Thurston, G.D. Lung Cancer, Cardiopulmonary Mortality, and Long-Term Exposure to Fine Particulate Air Pollution. JAMA 2002, 287, 1132–1141. [Google Scholar] [CrossRef] [Green Version]
  39. Crouse, D.L.; Peters, P.A.; Van Donkelaar, A.; Goldberg, M.S.; Villeneuve, P.J.; Brion, O.; Khan, S.; Atari, D.O.; Jerrett, M.; Pope, C.A., III. Risk of Nonaccidental and Cardiovascular Mortality in Relation to Long-Term Exposure to Low Concentrations of Fine Particulate Matter: A Canadian National-Level Cohort Study. Environ. Health Perspect. 2012, 120, 708–714. [Google Scholar] [CrossRef]
  40. Lepeule, J.; Laden, F.; Dockery, D.; Schwartz, J. Chronic Exposure to Fine Particles and Mortality: An Extended Follow-Up of the Harvard Six Cities Study from 1974 to 2009. Environ. Health Perspect. 2012, 120, 965–970. [Google Scholar] [CrossRef]
  41. Cesaroni, G.; Badaloni, C.; Gariazzo, C.; Stafoggia, M.; Sozzi, R.; Davoli, M.; Forastiere, F. Long-Term Exposure to Urban Air Pollution and Mortality in a Cohort of More than a Million Adults in Rome. Environ. Health Perspect. 2013, 121, 324–331. [Google Scholar] [CrossRef] [Green Version]
  42. Jerrett, M.; Burnett, R.T.; Beckerman, B.S.; Turner, M.C.; Krewski, D.; Thurston, G.; Martin, R.V.; Van Donkelaar, A.; Hughes, E.; Shi, Y.; et al. Spatial Analysis of Air Pollution and Mortality in California. Am. J. Respir. Crit. Care Med. 2013, 188, 593–599. [Google Scholar] [CrossRef]
  43. Beelen, R.; Raaschou-Nielsen, O.; Stafoggia, M.; Andersen, Z.J.; Weinmayr, G.; Hoffmann, B.; Wolf, K.; Samoli, E.; Fischer, P.; Nieuwenhuijsen, M. Effects of Long-Term Exposure to Air Pollution on Natural-Cause Mortality: An Analysis of 22 European Cohorts Within the Multicentre Escape Project. Lancet 2014, 383, 785–795. [Google Scholar] [CrossRef]
  44. Pope, C.A., III; Turner, M.C.; Burnett, R.T.; Jerrett, M.; Gapstur, S.M.; Diver, W.R.; Krewski, D.; Brook, R.D. Relationships Between Fine Particulate Air Pollution, Cardiometabolic Disorders, and Cardiovascular Mortality. Circ. Res. 2015, 116, 108–115. [Google Scholar] [CrossRef] [PubMed]
  45. Viscusi, W.K.; Aldy, J.E. The Value of a Statistical Life: A Critical Review of Market Estimates Throughout the World. J. Risk Uncertain 2003, 27, 5–76. [Google Scholar] [CrossRef]
  46. Viscusi, W.K.; Huber, J.; Bell, J. Assessing Whether There Is a Cancer Premium for the Value of a Statistical Life. Health Econ. 2014, 23, 384–396. [Google Scholar] [CrossRef] [PubMed]
  47. Liou, J.-L. Effect of Income Heterogeneity on Valuation of Mortality Risk in Taiwan: An Application of Unconditional Quantile Regression Method. Int. J. Environ. Res. Public Health 2019, 16, 1620. [Google Scholar] [CrossRef] [Green Version]
  48. Directorate-General of Budget. Accounting and Statistics, Executive Yuan, R.O.C. Price Index Database. 2020. Available online: http://statdb.dgbas.gov.tw/pxweb/Dialog/price.asp?mp=4 (accessed on 8 April 2020).
  49. Directorate-General of Budget. Accounting and Statistics, Executive Yuan, R.O.C. Salary and Productivity Survey Database. Available online: https://earnings.dgbas.gov.tw/query_payroll_C.aspx?mp=4 (accessed on 10 July 2017).
  50. Environmental Protection Administration of Taiwan, Air Quality Modeling and Simulation Standards. Available online: https://oaout.epa.gov.tw/law/LawContent.aspx?id=GL005316 (accessed on 11 August 2015).
  51. Zhao, B.; Wang, S.; Donahue, N.M.; Jathar, S.H.; Huang, X.; Wu, W.; Hao, J.; Robinson, A.L. Quantifying the effect of organic aerosol aging and intermediate-volatility emissions on regional-scale aerosol pollution in china. Sci. Rep. 2016, 6, 28815. [Google Scholar] [CrossRef] [PubMed] [Green Version]
  52. Lai, H.-C.; Ma, H.-W.; Chen, C.-R.; Hsiao, M.-C.; Pan, B.-H. Design and application of a hybrid assessment of air quality models for the source apportionment of pm2.5. Atmos. Environ. 2019, 212, 116–127. [Google Scholar] [CrossRef]
Figure 1. Contribution of pollution sources to (a) PM2.5, (c) NOx, and (b) SO2 pollution in the baseline year (2013). Open data from Taiwan Government [37].
Applsci 10 05970 g001
Figure 2. Simulation of PM2.5 pollution in 2013 by the advance response surface model (RSM) system and Community Multi-scale Air Quality model (CMAQ).
Applsci 10 05970 g002
Figure 3. PM2.5 reduction concentration and the expected reductions in the number of deaths of TAPCAP implement. (a) PM2.5 reduction concentration of TAPCAP (μg/m3). (b) Estimated PM2.5 related health impact (number of preventable deaths) due to (a).
Applsci 10 05970 g003
Figure 4. Health benefits of administrative pollution control measures (in billions of new Taiwan dollars (NTD)).
Applsci 10 05970 g004
Figure 5. Health benefits of technical pollution control measures (billions of new Taiwan dollars (NTD)).
Applsci 10 05970 g005
Table 1. Expected pollution reduction of each pollution control measure with the 14 air pollution control strategies (TAPCAP).
Pollution Control MeasuresTechnology Cost (in 100 Million NTD)Expected Pollution Reduction (Metric Tons/Year) 1,2
PM2.5SOxNOxVOC
Regulate power facilities (implement stricter power sector regulations and standards)20.814312,09217,163-
Regulate state-owned businesses (Taiwan Steel Group: install pollution control devices on emission sources and utilize optimal feasible technologies; CPC Corporation: implement tail gas recovery and replace heavy-oil fuels)268.01741948134349
Accelerate the decommissioning of 5000 industrial and 1000 commercial boilers)540.0175496229367
Improve control of smoke from 7000 restaurants4.1788---
Change fuel-burning customs and traditions (increase centralized burning to 22,000 metric tons)10.095-30-
Regulate fugitive dust from construction sites and stockpiles of dust-generating materials-672---
Control smoke from the burning of agricultural waste (reduce the area of open-air burning by 90%)2.5466---
Control fugitive dust from riverbeds-720---
Strengthen air pollution controls in port areas (implement reductions in ship speeds, regulate ship fuel usage, promote the use of shore power)1863.080116,3852123-
Retire 80,000 Stage 1 and Stage 2 diesel trucks40.95395-71,1497584
Install exhaust filters in 38,000 Stage 3 diesel trucks193.0243---
Eliminate 1 million 2-stroke motorcycles-45712607743
Promote electric vehicles (up to 2100 vehicles) for the transportation of fresh produce10.97-349
Strengthen emission standards for automobiles that are 10 years or older, and set up air quality maintenance zones, where the entry of highly polluting vehicles is restricted or forbidden-410-25875315
Open data from Taiwan Government [36]. 1 The emission totals were obtained from the Taiwan Emission Data Systems (TEDS 9.0) report, which covers Keelung City, Taipei City, New Taipei City, Taoyuan City, Hsinchu County City, Miaoli County, Taichung City, Nantou County, Changhua County, Yunlin County, Chiayi County City, Tainan City, Kaohsiung City, and Pingtung County 2 These emissions do not include those of the eastern region (Yilan County, Hualien County, and Taitung County).
Table 2. Environmental benefit mapping and analysis program (BenMAP) database.
Type of Database
(Base Year = 2013, Target Year = 2019)
Data Description
Pollutant Monitoring DataPM2.5 monitoring data across Taiwan in 2013: 24.1 μg/m3
(seasonal average) 1
Death RateAll causes (2013): 0.0165% 2,3
Cardiovascular diseases (2013): 0.0532% 2,4
Respiratory diseases (2013): 0.0026% 2,5
Population DataImport of actual population in the all-age minimum statistical area in 2013: 22,306,759 6
Health Impact Function (Cr-Function)Meta-analysis was applied to health impact function using a random effect approach. 7
VSL (Benefit Function)Salary income—VSL elasticity ( w ) 8: 0.2476
Consumer Price Index 9: CPI2014: 98.93; CPI2019: 102.55
Recurring income 10: W2014: 40,189 NTD/month; W2019: 42,851 NTD/month
V S L 2014 . 8: 357.9 million NTD
R V S L 2019 11: 364.5 million NTD
1 Taiwan EPA monitoring Data 2 National Health Insurance Research Database in Taiwan, the grid size is 3 km × 3 km. 3 Death rates of all cause = number of deaths in 2013/total population. 4 Death rate of cardiovascular disease = Number of death due to cardiovascular disease in 2013/total population. 5 Deaths rate of Respiratory diseases = Number of death due to Respiratory diseases in 2013/total population. 6 SEGIS (Socio-Economic Geographic Information System), Department of Statistics, Ministry of the Interior 7 The papers that were included in this meta-analysis are [39,40,41,42,43,44,45] 8 Obtained from [47] 9 Data obtained from the Directorate-General of Budget, Accounting and Statistics (DGBAS), Executive Yuan, R.O.C. [48]. 10 Data obtained from the DGBAS, Executive Yuan, R.O.C. [49]. 11 Data obtained from [31]. This value was calculated using Equations (5) and (6).
Table 3. Improvement in air quality and health impact due to each pollution control measure under the 14 air pollution control strategies (TAPCAP).
Air pollution Control MeasureAverage ∆PM2.5 (μg/m3) 1Expected Reduction in Number of Deaths
(90% Confidence) 2
Regulate power facilities (stricter power sector regulations and standards)0.405 (0.03–1.13)827 (213–2022)
Install pollution control devices in state-owned businesses (e.g., Dragon Steel, China Steel Corporation, CPC Corporation)0.050 (0–0.44)82 (21–199)
Decommissioning of boilers (accelerate the retirement of 5000 industrial boilers and 1000 commercial boilers0.061 (0.01–0.19)114 (29–280)
Control smoke from 7000 restaurants0.114 (0.01–0.21)206 (53–504)
Change fuel-burning customs and traditions (increase centralized burning to 22,000 metric tons)0.016 (0–0.03)27 (7–67)
Regulate fugitive dust from construction sites and stockpiles of dust-generating materials, increase conformance to 90%0.098 (0.01–0.18)176 (45–430)
Improve control smoke from agricultural waste-burning (reduce the area of open-air burning by 90%)0.069 (0–0.12)123 (31–300)
Control fugitive dust from riverbeds0.105 (0.01–0.19)188 (48–460)
Retire 80,000 Stage 1 and Stage 2 diesel trucks1.959 (0.12–4.18)3846 (994–9415)
Install exhaust filters in 38,000 Stage 3 diesel trucks0.046 (0.01–0.08)87 (22–213)
Eliminate 1 million 2-stroke motorcycles0.088 (0.01–0.16)169 (43–413)
Promote electric vehicles (up to 2100 vehicles) for the transportation of fresh produce0.003 (0–0.01)5 (1–13)
Strengthen air pollution controls in port areas (reduce ship speeds, regulate ship fuel usage, promote the use of shore power)0.529 (0.04–1.48)994 (255–2430)
Set stricter emission standards for automobiles that are 10 years or older, and set up air quality maintenance zones, where the entry of highly polluting vehicles is restricted or forbidden0.107 (0.01–0.21)208 (53–508)
1 The values in the parentheses are the minimum and maximum values. 2 The range in the parentheses corresponds to the 90% confidence interval.
Table 4. Health benefit of each pollution control measure under the 14 air pollution control strategies (TAPCAP).
Air Pollution Control MeasureHealth Benefit 1
(100 Million NTD)
Percentage of Total Benefit (%)Technical Cost (100 Million NTD)Benefit/Cost Ratio
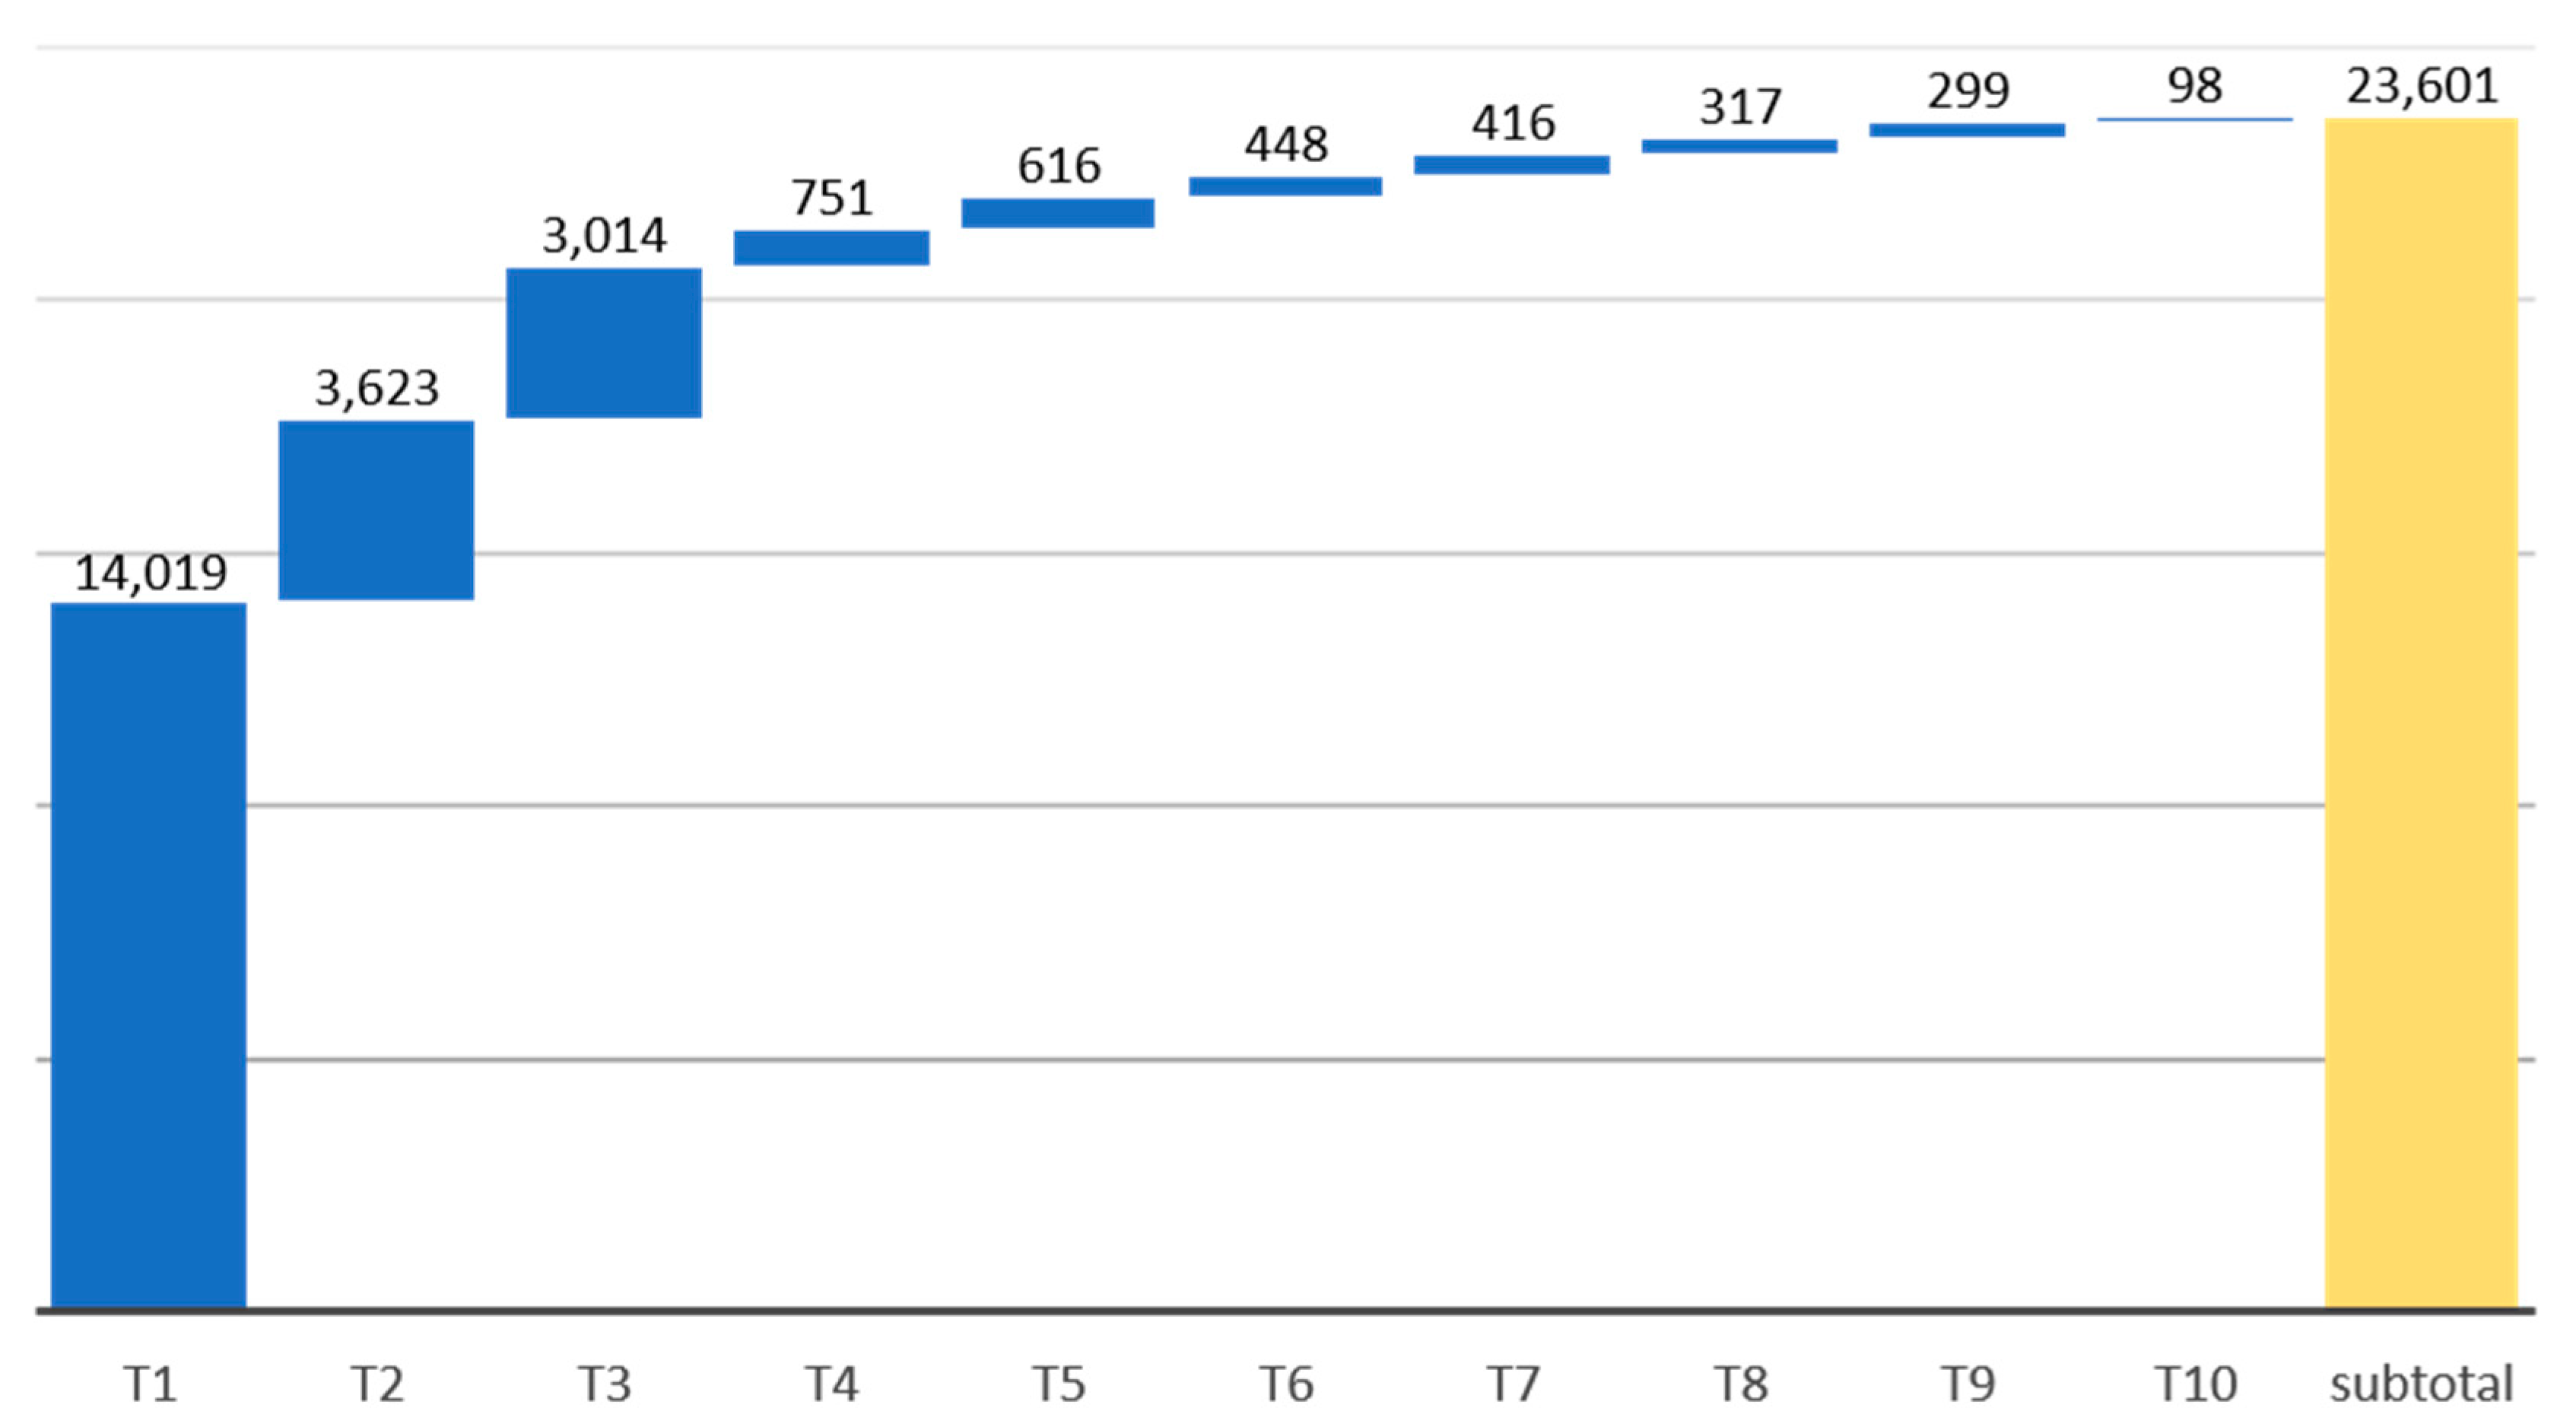
1. Technical Measures
T1Retire 80,000 Stage 1 and Stage 2 diesel trucks14,01954.518637.5
T2Strengthen air pollution controls in port areas (ship speed reductions, regulations on ship fuel usage, promoting the use of shore power)362314.111332.4
T3Power facility regulations (stricter power sector regulations and standards)301411.721144.9
T4Improve control of smoke from 7000 restaurants7512.94183.1
T5Eliminate 1 million 2-stroke motorcycles6162.41933.2
T6Improve control of smoke from agricultural waste-burning (reduce the area of open-air burning by 90%)4481.73179.3
T7Regulate boilers (accelerate the retirement of 5000 industrial boilers and 1000 commercial boilers)4161.65400.8
T8Install exhaust filters in 38,000 Stage 3 diesel trucks3171.2417.8
T9Install pollution control devices in state-owned businesses (e.g., Dragon Steel, China Steel Corporation, CPC Corporation)2991.22681.1
T10Change fuel-burning customs and traditions (increase centralized burning to 22,000 metric tons)980.4109.8
Subtotal23,60191.7295486.9
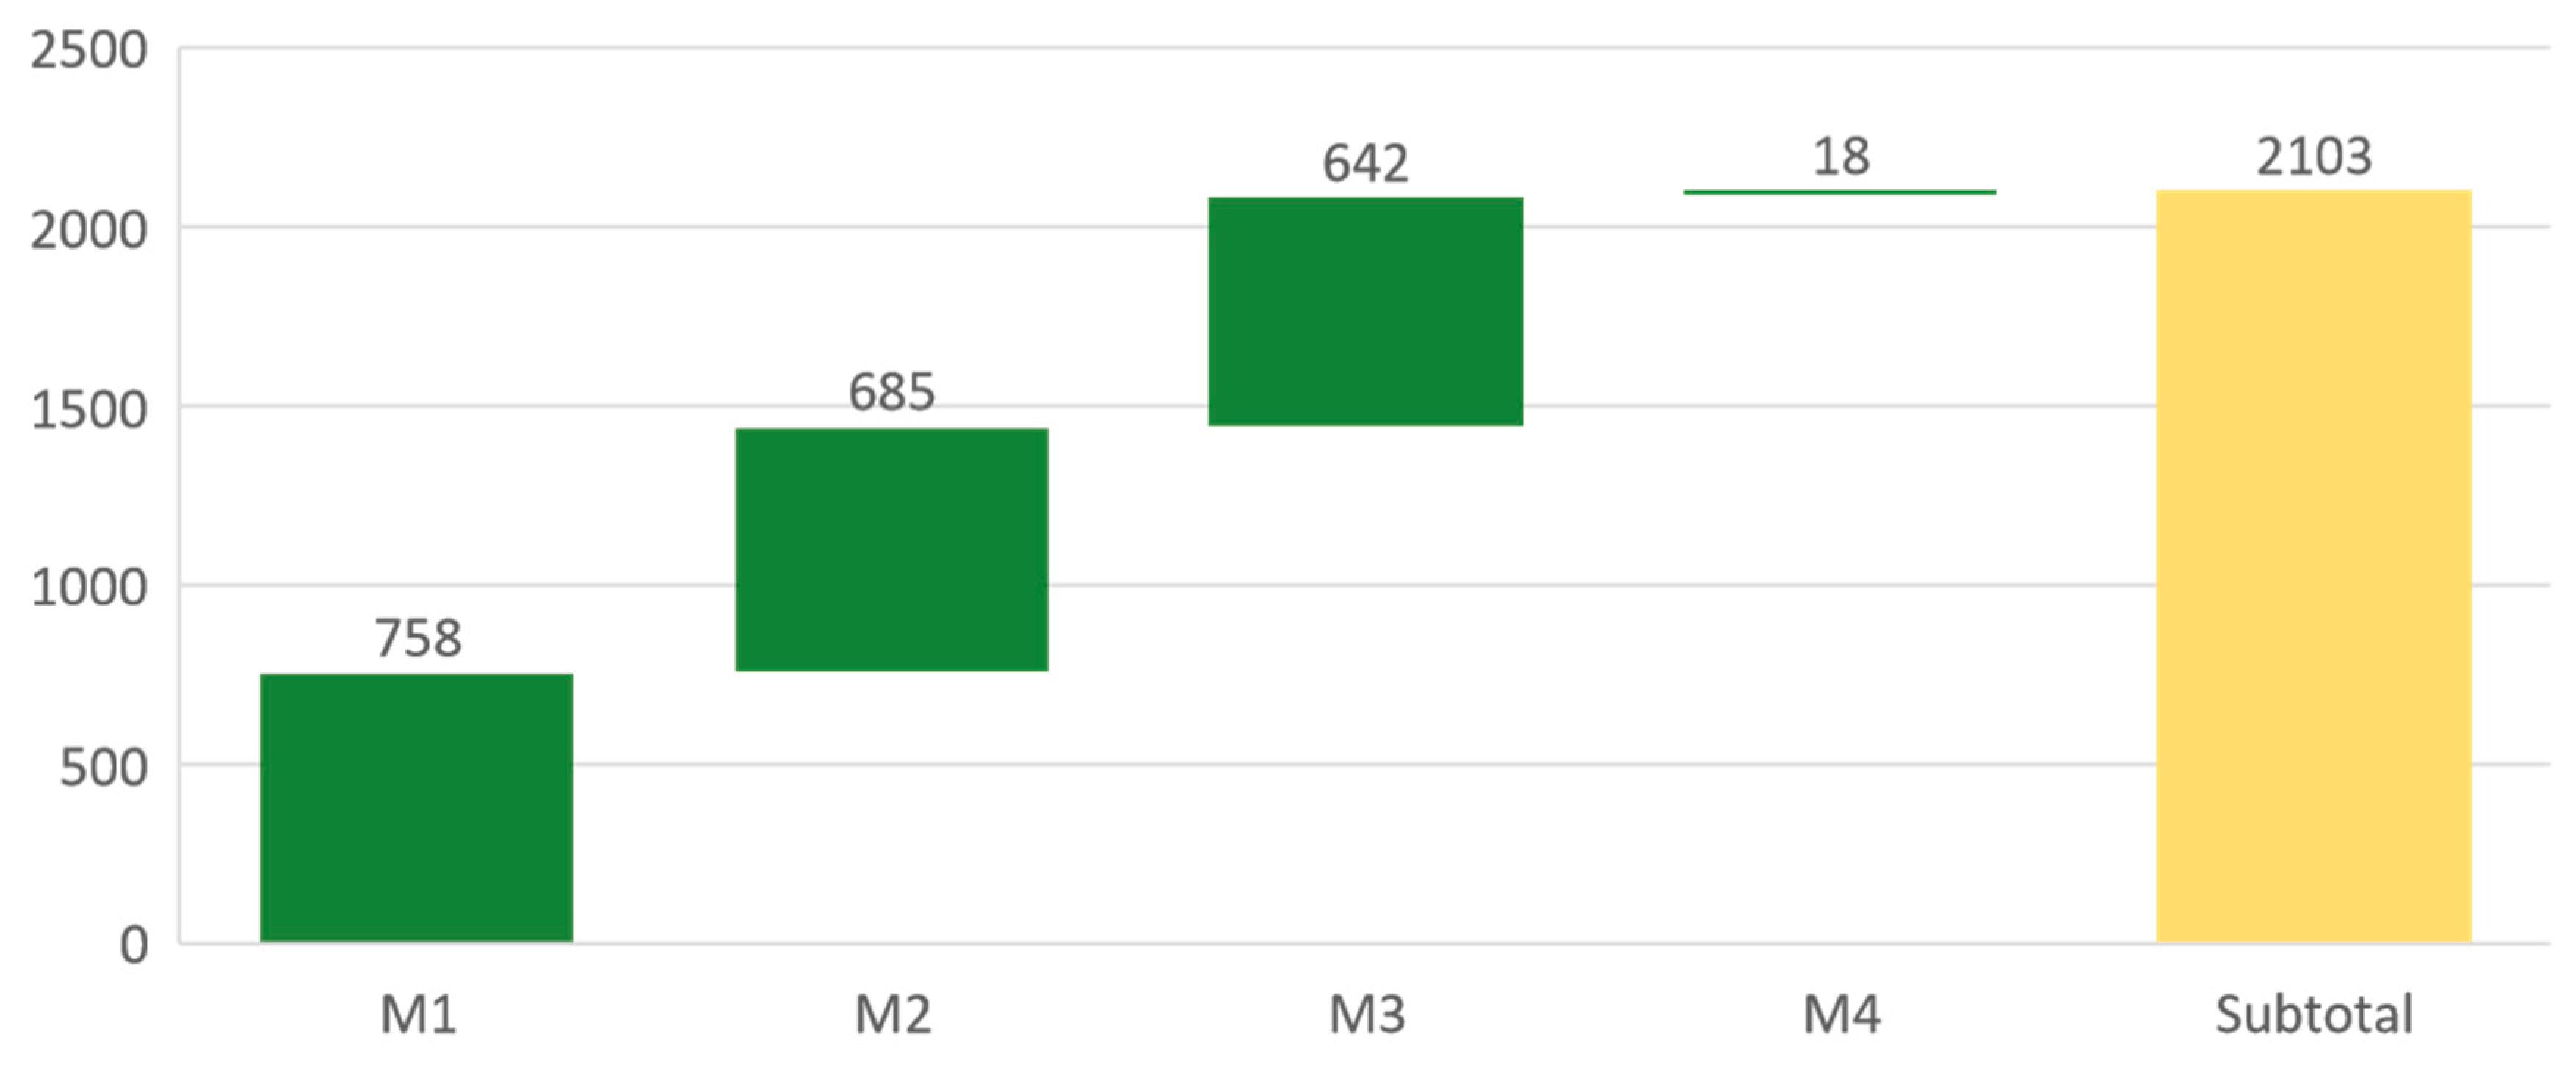
2. Administrative Measures 1
M1Tighten emission standards for automobiles that are 10 years or older, and set up air quality maintenance zones, where the entry of highly polluting vehicles is restricted or forbidden7582.9--
M2Control fugitive dust from riverbeds6852.7--
M3Regulations for fugitive dust from construction sites and stockpiles of dust-generating materials, increase conformance to 90%6422.5--
M4Promotion of electric vehicles (up to 2100 vehicles) for the transportation of fresh produce180.1--
Subtotal21038.2--
1 As the administrative measure does not involve the purchase and use of pollution control devices, they do not have an easily identifiable cost, which makes it impossible to calculate their B/C ratio.

