Comparison of Neural Activation Area in Primary Somatosensory Cortex and Brodmann Area 3 According to Finger and Phalange High-Frequency Vibration Stimulation


Abstract
:1. Introduction
2. Materials and Methods
2.1. Subjects
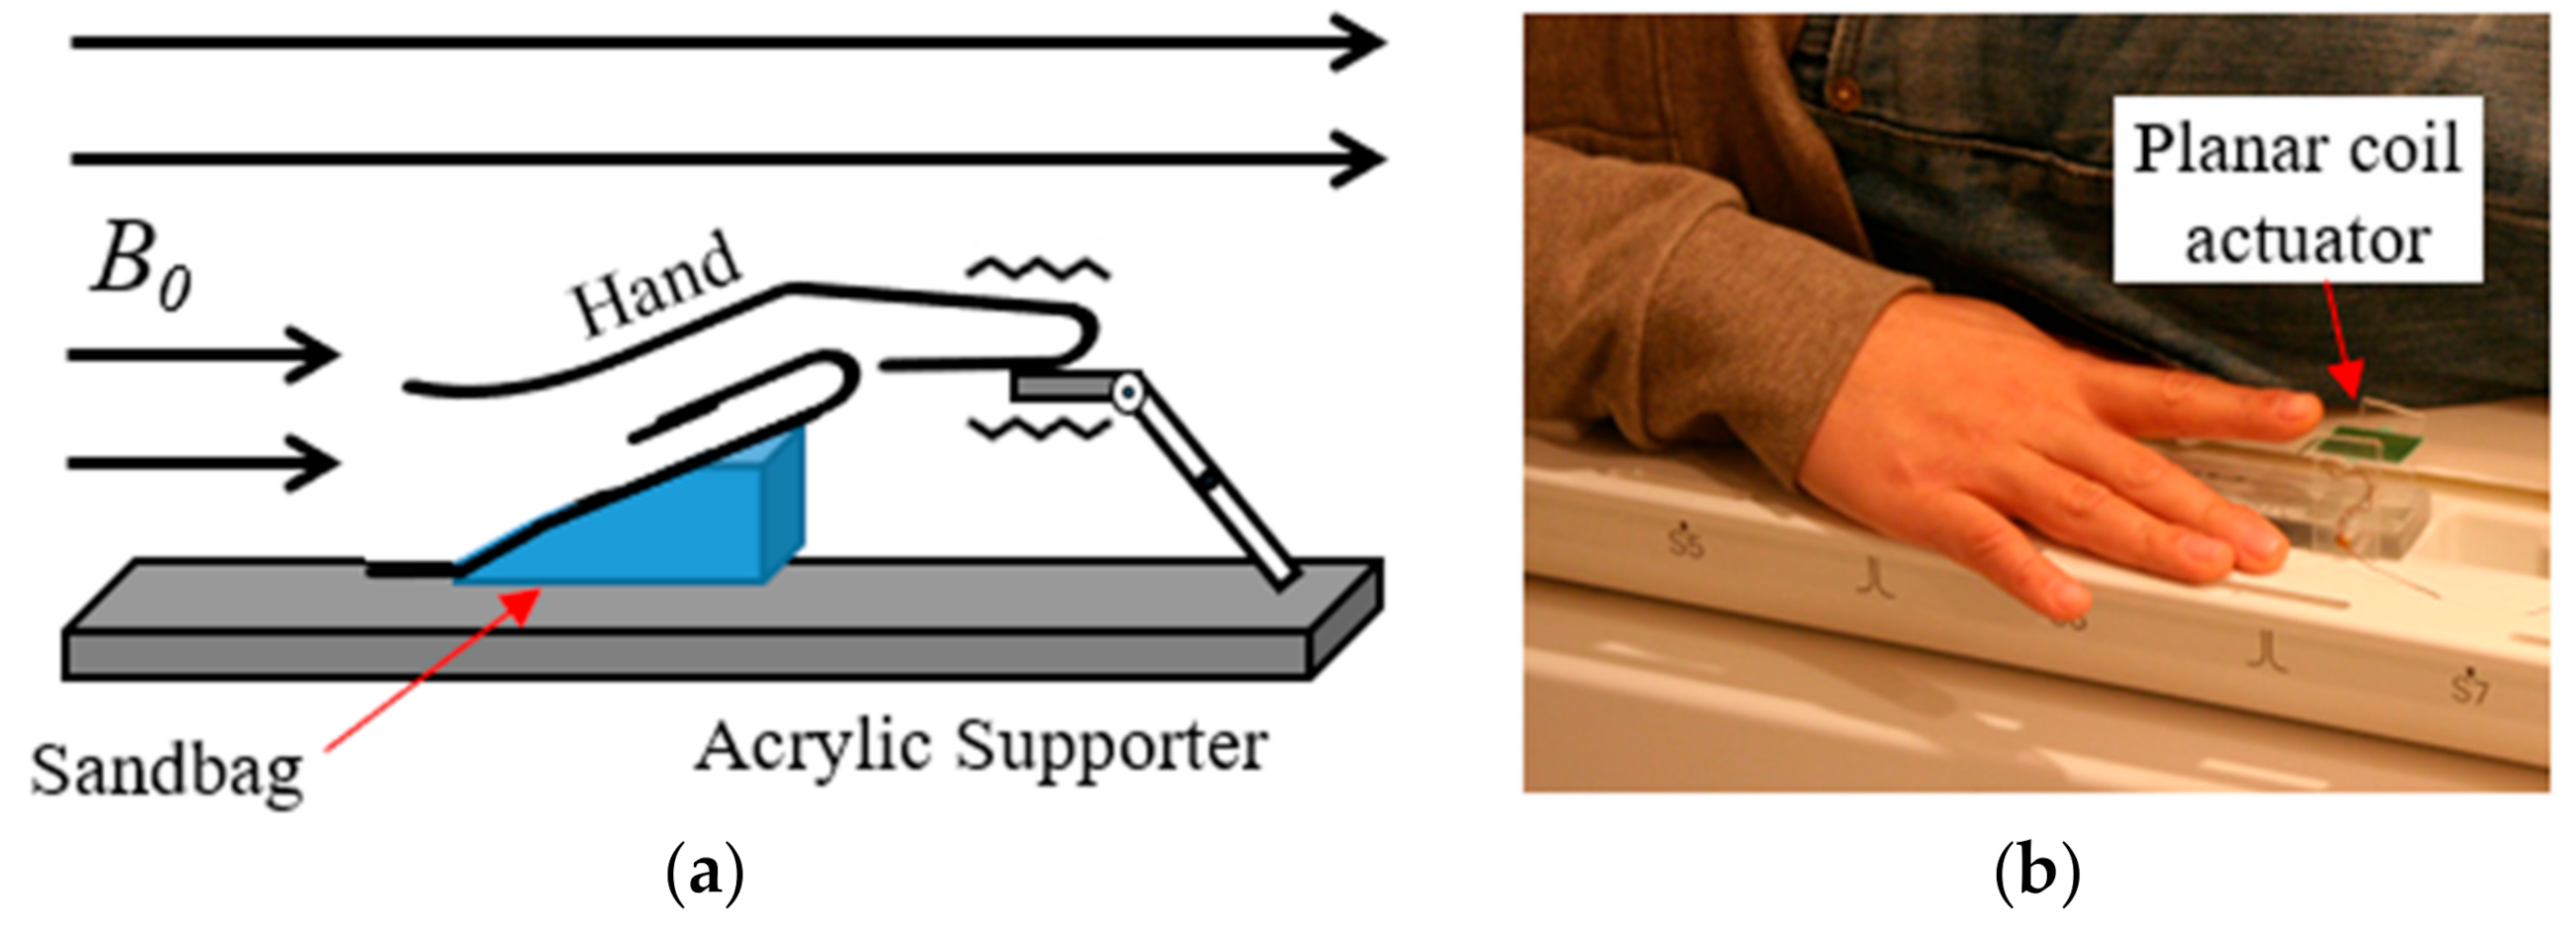
2.2. MR-Compatible Vibrotactile Stimulator
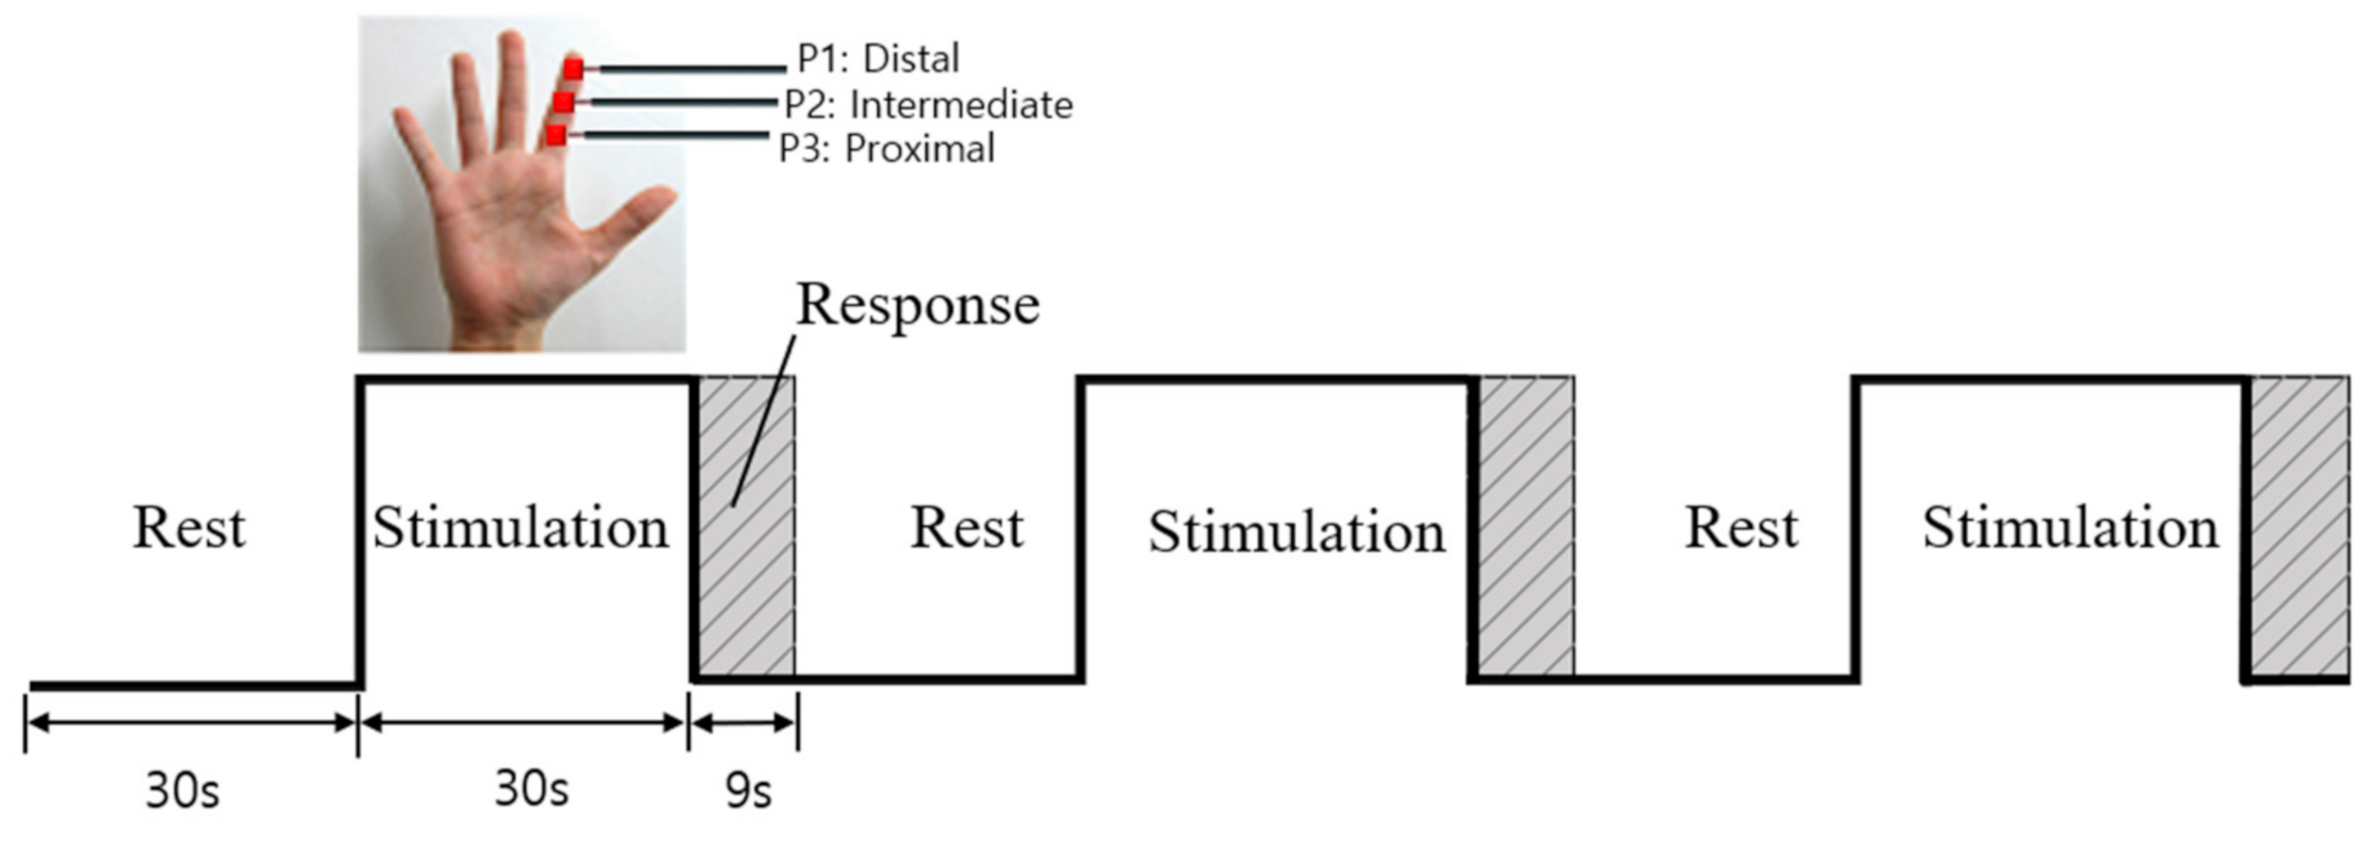
2.3. Experimental Design
2.4. Image Acquisition
2.5. Image Analysis
2.6. Statistical Analysis
3. Results
3.1. Behavioral Data
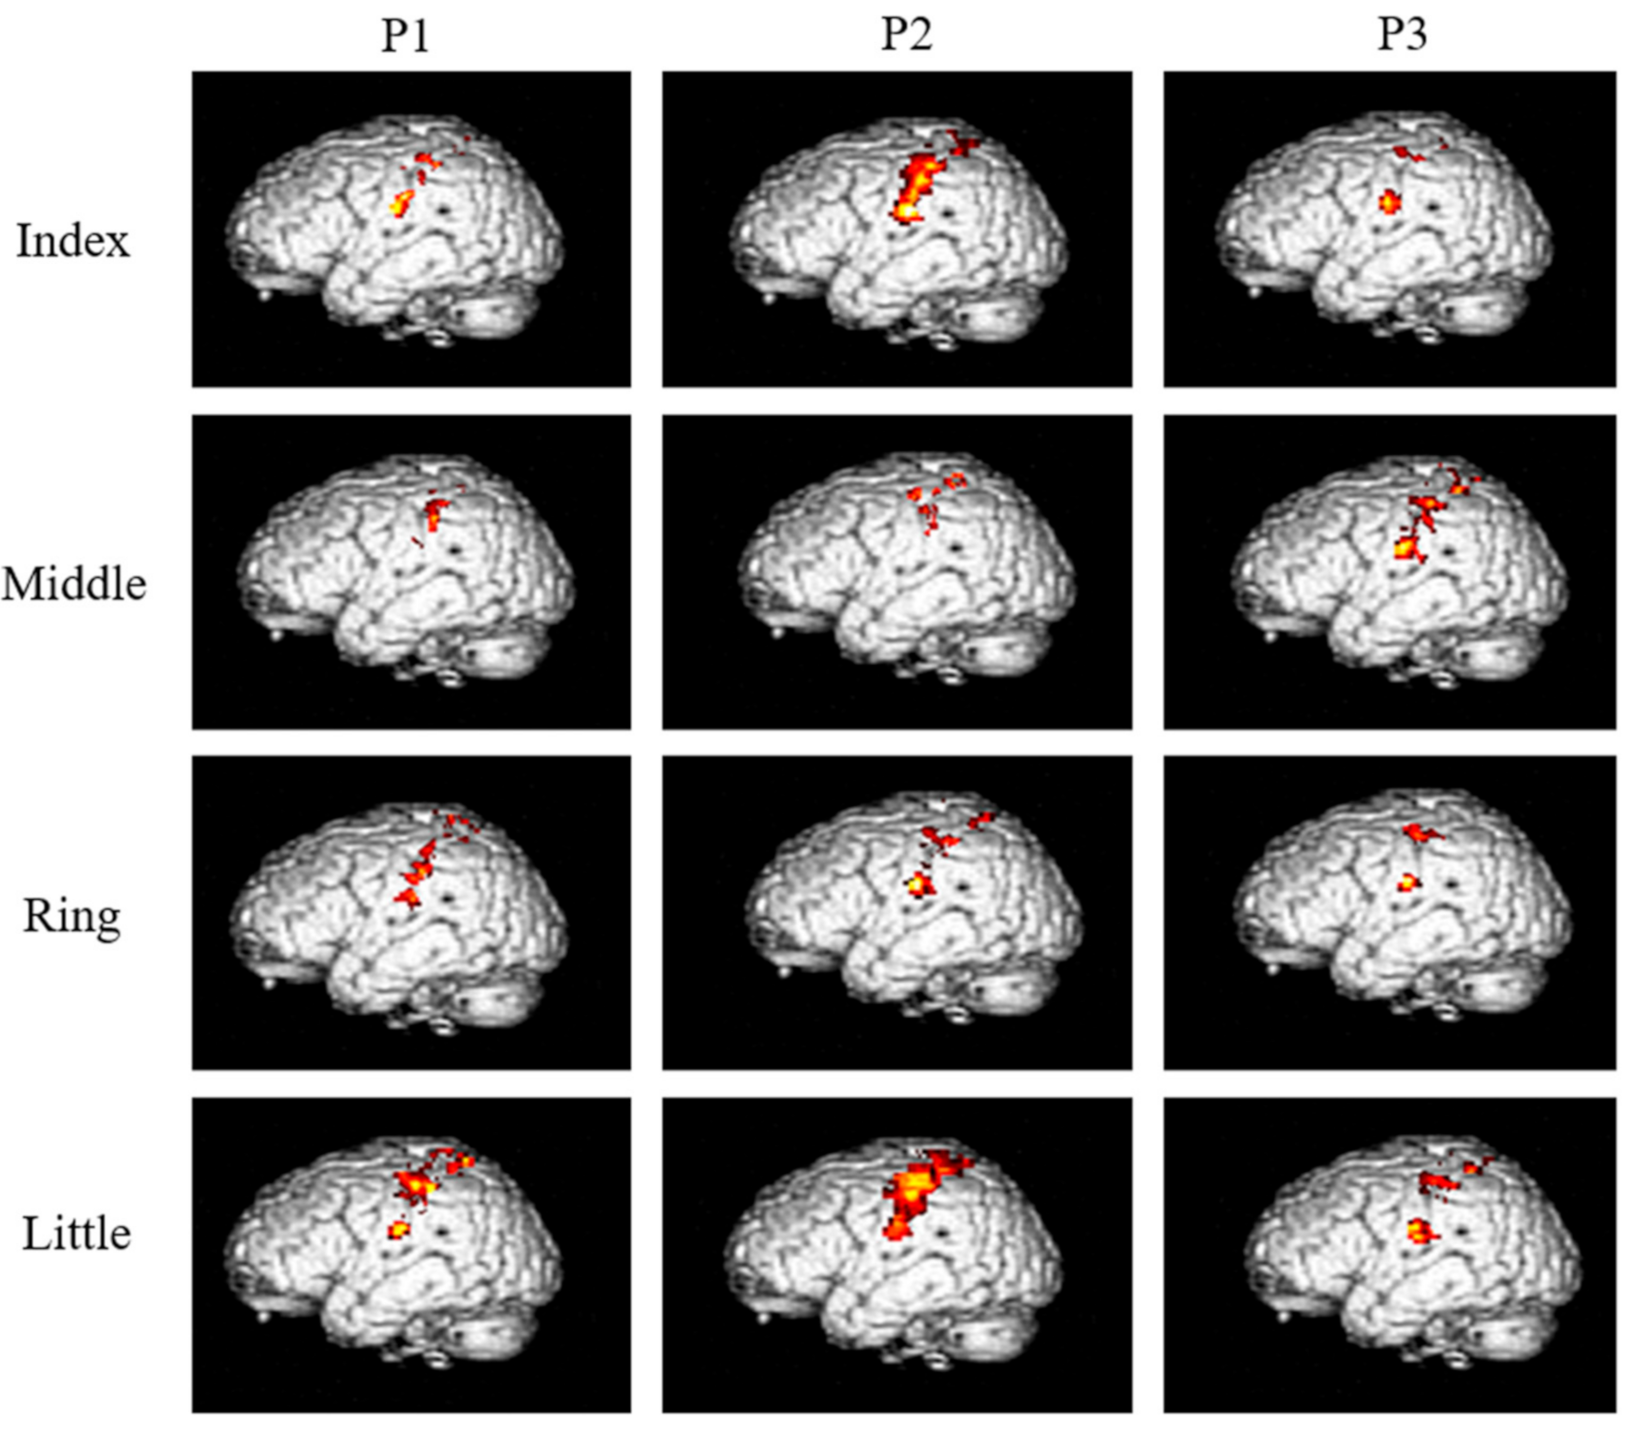
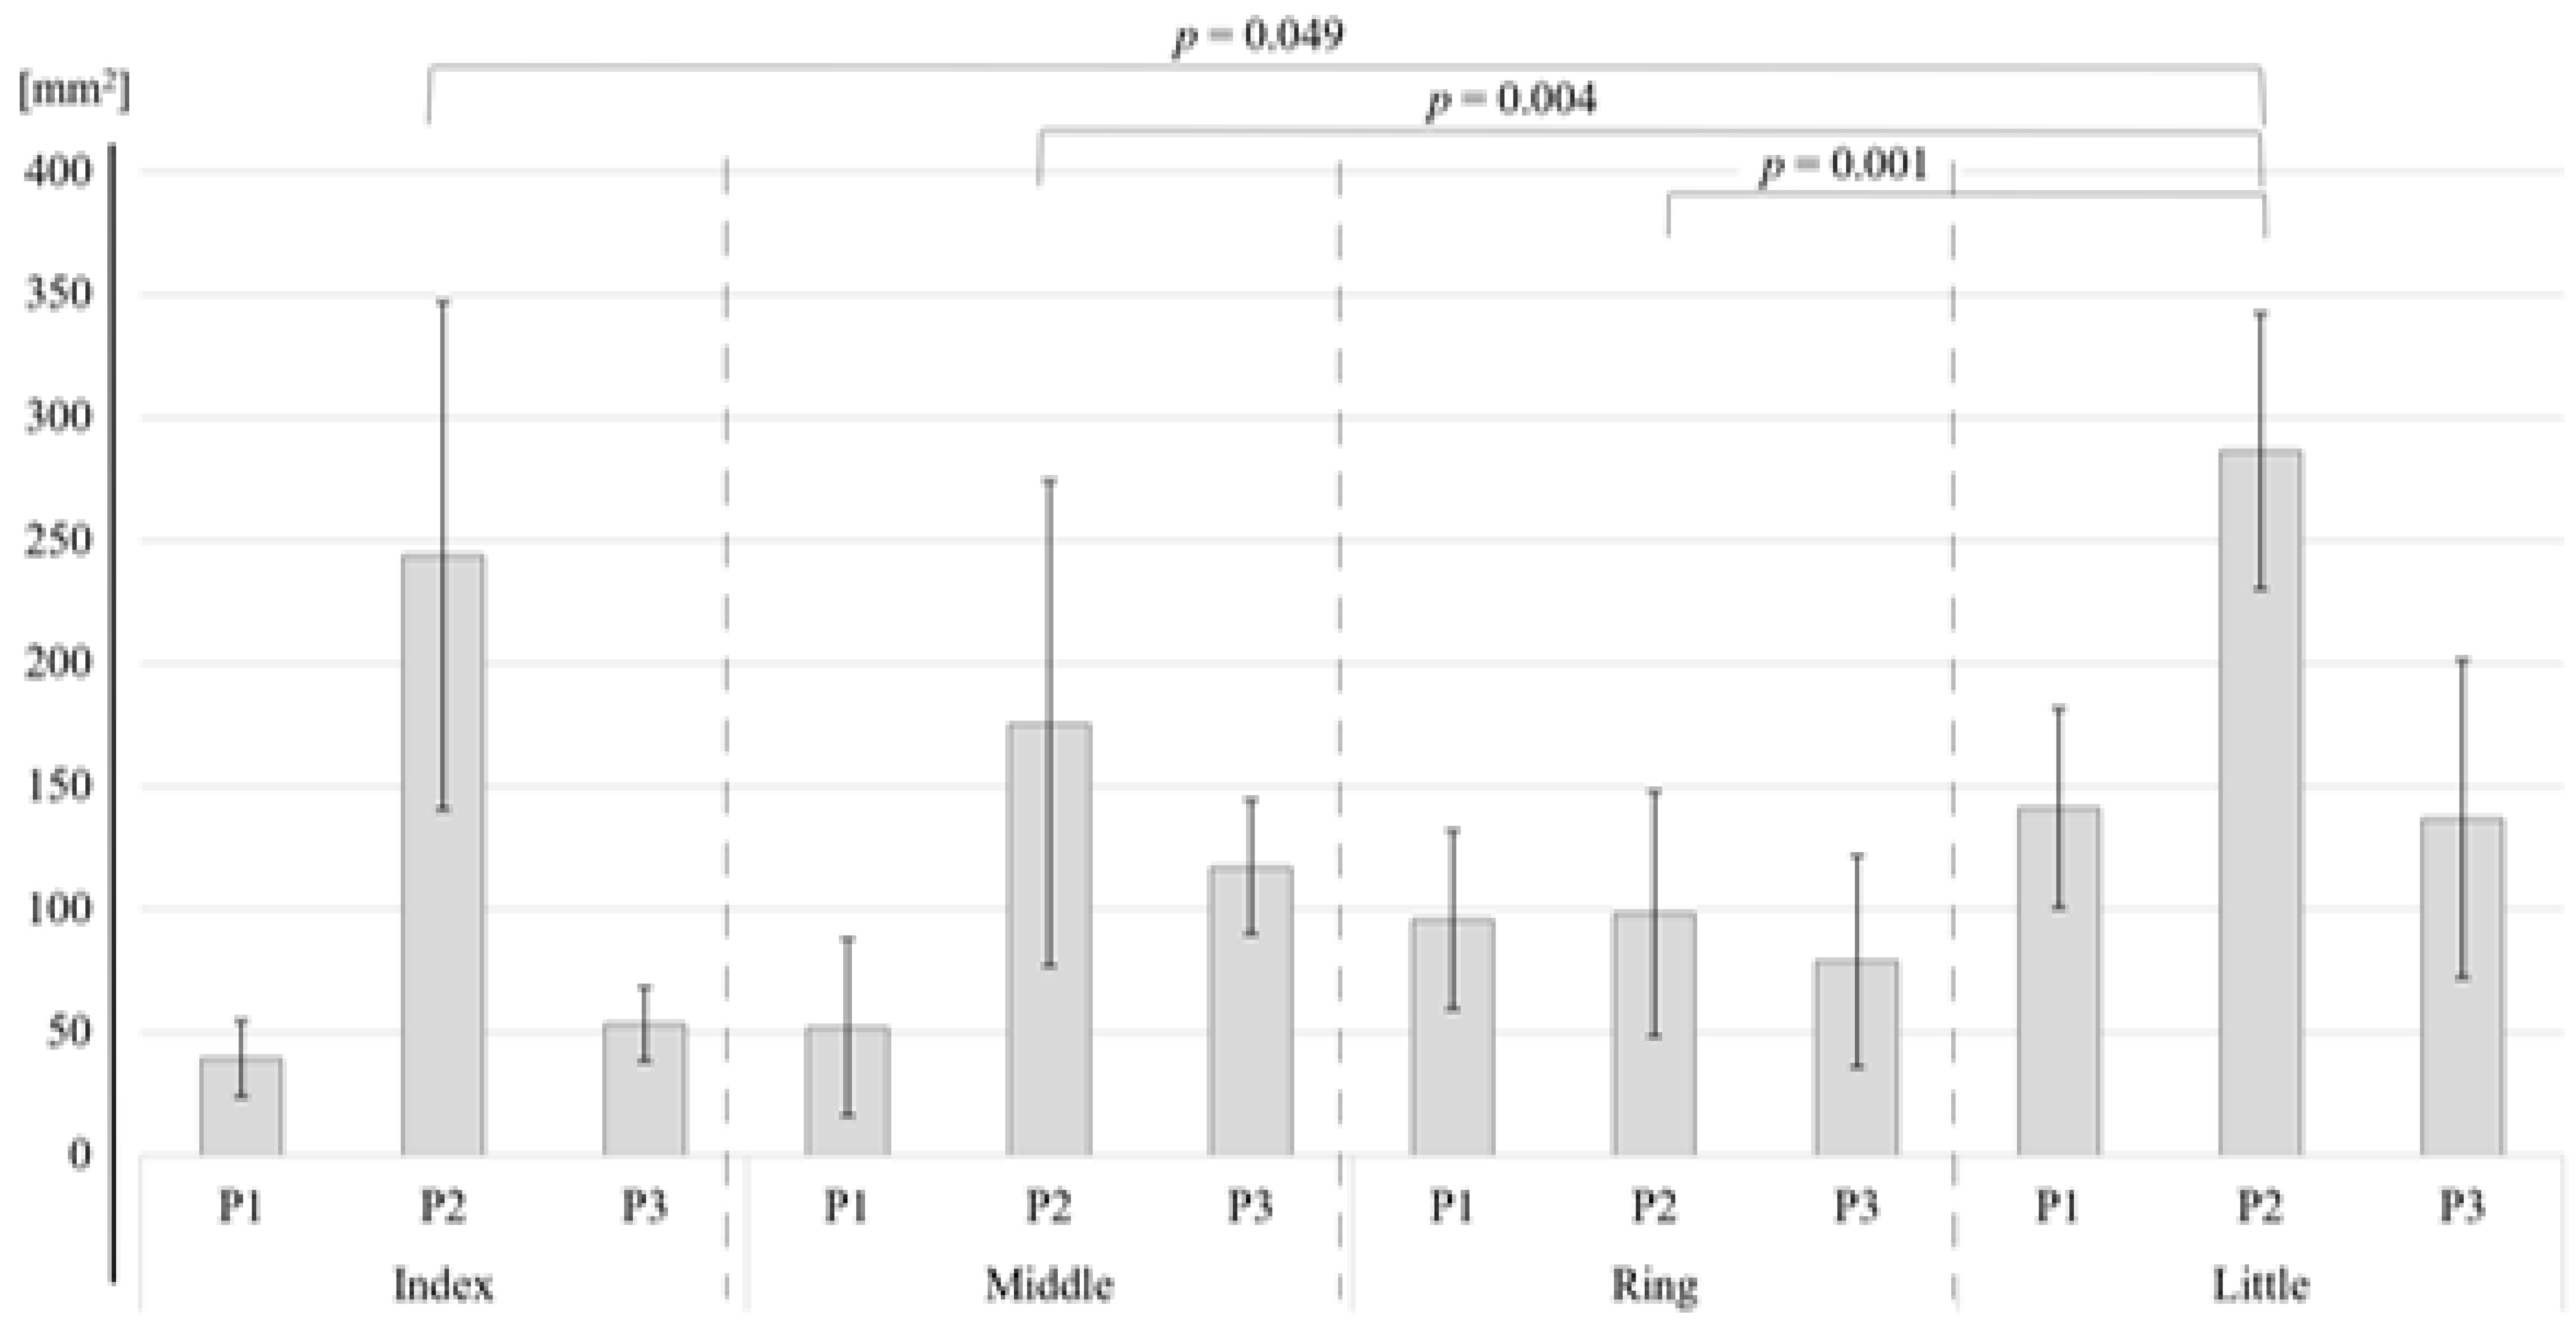
3.2. Activation Area
4. Discussion
5. Conclusions
Author Contributions
Funding
Conflicts of Interest
References
- Gelnar, P.A.; Krauss, B.R.; Szeverenyi, N.M.; Apkarian, A.V. Fingertip Representation in the Human Somatosensory Cortex: An fMRI Study. NeuroImage 1998, 7, 261–283. [Google Scholar] [CrossRef] [PubMed] [Green Version]
- Francis, S.T.; Kelly, E.F.; Bowtell, R.; Dunseath, W.J.R.; Folger, S.E.; McGlone, F. fMRI of the Responses to Vibratory Stimulation of Digit Tips. NeuroImage 2000, 11, 188–202. [Google Scholar] [CrossRef] [PubMed]
- McGlone, F.; Kelly, E.F.; Trulsson, M.; Francis, S.T.; Westling, G.; Bowtell, R. Functional neuroimaging studies of human somatosensory cortex. Behav. Brain Res. 2002, 135, 147–158. [Google Scholar] [CrossRef]
- Graham, S.J.; Staines, W.R.; Nelson, A.; Plewes, D.B.; Mcllroy, W.E. New devices to deliver somatosensory stimuli during functional MRI. Magn. Reason. Med. 2001, 46, 436–442. [Google Scholar] [CrossRef]
- Nelson, A.J.; Staines, W.R.; Graham, S.J.; McIlroy, W.E. Activation in SI and SII; the influence of vibrotactile amplitude during passive and task-relevant stimulation. Cogn. Brain Res. 2004, 19, 174–184. [Google Scholar] [CrossRef]
- Sanchez-Panchuelo, R.M.; Francis, S.; Bowtell, R.; Schluppeck, D. Mapping Human Somatosensory Cortex in Individual Subjects With 7T Functional MRI. J. Neurophysiol. 2010, 103, 2544–2556. [Google Scholar] [CrossRef] [Green Version]
- Schweisfurth, M.A.; Schweizer, R.; Frahm, J. Functional MRI indicates consistent intra-digit topographic maps in the little but not the index finger within the human primary somatosensory cortex. NeuroImage 2011, 56, 2138–2143. [Google Scholar] [CrossRef]
- Vidyasagar, R.; Folger, S.E.; Parkes, L.M. Re-wiring the brain: Increased functional connectivity within primary somatosensory cortex following synchronous co-activation. NeuroImage 2014, 92, 19–26. [Google Scholar] [CrossRef]
- Maldjian, J.A.; Gottschalk, A.; Patel, R.S.; Pincus, D.; Detre, J.A.; Alsop, D.C. Mapping of secondary somatosensory cortex activation induced by vibrational stimulation: An fMRI study. Brain Res. 1999, 824, 291–295. [Google Scholar] [CrossRef]
- Van Westen, D.; Fransson, P.; Olsrud, J.; Rosén, B.; Lundborg, G.; Larsson, E.M. Finger somatotopy in area 3b: An fMRI-study. BMC Neurosci. 2004, 5, 28. [Google Scholar] [CrossRef] [Green Version]
- Schweizer, R.; Voit, D.; Frahm, J. Finger representations in human primary somatosensory cortex as revealed by high-resolution functional MRI of tactile stimulation. NeuroImage 2008, 42, 28–35. [Google Scholar] [CrossRef] [PubMed]
- Nelson, A.J.; Chen, R. Digit Somatotopy within Cortical Areas of the Postcentral Gyrus in Humans. Cereb. Cortex 2008, 18, 2341–2351. [Google Scholar] [CrossRef] [PubMed] [Green Version]
- Breitwieser, C.; Kaiser, V.; Neuper, C.; Müller-Putz, G.R. Stability and distribution of steady-state somatosensory evoked potentials elicited by vibro-tactile stimulation. Med. Biol. Eng. Comput. 2012, 50, 347–357. [Google Scholar] [CrossRef]
- Schweisfurth, M.A.; Frahm, J.; Schweizer, R. Individual fMRI maps of all phalanges and digit base of all fingers in human primary somatosensory cortex. Front. Hum. Neurosci. 2014, 8, 658. [Google Scholar] [CrossRef] [PubMed]
- Hashimoto, I.; Mashiko, T.; Kimura, T.; Imada, T. Are there discrete distal-proximal representations of the index finger and palm in the human somatosensory cortex? A neuromagnetic study. Clin. Neurophysiol. 1999, 110, 430–437. [Google Scholar] [CrossRef]
- Kalberlah, C.; Villringer, A.; Pleger, B. Dynamic causal modeling suggests serial processing of tactile vibratory stimuli in the human somatosensory cortex—An fMRI study. NeuroImage 2013, 74, 164–171. [Google Scholar] [CrossRef] [PubMed]
- Sur, M. Receptive fields of neurons in Areas 3b and 1 of somatosensory cortex in monkeys. Brain Res. 1980, 198, 465–471. [Google Scholar] [CrossRef]
- Gazzola, V.; Spezioc, M.L.; Etzela, J.A.; Castelli, F.; Adolphsd, R.; Keysers, C. Primary somatosensory cortex discriminates affective significance in social touch. Proc. Natl. Acad. Sci. USA 2012, 109, E1657–E1666. [Google Scholar] [CrossRef] [Green Version]
- Oldfield, R.C. The assessment and analysis of handedness: The Edinburgh inventory. Neuropsychologia 1971, 9, 97–113. [Google Scholar] [CrossRef]
- Kim, H.S.; Choi, M.H.; Chung, Y.G.; Kim, S.P.; Jun, J.H.; Park, J.Y.; Yi, J.H.; Park, J.R.; Lim, D.W.; Chung, S.C. Development of a simple MR-compatible vibrotactile stimulator using a planar-coil-type actuator. Behav. Res. Method 2013, 45, 364–371. [Google Scholar] [CrossRef] [Green Version]
- Penny, W.D.; Friston, K.J.; Ashburner, J.T.; Kiebel, S.J.; Nichols, T.E. Statistical Parametric Mapping: The Analysis of Functional Brain Images, 1st ed.; Academic Press: Cambridge, MA, USA, 2006. [Google Scholar]
- Maldjian, J.A.; Laurienti, P.J.; Kraft, R.A.; Burdette, J.H. An automated method for neuroanatomic and cytoarchitectonic atlas-based interrogation of fMRI data sets. NeuroImage 2003, 19, 1233–1239. [Google Scholar] [CrossRef]
- Chung, S.C.; Sohn, J.H.; Lee, B.S.; Tack, G.R.; Yi, J.H.; You, J.H.; Kwon, J.H.; Kim, H.J.; Lee, S.Y. A comparison of the mean signal change method and the voxel count method to evaluate the sensitivity of individual variability in visuospatial performance. Neurosci. Lett. 2007, 418, 138–142. [Google Scholar] [CrossRef]
- Peters, R.M.; Hackeman, E.; Goldreich, D. Diminutive Digits Discern Delicate Details: Fingertip Size and the Sex Difference in Tactile Spatial Acuity. J. Neurosci. 2009, 29, 15756–15761. [Google Scholar] [CrossRef] [PubMed]
- Hlushchuk, Y.; Forss, N.; Hari, R. Distal-to-proximal representation of volar index finger in human area 3b. NeuroImage 2004, 21, 696–700. [Google Scholar] [CrossRef]
- Vallbo, A.B.; Johansson, R.S. The tactile sensory innervation of the glabrous skin of the human hand. In Active Touch: The Mechanism of Recognition of Objects by Manipulation, 1st ed.; Gordon, G., Ed.; Pergamon Press: Oxford, UK, 1978; pp. 29–54. [Google Scholar]
- Vallbo, A.B.; Johansson, R.S. Properties of cutaneous mechanoreceptors in the human hand related to touch sensation. Hum. Neurobiol. 1984, 3, 3–14. [Google Scholar] [PubMed]
- Mountcastle, V.B. Medical Physiology, Sensory Receptors and Neural Encoding: Introduction to Sensory Processes, 1st ed.; The CV Mosby Co.: St. Louis, MO, USA, 1984. [Google Scholar]
- Siedentopf, C.M.; Heubach, K.; Ischebeck, A.; Gallasch, E.; Fend, M.; Mottaghy, F.M.; Koppelstaetter, F.; Haala, I.A.; Krause, B.J.; Felber, S.; et al. Variability of BOLD response evoked by foot vibrotactile stimulation: Influence of vibration amplitude and stimulus waveform. NeuroImage 2008, 41, 504–510. [Google Scholar] [CrossRef] [PubMed]


| P1 | P2 | P3 | Mean ± S.D | ||
|---|---|---|---|---|---|
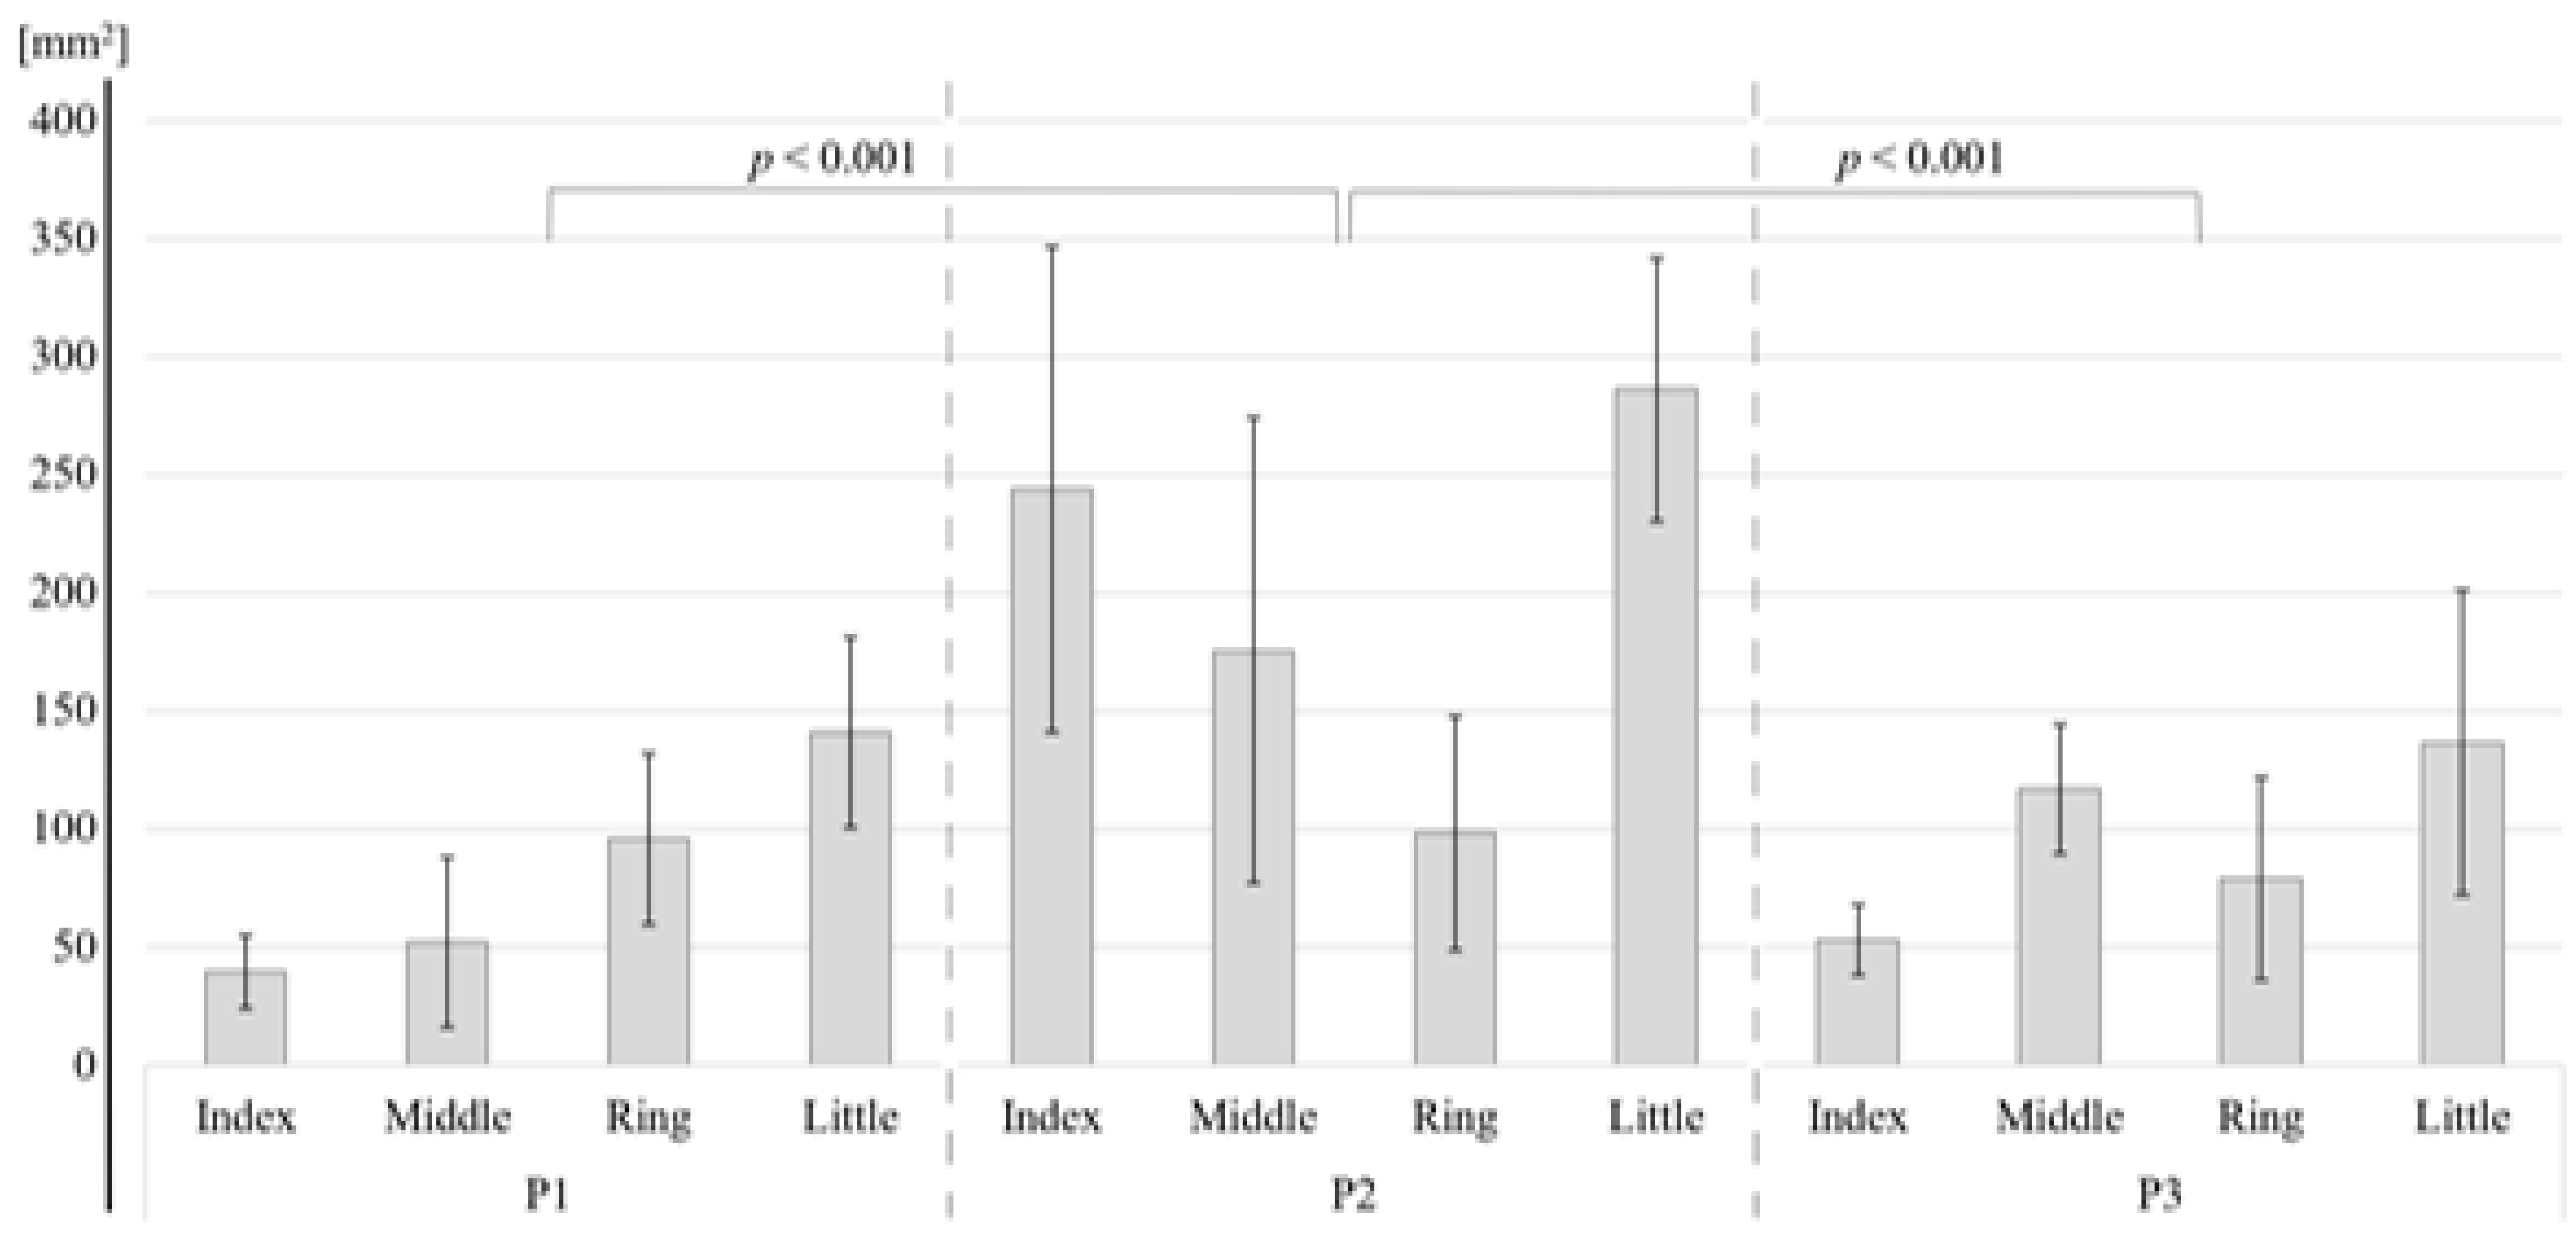
| S1 | Index | 39.50 ± 15.45 | 244.00 ± 103.06 | 53.25 ± 14.97 | 112.25 ± 114.31 |
| Middle | 52.00 ± 35.93 | 175.62 ± 98.71 | 117.25 ± 27.39 | 114.96 ± 61.85 | |
| Ring | 95.87 ± 36.09 | 98.37 ± 49.76 | 79.00 ± 42.97 | 91.08 ± 10.54 | |
| Little | 141.13 ± 40.53 | 286.37 ± 55.73 | 136.75 ± 64.62 | 188.08 ± 85.15 | |
| Mean ± S.D | 82.13 ± 46.17 | 201.09 ± 82.29 | 96.56 ± 37.54 | ||
| BA3 | Index | 32.13 ± 16.15 | 71.37 ± 77.36 | 47.63 ± 31.65 | 50.38 ± 19.77 |
| Middle | 50.75 ± 42.73 | 53.75 ± 50.06 | 35.75 ± 20.06 | 46.75 ± 9.64 | |
| Ring | 61.63 ± 70.43 | 78.88 ± 65.68 | 76.63 ± 68.26 | 72.38 ± 9.38 | |
| Little | 67.88 ± 51.20 | 128.88 ± 134.80 | 80.75 ± 73.57 | 91.83 ± 31.02 | |
| Mean ± S.D | 53.09 ± 15.67 | 82.72 ± 31.26 | 60.19 ± 21.97 |
| Source | Type III Sum of Squares | Df | Mean Square | F | p | |
|---|---|---|---|---|---|---|
| S1 | Finger | 129,194.031 | 2.109 | 61,272.073 | 13.096 | <0.001 |
| Phalanx | 269,747.063 | 1.611 | 167,458.047 | 73.727 | <0.001 | |
| Finger × Phalanx | 118,290.188 | 2.638 | 44,844.617 | 6.581 | 0.004 | |
| BA3 | Finger | 31,702.250 | 1.912 | 16,577.621 | 2.731 | 0.103 |
| Phalanx | 15,313.271 | 1.646 | 9302.547 | 1.312 | 0.299 | |
| Finger × Phalanx | 9232.813 | 2.688 | 3434.840 | 0.668 | 0.566 |
© 2020 by the authors. Licensee MDPI, Basel, Switzerland. This article is an open access article distributed under the terms and conditions of the Creative Commons Attribution (CC BY) license (http://creativecommons.org/licenses/by/4.0/).
Share and Cite
Kim, H.-S.; Jo, J.-H.; Lee, J.-H.; Jung, J.-J.; Kim, K.-H.; An, J.-S.; Kim, Y.-J.; Choi, M.-H.; Chung, S.-C. Comparison of Neural Activation Area in Primary Somatosensory Cortex and Brodmann Area 3 According to Finger and Phalange High-Frequency Vibration Stimulation. Appl. Sci. 2020, 10, 6142. https://0-doi-org.brum.beds.ac.uk/10.3390/app10176142
Kim H-S, Jo J-H, Lee J-H, Jung J-J, Kim K-H, An J-S, Kim Y-J, Choi M-H, Chung S-C. Comparison of Neural Activation Area in Primary Somatosensory Cortex and Brodmann Area 3 According to Finger and Phalange High-Frequency Vibration Stimulation. Applied Sciences. 2020; 10(17):6142. https://0-doi-org.brum.beds.ac.uk/10.3390/app10176142
Chicago/Turabian StyleKim, Hyung-Sik, Ji-Hun Jo, Je-Hyeop Lee, Jin-Ju Jung, Ki-Han Kim, Jin-Su An, Ye-Jin Kim, Mi-Hyun Choi, and Soon-Cheol Chung. 2020. "Comparison of Neural Activation Area in Primary Somatosensory Cortex and Brodmann Area 3 According to Finger and Phalange High-Frequency Vibration Stimulation" Applied Sciences 10, no. 17: 6142. https://0-doi-org.brum.beds.ac.uk/10.3390/app10176142