Article

Effect of Fly Ash as Cement Replacement on Chloride Diffusion, Chloride Binding Capacity, and Micro-Properties of Concrete in a Water Soaking Environment

Guangdong Provincial Key Laboratory of Durability for Marine Civil Engineering, Shenzhen University, Shenzhen 518060, China
*
Author to whom correspondence should be addressed.
Submission received: 16 August 2020 / Revised: 30 August 2020 / Accepted: 7 September 2020 / Published: 9 September 2020
(This article belongs to the Special Issue High-Performance Eco-Efficient Concrete)

Abstract

:

Featured Application

The study on the diffusion, bonding and micro-properties of chloride penetration in concrete in a water soaking environment can provide fundamental information to evaluate the durability of the marine concrete.

Abstract

This paper experimentally studies the effects of fly ash on the diffusion, bonding, and micro-properties of chloride penetration in concrete in a water soaking environment based on the natural diffusion law. Different fly ash replacement ratio of cement in normal concrete was investigated. The effect of fly ash on chloride transportation, diffusion, coefficient, free chloride content, and binding chloride content were quantified, and the concrete porosity and microstructure were also reported through mercury intrusion perimetry and scanning electron microscopy, respectively. It was concluded from the test results that fly ash particles and hydration products (filling and pozzolanic effects) led to the densification of microstructures in concrete. The addition of fly ash greatly reduced the deposition of chloride ions. The chloride ion diffusion coefficient considerably decreased with increasing fly ash replacement, and fly ash benefits the binding of chloride in concrete. Additionally, a new equation is proposed to predict chloride binding capacity based on the test results.

1. Introduction

Since Portland cement was invented in 1824, cement has become the most important and irreplaceable building material in infrastructure construction. However, problems associated with cement are becoming increasingly prominent. For example, cement production consumes a great amount of energy and released a great deal of toxic pollutants, such as dust, soot, sulfur dioxide, and carbon dioxide, into the environment [1,2]. The production of Portland cement causes about 7% of the world’s carbon dioxide emissions, which is essential to be reduced. Using supplement materials in concrete (e.g., fly ash, and slag) is effective in reducing the amount of cement consumption without sacrificing any properties [3]. Fly ash is the main coal combustion by-product from power plants [4,5,6]. It has become the fifth largest raw material resource in the world and has been used for more than 50 years in concrete [7,8]. Replacing part of the cement admixture in concrete can save cement clinker, thus reducing the environmental pollution from cement production [9,10]. It has been reported that, per ton, replacing Portland cement by fly ash can reduce one ton of carbon dioxide emissions [11]. In addition, fly ash can obviously enhance the workability of fresh concrete, reduce hydration heat in the early stages, improve corrosion resistance [9,10,12,13,14], and improve concrete’s durability performance [15,16,17,18,19].
It is generally believed that chloride ion penetration in concrete is one of the most critical causes of steel reinforcement corrosion that may further cause structural failure [20,21,22]. Chloride ions are present in many environments, including marine, road de-icing salt, salinized soil, and industrial wastewater environments. Chloride ions penetrate through pores into concrete and accumulate around steel reinforcements, which destroys the passive film on the steel surface and activates steel reinforcement corrosion [23,24,25]. For existing reinforced concrete structures, the penetration process of chloride ions is an important parameter in durability life assessment [26]. Liu et al. [24] examined the microstructures of fly ash concrete and normal concrete in a chloride atmosphere environment; the fly ash content was discovered to be sensitive to the chloride binding capacity and diffusion coefficient. Wu et al. [27] found that chloride transportation was affected by drying–wetting cycles and compressive stress ratios—the former significantly increased the chloride ion content, and the latter decreased the chloride ion content. Mehta and Monteriropj [28] pointed out that a pore size of <100 nm has little or no effect on concrete strength and permeability, while a pore size of >100 nm negatively affects concrete strength and permeability. The permeability of fly ash concrete seems physically different from that of normal concrete. Unlike that in salt-spray environments, concrete in seawater environments has different chloride ion concentrations, in which migration speed of chloride ion varies considerably. The chloride ion distributions in concrete are quite different, which is related to the way that chloride ions penetrate concrete. In fact, chloride ion penetration is a complex process involving extensive transportation mechanisms, such as diffusion under a concentration difference [27], penetration under water pressure [29], and capillary action under a humidity gradient [30]. In a soaking environment, when the concrete is saturated, chloride ions are mainly transferred through diffusion to the concrete. Meanwhile, in a salt-spray environment, the migration of chloride ions is achieved mainly by capillary suction and the diffusion effect. Therefore, the chloride profile of concrete can be quite different in different environments, which may cause different corrosion mechanisms of reinforcement in concrete. Thus, the knowledge of such durability behavior of fly ash concrete remains unclear, even though it is essential for promoting durable material design in construction under water. Due to filling and pozzolanic effects [31,32,33], adopting fly ash to partly replace cement can increase chloride ion resistance and lead to the better durability of concrete [34,35,36]. Moreover, there are very few references on the distribution of chloride ions in concrete soaked with seawater, thus indicating the demand for a comprehensive study that covers not only the micro-properties and transportation mechanism but also the chloride binding capacity of fly ash concrete.
The current investigation aimed to systematically examine the effect of fly ash on chloride ion diffusion in concrete in a water soaking environment. Specifically, the effect was quantified by the chloride ion diffusion coefficient and chloride ion deposit amounts at different layers. The study also compared the amount of free and binding chloride ions, as well as binding resistances, under different dosages of fly ash replacement. Through a mercury intrusion method and SEM, the study explored the effects of fly ash on the pore structure and cement hydration products.

2. Experimental Investigation

2.1. Materials

ASTM (American Society for Testing and Materials) type I Portland cement, Class F fly ash, river sand (fineness: 2.3–3.0), and a coarse aggregate (size: 5–20 mm in diameter) were used for concrete preparation. Industrial chloride salt (purity: 99%) was adopted to simulate the NaCl solution. Table 1 lists the proportions of three mixtures of normal concrete with fly ash replacements of 0%, 15%, and 30% (by weight). Table 2 lists the chemical compositions of the cement and fly ash.

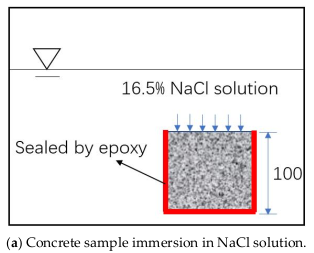
2.2. Immersion Test Methodology

To simulate the concrete deterioration process in a seawater soaking environment, immersion tests of concrete samples were conducted based on NT (NORDTEST) Build 443 [37]. Three standard concrete cylinders were cast for each concrete mix and demolded 48 hours later. After standard curing under the environment with a constant temperature of 20 ± 3 °C and a relative humidity of >95% for 90 days, these specimens were first saturated with a Ca(OH)2 solution, ensuring that the weight change of all samples was less than 0.1%. After that, the samples were exposed to a saturated-surface-dry state environment under ambient temperature before the top surface was selected as the exposed surface, while the remaining surfaces were sealed with an epoxy material to guarantee the unidirectional diffusion of the chloride ions during the test. Then, the samples were soaked in an NaCl solution with a 16.5% concentration at a temperature of 23 ± 2 °C for 35 days. Figure 1a shows the concrete samples immersed in the NaCl solution.

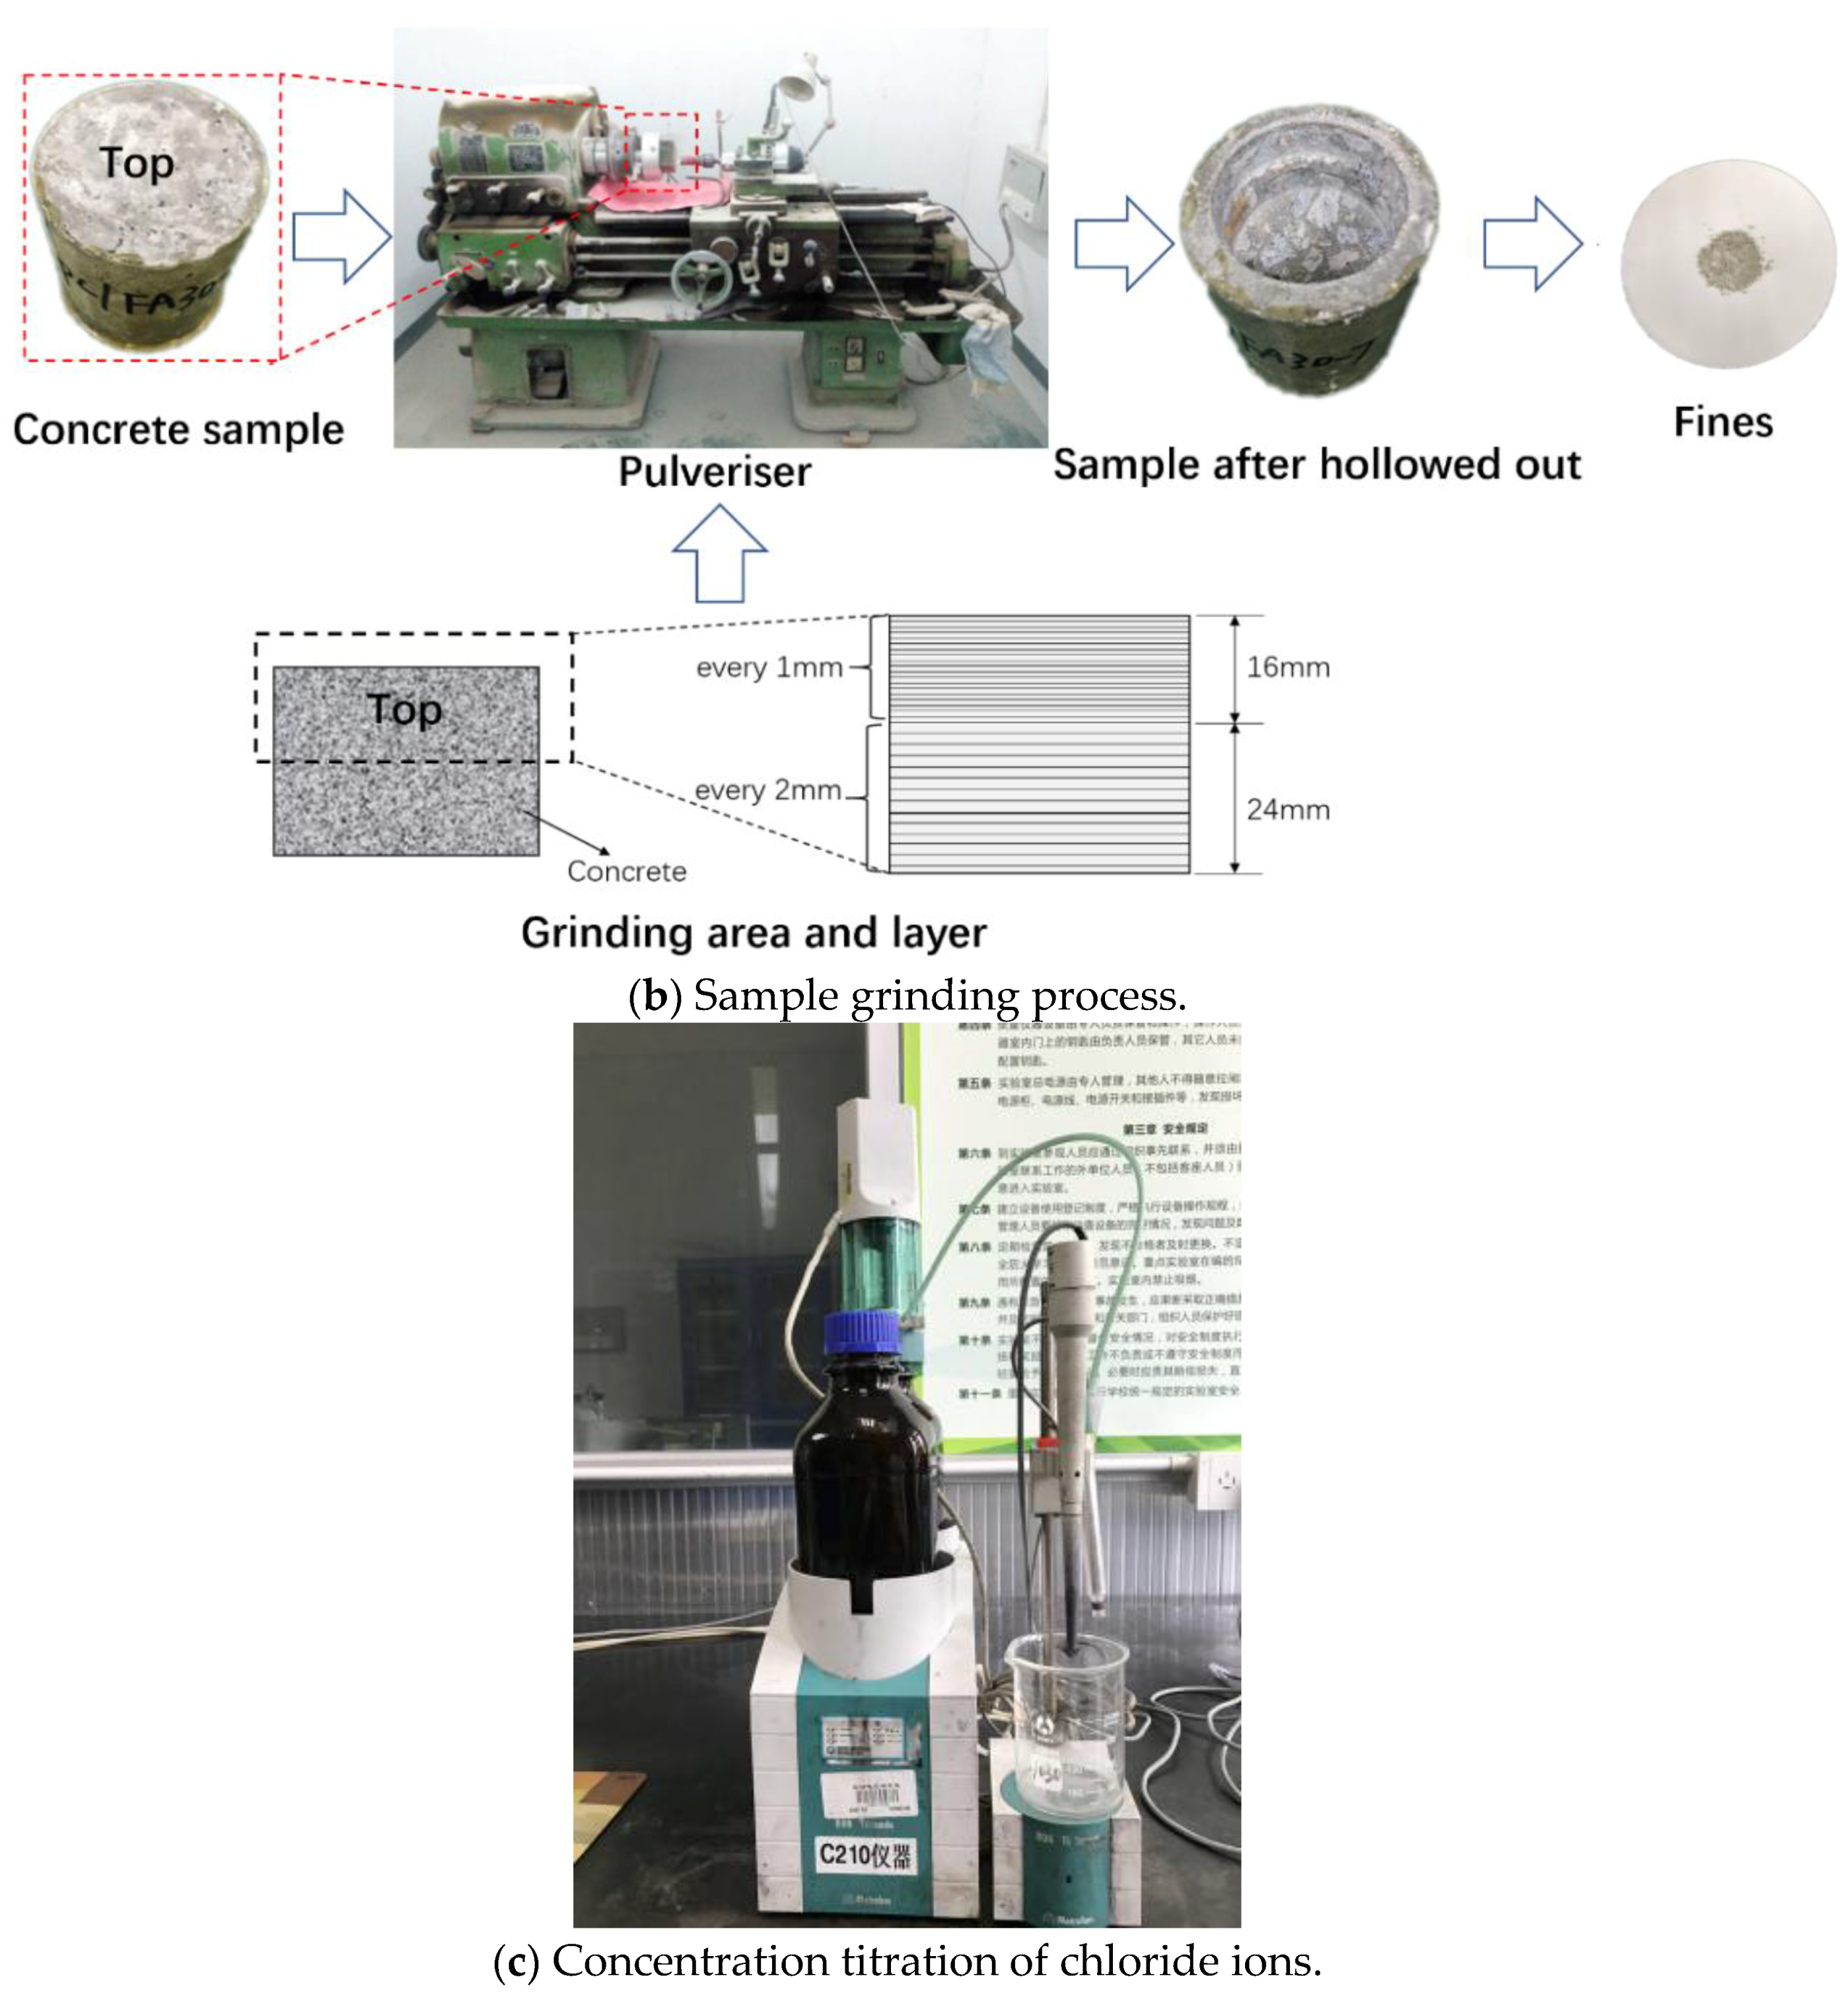
2.3. Measurement of Chloride Content

After the immersion process, the crystal salt on the concrete surface was removed. Then, the samples were grinded by a specially-designed pulveriser into powder from the exposed surface, layer by layer. From the height of 0–16 mm, the grinding thickness was 1 mm, while from the height of 16–40 mm, the grinding thickness was 2 mm, as shown in Figure 1b. The powder samples were then placed in an oven at up to 105 °C to dry to a constant weight. The determination of the free and total chloride ion contents was based on AASHTO T260 (2009) [38], while the concentration of chloride ions was determined by the automatic potentiometric titrator as shown in Figure 1c.

2.4. Microstructural Characterization

The study adopted mercury intrusion porosimetry to evaluate the porosity and pore size distribution characteristics of concrete [39,40]. For each mix, three sample tests were conducted, and the average results were used for analysis. The concrete samples were crushed into small sizes and dried by a solvent replacement method, changing the solvent every 6 hours for the first few days and then every day for one week. After that, the samples were vacuum-dried and subjected to mercury intrusion up to 210 MPa. The contact angle between mercury and concrete was set to 130°. Assuming that the shape of the porous material was cylinder, the applied pressure p (in mN/m2) was converted to the pore diameter D (in m) by the Washburn equation [41]:
D = ( 4 σ cos θ ) / p ,
where σ is the mercury surface tension force in mN/m and θ is the contact angle between mercury and the capillary surface.
Microstructural studies of the concrete sample after exposure to seawater immersion were performed using SEM. The concrete samples were taken from the cylinder surface with a diameter of <25 mm and a thinness of <20 mm. The specimens were washed and dried to a constant weight in an oven under 105 °C. The specimens were then coated with a gold-plated film due to the poor electric conductive performance of concrete. Ultra-high resolution SEM was adopted to identify the hydration products, observe the fly ash, and evaluate the pore structures.

3. Results and Discussion

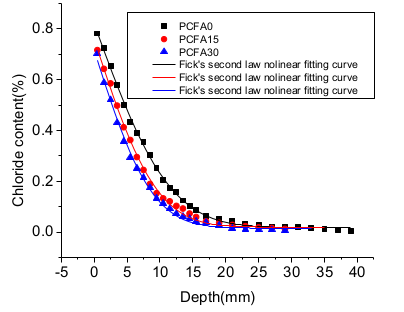
3.1. Effect of Fly Ash on Chloride Transportation

The free and total chloride contents were determined in accordance with the AASHTO T260 standard [38]. The former was obtained based on the water-soluble extraction method, while the latter was obtained by acid-soluble extraction in a nitric acid solution. After extraction, the chloride content was measured with an automatic potentiometer titrator. Figure 2 shows that the concentration of free chloride content from each concrete layer reduced significantly as the fly ash replacement ratio increased. Two individual zones of chloride deposition, namely the descending (0–15 mm) and flat zones (15–40 mm), were observed. The curve descended significantly at the 0.0–7.5 mm zone, in which the chloride concentration of plain concrete with 0% fly ash (PCFA0) reduced by 0.426% with a reduction percentage of 54.5%. For PCFA15 and PCFA30, the related reductions were 0.4722% and 0.4876% with reduction percentages of 65.9% and 69.4%, respectively. It was found that concrete with fly ash had a lower chloride content, which indicated a larger reduction percentage compared to the normal concrete without fly ash. For the zone of 17–27 mm, the reduction of chloride concentration was negligible for all samples since the chloride ion concentration became lower as concrete depth increased.
Figure 2 shows that the chloride ion distribution curves in the soaking environment satisfied Fick’s second law, while Figure 3 shows that the curves in the salt-spray environment did not follow Fick’s second law. In the salt-spray environment, there was a rising branch called the convection zone for the chloride ion on the concrete surface. Beyond this convection zone, the chloride ion concentration decreased. Chloride ion distribution in concrete depends on the way chloride ions penetrate into the concrete. In fact, chloride ion penetration is a complex process including extensive transportation mechanisms, such as diffusion under a concentration difference [27], penetration under water pressure [29], and capillary action under a humidity gradient [30]. In a soaking environment, when concrete is saturated, chloride ions are transferred mainly through diffusion to the concrete. Meanwhile, in a salt-spray environment, the migration of chloride ions is mainly attributed to capillary suction and the diffusion effect. Chloride aerosols deposited on the surface of concrete are absorbed through capillary suction. Then, the free chloride ions are diffused into the concrete due to a concentration difference. When the water evaporates from the concrete pore, the chloride ions left in pores gather to a peak amount through a series of drying and wetting cycles. This results in the convection of the chloride ion migration under the salt-spray environment, which can be seem in Figure 2 [24]. According to the results of chloride penetration in the soaking and salt-spray environments in our experiments, the distribution of chloride ions on the concrete surface varied, but the trend approached consistency as the concrete depth increased.
The deposition of chloride ions gradually approached zero at concrete depths over 15 mm. This was mainly due to the maximum exposure day (35 days), and this transition depth could be increased if the number of exposure days increases. In addition, the ingress depth also depended on the specific concrete mix used (water to cement ratio: W/C). The curve in the descending zone in Figure 2 indicates that the free chloride deposition of the samples with 15% and 30% fly ash replacement considerably decreased compared to that of the normal PCFA0 concrete. This is because fly ash has three main effects on concrete, namely the pozzolanic, morphological, and microaggregate filling effects. The pozzolanic effect is triggered by Ca(OH)2 formed from Portland cement hydration. However, the pozzolanic reaction at the beginning of cement hydration is very slow because of the presence of less Ca(OH)2. With the increase of curing age, the secondary hydration reaction between the activated ingredients, such as SiO2 and Al2O3, in fly ash, and Ca(OH)2 produces C–S–H gel, calcium aluminate hydrate products, and so on. These products may absorb more free chloride ions, reducing the deposition of chloride ions in concrete. This also indicates that chloride binding capacity is improved with the addition of fly ash. These hydrates can fill large size pores in cement matrixes and thus reduce porosity, narrow pore diameter, and block the connectivity of the pores, all of which subsequently slow the diffusion and migration of chloride ions. In addition, 70% of fly ash particles are inert, compact hollow microsphere (cenospheres) with smooth surfaces [31,32], which are like activated nanomaterials that improve the microstructures of concrete. Consequently, a concrete with fly ash replacement has a much lower chloride deposition than normal concrete.

3.2. Influence of Diffusion Coefficient

It was found that the chloride deposition curve in Figure 2 generally followed Fick’s second law (Equation (2)) [42,43]. Based on the data in Figure 2, Figure 4 plots the regression curves of the chloride coefficient using the Origin software. The chloride ion diffusion coefficient D and surface concentration of chloride C for each group can be determined by Equation (2), as shown in Table 3.
C ( x , t ) = C 0 + ( C s C 0 ) [ 1 e r f ( x 2 D t ) ] ,
where C(x,t) is the chloride percentage in concrete depth x at exposure time t (%), Cs is the chloride percentage at the concrete surface (%), C0 is the initial percentage of chloride in concrete, and e r f ( z ) is the error function, e r f ( z ) = 2 Π 0 z exp ( z 2 ) d z .
Figure 4 shows the regression curves of the chloride diffusion coefficient for PCFA0, PCFA15, and PCFA30 using Fick’s second law. The chloride diffusion coefficient significantly decreased with the 15% and 30% replacements of cement by mass, with reduction ratios of about 26.1% and 37.9%, respectively, compared to normal concrete. The related coefficient reductions were 3.1984 × 10⁻¹² and 4.6441 × 10⁻¹² m2/s. This indicated that the chloride diffusion coefficient reduced more as the fly ash dosage rose. However, the reduction rate was slower as more fly ash was added. This was clear from the fact that the chloride diffusion coefficient of the PCFA30 sample was not proportionally reduced, which was less than half of that (1.4457 × 10⁻¹² m2/s) for the PCFA15 sample. Two main reasons for the reduction of the chloride diffusion coefficient were the (1) pozzolanic effect formed tobermorite and calcium aluminate hydrate product [44], which could have increased the chloride binding resistance, and (2) Al2O3 in the fly ash was the essential ingredient to generate Friedel’s salt. The chloride ions in concrete are mainly in the form of Friedel’s salt. Al2O3 reacts with Ca(OH)2 and may lower the C/A (calcium/aluminum) product and accelerate AFM (monosulphate) to form Friedel’s salt, as explained in Equation (3). This process physically and chemically benefits the chloride binding capacity. Nevertheless, differentiating between the chemical and physical absorption process with the chosen test setup was difficult in this study since chloride penetration have extensive transport mechanisms in concrete. Consequently, the decrease of free chloride content leads to reduce the chloride diffusion coefficient [45]. However, differentiating between the chemical and physical adsorption process needs further study.

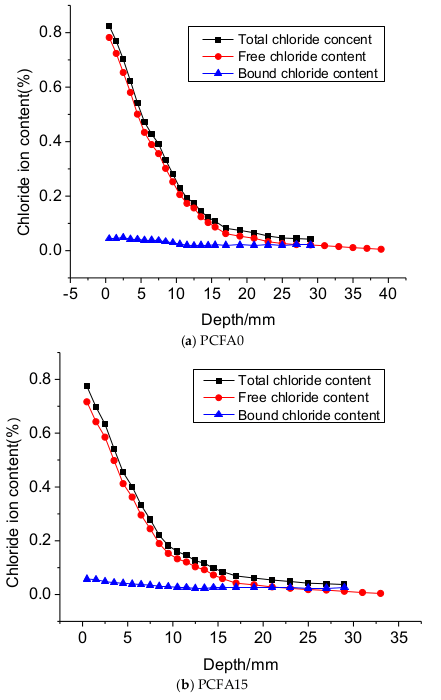
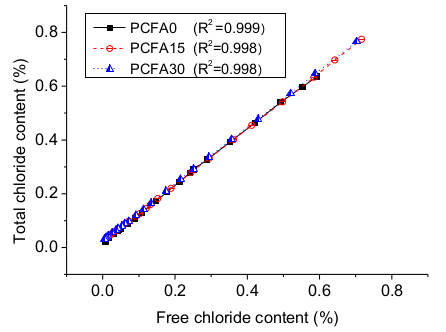
3.3. Influence of Free and Binding Chlorides

Binding chloride is the solidifying process of chloride ions by cement-based materials. The binding chloride in the cement composite could not transport in water in concrete. Binding chloride can be divided into two types: chemical bound and physical absorption. Chemical bound results from the reaction of chloride and cement, while physical absorption depends on the electrostatic interactions (or van der Waals forces) [46,47] between ions. Equation (3) shows that chemical bound chloride ions follow the formation of Friedel’s salt [48]:
C3A + CaCl2 + 10H2O → C3A·CaCl2·10H2O,
C3A·CaCl2·10H2O reduces the porosity of concrete, thus increasing the resistance of chloride penetration and reducing the chloride ion binding capacity. According to Table 2, the contents of Al2O3 in the fly ash and cement were 23.95% and 4.62%, respectively. Since Al2O3 is a raw material for salt formation, adding fly ash into the concrete increased Friedel’s salt formation, which further improved the chloride binding capacity.
Figure 5 shows the distribution of total chloride, free chloride, and bound chloride of the concrete samples. The bound chloride amount was much lower than the total and free chloride amounts. Figure 6 shows the relationship between bound chloride and concrete depth, in which the bound chloride amount decreased as concrete depth increased, but then the chloride amount went slightly up. PCFA15 and PCFA30 had much higher bound chloride amounts compared to that without any fly ash addition (PCFA0). The bound chloride content decreased significantly within the 0.0–12.5 mm depth, while it slightly increased to a constant value beyond 12.5 mm. In this case, free chloride could be reduced in the pores of concrete, which deceased the potential risk of rebar corrosion. The free chloride content kept a linear relationship with the total chloride content [49], as shown in Figure 7. Equation (4) introduces the index R to represent the chloride binding capacity:
R = C b C f ,
where Cb is the concentration of the bound chloride and Cf is the concentration of the free chloride.
Equation (5) gives a linear formulation to represent the linear relationship between the free and total chloride contents:
C t = K C f + b ,
where Ct is the concentration of total chloride and K and b are constants.
Substituting Equation (1) into Equation (2) results in Equation (6):
C b = ( K 1 ) C f + b ,
Equation (7) introduces chloride binding capacity index R shown below:
R = K 1 ,
Based on the calculations of Equation (7), Figure 8 shows the relationship between the chloride bound capacity amount and concrete depth. The chloride binding capacity increased as concrete depth rose. Based on Equation (4), the bound capacity indexes of chloride were 0.1426, 0.1882, and 0.2134, respectively, for PCFA0, PCFA15, and PCFA30. This calculation indicates that the chloride binding capacity improves as fly ash addition increases.

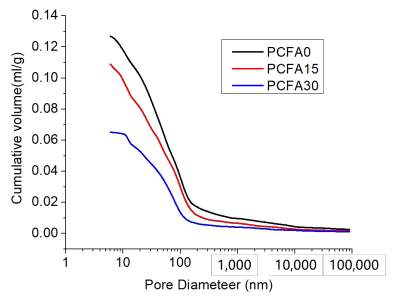
3.4. Effect of Fly Ash on Porosity and Microstructure

Physical and chemical reactions may significantly affect the porosity and microstructure of concrete due to fly ash addition. Figure 9 shows the cumulated porosity of the concrete samples. It was found that the cumulative pore volume reduced as the fly ash addition increased. Figure 10 shows the pore size distribution of each sample after 90 days of curing. The cumulative volume of pores reduced as fly ash content increased. The mean pore size of the PCFA0, PCFA15, and PCFA30 samples were about 40, 26, and 13 nm, respectively, which indicated that the fly ash addition led to a denser concrete microstructure.
Mehta and Monteriropj [28] classified pore size in concrete into four classes: Class I of <4.5 nm, Class II of 4.5–50 nm, Class III of 50–100 nm, and Class IV of > 100 nm. A pore size of <100 nm has little or no effect, while >100 nm has a negative effect on the concrete strength and permeability. Specifically, the curves in Figure 11 show that the pore volume fraction of Class I and II increased while that of Class III and IV decreased. For example, the pore volume fraction with 4.5–100 nm in PCFA30 increased by about 62.5% and 36.8% compared to PCFA0 and PCFA15, respectively, while that of 100–200 nm and larger than 200 mm for PCFA15 and PCFA30 considerably reduced to 20.83% and 15.39%, respectively, compared to that of PCFA0. This indicated that pore structures were well-improved as fly ash was added into concrete. This was caused by the second hydration of fly ash with C–H after 90 days of curing generated more C–S–H gel, causing the promotion of concrete compactness and the optimization of pore structures. Figure 12a–c shows the morphologies of concrete samples with different fly ash additions after 90 days of curing. PCFA15 and PCFA30 with fly ash had enhanced concrete density, while more pores could be found for PCFA0 without fly ash replacement. The left-unhydrated fly ash particles may have filled pores in the concrete, as shown in Figure 12d. In this case, fly ash prevented the penetration of free chloride ions and reduced the corrosion of steel rebar, leading to a higher concrete durability.

4. Conclusions

This study systematically, experimentally, and analytically investigated the influence of fly ash on chloride diffusion, chloride bonding capacity, and the microstructure of normal concrete in a water soaking environment. The main findings are summarized as follows.
(1)
The addition of fly ash reduced free chloride diffusion, increased the chloride binding capacity, and improved the concrete compactness, which could further improve the durability of concrete.
(2)
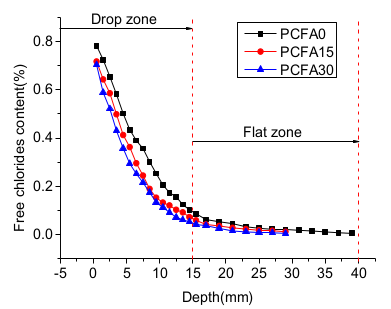
Two individual zones of chloride deposition, namely the descending zone (0–15 mm) and the gentle zone (15–40 mm), were identified through the measurement of chloride content. The chloride concentration of samples at the 0–7.5 mm zone reduced by 54.5%, 65.9%, and 69.4%, respectively, for PCFA0, PCFA15 and PCFA30. Fly ash addition indeed decreased the free chloride concentration.
(3)
In natural immersion, the chloride ion diffusion coefficients of concrete with 15% and 30% fly ash replacements for cement were reduced by 26.1% and 37.9%, respectively, compared to concrete without any fly ash addition, which indicated that the more fly ash was added in the concrete, the lower the chloride diffusion coefficient.
(4)
Both chemical ion exchange and physical adsorption processes contributed to the reduction of free chloride ion concentrations. The free chloride ion content had a linear relation with the total amount of chloride ions. An equation was proposed to predict the binding capacity of chloride. Concretes with 0%, 15%, and 30% replacement for cement had binding capacity indexes of 0.1426, 0.1882, and 0.2134, respectively, which indicated that the chloride binding capacity was improved by fly ash. In this case, fly ash reduced the free chloride ion concentration, and if this concentration was less than the critical value, the rebar corrosion could be prevented, thus resulting in a longer service life of reinforced concrete. Moreover, a future study is expected to differentiate between chemical and physical adsorption process.
(5)
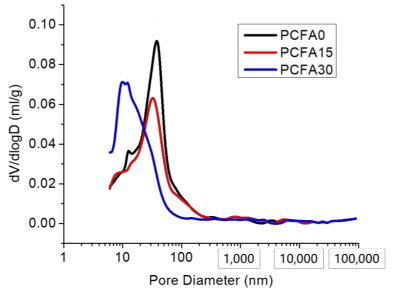
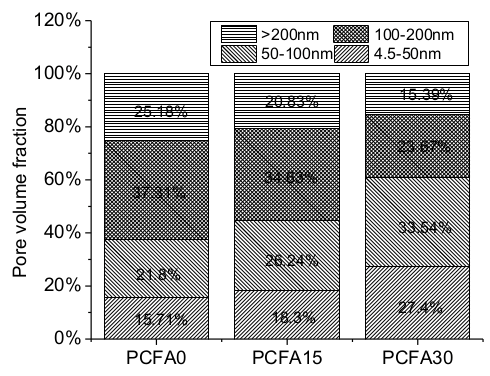
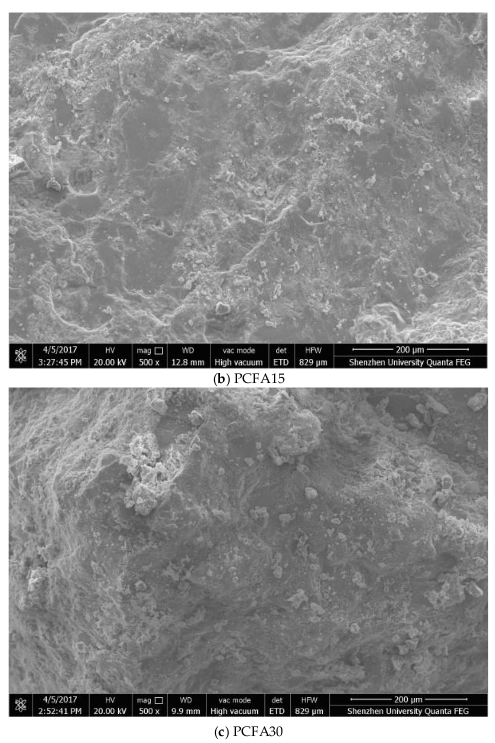
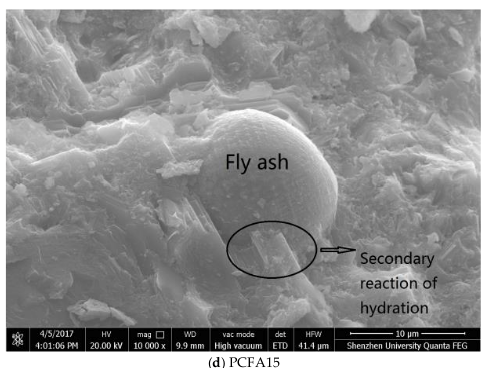
Fly ash particles and hydration products (filling and pozzolanic effect) led to the densification of microstructures. SEM results showed that the volume of pores less than 100 nm obviously increased for concrete with 15% fly ash replacement for cement, the volume of pores sized from 4.5 to 50 nm, and 50 to 100 nm pronouncedly increased, while the volume of pores larger than 100 nm decreased significantly.

Author Contributions

Conceptualization, J.L. (Jun Liu); investigation, J.L. (Jiaying Liu); writing—original draft preparation, Z.H.; validation, J.Z.; writing—review and editing, W.L. and W.Z. All authors have read and agreed to the published version of the manuscript.

Funding

The financial support from Key-Area Research and Development Program of Guangdong Province(2019B111107002), Natural Science Foundation of China (No. 51708360 and 51978407), Shenzhen City Science and Technology Project (No. JCYJ20180305124008155, JCYJ20170302143133880, JCYJ20180305124106675), and Shenzhen International Cooperation Research Project (No.GJHZ20180928155602083) are gratefully acknowledged.

Conflicts of Interest

The authors declare no conflict of interest.

References

  1. Hasanbeigi, A.; Menke, C.; Price, L. The CO2 abatement cost curve for the Thailand cement industry. J. Clean. Prod. 2010, 18, 1509–1518. [Google Scholar] [CrossRef]
  2. Chen, C.; Habert, G.; Bouzidi, Y.; Jullien, A. Environmental impact of cement production: Detail of the different processes and cement plant variability evaluation. J. Clean. Prod. 2010, 18, 478–485. [Google Scholar] [CrossRef]
  3. Madhavi, T.C.; Swamy Raju, L.; Mathur, D. Durabilty and Strength Properties of High Volume Fly Ash Concrete. J. Civil. Eng. Res. 2014, 4, 7–11. [Google Scholar]
  4. Abdullah, M.M.A.; Tahir, M.F.M.; Hussin, K.; Binhussain, M.; Sandu, I.G.; Yahya, Z.; Sandu, A.V. Fly ash based lightweight geopolymer concrete using foaming agent technology. Rev. Chim. 2015, 66, 1001–1003. [Google Scholar]
  5. Mishra, S.R.; Kumar, S.; Park, A.; Rho, J.; Losby, J.; Hoffmeister, B.K. Ultrasonic characterization of the curing process of PCC fly ash–cement composites. Mater. Charact. 2003, 50, 317–323. [Google Scholar] [CrossRef]
  6. Hemalatha, T.; Ramaswamy, A. A review on fly ash characteristics-Towards promoting high volume utilization in developing sustainable concrete. J. Clean. Prod. 2017, 147, 546–559. [Google Scholar] [CrossRef]
  7. Mukherjee, A.B.; Zevenhoven, R.; Bhattacharya, P.; Sajwan, K.S.; Kikuchi, R. Mercury flow via coal and coal utilization by-products: A global perspective. Resour. Conserv. Recycl. 2008, 52, 571–591. [Google Scholar] [CrossRef]
  8. Selic, E.; Herbell, J.D. Utilization of fly ash from coal-fired power plants in China. J. Zhejiang Univ.-Sci. A 2008, 9, 681–687. [Google Scholar]
  9. Liu, J.; Gu, Z.; Xiang, J.; Pan, D. Permeation properties and pore structure of surface layer of fly ash concrete. Materials 2014, 7, 4282–4296. [Google Scholar] [CrossRef] [Green Version]
  10. Liu, J.; Xing, F.; Dong, B.; Ma, H.; Pan, D. Study on water sorptivity of the surface layer of concrete. Mater. Struct. 2014, 47, 1941–1951. [Google Scholar] [CrossRef]
  11. Argiz, C.; Moragues, A.; Menéndez, E. Use of ground coal bottom ash as cement constituent in concretes exposed to chloride environments. J. Clean. Prod. 2017, 170, 25–33. [Google Scholar] [CrossRef]
  12. Zou, D.J.; Liu, T.J.; Qiao, G.F. Experimental investigation on the dynamic properties of RC structures affected by the reinforcement corrosion. Adv. Struct. Eng. 2014, 17, 851–860. [Google Scholar] [CrossRef]
  13. Mehta, P.K. High-performance, high-volume fly ash concrete for sustainable development. In Proceedings of the International Workshop on Sustainable Development and Concrete Technology, Beijing, China, 20–21 May 2004. [Google Scholar]
  14. Moghaddam, F.; Sirivivatnanon, V.; Vessalas, K. The effect of fly ash fineness on heat of hydration, microstructure, flow and compressive strength of blended cement pastes. Case Stud. Constr. Mater. 2019, 10, e00218. [Google Scholar] [CrossRef]
  15. Liu, J.; Qiu, Q.; Chen, X.; Wang, X.; Xing, F.; Han, N.; He, Y. Degradation of fly ash concrete under the coupled effect of carbonation and chloride aerosol ingress. Corros. Sci. 2016, 112, 364–372. [Google Scholar] [CrossRef]
  16. Thomas, M.D.A.; Matthews, J.D. Carbonation of fly ash concrete. Mag. Concr. Res. 1992, 44, 217–228. [Google Scholar] [CrossRef]
  17. Liu, T.; Zou, D.; Teng, J.; Yan, G. The influence of sulfate attack on the dynamic properties of concrete column. Constr. Build. Mater. 2012, 28, 201–207. [Google Scholar] [CrossRef]
  18. Naik, T.R.; Singh, S.; Ramme, B. Mechanical properties and durability of concrete made with blended fly ash. ACI Mater. J. 1998, 95, 454–462. [Google Scholar]
  19. Malhotra, V.M. Role of supplementary cementing materials in reducing greenhouse gas emissions CANMET. In Concrete Technology for a Sustainable Development in the 21st Century; Gjorv, O.E., Sakai, K., Eds.; Spon Press: London, UK, 1999. [Google Scholar]
  20. Liu, J.; Qiu, Q.; Chen, X.; Xing, F.; Han, N.; Ma, Y. Understanding the interacted mechanism between carbonation and chloride aerosol attack in ordinary Portland cement concrete. Cem. Concr. Res. 2017, 95, 217–225. [Google Scholar] [CrossRef]
  21. Liu, J.; Wang, X.; Qiu, Q.; Ou, G.; Xing, F. Understanding the effect of curing age on the chloride resistance of fly ash blended concrete by rapid chloride migration test. Mater. Chem. Phys. 2017, 196, 315–323. [Google Scholar] [CrossRef]
  22. Tripathi, S.R.; Ogura, H.; Inoue, H.; Hasegawa, T.; Takeya, K.; Kawase, K. Measurement of chloride ion concentration in concrete structures using terahertz time domain spectroscopy (THz-TDS). Corros. Sci. 2012, 62, 5–10. [Google Scholar] [CrossRef]
  23. Al-Mattarneh, H. Determination of chloride content in concrete using near- and far-field microwave non-destructive methods. Corros. Sci. 2016, 105, 133–140. [Google Scholar] [CrossRef]
  24. Liu, J.; Ou, G.; Qiu, Q.; Chen, X.; Hong, J.; Xing, F. Chloride transport and microstructure of concrete with/without fly ash under atmospheric chloride condition. Constr. Build. Mater. 2017, 146, 493–501. [Google Scholar] [CrossRef]
  25. Angst, U.; Elsener, B.; Larsen, C.K.; Vennesland, Ø. Critical chloride content in reinforced concrete: A review. Cem. Concr. Res. 2009, 39, 1122–1138. [Google Scholar] [CrossRef]
  26. Sun, G.; Zhang, Y.; Sun, W.; Liu, Z.; Wang, C. Multi-scale prediction of the effective chloride diffusion coefficient of concrete. Constr. Build. Mater. 2011, 25, 3820–3831. [Google Scholar] [CrossRef]
  27. Wu, J.; Li, H.; Wang, Z.; Liu, J. Transport model of chloride ions in concrete under loads and drying-wetting cycles. Constr. Build. Mater. 2016, 112, 733–738. [Google Scholar] [CrossRef]
  28. Mehta, P.K.; Monteriropj, M. Concrete: Microstructure, Properties and Materials; McGraw-Hill: New York, NY, USA, 2006; pp. 203–300. [Google Scholar]
  29. Muigai, R.; Alexander, M. Durability design of reinforced concrete structures: A comparison of the use of durability indexes in the deemed-to-satisfy approach and the full-probabilistic approach. Mater. Struct. 2012, 45, 1233–1244. [Google Scholar] [CrossRef]
  30. Kwon, S.J.; Na, U.J.; Park, S.S.; Jung, S.H. Service life prediction of concrete wharves with early-aged crack: Probabilistic approach for chloride diffusion. Struct. Saf. 2009, 31, 75–83. [Google Scholar] [CrossRef]
  31. Huang, Z.; Padmaja, K.; Li, S.; Liew, J.R. Mechanical properties and microstructure of ultra-lightweight cement composites with fly ash cenospheres after exposure to high temperatures. Constr. Build. Mater. 2018, 164, 760–774. [Google Scholar] [CrossRef]
  32. Huang, Z.Y.; Liew, J.Y.R.; Li, W. Evaluation of compressive behavior of ultra-lightweight cement composite after elevated temperature exposure. Constr. Build. Mater. 2017, 148, 579–589. [Google Scholar] [CrossRef]
  33. Berry, E.E.; Hemmings, R.T.; Cornelius, B.J. Mechanisms of hydration reactions in high volume fly ash pastes and mortars. Cem. Concr. Compos. 1990, 12, 253–261. [Google Scholar] [CrossRef]
  34. Kouloumbi, N.; Batis, G.; Malami, C. The anticorrosive effect of fly ash, slag and a Greek pozzolan in reinforced concrete. Cem. Concr. Compos. 1994, 16, 253–260. [Google Scholar] [CrossRef]
  35. Kouloumbi, N.; Batis, G. Chloride corrosion of steel rebars in mortars with fly ash admixtures. Cem. Concr. Compos. 1992, 14, 199–207. [Google Scholar] [CrossRef]
  36. Cheewaket, T.; Jaturapitakkul, C.; Chalee, W. Long term performance of chloride binding capacity in fly ash concrete in a marine environment. Constr. Build. Mater. 2010, 24, 1352–1357. [Google Scholar] [CrossRef]
  37. NT (NORDTEST) Build 443. Concrete Hardened: Accelerated Chloride Penetration, Nordtest, Tekniikantie 12, FIN-02150 Espoo, Finland. 1995. Available online: http://www.nordtest.info/index.php/methods/building/item/concrete-hardened-accelerated-chloride-penetration-nt-build-443.html (accessed on 8 September 2020).
  38. AASHO T260. Standard Method of Test for Sampling and Testing for Chloride Ion in Concrete and Concrete Raw Materials; American Association of State Highway and Transportation Officials: Washington, DC, USA, 2009. [Google Scholar]
  39. Ma, H.Y.; Li, Z.J. Realistic Pore Structure of Portland Cement Paste: Experimental Study and Numerical Simulation. Comput. Concr. 2013, 11, 317–336. [Google Scholar] [CrossRef]
  40. Huang, Z.Y.; Huang, Y.S.; Han, N.X.; Zhou, Y.W.; Xing, F.; Sui, T.B.; Wang, B.; Ma, H.Y. Development of limestone calcined clay cement (LC3) concrete in South China and its bond behavior with steel bar. J. Zhejiang Univ.-Sci. A 2020, 21. [Google Scholar] [CrossRef]
  41. Washburn, E.W. Note on a Method of Determining the Distribution of Pore Sizes in a Porous Material. Proc. Natl. Acad. Sci. USA 1921, 7, 115. [Google Scholar] [CrossRef] [PubMed] [Green Version]
  42. Collepardi, M.; Marcialis, A.; Turriziani, R.C. Penetration of chloride ions into cement paste and concrete. Am. Ceram. Soc. 1972, 55, 534–535. [Google Scholar] [CrossRef]
  43. Funahashi, M. Predicting corrosion free service life of a concrete structure in a chloride environment. ACI Mater. J. 1998, 87, 581–587. [Google Scholar]
  44. Wang, C.; Yang, C.; Qian, J.; Zhong, M.; Zhao, S. Behavior and Mechanism of Pozzolanic Reaction Heat of Fly Ash and Ground Granulated Blast Furnace Slag at Early Age. J. Chin. Ceram. Soc. 2012, 40, 1050–1058. [Google Scholar]
  45. Zibara, H.; Hooton, R.D.; Thomas, M.D.A.; Stanish, K. Influence of the C/S and C/A ratios of hydration products on the chloride ion binding capacity of lime-SF and lime-MK mixtures. Cem. Concr. Res. 2008, 38, 422–426. [Google Scholar] [CrossRef]
  46. Yuan, Q.; Shi, C.; De Schutter, G.; Audenaert, K.; Deng, D. Chloride binding of cement-based materials subjected to external chloride environment—A review. Constr. Build. Mater. 2009, 23, 1–13. [Google Scholar] [CrossRef]
  47. Elakneswaran, Y.; Nawa, T.; Kurumisawa, K. Electrokinetic potential of hydrated cement in relation to adsorption of chlorides. Cem. Concr. Res. 2009, 39, 340–344. [Google Scholar] [CrossRef]
  48. Ben-Yair, M. The effect of chlorides on concrete in hot and arid regions. Cem. Concr. Res. 1974, 4, 405–416. [Google Scholar] [CrossRef]
  49. Tang, L.P.; Nilsson, L.O. Resistance of Concrete to Chloride Ingress: Testing and Modelling; Spon Press: London, UK, 2012. [Google Scholar]
Figure 1. Measurement of chloride content in concrete.
Applsci 10 06271 g001aApplsci 10 06271 g001b
Figure 2. Free chloride deposition of concrete with different fly ash replacement ratios.
Applsci 10 06271 g002
Figure 3. Qualitative expression of the chloride penetration curves [24].
Applsci 10 06271 g003
Figure 4. Regression curves of chloride coefficient using Fick’s second law (by mass%).
Applsci 10 06271 g004
Figure 5. Distribution of total chloride, free chloride, and bound chloride in concrete samples (by mass%).
Applsci 10 06271 g005aApplsci 10 06271 g005b
Figure 6. Relationship between bound chloride amount and concrete depth (by mass%).
Applsci 10 06271 g006
Figure 7. Relation between free chloride and total chloride depth (by mass%).
Applsci 10 06271 g007
Figure 8. Relation between chloride bound capacity amount and concrete depth.
Applsci 10 06271 g008
Figure 9. Cumulative porosity of concrete sample with different fly ash additions after 90 days of curing.
Applsci 10 06271 g009
Figure 10. Pore size distribution after 90 days of curing.
Applsci 10 06271 g010
Figure 11. Pore size distribution of concrete with different fly ash additions after 90 days of curing.
Applsci 10 06271 g011
Figure 12. Morphologies of concrete samples with different fly ash additions after 90 days of curing.
Applsci 10 06271 g012aApplsci 10 06271 g012bApplsci 10 06271 g012c
Table 1. Mix proportions of concrete. kg/m3.
NOOPCSandCAFAWW/C
PCFA0409.0720.01079.00.01920.47
PCFA15347.7697.31054.061.31920.47
PCFA30286.3689.01041.0122.71920.47
OPC = ordinary Portland cement; CA = coarse aggregate; FA = fly ash; and W/C = water to cement ratio; PCFA0 represents plain concrete with 0% fly ash.
Table 2. Chemical compositions (mass percentages of oxides, %).
MaterialCaOSiO2Al2O3Fe2O3MgOSO3K2O
Cement64.6718.594.624.172.353.320.92
Fly ash4.7462.3223.951.332.041.250.76
Table 3. Regression results of chloride diffusion coefficient. D: chloride ion diffusion coefficient; CS: chloride percentage at the concrete surface; and σ2: the mercury surface tension force.
IDD/(×10−12 m2/s)Cs/%R2σ2
PCFA012.26170.82100.99880.0006
PCFA159.06330.76140.99700.0014
PCFA307.61760.71870.99660.0014

