Article

Design Optimization of Rubber-Basalt Fiber- Modified Concrete Mix Ratios Based on a Response Surface Method

College of Transportation, Jilin University, Changchun 130025, China
*
Author to whom correspondence should be addressed.
Submission received: 7 September 2020 / Revised: 23 September 2020 / Accepted: 24 September 2020 / Published: 27 September 2020
(This article belongs to the Special Issue Advances in High-Performance of Eco-Efficient Concrete)

Abstract

:
Rubber aggregates produced from waste rubber materials and environmentally friendly basalt fibers are excellent concrete modification materials, which significantly improve the working performance and mechanical properties of concrete. This paper studied the influences of water-binder ratio, basalt fiber content and rubber content on the properties of rubber-basalt fiber modified concrete (RBFC). Based on the response surface method (RSM), optimization schemes of three preparation parameters were designed. The results showed that all preparation parameters have significant impacts on the slump. The rubber content has a closer relationship with the compressive strength and the quadratic term of the basalt fiber content has a significant impact on the flexural strength. According to the analysis, the optimal mix ratio which possesses reliable accuracy compared with experimental results includes a water-binder ratio of 0.39, a basalt fiber content of 4.56 kg/m3 and a rubber content of 10%,

1. Introduction

With the continuous improvement of social productivity, the material resources in social life are becoming more and more abundant, but various difficult-to-degradable materials continue to emerge, especially the large number of waste rubber materials, which have become a worldwide treatment problem that pollutes the environment and easily triggers secondary disasters [1,2]. In China, the number of waste rubber tires produced in 2012 exceeded 10 million tons, and the annual growth rate is increasing. The output of waste rubber tires was expected to exceed 20 million tons in 2020, equivalent to nearly 4 million tons of rubber resources [3]. Only about 15% of such a large number of waste rubber tires can be effectively degraded and retreaded. Therefore, the recycling of waste rubber materials is an emerging problem. With the in-depth research on waste rubber materials, researchers discovered that waste rubber materials can be converted into rubber particles by physical grinding and then added to concrete. The incorporation of rubber improves the performance of concrete and at the same time reduces the environmental pollution of rubber. Rubber particles can fill part of the pores of concrete and improve the connection between cement and aggregate. The incorporation of rubber particles can play a role in mitigating energy consumption, thereby improving the crack resistance of the material [4]. Moreover, based on the same principle, the incorporation of rubber also improves the impact resistance of concrete [5,6]. Incorporating rubber particles into concrete can introduce a large number of bubbles, thereby improving the frost resistance of concrete [7,8,9]. At the same time, due to the increase of internal voids, rubber concrete also has good heat insulation and sound insulation characteristics [10]. However, while a large number of scholars’ studies have shown that the incorporation of rubber particles improves the toughness of concrete, it is negatively related to the mechanical properties of concrete [11,12]. Therefore, in order to expand the scope of application of rubber concrete, it is necessary to further modify rubber concrete.
Basalt fiber is an environmentally friendly material made from basalt. Incorporating basalt fiber into concrete can form a stable spatial network structure and comprehensively improve various properties of concrete. In recent years, basalt fiber has been deeply studied because of its environmentally friendly manufacturing process and excellent mechanical properties [13,14,15]. Algin et al. [16] evaluated the influence of fiber length and fiber content on concrete mechanical properties and permeability. The test results showed that the incorporation of fibers is negatively related to the fluidity of concrete, but it can improve the mechanical properties of concrete. Wu et al. [17] firstly used cement paste to wrap basalt fiber, and then mixed it into concrete. The results showed that the incorporation of an appropriate amount of basalt fiber is positively correlated with the mechanical properties of concrete. Katkhuda et al. [18] studied the relationship between the basalt fiber content and the properties of modified concrete. The test results showed that adding an appropriate amount of basalt fiber has a positive effect on the flexural strength of concrete. Jalasutram et al. [19] studied the failure mode of basalt fiber concrete during compression and found that the failure mode changed from brittleness to toughness during compression. Peng et al. [20] modified concrete with different dosages of basalt fibers of 0, 1, 2, 3, 4 and 5 kg/m3. The research results showed that the content of basalt fiber affects the compressive strength, splitting tensile strength and flexural strength of concrete to varying degrees.
The response surface method (RSM) is a method that can more effectively analyze and optimize an experimental response and it is being more and more widely used in concrete mix design [21]. RSM is superior to traditional experimental design methods in many aspects. Compared with traditional methods, RSM can reduce the number of tests required, thereby minimizing test costs, and it can determine the optimal input variables based on the test results [22,23,24,25]. The response surface method can establish a scientific mathematical model and provide information on the impact of individual factors and the interaction of factors on the test results within the set test numerical boundary. This method can better evaluate the nonlinear relationship between test variables and response values. At the same time, the three-dimensional response surface between the preparation parameters and the response index can be drawn in this article, so that the relationship between each factor and the response value can be understood more clearly. Algin et al. [16] used RSM for multi-objective optimization analysis. Based on strength and permeability, the optimal volume and length of basalt fiber were obtained. Liu et al. [26,27] studied the influence of four variables on the working performance and mechanical properties of basalt fiber reactive powder concrete using response surface methodology. In addition to the above literature, other scholars have used the RSM method to evaluate the effects of different influencing factors on concrete performance [28,29,30,31].
In this study, in order to recycle waste rubber materials and give full play to the excellent properties of basalt fiber, an experimental RBFC mixture scheme was designed based on the RSM. Fine aggregates were replaced by an equal volume of rubber aggregates and basalt fibers were mixed with concrete for modification. The relationships between three preparation parameters (water-binder ratio (WBR), basalt fiber content (BFC), rubber content (RC)) and the working performance and mechanical properties of RBFC were analyzed. The mechanical properties and working performance of concrete were taken as response values to study the optimal mix ratio of RBFC. The optimization scheme of RBFC mix ratio was determined and verified by test results.

2. Materials and Methods

2.1. Materials

In this article, P.II 42.5 Portland cement produced by Jilin Yatai Cement Co., Ltd. (Changchun, China) was used. The chemical composition of cement is shown in Table 1. The fine aggregate is selected from natural river sand with a particle size range of 0.1–4.75 mm, and its fineness modulus is 2.8. The coarse aggregate was made of natural aggregate with continuous gradation of 5–25 mm. The proportions of coarse aggregates with particle sizes of 16–26.5 mm, 9.5–16 mm and 4.75–9.5 mm are 40, 40% and 20%, respectively. The rubber aggregate was made of 20 mesh rubber fine powder produced by Dujiangyan Huayi Rubber Co., Ltd. (Deyang, China), which was obtained by a series of processes of mechanical crushing, screening, cleaning, and dust removal from waste tires. The technical indicators of rubber aggregate are shown in Table 2. Based on previous literature research [32], when the length of basalt fiber is 16–24 mm, the fiber length has little effect on the mechanical properties of concrete. The 18 mm basalt fiber produced by Shanghai Chenqi Chemical Technology Co., Ltd. (Shanghai, China) was used. Its physical properties are shown in Table 3. The HRWR-Q8011 polycarboxylic superplasticizer produced by Qinfen Building Materials Ltd. (Weinan, China) was used with a water reduction rate of 25% and a mixing amount of 2%. Tap water was selected as the test water.

2.2. Specimen Preparation

Concrete specimens were prepared to optimize the mix design of RBFC. Based on previous research [33,34], the preparation steps of RBFC are as follows: (1) Put the fine aggregate and basalt fiber into the blender and mix for 2 min. (2) Put the coarse aggregate into the mixer and mix for 1 min. (3) Put the rubber and cement in the mixer and mix for 1 min. (4) Pour 1/2 of the mixed solution of superplasticizer and water and stir for 1 min. (5) Pour the remaining solution and stir for 2 min. The 100 mm × 100 mm × 100 mm and 100 mm × 100 mm × 400 mm specimens were cast. All specimens were demolded after 24 h, and then kept in the standard health environment for 28 days with a relative humidity of 95% and a temperature of 20 ± 2 °C. The mix proportions of RBFC are shown in Table 4.

2.3. Experimental Methods

2.3.1. Slump

The slump test should be carried out immediately after the concrete mixture is mixed. According to the requirements in GB/T 50080-2016 [35], it must be completed within 150 s. The concrete mixture samples were evenly loaded into the slump bucket in three layers. For each layer of concrete mixture, the tamping rod was used to insert evenly in a spiral shape from the edge to the center 25 times. After tamping, the height of each layer of concrete mixture sample was about one third of the barrel height.

2.3.2. Compressive Strength

The compressive strength test is carried out in accordance with the regulations in GB/T 50081-2002 [36]. Three test pieces of 100 mm × 100 mm × 100 mm were made in each set of mix ratio. The loading speed was 0.5 MPa/s until the specimen was broken. In this study, the average value of three experiments was taken as the final compressive strength.

2.3.3. Flexural Strength

The flexural strength test is carried out with the four-point bending loading method specified in GB/T 50081-2002 [36]. Three test pieces of 100 mm × 100 mm × 400 mm were made in each set of mix ratio. The loading speed was 0.05 MPa/s until the specimen was broken. The flexural strength is the average of three measurements.

2.4. Response Surface Method

Applying statistical principles, RSM can not only qualitatively analyze the relationship between input variable and output variable, but also quantitatively analyze the relationship between them [37]. The best test conditions and procedures can be determined by selecting a suitable fitting model based on the experimental data. The Box Behnken design (BBD) is a RSM design method which can evaluate the nonlinear relationship between indicators and factors. BBD can reduce the number of trials and is a cost-effective method [38]. The number of experiments can be calculated by (2k (k − 1) + n), where k is the number of independent variable factors and n is the number of center points.
In this study, the BBD design was performed using the Design-Expert 8® software (Stat-Ease, Inc., Minneapolis, MN, USA). The experimental design required 17 experimental runs. The center point was designed to be 5. The independent variables were WBR, BFC and RC. Among them, the rubber content was the percentage of replacing fine aggregate. The slump (SP), flexural strength (FS) and compressive strength (CS) of the mixture were used as response variables. Based on the previous research [32,33,34,39], the levels of the three preparation parameters were determined. When using BBD to design the test group, the preparation parameters were required to be three levels. In addition to the two levels of maximum and minimum, the median is taken as another level, so that the best prediction results can be achieved through different design combinations of three factors and three levels. Table 5 shows the levels of the three preparation parameters.
According to the test data, the surface model can be fitted well, and the fitting formula is as follows:
R = β 0 + 1 k β i X i + 1 k β i i X i 2 + i < j k β i j X i X j + ε
where R is the response, X i and X j are the coded independent variables, β 0 is the mean value of response constant coefficient, β i is the linear effect of independent variable X i   , β i i is the secondary effects of X i , β i j is the linear interaction between X i and X j , and ε is the random error [40,41].

3. Results and Discussion

3.1. Test Results Based on BBD

The BBD method was used to study the effects of WBR, BFC and RC on working performance and mechanical properties of RBFC. By using BBD, a 17-group trial design was established. Table 6 shows the 17 groups of test programs and the results of each group of experimental programs. Preparation parameters including WBR, BFC and RC were used as input variables, and SP, FS and CS were response or output variables.

3.2. Analysis and Discussion
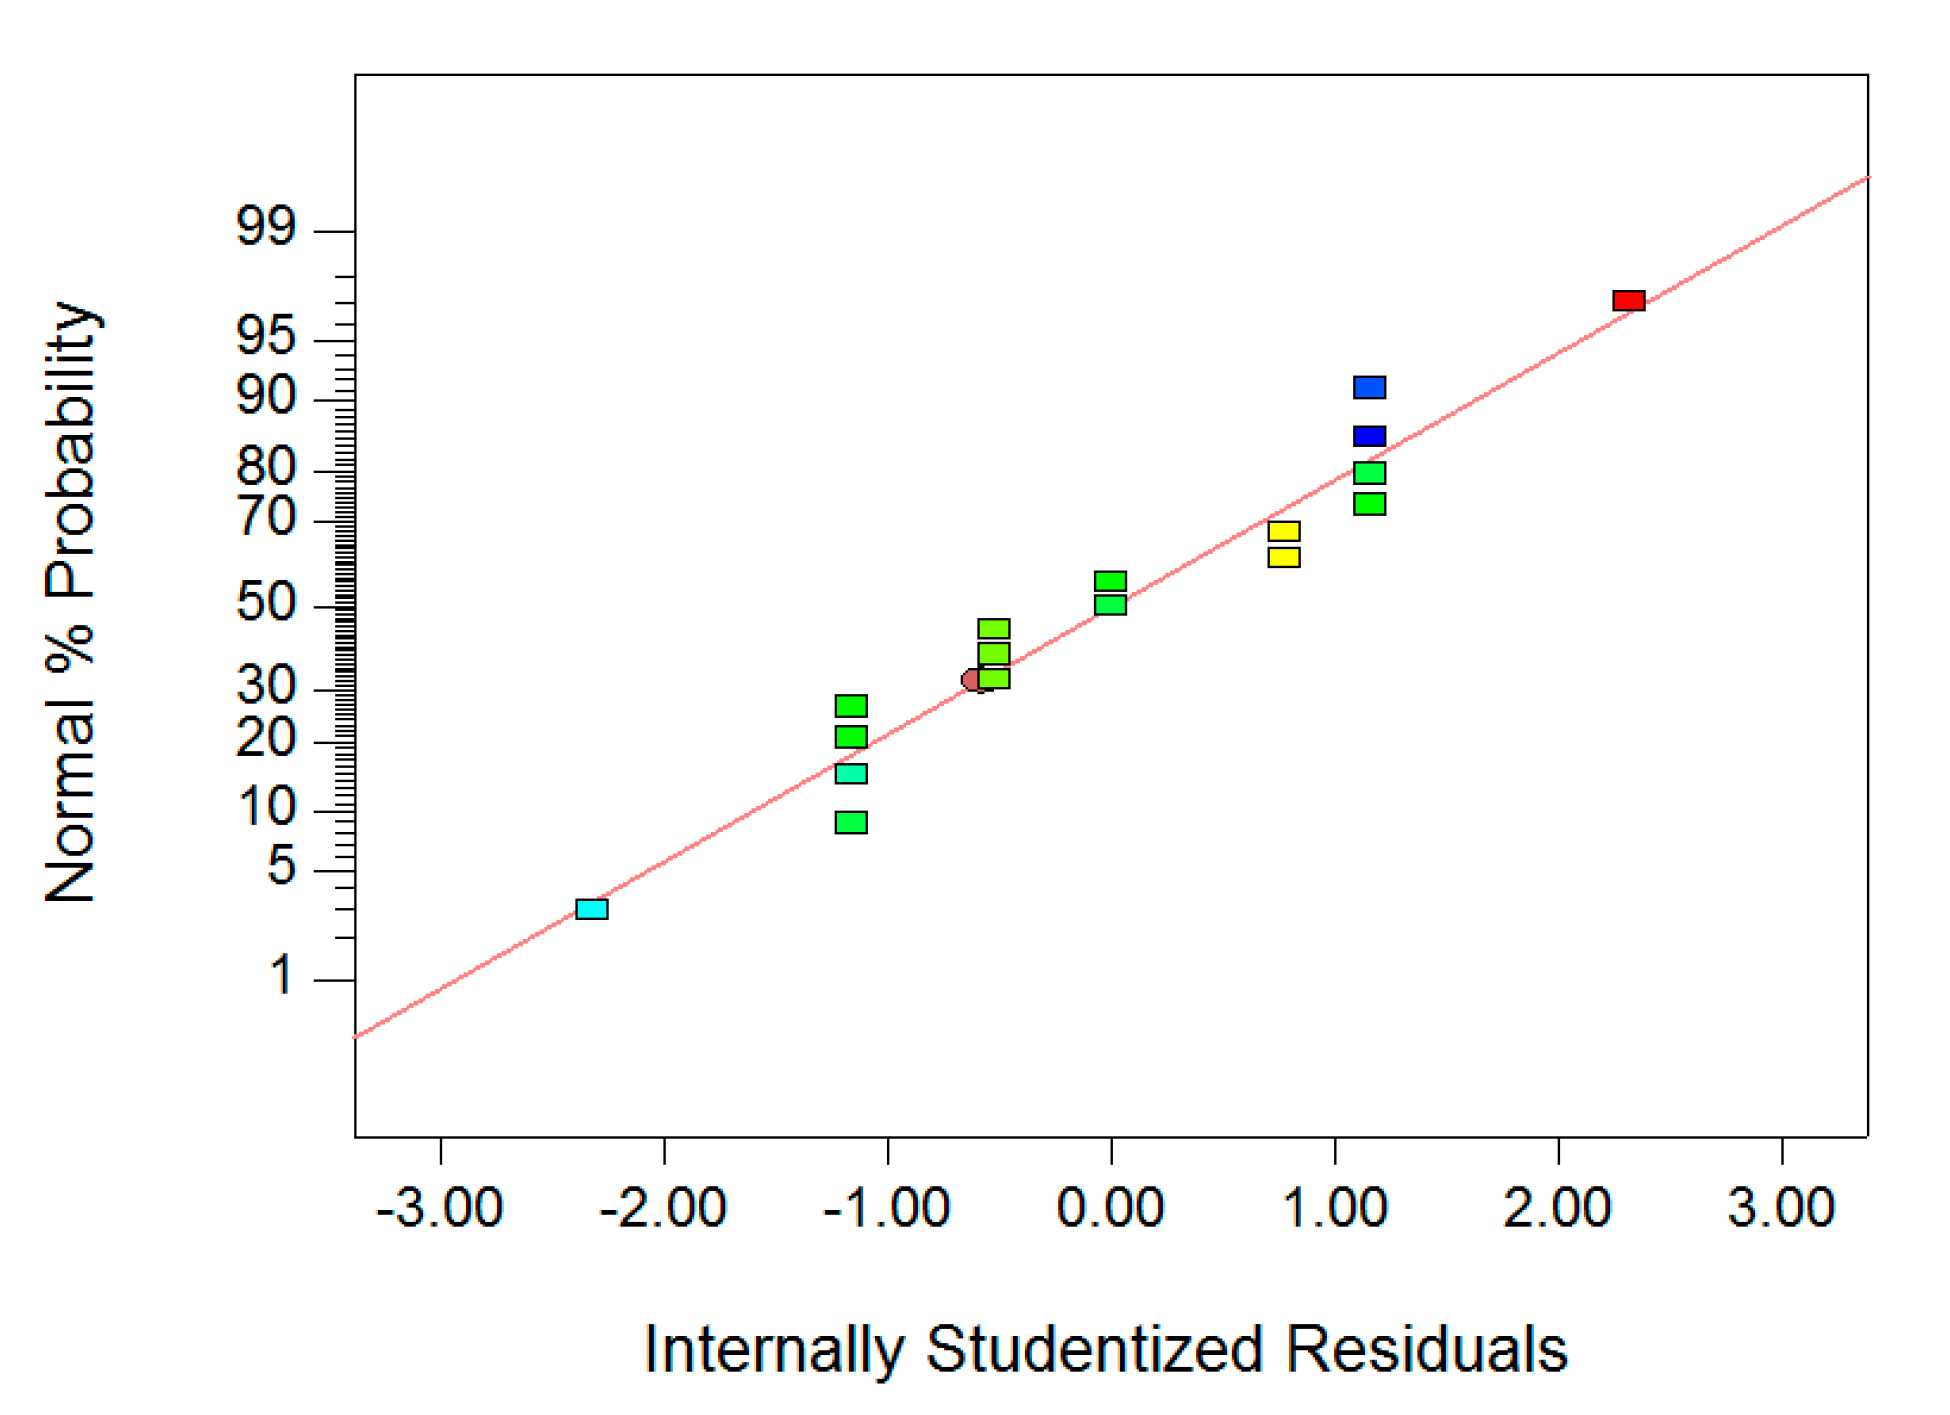
3.2.1. ANOVA

According to the test results in Table 6, the best regression model was proposed, and variance analysis was performed. The optimal model was chosen according to R-squared, Adjusted R-squared (Adj. R-squared), Adeq. precision, Fisher’s test value (F-value) and the probability “Prob > F-value” (p-value) [21]. Analysis of variance (ANOVA) can be used to evaluate the relationship between design and response variables, and to evaluate whether the model is significant. Design-Expert 8.0 software showed that the secondary models are all significant for the response variables SP, FS and CS. The analysis results of the model and variance are showed in Table 7 and Table 8, respectively.

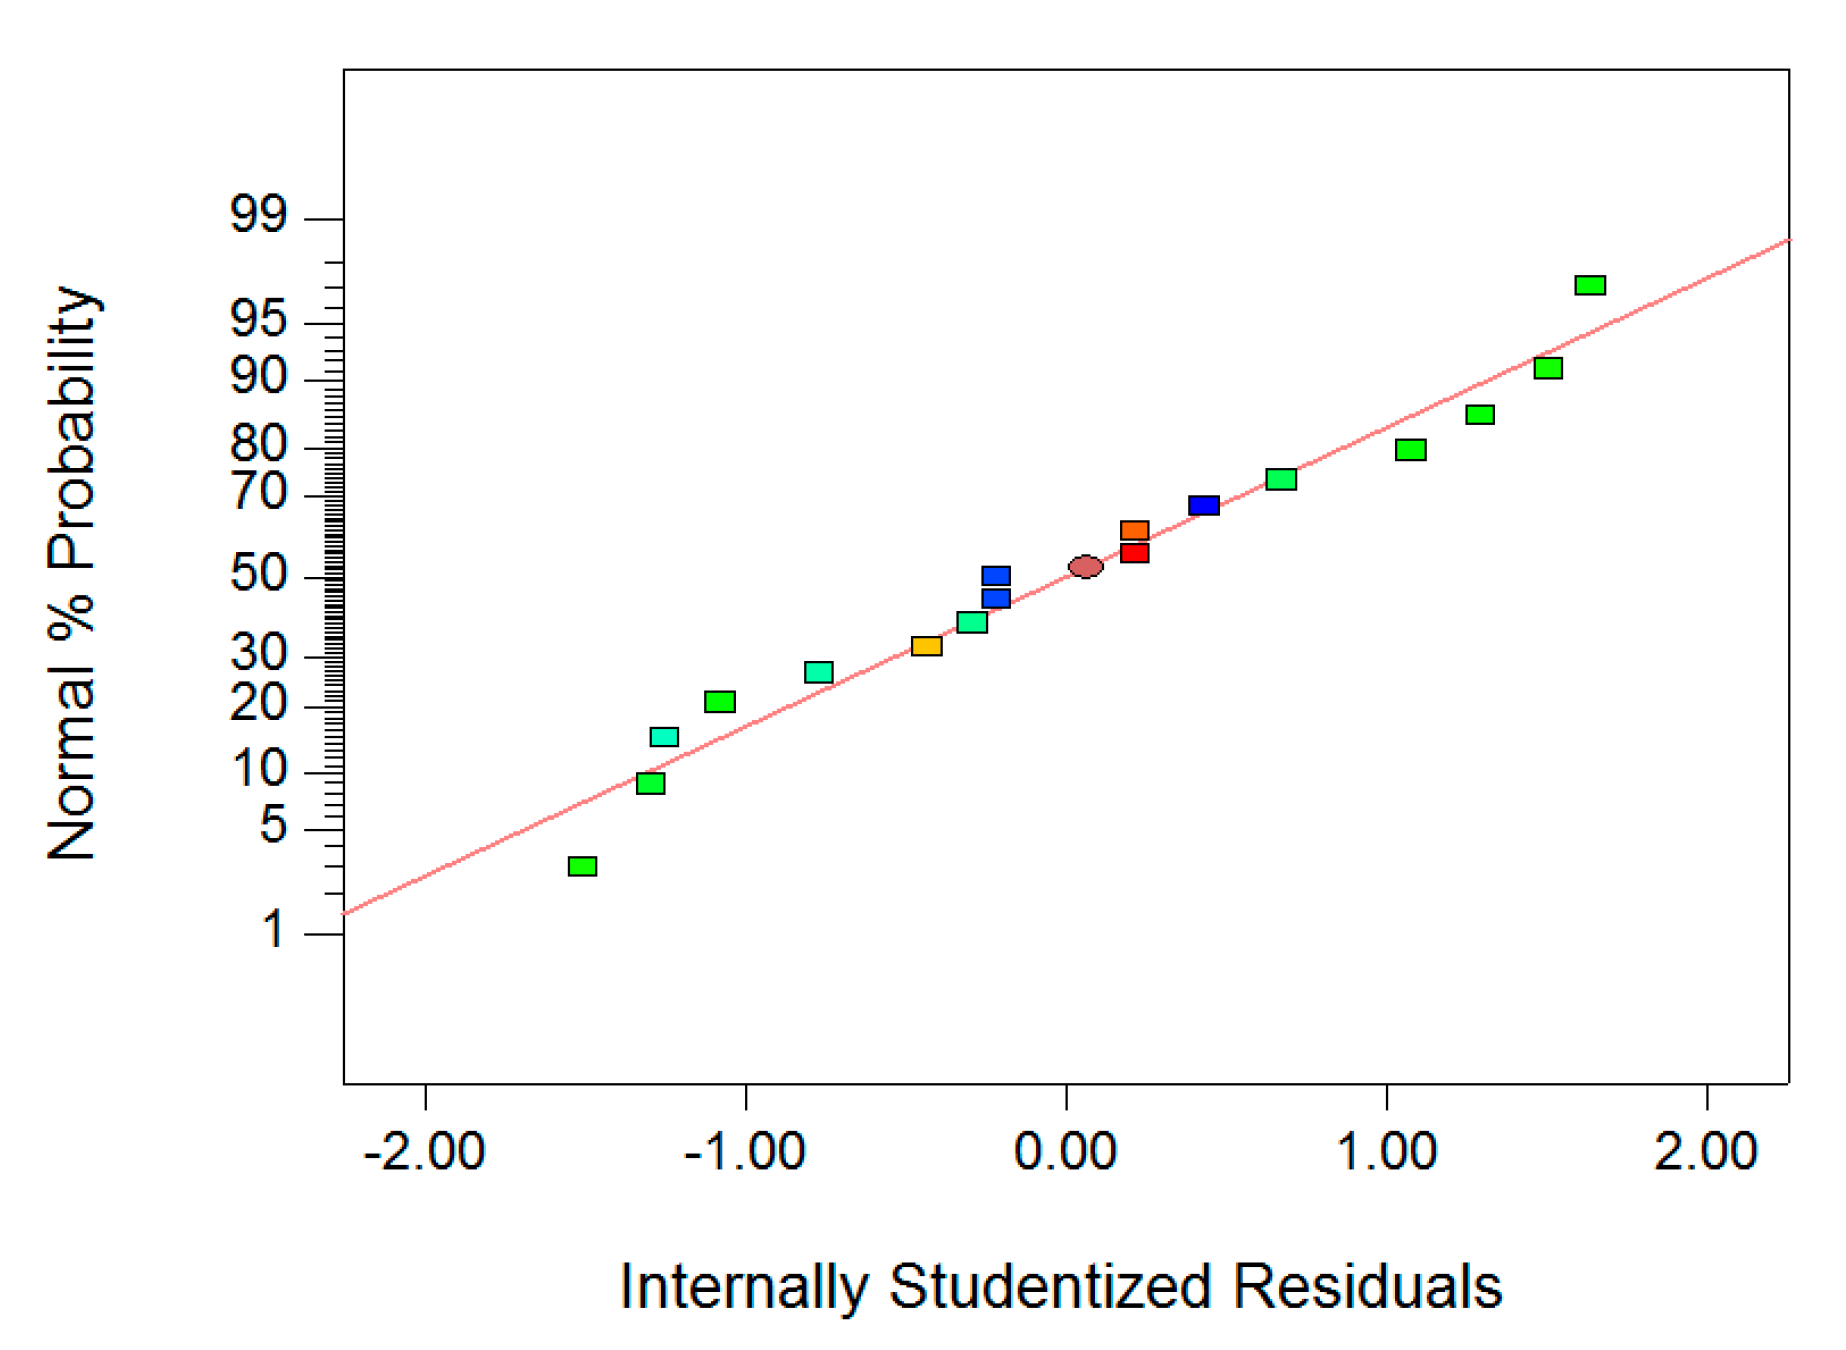
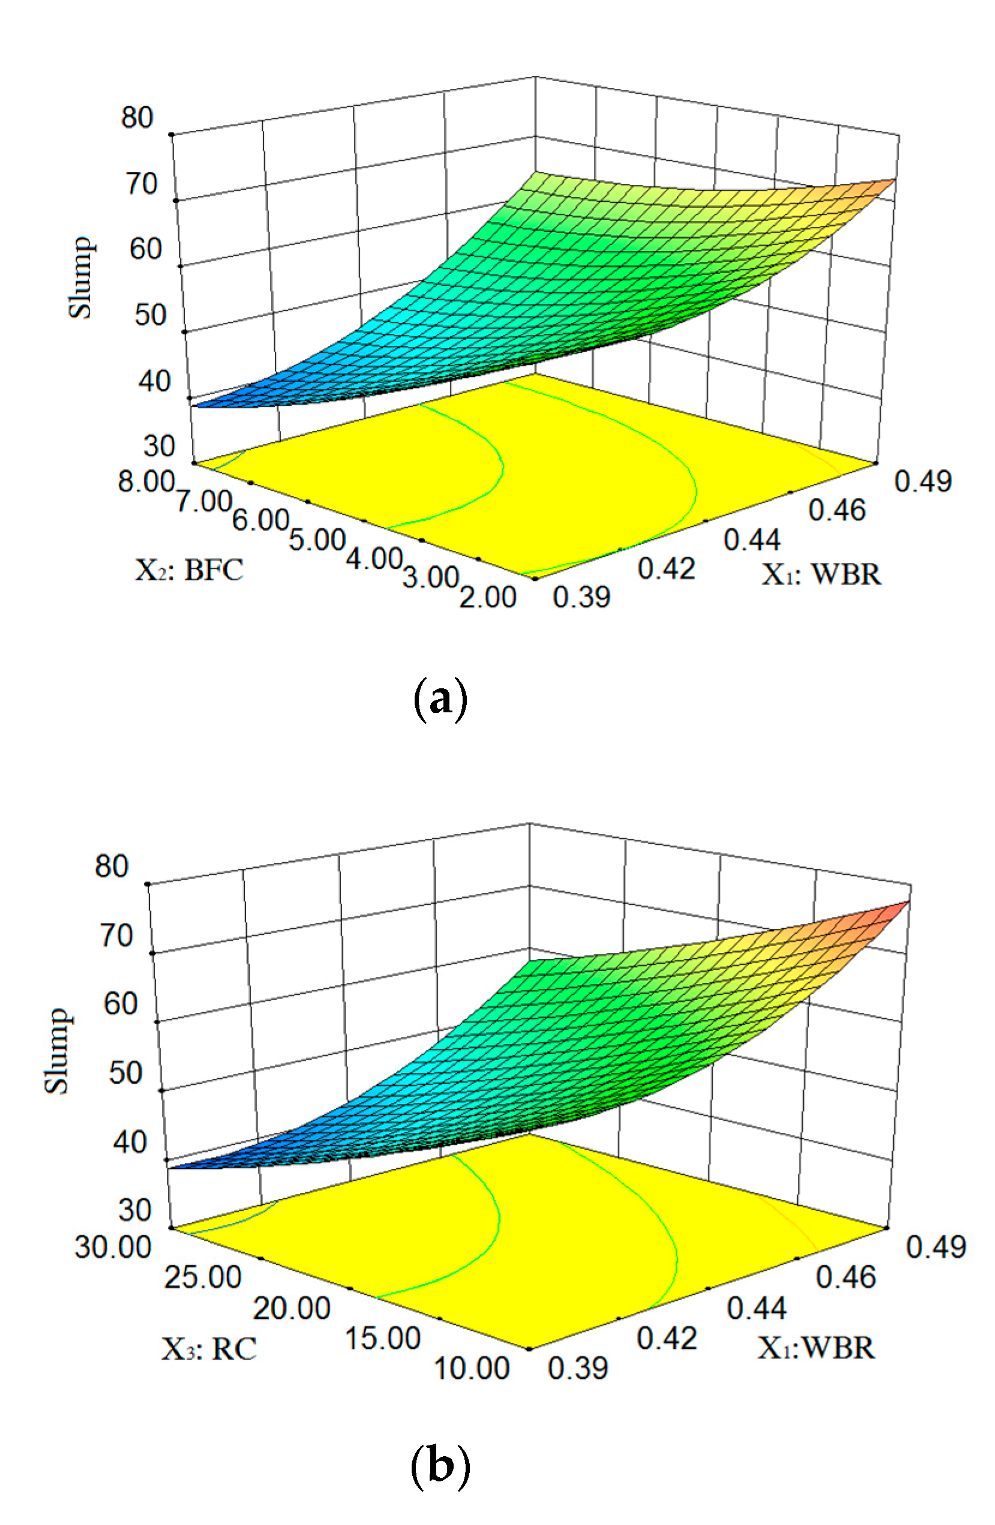
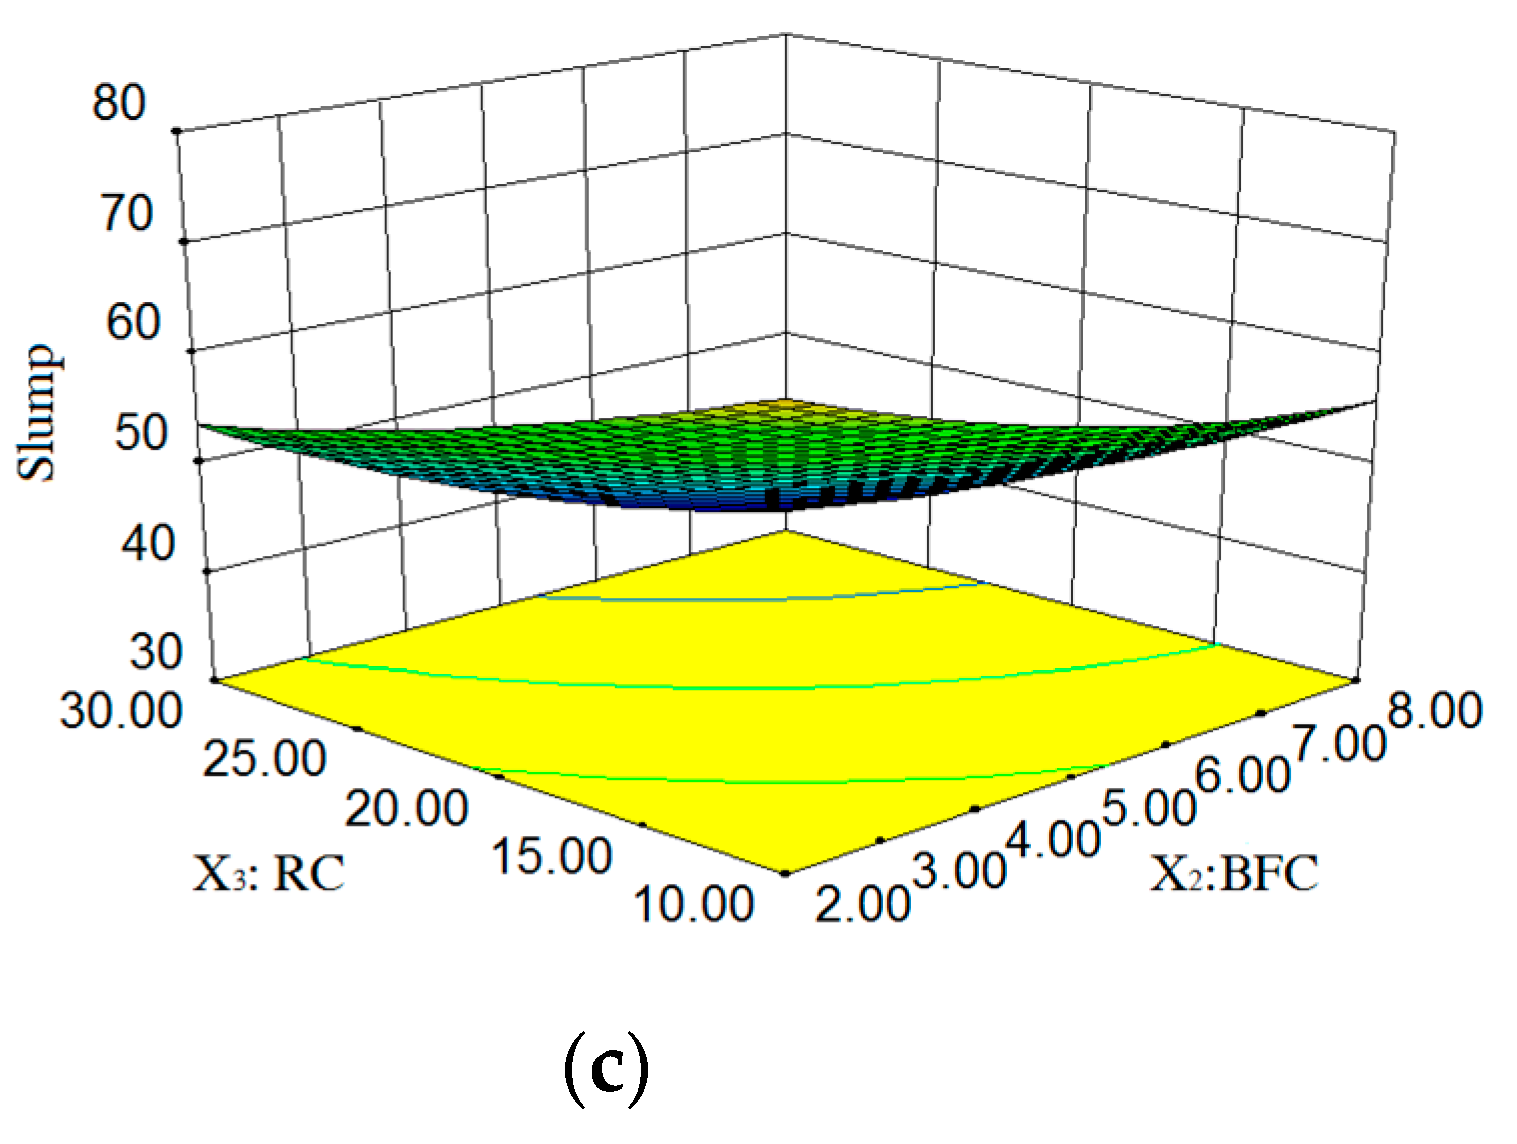
3.2.2. Slump Analysis (SP)
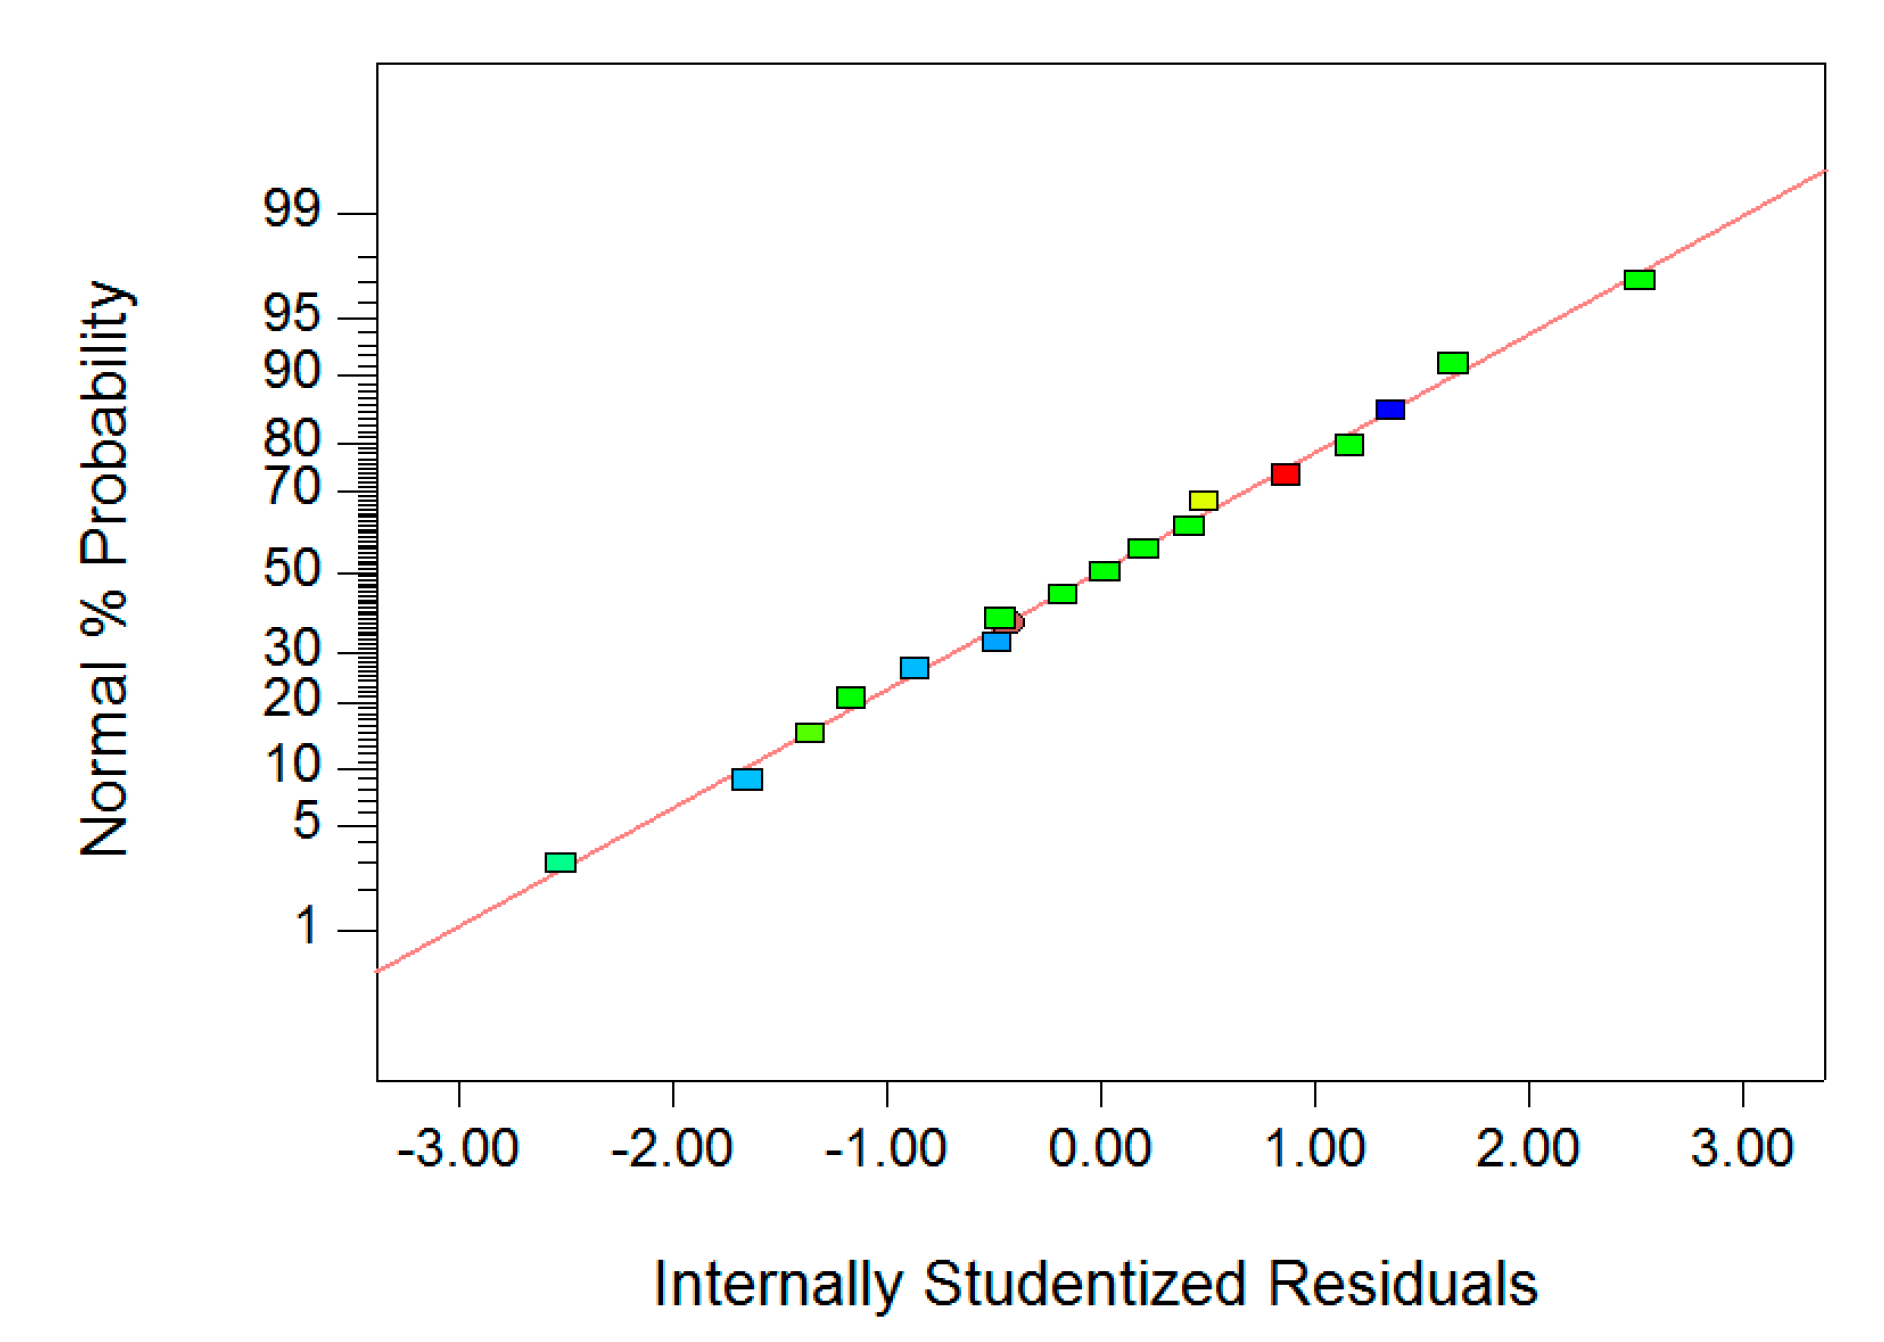
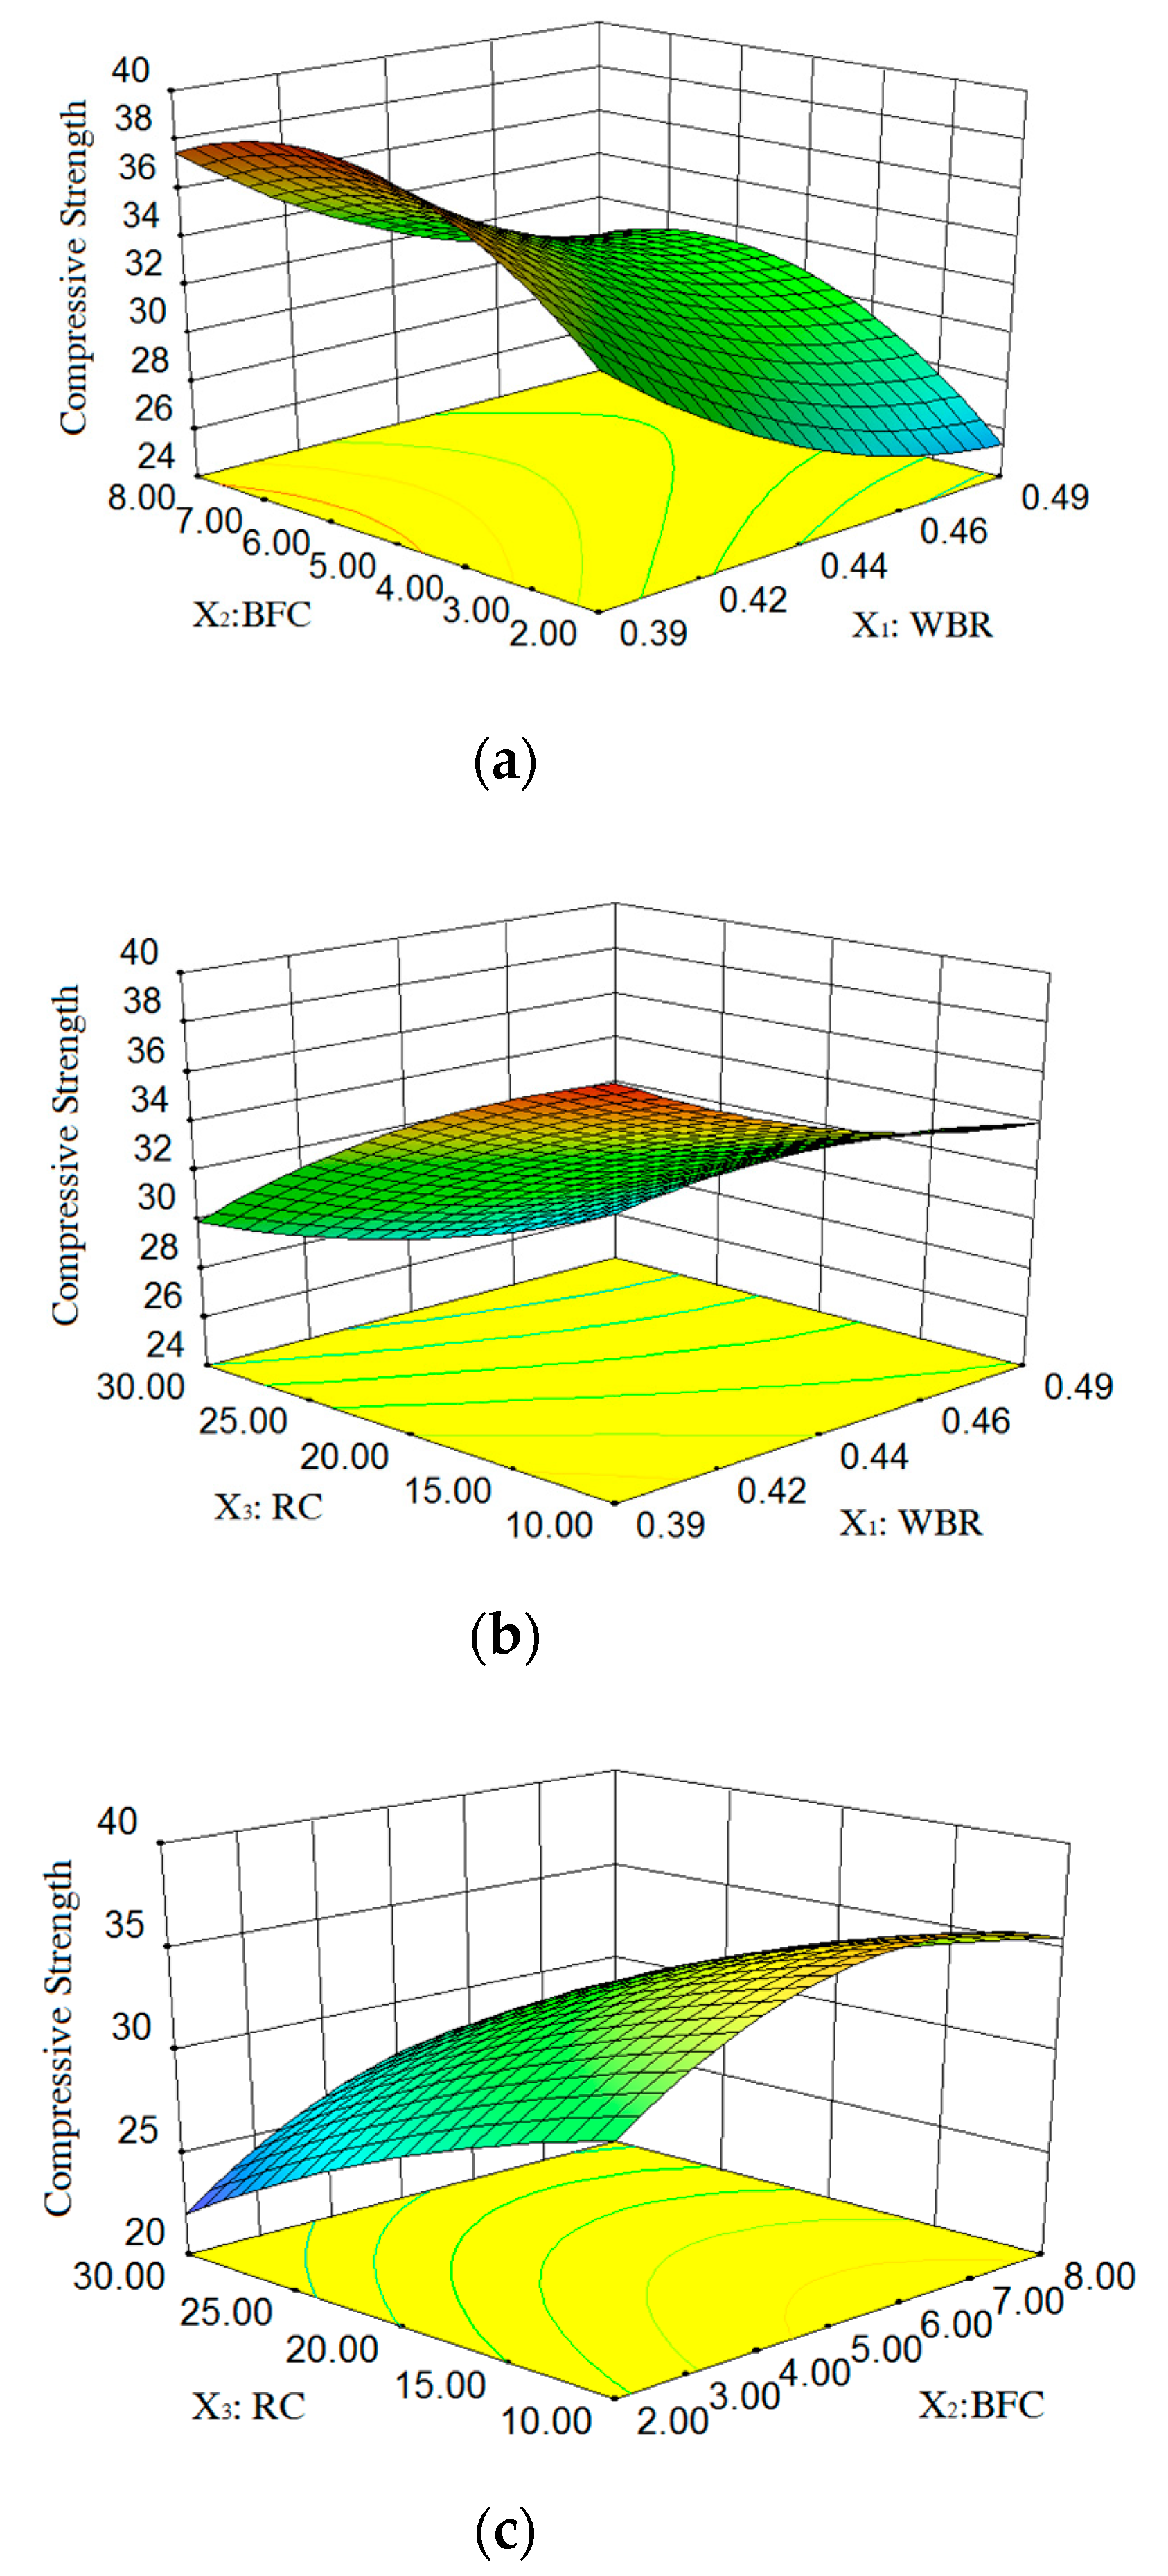
The results of SP (R1) analysis of variance are shown in the first row of Table 7. R-squared and Adj. R-squared are both close to 1, which means that the fitted model is significant. In addition, Adeq. Precision represents the signal-to-noise ratio. When it is greater than 4, it indicates that the model is desirable. It can be seen from Table 7 that the Adeq. Precision of SP is 23.737, indicating that the model is desirable. According to the ANOVA results in Table 8, X1, X2, X3, X1 X2 and (X1)2 are the significant factors of the SP quadratic model.
After excluding insignificant factors, the least squares method is used to fit the SP second-order polynomial equation:
SP = 50.91 + 7.65 X 1 8.73 X 2 9.75 X 3 + 4.23 X 1 X 2 + 10.19 ( X 1 ) 2
The diagnostic results of the statistical model in Figure 1 showed that the data points are approximately a linear set, indicating that the model has high significance. Figure 2 is a three-dimensional response surface diagram of SP, revealing the relationship between WBR, BFC, RC and SP, and the interaction between WBR, BFC, and RC.
As shown in Figure 2, the SP of RBFC increased significantly with the increase of WBR. Because with the increase of WBR, the free water in the mixture increased, which would inevitably lead to the increase of SP [34]. On the other hand, with the increase of RC and BFC, SP significantly decreased. This can be explained by the fact that rubber aggregate is an elastic material. After partially replacing the sand, it would be squeezed and deformed in contact with the aggregate and would not slide easily, which reduced the fluidity of concrete. In addition, after the rubber part replaced the sand, the amount of cement mortar was relatively reduced, resulting in a decrease in the mortar wrapped on the surface of coarse aggregate, which increased the friction between aggregates and reduced the fluidity of mixture. Basalt fiber was uniformly dispersed in the concrete to form a fiber-cement-based three-dimensional network lattice. When the aggregate slid, it must overcome the fiber-cement-based resistance, which reduced the fluidity of concrete. And the more fibers are incorporated, the stronger the hindrance of this network structure, and the more the fluidity decreases. From the comparative analysis in Figure 2 and the results of variance analysis in Table 7, it can be seen that BFC and RC had the most significant effects on the fluidity of RBFC.

3.2.3. CS Analysis

The results of CS (R2) analysis of variance are shown in the second row of Table 7. R-squared and Adj. R-squared are both close to 1, and Adeq. Precision is greater than 4, which indicates that the fitted model is significant. According to the variance results in Table 8, X1, X2, X3, and (X2)2 are the significant factors of the CS quadratic model. After excluding insignificant factors, the least squares method is used to fit the CS second-order polynomial equation:
CS = 33.09 2.98 X 1 + 2.38 X 2 4.31 X 3 3.08 ( X 2 ) 2
The diagnostic data points of the statistical model in Figure 3 are approximately linear sets, indicating that the model has high significance.
Figure 4 is a three-dimensional response surface diagram of CS, revealing the relationship between WBR, BFC, RC and CS, and the interaction between WBR, BFC, and RC.
As shown in Figure 4, the CS of concrete showed a significant decreasing trend with the increase of WBR and RC. When the WBR increased, the water content in the concrete would increase. When the water required for concrete mixing is saturated, the excess water is released from the concrete and adsorbed on the surface of the concrete structure. When the strength of concrete increases, the excess water will be absorbed by the concrete itself or evaporate to the air. Bubbles of water droplets inside the original concrete or adsorbed on the surface of the formwork will naturally form, which would increase the internal porosity of concrete and reduce the CS of RBFC. In addition, the CS of RBFC showed a trend of first increasing and then decreasing with the increase of BFC. When the basalt fiber content was low, the basalt fiber could be evenly distributed in concrete to form a network structure, which can effectively prevent the extension of cracks when the concrete is compressed. However, when the amount of basalt fiber was large, the fiber was not easy to disperse during the mixing process, and agglomeration was prone to occur, which increased the defects in concrete and adversely affected the compressive strength of concrete. From the comparative analysis in Figure 4 and the results of variance analysis in Table 7, it can be seen that RC had the most significant effects on the CS of RBFC.

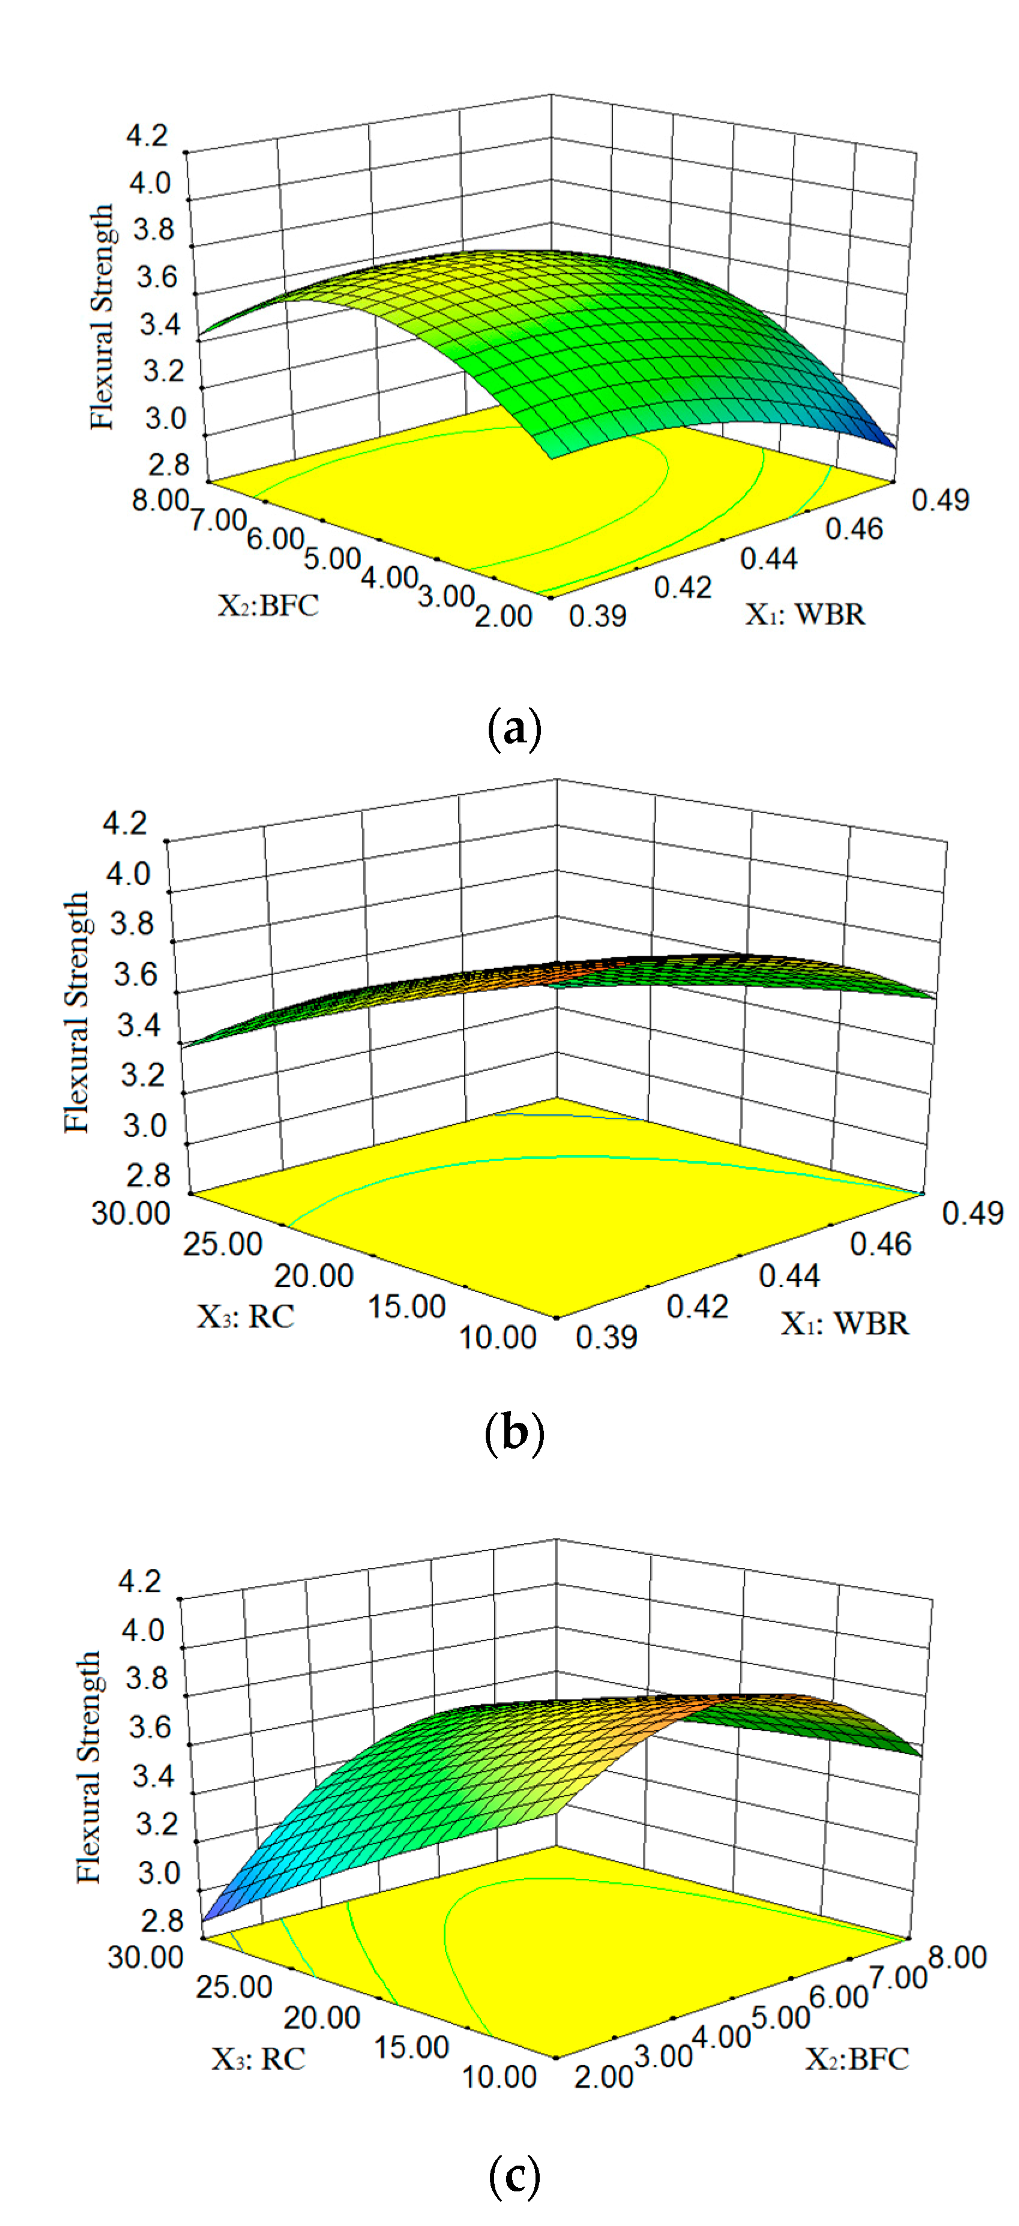
3.2.4. Flexural Strength Analysis (FS)

The results of FS (R3) analysis of variance are shown in the third row of Table 7. R-squared and Adj. R-squared are both close to 1, and Adeq. Precision is greater than 4, which indicates that the fitted model is significant. According to the variance results in Table 8, X2, X3, X2 × 3, (X1)2 and (X2)2 are the significant factors of the FS quadratic model. According to the least square method, the regression coefficients of each factor were determined, and a reasonable second-order FS polynomial equation was established according to actual factors:
FS = 3.75 0.058 X 1 + 0.12 X 2 0.22 X 3 + 0.18 X 2 X 3 0.23 ( X 1 ) 2 0.33 ( X 2 ) 2
The diagnostic data points of the statistical model in Figure 5 are approximately linear sets, indicating that the model has high significance.
Figure 6 is a three-dimensional response surface diagram of FS, revealing the relationship between WBR, BFC, RC and FS, and the interaction between WBR, BFC, and RC. As shown in Figure 6, when WBR and RC increased, the change trend of FS of RBFC was similar to that of CS. This is because the influence mechanism of WBR and RS on FS is similar to that on CS. On the other hand, with the increase of BFC, the FS also showed an obvious trend of first increasing and then decreasing. When the BFC was small, the basalt fiber had to be pulled out of concrete matrix during concrete crack propagation stage and the fiber was even broken. This process required a lot of energy absorption, which slowed down the crack propagation process, thereby increasing the flexural strength of concrete. However, when the BFC was large, basalt fibers tended to agglomerate in concrete, which increased the internal defects of concrete and adversely affected the flexural strength of concrete. From the comparative analysis in Figure 6 and the results of variance analysis in Table 7, it can be seen that BFC has the most significant effects on the FS of RBFC.

3.3. Optimization and Verification

As mentioned above, WBR, BFC and RC have different effects on working performance and mechanical properties of concrete. Based on the response surface model, multi-objective optimization design is carried out to determine the best combination of WBR, BFC and RC. Based on the previous research [26,27], the fluidity of concrete had a significant impact on its construction and workability, and higher fluidity could play a good role in promoting the construction of physical projects. However, when designing the concrete mix ratio, the mechanical properties of concrete should be considered comprehensively on the basis of ensuring good fluidity. Therefore, the target values of the response values in this study were all taken to the maximum value. Then, based on RSM, the optimal combination of WBR, BFC and RC was obtained through Design-Expert 8.0 software. The best combination of WBR, BFC and RC and the model verification results are shown in Table 9.
As shown in Table 9, the optimal design combination was selected as follows: WBR was 0.39, BFC was 4.56 kg/m3, and RC was 10%. Three specimens of 100 mm × 100 mm × 100 mm and three specimens of 100 mm × 100 mm × 400 mm were fabricated and tested for CS and FS, respectively. Three SP tests were performed immediately after concrete mixture was mixed. The results are shown in Table 9. The relative error is less than 5%, indicating that the accuracy of the prediction results meets the requirements. This shows that RSM can be used to design and optimize the preparation parameters of RBFC.

4. Conclusions

This study optimized the mix ratio of RBFC based on the RSM. The influence of the preparation parameters on the working performance and mechanical properties of concrete was discussed and analyzed. The following conclusions can be drawn:
  • Based on RSM, an optimum RBFC design is proposed: water-binder ratio is 0.39, basalt fiber content is 4.56 kg/m3, and rubber content is 10%. Compared with the test results, it possesses favorable and reliable accuracy.
  • The incorporation of rubber aggregate has a significant impact on the compressive strength of concrete. The rubber aggregate partly replaces the fine aggregate, and the effective compressive strength of the rubber aggregate is much lower than that of fine aggregate, which leads to a decrease in the strength of concrete.
  • The content of basalt fiber has a significant effect on the slump and flexural strength of concrete. When the fiber content is small, it can slow down the growth of concrete cracks. Excessive fibers will cause the fibers to form agglomerates, which is disadvantageous in the bending strength.
  • Rubber aggregate and basalt fiber have been proved to help modify concrete. Waste rubber materials can be recycled to reduce environmental pollution. On the other hand, it can also improve the performance of concrete. In the long run, RBFC will produce good economic benefits.

Author Contributions

Conceptualization, G.T.; formal analysis, Y.G., G.T., and J.S.; investigation, Y.G.; data curation, G.T. and J.S.; writing—original draft preparation, J.S. and S.L.; writing—review and editing, Y.G. and S.L.; project administration, Y.G. and Y.H.; funding acquisition, Y.G., J.Y. and S.L. All authors have read and agreed to the published version of the manuscript.

Funding

This research was funded by the Transportation Technology Program of Jilin Province of China (Grant No. 2018-1-9), the Education Department’s “13th Five-Year” Science and Technology Program of Jilin Province (Grant No. JJKH20190015KJ), the Special Funding for Basic Scientific Research Operation Fees of Central Universities, Supported by Graduate Innovation Fund of Jilin University and the Scientific and Technological Developing Scheme Program of Jilin Province (Grant No. 20200403157SF).

Acknowledgments

We would like to acknowledge the following people from Jilin University. Thank you to Wensheng Wang, Bo Wang, Yulin Ma, Shuzheng Wu and Yunze Pang for technical support in the testing procedure and data processing.

Conflicts of Interest

The authors declare that there is no conflict of interest regarding the publication of this paper.

References

  1. Deng, Z.C.; Liu, X.C. Analysis and prospect of the research status of road rubber concrete. Traffic Eng. Technol. Natl. Def. 2010, 8, 1–5. [Google Scholar]
  2. Gheni, A.A.; Abdelkarim, O.I.; Abdulazeez, M.M.; EIGawady, M.A. Texture and design of green chip seal using recycled crumb rubber aggregate. J. Clean. Prod. 2017, 166, 1084–1101. [Google Scholar] [CrossRef]
  3. Zhang, Z.; Lian, Y.X. Discussion on the current situation and development trend of waste rubber utilization in my country. Sci. Technol. Wind 2015, 5, 101. [Google Scholar]
  4. Song, S.M.; Liu, J.H. Research on high toughness concrete modified by rubber powder. Concr. Cem. Prod. 1997, 1, 10–11,53. [Google Scholar]
  5. Son, K.S.; Hajirasouliha, I.; Pilakoutas, K. Strength and deformability of waste tyre rubber-filled reinforced concrete columns. Constr. Build. Mater. 2011, 25, 218–226. [Google Scholar] [CrossRef]
  6. Youssf, O.; Elgawady, M.A.; Mills, J.E. Experimental Investigation of Crumb Rubber Concrete Columns under Seismic Loading. Structures 2015, 3, 13–27. [Google Scholar] [CrossRef]
  7. Pham, N.P.; Toumi, A.; Turatsinze, A. Effect of an enhanced rubber-cement matrix interface on freeze-thaw resistance of the cement-based composite. Constr. Build. Mater. 2019, 207, 528–534. [Google Scholar] [CrossRef]
  8. Wang, T.; Hong, J.X.; Miao, C.W.; Liu, J.P. Experimental research on rubber concrete. Concrete 2009, 1, 67–69. [Google Scholar]
  9. Savas, B.Z.; Ahmad, S.; Fedroff, D. Freeze-thaw durability of concrete with ground waste tire rubber. Transp. Res. Rec. 1997, 1574, 80–88. [Google Scholar] [CrossRef]
  10. Han, Y.; Bai, Y.Q.; Ba, S.T. Research progress and application of rubber aggregate modified concrete. Concrete 2013, 10, 87–90. [Google Scholar]
  11. Ghaly, A.M.; Iv, J.D.C. Correlation of strength, rubber content, and water to cement ratio in rubberized concrete. Rev. Can. Génie Civ. 2005, 32, 1075–1081. [Google Scholar] [CrossRef]
  12. Marques, A.C.; Nirschl, G.C.; Akasaki, J.L. Mechanical properties of tire rubber concrete. Holos Environ. 2006, 1, 31–41. [Google Scholar] [CrossRef]
  13. Li, Y.; Li, Y.Q. Experimental study on performance of rubber particle and steel fiber composite toughening concrete. Constr. Build. Mater. 2017, 146, 267–275. [Google Scholar] [CrossRef]
  14. Niu, D.; Su, L.; Luo, Y.; Hang, D.G.; Luo, D.M. Experimental study on mechanical properties and durability of basalt fiber reinforced coral aggregate concrete. Constr. Build. Mater. 2020, 237, 117628. [Google Scholar] [CrossRef]
  15. Al-Masoodi, A.H.H.; Kawan, A.; Kasmuri, M.; Hamid, R.; Khan, M.N.N. Static and dynamic properties of concrete with different types and shapes of fibrous reinforcement. Constr. Build. Mater. 2016, 104, 247–262. [Google Scholar] [CrossRef]
  16. Algin, Z.; Ozen, M. The properties of chopped basalt fibre reinforced self-compacting concrete. Constr. Build. Mater. 2018, 186, 678–685. [Google Scholar] [CrossRef]
  17. Liu, P.S.; Wei, S.H.; Li, B.Q. Experimental study on the mechanical properties of basalt fiber concrete. Hebei Ind. Sci. Technol. 2016, 33, 126–131. [Google Scholar]
  18. Katkhuda, H.; Shatarat, N. Improving the mechanical properties of recycled concrete aggregate using chopped basalt fibers and acid treatment. Constr. Build. Mater. 2017, 140, 328–335. [Google Scholar] [CrossRef]
  19. Jalasutram, S.; Sahoo, D.R.; Matsagar, V. Experimental investigation of the mechanical properties of basalt fiber-reinforced concrete. Struct. Concr. 2017, 18, 292–302. [Google Scholar] [CrossRef]
  20. Peng, M.; Huang, H.X.; Liao, Q.H.; Wang, J.C. Experimental study on the basic mechanical properties of basalt fiber concrete. Concrete 2012, 01, 79–80. [Google Scholar]
  21. Wang, W.; Cheng, Y.; Tan, G. Design Optimization of SBS-Modified Asphalt Mixture Reinforced with Eco-Friendly Basalt Fiber Based on Response Surface Methodology. Materials 2018, 11, 1311. [Google Scholar] [CrossRef] [PubMed] [Green Version]
  22. Cho, T. Prediction of cyclic freeze–thaw damage in concrete structures based on response surface method. Constr. Build. Mater. 2007, 21, 2031–2040. [Google Scholar] [CrossRef]
  23. Omid, R.; Mohsen, H.; Majid, G. Concrete made with hybrid blends of crumb rubber and metakaolin: Optimization using Response Surface Method. Constr. Build. Mater. 2016, 123, 59–68. [Google Scholar]
  24. Gueneyisi, E.; Gesoglu, M.; Algin, Z.; Mermerdas, K. Optimization of concrete mixture with hybrid blends of metakaolin and fly ash using response surface method. Compos. Part B Eng. 2014, 60, 707–715. [Google Scholar] [CrossRef]
  25. Nematzadeh, M.; Fallah-Valukolaee, S. Effectiveness of fibers and binders in high-strength concrete under chemical corrosion. Struct. Eng. Mech. 2017, 64, 243–257. [Google Scholar]
  26. Liu, H.B.; Liu, S.Q.; Wang, S.R.; Gao, X.; Gong, Y.F. Effect of Mix Proportion Parameters on Behaviors of Basalt Fiber RPC Based on Box-Behnken Model. Appl. Sci. 2019, 9, 2031. [Google Scholar] [CrossRef] [Green Version]
  27. Lu, S.Q. Research on Mechanical Properties and Compressive Damage Characteristics of Basalt Fiber Reactive Powder Concrete. Master’s Thesis, Jilin University, Changchun, China, 2020. [Google Scholar]
  28. Bayramov, F.; Taşdemir, C.; Taşdemir, M.A. Optimisation of steel fibre reinforced concretes by means of statistical response surface method. Cem. Concr. Compos. 2004, 26, 665–675. [Google Scholar] [CrossRef]
  29. Sundari, S.; Sukumar, S. Prediction model for optimized self-compacting concrete with fly ash using response surface method based on fuzzy classification. Neural Comput. Appl. 2019, 31, 1365–1373. [Google Scholar]
  30. Alyamac, K.E.; Ghafari, E.; Ince, R. Development of eco-efficient self-compacting concrete with waste marble powder using the response surface method. J. Clean. Prod. 2016, 144, 192–202. [Google Scholar] [CrossRef]
  31. Wang, X.; Yu, R.; Shui, Z.; Song, Q.; Zhang, Z. Mix design and characteristics evaluation of an eco-friendly Ultra-High Performance Concrete incorporating recycled coral based materials. J. Clean. Prod. 2017, 165, 70–80. [Google Scholar] [CrossRef]
  32. Chen, F.; Chen, X. Research on Orthogonal Test of Basalt Fiber Concrete. J. Fuzhou Univ. Nat. Sci. Ed. 2014, 1, 133–137. [Google Scholar]
  33. Liu, H.; Li, W.; Luo, G.; Liu, S.; Lyu, X. Mechanical Properties and Fracture Behavior of Crumb Rubber Basalt Fiber Concrete Based on Acoustic Emission Technology. Sensors 2020, 20, 3513. [Google Scholar] [CrossRef] [PubMed]
  34. Lu, X.H. Study on the Mechanics and Durability of Rubber Particles/Basalt Fiber Modified Concrete. Master’s Thesis, Jilin University, Changchun, China, 2018. [Google Scholar]
  35. GB/T 50080-2016. Standard for Test Method of Performance of Ordinary Concrete Mixture; State Administration for Market Regulation: Beijing, China, 2016. (In Chinese) [Google Scholar]
  36. GB/T 50081-2002. Standard for Test Methods of Ordinary Concrete Mechanical Properties; Ministry of Construction: Beijing, China, 2002. (In Chinese) [Google Scholar]
  37. Omranian, S.R.; Hamzah, M.O.; Valentin, J.; Hasan, M.R.M. Determination of optimal mix from the standpoint of short term aging based on asphalt mixture fracture properties using response surface method. Constr. Build. Mater. 2018, 179, 35–48. [Google Scholar] [CrossRef]
  38. Al-Amoudi, R.H.; Taylan, O.; Kutlu, G.; Can, A.M.; Sagdic, O.; Dertli, E.; Yimaz, M.T. Characterization of chemical, molecular, thermal and rheological properties of medlar pectin extracted at optimum conditions as determined by Box-Behnken and ANFIS models. Food Chem. 2019, 271, 650–662. [Google Scholar] [CrossRef] [PubMed]
  39. Wu, Z.; Yuan, H.; Lu, Z.; Fan, X. Experimental study on the mechanical properties of basalt fiber concrete. Concrete 2009, 9, 67–68. [Google Scholar]
  40. Kabay, N. Abrasion resistance and fracture energy of concretes with basalt fiber. Constr. Build. Mater. 2014, 50, 95–101. [Google Scholar] [CrossRef]
  41. Arslan, M.E. Effects of basalt and glass chopped fibers addition on fracture energy and mechanical properties of ordinary concrete: CMOD measurement. Constr. Build. Mater. 2016, 114, 383–391. [Google Scholar] [CrossRef]
Figure 1. Normal plot of residuals for SP.
Applsci 10 06753 g001
Figure 2. 3D response surface plot between SP and factors: (a) Factors: BFC and WBR at RC = 20%; (b) Factors: RC and WBR at BFC = 5 kg/m3; (c) Factors: RC and BFC at WBR = 0.44.
Applsci 10 06753 g002aApplsci 10 06753 g002b
Figure 3. Normal plot of residuals for CS.
Applsci 10 06753 g003
Figure 4. 3D response surface plot between CS and factors: (a) Factors: BFC and WBR at RC = 20%; (b) Factors: RC and WBR at BFC = 5 kg/m3; (c) Factors: RC and BFC at WBR = 0.44.
Applsci 10 06753 g004
Figure 5. Normal plot of residuals for FS.
Applsci 10 06753 g005
Figure 6. 3D response surface plot between FS and factors: (a) Factors: BFC and WBR at RC = 20%; (b) Factors: RC and WBR at BFC = 5 kg/m3; (c) Factors: RC and BFC at WBR = 0.44.
Applsci 10 06753 g006
Table 1. Portland cement chemical composition table.
MaterialChemical Composition (%)
SiO2Al2O3Fe2O3CaOMgOSO3
Cement22.65.64.362.71.72.5
Table 2. Technical Index of Rubber Aggregate.
Technical
Index
Particle
Size
MoistureAshAcetone
Extract
Fiber
Content
Metal
Content
UnitMesh%%%%%
Index
Value
201.01.0150.50.08
Table 3. Basalt fiber technical indicators.
Technical
Index
LengthDiameterLinear
Density
Tensile StrengthElongation at BreakElastic Modulus
UnitmmµmTexMPa%GPa
Index
Value
1823239823202.142
Table 4. The mix proportion of RBFC.
No.Water
(kg/m3)
Cement
(kg/m3)
Fine Aggregate
(kg/m3)
Coarse Aggregate
(kg/m3)
Basalt Fiber
(kg/m3)
Crumb Rubber
(kg/m3)
Superplasticizer
(kg/m3)
1185420.45561.061190.71225.418.41
2185420.45535.661190.71550.818.41
3185474.36520.971158.53249.659.49
4185377.55547.351216.32251.747.55
5185420.45561.061190.71825.418.41
6185420.45535.661190.71550.818.41
7185474.36545.791158.53524.829.49
8185420.45535.661190.71550.818.41
9185474.36496.151158.53574.479.49
10185420.45535.661190.71550.818.41
11185474.36520.971158.53849.659.49
12185420.45510.251190.71876.228.41
13185420.45510.251190.71276.228.41
14185377.55547.351216.32851.747.55
15185420.45535.661190.71550.818.41
16185377.55573.211216.32525.877.55
17185377.55521.481216.32577.617.55
Table 5. Experimental design for BBD.
FactorsUnitsLevels: Actual (Coded)
Low (−1)Medium (0)High (+1)
X1WBR-0.390.440.49
X2BFCkg/m3258
X3RC%102030
Table 6. Experimental design for BBD.
No.Preparation ParametersResponses
WBR
X1
BFC
X2 (kg/m3)
RC
X3 (%)
SP
Y1 (mm)
CS
Y2 (MPa)
FS
Y3 (MPa)
10.442107031.733.6
20.445205132.433.7
30.392206328.613.3
40.492207425.113.0
50.448106133.853.5
60.445205332.913.7
70.395105839.914.1
80.445205032.193.8
90.395303930.883.4
100.445204932.653.7
110.398203935.123.2
120.448303625.633.5
130.442305422.312.9
140.498206332.233.4
150.445205531.833.8
160.495107833.333.6
170.495306025.533.2
Table 7. Model analysis of variance results.
ResponsesStandard DeviationR-SquaredAdj. R-SquaredAdeq. PrecisionF-Valuep-ValueSignificant
R1SP2.320.98320.961723.73745.62<0.0001Yes
R2CS1.320.95630.900017.15917.010.0006Yes
R3FS0.100.94610.918017.39720.900.0003Yes
Table 8. Response variable analysis of variance results.
ResponsesFactorsSum of
Squares
Degree of FreedomMean
Square
F-Valuep-ValueSignificant
SPWBR171.301171.3031.800.0008Yes
BFC516.101516.1095.82<0.0001Yes
RC654.441654.44121.51<0.0001Yes
WBR × BFC42.25142.257.840.0265Yes
WBR × RC0.2510.250.0460.8356No
BFC × RC20.25120.253.750.0937No
(WBR)2142.861142.8626.520.0013Yes
(BFC)222.76122.764.220.0789No
(RC)27.3917.391.370.2797No
CSWBR38.84138.8420.920.0026Yes
BFC37.05137.0519.960.0029Yes
RC131.311131.3170.73<0.0001Yes
WBR × BFC0.0910.090.0500.8293No
WBR × RC0.3710.370.200.6654No
BFC × RC0.3610.360.190.6730No
(WBR)23.7913.792.040.1960No
(BFC)240.03140.0321.560.0024Yes
(RC)23.7013.701.990.2004No
FSWBR0.009810.00981.320.2877No
BFC0.07110.0719.580.0174Yes
RC0.4110.4155.900.0001Yes
WBR × BFC0.0210.023.020.1253No
WBR × RC0.0210.023.020.1253No
BFC × CRC0.1210.1216.490.0048Yes
(WBR)20.07310.0739.950.0161Yes
(BFC)20.4610.4662.66<0.0001Yes
(RC)20.00410.0040.590.4644No
Table 9. Optimal preparation parameters and prediction vs. experimental.
ResponsesWBRBFC
(kg/m3)
RC
(%)
SP
(mm)
CS
(MPa)
FS
(MPa)
Prediction0.394.56106439.963.8
Experimental10.394.56106738.273.9
20.394.56106839.983.8
30.394.56106538.113.8
Mean0.394.561066.6738.783.83
Relative Error (%)4.17−2.950.79

